Global Bay Leaf Market, By Product Type (Organic Bay Leaves, Conventional Bay Leaves), By Form (Dried Bay Leaves, Fresh Bay Leaves), Application (Culinary, Medicinal & Herbal Remedies, Aromatherapy), By Distribution Channel (Supermarkets And Hypermarkets, Online Retail, Specialty Stores & Health Food Stores), and By Region & Countries - Industry Segment Outlook, Market Assessment, Competitive Scenario, Trends, And Forecast 2023-2032
-
10211
-
May 2023
-
162
-


-
This report was compiled by Shreyas Rokade Shreyas Rokade is a seasoned Research Analyst with CMFE, bringing extensive expertise in market research and consulting, with a strong background in Chemical Engineering. Correspondence Team Lead-CMFE Linkedin | Detailed Market research Methodology Our methodology involves a mix of primary research, including interviews with leading mental health experts, and secondary research from reputable medical journals and databases. View Detailed Methodology Page
-
Quick Navigation
Report Overview
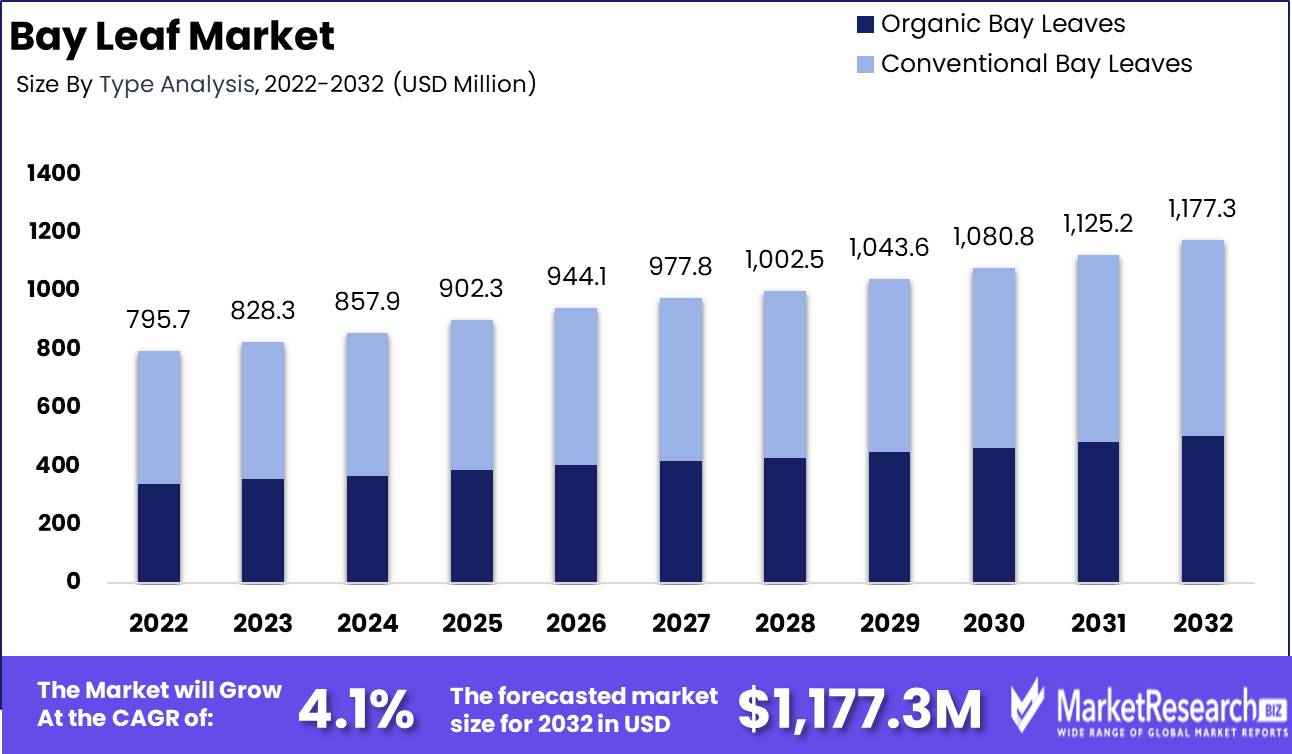
Bay Leaf Market size is expected to be worth around USD 1,177.3 Mn by 2032 from USD 795.7 Mn in 2022, growing at a CAGR of 4.1% during the forecast period from 2023 to 2032.
The bay leaf market presents a promising opportunity that remains largely untapped by the majority of consumers. Derived from the bay laurel tree, sweet bay, laurel, and bay leaves are well-known for their exceptional flavor and aroma. These leaves have a rich history in culinary applications, spanning centuries, but their versatility extends beyond the kitchen. They find use in traditional medicine, aromatherapy, and even as a natural insect repellent.
The primary goal of the bay leaf market is to make these botanical treasures widely accessible, aiming to facilitate global access to premium bay leaves. Bay leaves, with their distinctive flavor and aroma, undoubtedly enhance the taste of various dishes. Furthermore, they offer a wealth of vitamins and minerals, making them a valuable and nutritious addition to diets.
Recent years have witnessed significant innovations in the bay leaf market. One noteworthy advancement involves utilizing bay leaves in the production of essential oils, harnessing their therapeutic properties for aromatic purposes. Additionally, improvements in processing and preservation techniques have been implemented to ensure that bay leaves maintain their superior quality and utmost freshness during their global distribution.
Recognizing the market's potential, savvy investors have injected substantial capital into the bay leaf industry. The utilization of bay leaves in various applications, such as spice blends, tea infusions, and cosmetic formulations, has led to intriguing developments in recent times. Increasing awareness of the health benefits associated with bay leaves plays a crucial role in driving the market's rapid growth.
Driving Factors
Enhancing Flavor and Catering to Culinary Enthusiasts
Both professional chefs and home cooks are captivated by the Bay Leaves remarkable increase in demand, which is being propelled by its capacity to enhance food flavor. Its popularity among connoisseurs of fine cuisine is enhanced by the exotic allure of its diverse culinary traditions.
Medicinal Value and Aromatherapy
The Bay Leaf market has seen a significant increase in demand for this adaptable herb. And extraction of essential oils for aromatherapy has bolstered the market and attracted consumers seeking therapeutic benefits.
Health Consciousness and Preference for Natural Ingredients
Health consciousness and a predilection for natural and organic ingredients are projected to have a positive impact on the Bay Leaf market. As consumers become more health conscious and aware of the benefits of traditional botanicals, Bay Leaf's demand is anticipated to increase in the near future.
Restraining Factors
Limited availability of quality bay leaves
The limited availability of high-quality bay leaves is one of the major issues facing the bay leaf market. A limited number of farmers have mastered the art of cultivating these high-quality leaves in Turkey, where the majority of bay leaves are grown. A significant proportion of bay leaves produced globally are of poor quality, with inferior aroma and flavor. This dearth of quality makes it difficult for consumers to differentiate between the good and the bad, resulting in a decline in overall demand.
Strong competition from alternative spices
It is not only bay leaves that can impart flavor and aroma to cuisine. Other herbs and seasonings, such as rosemary, thyme, and oregano, can produce a comparable effect. The growing demand for these alternative seasonings poses a significant threat to the bay leaf market.
Seasonal fluctuations in bay leaf supply
The bay leaf market is also subject to seasonal fluctuations, as the availability of high-quality bay leaves varies with the seasons. This is due to the dormant development pattern of the bay leaf plant during the winter months. This supply variation can result in unstable prices and inconsistent product quality.
High transportation and storage costs
Transporting and storing bay leaves can be expensive, especially for small farmers and enterprises. Keeping the aroma and flavor of Bay Leaf requires a particular storage environment, which can increase storage costs. Moreover, the transportation of bay leaves necessitates precise temperature and humidity control, which can be difficult for small enterprises.
Product Type Analysis
The bay leaf market, an industry ripe for exploration, remains largely untapped by many individuals. Sweet bay, laurel, or bay leaves, extracted from the bay laurel tree, are aromatic wonders renowned for their exceptional flavor and fragrance. While their culinary applications have been cherished for centuries, their utility surpasses the confines of the kitchen. These versatile leaves find purpose in traditional medicine, aromatherapy, and even as an organic insect repellent.
Recent years have witnessed the bay leaf market propelled by groundbreaking innovations. One such breakthrough revolves around utilizing bay leaves in the realm of essential oils, harnessing their therapeutic value for aromatic purposes. Additionally, advancements in processing and preservation techniques have emerged, guaranteeing that the leaves retain their impeccable quality and utmost freshness throughout their global journeys.
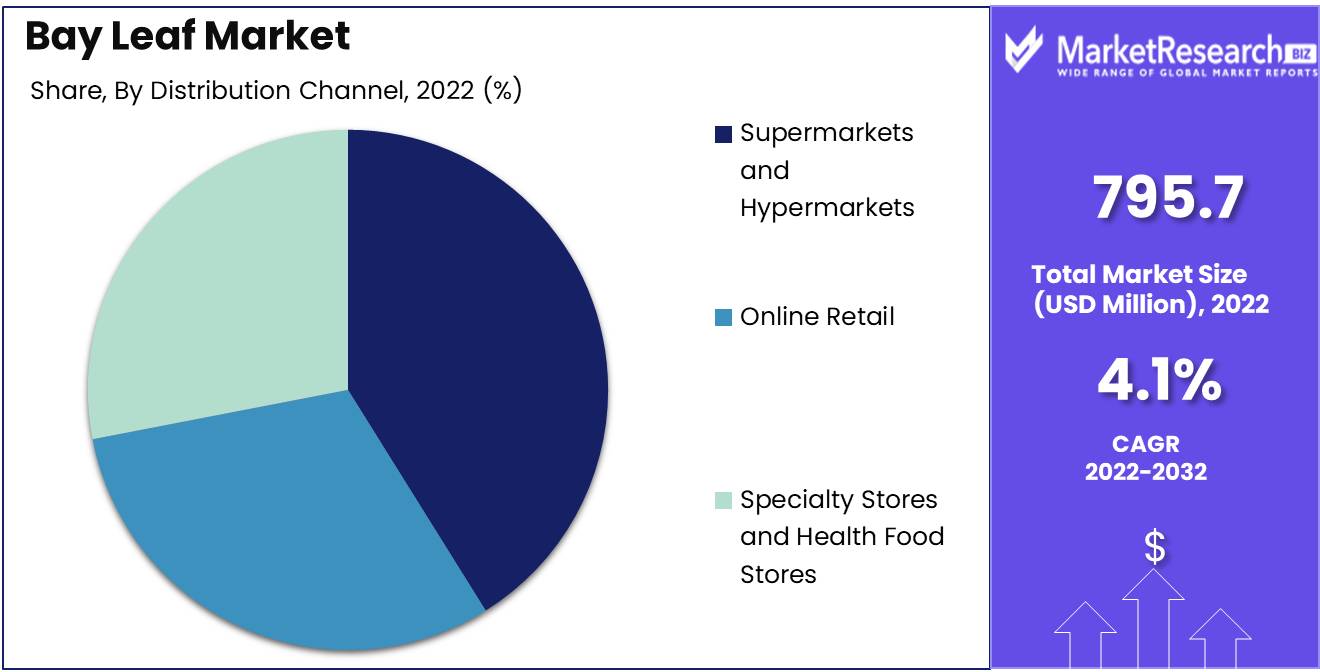
Distribution Channel Analysis
Supermarkets and hypermarkets play a dominant role in the bay leaf market. Supermarkets and hypermarkets offer a wide range of bay leaf products, including different forms (dried or fresh) and product types (organic or conventional). They provide a comprehensive selection of bay leaf brands and varieties, catering to diverse consumer preferences. Shoppers can conveniently find bay leaves alongside other culinary ingredients in the dedicated spice aisle.
Supermarkets and hypermarkets are easily accessible to consumers, often located in central areas or residential neighborhoods. They offer extended operating hours, allowing shoppers to purchase bay leaves at their convenience. With a one-stop shopping experience, consumers can find bay leaves along with other grocery items, enhancing convenience and saving time.
Supermarkets and hypermarkets offer a platform for both established and emerging bay leaf brands to gain visibility. These retail outlets often allocate shelf space for bay leaf products, ensuring their presence is easily noticed by consumers. Brands can run promotional activities such as discounts, bundle offers, or product displays to attract shoppers and increase sales.
Supermarkets and hypermarkets have established a sense of trust and assurance among consumers. Shoppers rely on these retailers to provide high-quality products from trusted sources. Bay leaf brands sold in supermarkets and hypermarkets are expected to meet regulatory standards, ensuring product quality and safety. This trust factor influences consumer purchase decisions and contributes to the dominance of these retail channels.
Key Market Segments
Product Type Analysis
- Organic Bay Leaves
- Conventional Bay Leaves
Form Analysis
- Dried Bay Leaves
- Fresh Bay Leaves
Application Analysis
- Culinary
- Medicinal and Herbal Remedies
- Aromatherapy
Distribution Channel Analysis
- Supermarkets and Hypermarkets
- Online Retail
- Specialty Stores and Health Food Stores
Growth Opportunity
Expanding Product Line with New Spices and Blends
Expanding product lines with new spices and blends is one method to increase the growth potential of the bay leaf market. Adding other spices to the bay leaf product line, such as oregano, thyme, and rosemary, can attract consumers who prefer a variety of spices in their meals. This expansion can also increase customer loyalty, as businesses will be able to offer a greater variety of options to accommodate individual preferences.
Increasing Distribution Channels Through Partnerships
Collaboration with distributors and wholesalers can expand the availability of bay leaf products to non-local consumers. Partnerships that expand distribution channels allow businesses to offer their products to a larger audience. The proper alliances can facilitate the penetration of new markets, making bay leaf products readily available.
Developing Online Store and E-Commerce Capabilities
Businesses can reach a broader consumer base by establishing an online store and utilizing e-commerce capabilities. Convenience is of paramount importance, and having an online store can attract more customers who prefer to purchase online. Customers will then be able to purchase bay leaf market products from anywhere in the world, increasing the products' global visibility and growth potential.
Utilizing social media for targeted marketing campaigns
Platforms for social media are a potent instrument for targeted marketing campaigns. Businesses can optimize the reach of their bay leaf products by identifying their target market and developing targeted marketing campaigns. Posting high-quality content and interacting with consumers can increase brand recognition and sales.
Latest Trends
The Eco-Friendly Organic Bay Leaf is a Reliable Source of Information for Your Business
Bay Leaf Market has benefited tremendously from the significant shift towards eco-friendly products. Consumers are becoming increasingly conscious of the impact of their purchasing decisions on the environment and are seeking sustainable products with a small carbon footprint. Bay Leaf manufacturers have swiftly responded to this trend by introducing Organic Bay Leaf options.
Health Benefits of Bay Leaf Supplements Influence the Market for Bay Leaf
Bay Leaf has numerous health benefits, which has been a major growth catalyst for the Bay Leaf Market. As a natural anti-inflammatory, Bay Leaf is optimal for individuals with inflammatory conditions such as arthritis. Additionally, Bay Leaf has a calming effect on the digestive system, making it optimal for individuals with digestive problems. Additionally, it has been discovered that Bay Leaf can aid in weight loss and blood sugar regulation.
Expanding International Markets Bay Leaf Market Expands Globally
Historically, the Bay Leaf Market has been a regional market, but in recent years it has expanded internationally. The unique flavor and health benefits of Bay Leaf have been discovered by international consumers, resulting in a growing demand for Bay Leaf products in international markets.
Unique Flavor Bay Leaf Market Attracts Gourmet Cooks and Foodies Shaping Bay Leaf Market
Bay Leaf's distinctive flavor has made it a favorite among gourmet chefs and connoisseurs. Bay Leaf is a versatile ingredient that can be used in a variety of dishes, and its distinct flavor can add dimension and complexity to any dish. The Bay Leaf Market has been affected by the rising popularity of cooking programs and food bloggers, as well as the trend toward gourmet cuisine.
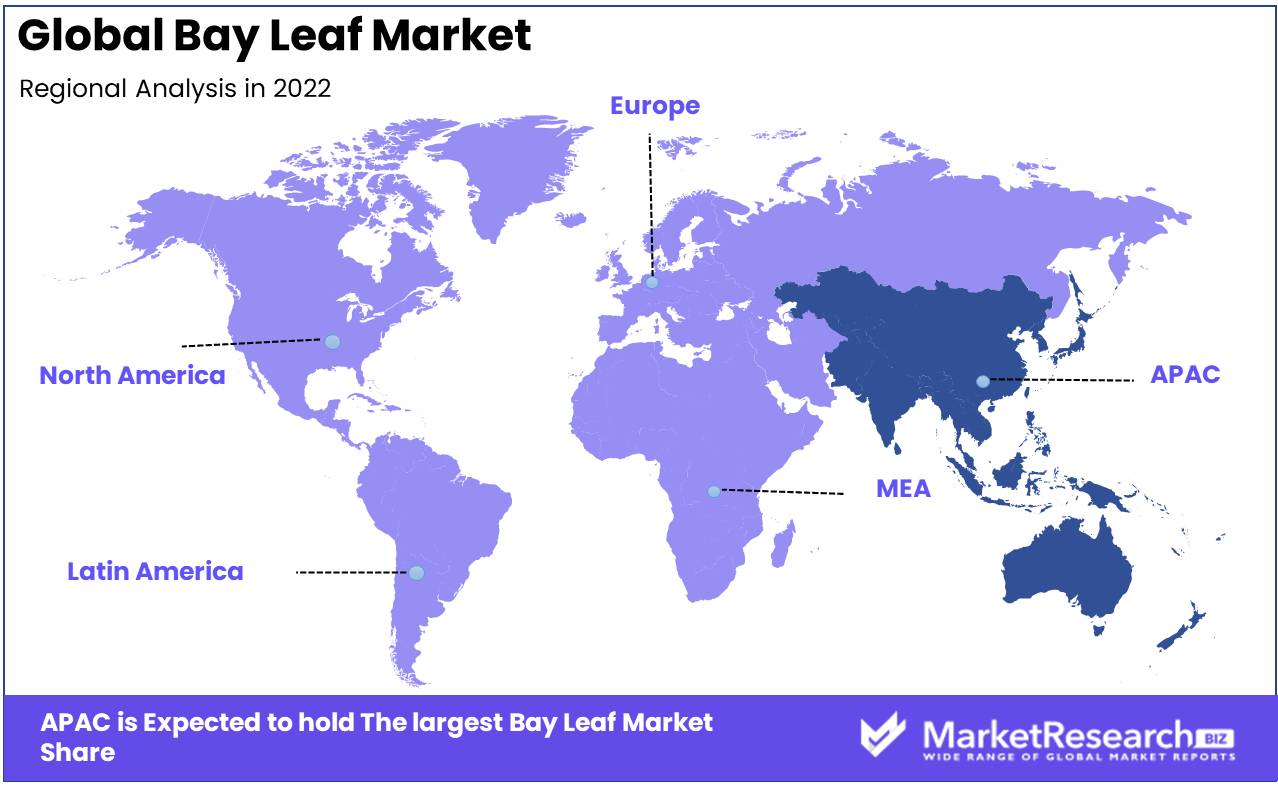
Regional Analysis
The Asia-Pacific Bay Leaf market is attracting the interest of nations from around the world. The bay leaf plant is native to the Mediterranean region and can be found in Turkey, Greece, and Italy, among others. Due to its medicinal and culinary properties, this aromatic herb has been utilized since antiquity. In recent years, the Asia-Pacific region has seen an increase in demand for bay leaves, and it is expected to contribute the greatest revenue share.
One reason for bay leaves' popularity in the Asia-Pacific region is the region's emphasis on traditional medicine, which utilizes natural herbs to treat ailments. Traditional Chinese medicine has used bay leaves for centuries to treat digestive disorders and strengthen the immune system. The antifungal, antibacterial, and anti-inflammatory properties of bay leaves have been utilized in India.
In addition, the Asia-Pacific region has a long culinary tradition, and bay leaves have become a fixture in many dishes. Bay leaves impart a distinctive flavor and aroma to food, making them an essential ingredient in numerous recipes. The increasing demand for bay leaves in the region is also a result of the prominence of international cuisines such as Mediterranean, Arabic, and European.
Key Regions and Countries
North America
- US
- Canada
- Mexico
Western Europe
- Germany
- France
- The UK
- Spain
- Italy
- Portugal
- Ireland
- Austria
- Switzerland
- Benelux
- Nordic
- Rest of Western Europe
Eastern Europe
- Russia
- Poland
- The Czech Republic
- Greece
- Rest of Eastern Europe
APAC
- China
- Japan
- South Korea
- India
- Australia & New Zealand
- Indonesia
- Malaysia
- Philippines
- Singapore
- Thailand
- Vietnam
- Rest of APAC
Latin America
- Brazil
- Colombia
- Chile
- Argentina
- Costa Rica
- Rest of Latin America
Middle East & Africa
- Algeria
- Egypt
- Israel
- Kuwait
- Nigeria
- Saudi Arabia
- South Africa
- Turkey
- United Arab Emirates
- Rest of MEA
Key Players Analysis
The Bay Leaf market boasts a dynamic landscape with several key players driving its growth and innovation. Among these industry leaders, companies like McCormick & Company, Inc., The Watkins Company, Frontier Co-op, and Spicely Organics stand out as influential contributors to the global bay leaf market.
These market leaders are known for their commitment to quality, sustainable sourcing practices, and a wide range of bay leaf products catering to diverse consumer preferences. They play a pivotal role in shaping market trends, maintaining product standards, and ensuring the availability of high-quality bay leaves to consumers worldwide. As the demand for natural and organic ingredients continues to rise, these key players are well-positioned to play a vital role in the ever-expanding bay leaf market.
Top Key Players in Bay Leaf Market
- House of Spices (India) Inc.
- Mars Incorporated
- Goya Foods
- Olam International
- McCormick & Company Incorporated
- Frontier Natural Products Co-op Inc.
- Anatoli Spices
- Pacific Spice Company Inc.
- Zizira
- Alpina Organic Company
- Mountain Rose Inc.
- The Spice Hunter Inc.
Recent Development
- In 2023, McCormick, a prominent global spice and flavoring company, acquired Frontier Natural Products in a significant move to increase its presence in the organic bay leaf market. Frontier Natural Products is an industry leader in organic and natural products with a reputation for producing high-quality items. This acquisition enables McCormick to leverage Frontier's organic product expertise and strengthens its market position. McCormick is well-positioned to satisfy the growing consumer demand for organic bay leaves now that it has access to Frontier's organic bay leaf portfolio.
- In 2022, Anatoli Spices, the world's foremost provider of bay leaf, launched an initiative to increase its production capacity by 20%. This strategic action is a response to the rising demand for bay leaves in a variety of culinary and medicinal applications. By increasing its production capacity, Anatoli Spices intends to ensure a steady and dependable supply of bay leaves to satisfy the market's expanding demands. This expansion exemplifies the company's dedication to satisfying customer demand and strengthening its position as an industry leader in bay leaf.
- In 2021, Pacific Spice, a renowned global spice supplier, added an organic bay leaf product to its lineup. This product stands out because it is produced solely from 100 percent organic bay leaves and is USDA (United States Department of Agriculture) certified. By introducing this organic bay leaf product, Pacific Spice responds to the growing demand for organic alternatives among consumers. This offering accommodates health-conscious consumers seeking natural, high-quality products, in line with Pacific Spice's commitment to providing premium spices.
Report Scope
Report Features Description Market Value (2022) USD 795.7 Mn Forecast Revenue (2032) USD 1,177.3 Mn CAGR (2023-2032) 4.1% Base Year for Estimation 2022 Historic Period 2016-2022 Forecast Period 2023-2032 Report Coverage Revenue Forecast, Market Dynamics, COVID-19 Impact, Competitive Landscape, Recent Developments Segments Covered Product Type Analysis (Organic Bay Leaves, Conventional Bay Leaves), Form Analysis (Dried Bay Leaves, Fresh Bay Leaves), Application Analysis (Culinary, Medicinal and Herbal Remedies, Aromatherapy), Distribution Channel Analysis (Supermarkets and Hypermarkets, Online Retail, Specialty Stores, and Health Food Stores) Regional Analysis North America – The US, Canada, & Mexico; Western Europe – Germany, France, The UK, Spain, Italy, Portugal, Ireland, Austria, Switzerland, Benelux, Nordic, & Rest of Western Europe; Eastern Europe – Russia, Poland, The Czech Republic, Greece, & Rest of Eastern Europe; APAC – China, Japan, South Korea, India, Australia & New Zealand, Indonesia, Malaysia, Philippines, Singapore, Thailand, Vietnam, & Rest of APAC; Latin America – Brazil, Colombia, Chile, Argentina, Costa Rica, & Rest of Latin America; the Middle East & Africa – Algeria, Egypt, Israel, Kuwait, Nigeria, Saudi Arabia, South Africa, Turkey, United Arab Emirates, & Rest of MEA Competitive Landscape House of Spices (India) Inc., Mars Incorporated, Goya Foods, Olam International, McCormick & Company Incorporated, Frontier Natural Products Co-op Inc., Anatoli Spices, Pacific Spice Company Inc., Zizira, Alpina Organic Company, Mountain Rose Inc., The Spice Hunter Inc. Customization Scope Customization for segments, region/country-level will be provided. Moreover, additional customization can be done based on the requirements. Purchase Options We have three licenses to opt for Single User License, Multi-User License (Up to 5 Users), Corporate Use License (Unlimited User and Printable PDF) -
- 1. Executive Summary
- 1.1. Definition
- 1.2. Taxonomy
- 1.3. Research Scope
- 1.4. Key Analysis
- 1.5. Key Findings by Major Segments
- 1.6. Top strategies by Major Players
- 2. Global Bay Leaf Market Overview
- 2.1. Bay Leaf Market Dynamics
- 2.1.1. Drivers
- 2.1.2. Opportunities
- 2.1.3. Restraints
- 2.1.4. Challenges
- 2.2. Macro-economic Factors
- 2.3. Regulatory Framework
- 2.4. Market Investment Feasibility Index
- 2.5. PEST Analysis
- 2.6. PORTER’S Five Force Analysis
- 2.7. Drivers & Restraints Impact Analysis
- 2.8. Industry Chain Analysis
- 2.9. Cost Structure Analysis
- 2.10. Marketing Strategy
- 2.11. Russia-Ukraine War Impact Analysis
- 2.12. Opportunity Map Analysis
- 2.13. Market Competition Scenario Analysis
- 2.14. Product Life Cycle Analysis
- 2.15. Opportunity Orbits
- 2.16. Manufacturer Intensity Map
- 2.17. Major Companies sales by Value & Volume
- 2.1. Bay Leaf Market Dynamics
- 3. Global Bay Leaf Market Analysis, Opportunity and Forecast, 2016-2032
- 3.1. Global Bay Leaf Market Analysis, 2016-2021
- 3.2. Global Bay Leaf Market Opportunity and Forecast, 2023-2032
- 3.3. Global Bay Leaf Market Analysis, Opportunity and Forecast, By By Product Type, 2016-2032
- 3.3.1. Global Bay Leaf Market Analysis By Product Type: Introduction
- 3.3.2. Market Size Absolute $ Opportunity Analysis and Forecast, By By Product Type, 2016-2032
- 3.3.3. Organic Bay Leaves
- 3.3.4. Conventional Bay Leaves
- 3.4. Global Bay Leaf Market Analysis, Opportunity and Forecast, By By Form, 2016-2032
- 3.4.1. Global Bay Leaf Market Analysis By Form: Introduction
- 3.4.2. Market Size Absolute $ Opportunity Analysis and Forecast, By By Form, 2016-2032
- 3.4.3. Dried Bay Leaves
- 3.4.4. Fresh Bay Leaves
- 3.5. Global Bay Leaf Market Analysis, Opportunity and Forecast, By By Application, 2016-2032
- 3.5.1. Global Bay Leaf Market Analysis By Application: Introduction
- 3.5.2. Market Size Absolute $ Opportunity Analysis and Forecast, By By Application, 2016-2032
- 3.5.3. Culinary
- 3.5.4. Medicinal and Herbal Remedies
- 3.5.5. Aromatherapy
- 3.6. Global Bay Leaf Market Analysis, Opportunity and Forecast, By By Distribution Channel, 2016-2032
- 3.6.1. Global Bay Leaf Market Analysis By Distribution Channel: Introduction
- 3.6.2. Market Size Absolute $ Opportunity Analysis and Forecast, By By Distribution Channel, 2016-2032
- 3.6.3. Supermarkets and Hypermarkets
- 3.6.4. Online Retail
- 3.6.5. Specialty Stores and Health Food Stores
- 4. North America Bay Leaf Market Analysis, Opportunity and Forecast, 2016-2032
- 4.1. North America Bay Leaf Market Analysis, 2016-2021
- 4.2. North America Bay Leaf Market Opportunity and Forecast, 2023-2032
- 4.3. North America Bay Leaf Market Analysis, Opportunity and Forecast, By By Product Type, 2016-2032
- 4.3.1. North America Bay Leaf Market Analysis By Product Type: Introduction
- 4.3.2. Market Size Absolute $ Opportunity Analysis and Forecast, By By Product Type, 2016-2032
- 4.3.3. Organic Bay Leaves
- 4.3.4. Conventional Bay Leaves
- 4.4. North America Bay Leaf Market Analysis, Opportunity and Forecast, By By Form, 2016-2032
- 4.4.1. North America Bay Leaf Market Analysis By Form: Introduction
- 4.4.2. Market Size Absolute $ Opportunity Analysis and Forecast, By By Form, 2016-2032
- 4.4.3. Dried Bay Leaves
- 4.4.4. Fresh Bay Leaves
- 4.5. North America Bay Leaf Market Analysis, Opportunity and Forecast, By By Application, 2016-2032
- 4.5.1. North America Bay Leaf Market Analysis By Application: Introduction
- 4.5.2. Market Size Absolute $ Opportunity Analysis and Forecast, By By Application, 2016-2032
- 4.5.3. Culinary
- 4.5.4. Medicinal and Herbal Remedies
- 4.5.5. Aromatherapy
- 4.6. North America Bay Leaf Market Analysis, Opportunity and Forecast, By By Distribution Channel, 2016-2032
- 4.6.1. North America Bay Leaf Market Analysis By Distribution Channel: Introduction
- 4.6.2. Market Size Absolute $ Opportunity Analysis and Forecast, By By Distribution Channel, 2016-2032
- 4.6.3. Supermarkets and Hypermarkets
- 4.6.4. Online Retail
- 4.6.5. Specialty Stores and Health Food Stores
- 4.7. North America Bay Leaf Market Analysis, Opportunity and Forecast, By Country, 2016-2032
- 4.7.1. North America Bay Leaf Market Analysis by Country : Introduction
- 4.7.2. Market Size Absolute $ Opportunity Analysis and Forecast, Country, 2016-2032
- 4.7.2.1. The US
- 4.7.2.2. Canada
- 4.7.2.3. Mexico
- 5. Western Europe Bay Leaf Market Analysis, Opportunity and Forecast, 2016-2032
- 5.1. Western Europe Bay Leaf Market Analysis, 2016-2021
- 5.2. Western Europe Bay Leaf Market Opportunity and Forecast, 2023-2032
- 5.3. Western Europe Bay Leaf Market Analysis, Opportunity and Forecast, By By Product Type, 2016-2032
- 5.3.1. Western Europe Bay Leaf Market Analysis By Product Type: Introduction
- 5.3.2. Market Size Absolute $ Opportunity Analysis and Forecast, By By Product Type, 2016-2032
- 5.3.3. Organic Bay Leaves
- 5.3.4. Conventional Bay Leaves
- 5.4. Western Europe Bay Leaf Market Analysis, Opportunity and Forecast, By By Form, 2016-2032
- 5.4.1. Western Europe Bay Leaf Market Analysis By Form: Introduction
- 5.4.2. Market Size Absolute $ Opportunity Analysis and Forecast, By By Form, 2016-2032
- 5.4.3. Dried Bay Leaves
- 5.4.4. Fresh Bay Leaves
- 5.5. Western Europe Bay Leaf Market Analysis, Opportunity and Forecast, By By Application, 2016-2032
- 5.5.1. Western Europe Bay Leaf Market Analysis By Application: Introduction
- 5.5.2. Market Size Absolute $ Opportunity Analysis and Forecast, By By Application, 2016-2032
- 5.5.3. Culinary
- 5.5.4. Medicinal and Herbal Remedies
- 5.5.5. Aromatherapy
- 5.6. Western Europe Bay Leaf Market Analysis, Opportunity and Forecast, By By Distribution Channel, 2016-2032
- 5.6.1. Western Europe Bay Leaf Market Analysis By Distribution Channel: Introduction
- 5.6.2. Market Size Absolute $ Opportunity Analysis and Forecast, By By Distribution Channel, 2016-2032
- 5.6.3. Supermarkets and Hypermarkets
- 5.6.4. Online Retail
- 5.6.5. Specialty Stores and Health Food Stores
- 5.7. Western Europe Bay Leaf Market Analysis, Opportunity and Forecast, By Country, 2016-2032
- 5.7.1. Western Europe Bay Leaf Market Analysis by Country : Introduction
- 5.7.2. Market Size Absolute $ Opportunity Analysis and Forecast, Country, 2016-2032
- 5.7.2.1. Germany
- 5.7.2.2. France
- 5.7.2.3. The UK
- 5.7.2.4. Spain
- 5.7.2.5. Italy
- 5.7.2.6. Portugal
- 5.7.2.7. Ireland
- 5.7.2.8. Austria
- 5.7.2.9. Switzerland
- 5.7.2.10. Benelux
- 5.7.2.11. Nordic
- 5.7.2.12. Rest of Western Europe
- 6. Eastern Europe Bay Leaf Market Analysis, Opportunity and Forecast, 2016-2032
- 6.1. Eastern Europe Bay Leaf Market Analysis, 2016-2021
- 6.2. Eastern Europe Bay Leaf Market Opportunity and Forecast, 2023-2032
- 6.3. Eastern Europe Bay Leaf Market Analysis, Opportunity and Forecast, By By Product Type, 2016-2032
- 6.3.1. Eastern Europe Bay Leaf Market Analysis By Product Type: Introduction
- 6.3.2. Market Size Absolute $ Opportunity Analysis and Forecast, By By Product Type, 2016-2032
- 6.3.3. Organic Bay Leaves
- 6.3.4. Conventional Bay Leaves
- 6.4. Eastern Europe Bay Leaf Market Analysis, Opportunity and Forecast, By By Form, 2016-2032
- 6.4.1. Eastern Europe Bay Leaf Market Analysis By Form: Introduction
- 6.4.2. Market Size Absolute $ Opportunity Analysis and Forecast, By By Form, 2016-2032
- 6.4.3. Dried Bay Leaves
- 6.4.4. Fresh Bay Leaves
- 6.5. Eastern Europe Bay Leaf Market Analysis, Opportunity and Forecast, By By Application, 2016-2032
- 6.5.1. Eastern Europe Bay Leaf Market Analysis By Application: Introduction
- 6.5.2. Market Size Absolute $ Opportunity Analysis and Forecast, By By Application, 2016-2032
- 6.5.3. Culinary
- 6.5.4. Medicinal and Herbal Remedies
- 6.5.5. Aromatherapy
- 6.6. Eastern Europe Bay Leaf Market Analysis, Opportunity and Forecast, By By Distribution Channel, 2016-2032
- 6.6.1. Eastern Europe Bay Leaf Market Analysis By Distribution Channel: Introduction
- 6.6.2. Market Size Absolute $ Opportunity Analysis and Forecast, By By Distribution Channel, 2016-2032
- 6.6.3. Supermarkets and Hypermarkets
- 6.6.4. Online Retail
- 6.6.5. Specialty Stores and Health Food Stores
- 6.7. Eastern Europe Bay Leaf Market Analysis, Opportunity and Forecast, By Country, 2016-2032
- 6.7.1. Eastern Europe Bay Leaf Market Analysis by Country : Introduction
- 6.7.2. Market Size Absolute $ Opportunity Analysis and Forecast, Country, 2016-2032
- 6.7.2.1. Russia
- 6.7.2.2. Poland
- 6.7.2.3. The Czech Republic
- 6.7.2.4. Greece
- 6.7.2.5. Rest of Eastern Europe
- 7. APAC Bay Leaf Market Analysis, Opportunity and Forecast, 2016-2032
- 7.1. APAC Bay Leaf Market Analysis, 2016-2021
- 7.2. APAC Bay Leaf Market Opportunity and Forecast, 2023-2032
- 7.3. APAC Bay Leaf Market Analysis, Opportunity and Forecast, By By Product Type, 2016-2032
- 7.3.1. APAC Bay Leaf Market Analysis By Product Type: Introduction
- 7.3.2. Market Size Absolute $ Opportunity Analysis and Forecast, By By Product Type, 2016-2032
- 7.3.3. Organic Bay Leaves
- 7.3.4. Conventional Bay Leaves
- 7.4. APAC Bay Leaf Market Analysis, Opportunity and Forecast, By By Form, 2016-2032
- 7.4.1. APAC Bay Leaf Market Analysis By Form: Introduction
- 7.4.2. Market Size Absolute $ Opportunity Analysis and Forecast, By By Form, 2016-2032
- 7.4.3. Dried Bay Leaves
- 7.4.4. Fresh Bay Leaves
- 7.5. APAC Bay Leaf Market Analysis, Opportunity and Forecast, By By Application, 2016-2032
- 7.5.1. APAC Bay Leaf Market Analysis By Application: Introduction
- 7.5.2. Market Size Absolute $ Opportunity Analysis and Forecast, By By Application, 2016-2032
- 7.5.3. Culinary
- 7.5.4. Medicinal and Herbal Remedies
- 7.5.5. Aromatherapy
- 7.6. APAC Bay Leaf Market Analysis, Opportunity and Forecast, By By Distribution Channel, 2016-2032
- 7.6.1. APAC Bay Leaf Market Analysis By Distribution Channel: Introduction
- 7.6.2. Market Size Absolute $ Opportunity Analysis and Forecast, By By Distribution Channel, 2016-2032
- 7.6.3. Supermarkets and Hypermarkets
- 7.6.4. Online Retail
- 7.6.5. Specialty Stores and Health Food Stores
- 7.7. APAC Bay Leaf Market Analysis, Opportunity and Forecast, By Country, 2016-2032
- 7.7.1. APAC Bay Leaf Market Analysis by Country : Introduction
- 7.7.2. Market Size Absolute $ Opportunity Analysis and Forecast, Country, 2016-2032
- 7.7.2.1. China
- 7.7.2.2. Japan
- 7.7.2.3. South Korea
- 7.7.2.4. India
- 7.7.2.5. Australia & New Zeland
- 7.7.2.6. Indonesia
- 7.7.2.7. Malaysia
- 7.7.2.8. Philippines
- 7.7.2.9. Singapore
- 7.7.2.10. Thailand
- 7.7.2.11. Vietnam
- 7.7.2.12. Rest of APAC
- 8. Latin America Bay Leaf Market Analysis, Opportunity and Forecast, 2016-2032
- 8.1. Latin America Bay Leaf Market Analysis, 2016-2021
- 8.2. Latin America Bay Leaf Market Opportunity and Forecast, 2023-2032
- 8.3. Latin America Bay Leaf Market Analysis, Opportunity and Forecast, By By Product Type, 2016-2032
- 8.3.1. Latin America Bay Leaf Market Analysis By Product Type: Introduction
- 8.3.2. Market Size Absolute $ Opportunity Analysis and Forecast, By By Product Type, 2016-2032
- 8.3.3. Organic Bay Leaves
- 8.3.4. Conventional Bay Leaves
- 8.4. Latin America Bay Leaf Market Analysis, Opportunity and Forecast, By By Form, 2016-2032
- 8.4.1. Latin America Bay Leaf Market Analysis By Form: Introduction
- 8.4.2. Market Size Absolute $ Opportunity Analysis and Forecast, By By Form, 2016-2032
- 8.4.3. Dried Bay Leaves
- 8.4.4. Fresh Bay Leaves
- 8.5. Latin America Bay Leaf Market Analysis, Opportunity and Forecast, By By Application, 2016-2032
- 8.5.1. Latin America Bay Leaf Market Analysis By Application: Introduction
- 8.5.2. Market Size Absolute $ Opportunity Analysis and Forecast, By By Application, 2016-2032
- 8.5.3. Culinary
- 8.5.4. Medicinal and Herbal Remedies
- 8.5.5. Aromatherapy
- 8.6. Latin America Bay Leaf Market Analysis, Opportunity and Forecast, By By Distribution Channel, 2016-2032
- 8.6.1. Latin America Bay Leaf Market Analysis By Distribution Channel: Introduction
- 8.6.2. Market Size Absolute $ Opportunity Analysis and Forecast, By By Distribution Channel, 2016-2032
- 8.6.3. Supermarkets and Hypermarkets
- 8.6.4. Online Retail
- 8.6.5. Specialty Stores and Health Food Stores
- 8.7. Latin America Bay Leaf Market Analysis, Opportunity and Forecast, By Country, 2016-2032
- 8.7.1. Latin America Bay Leaf Market Analysis by Country : Introduction
- 8.7.2. Market Size Absolute $ Opportunity Analysis and Forecast, Country, 2016-2032
- 8.7.2.1. Brazil
- 8.7.2.2. Colombia
- 8.7.2.3. Chile
- 8.7.2.4. Argentina
- 8.7.2.5. Costa Rica
- 8.7.2.6. Rest of Latin America
- 9. Middle East & Africa Bay Leaf Market Analysis, Opportunity and Forecast, 2016-2032
- 9.1. Middle East & Africa Bay Leaf Market Analysis, 2016-2021
- 9.2. Middle East & Africa Bay Leaf Market Opportunity and Forecast, 2023-2032
- 9.3. Middle East & Africa Bay Leaf Market Analysis, Opportunity and Forecast, By By Product Type, 2016-2032
- 9.3.1. Middle East & Africa Bay Leaf Market Analysis By Product Type: Introduction
- 9.3.2. Market Size Absolute $ Opportunity Analysis and Forecast, By By Product Type, 2016-2032
- 9.3.3. Organic Bay Leaves
- 9.3.4. Conventional Bay Leaves
- 9.4. Middle East & Africa Bay Leaf Market Analysis, Opportunity and Forecast, By By Form, 2016-2032
- 9.4.1. Middle East & Africa Bay Leaf Market Analysis By Form: Introduction
- 9.4.2. Market Size Absolute $ Opportunity Analysis and Forecast, By By Form, 2016-2032
- 9.4.3. Dried Bay Leaves
- 9.4.4. Fresh Bay Leaves
- 9.5. Middle East & Africa Bay Leaf Market Analysis, Opportunity and Forecast, By By Application, 2016-2032
- 9.5.1. Middle East & Africa Bay Leaf Market Analysis By Application: Introduction
- 9.5.2. Market Size Absolute $ Opportunity Analysis and Forecast, By By Application, 2016-2032
- 9.5.3. Culinary
- 9.5.4. Medicinal and Herbal Remedies
- 9.5.5. Aromatherapy
- 9.6. Middle East & Africa Bay Leaf Market Analysis, Opportunity and Forecast, By By Distribution Channel, 2016-2032
- 9.6.1. Middle East & Africa Bay Leaf Market Analysis By Distribution Channel: Introduction
- 9.6.2. Market Size Absolute $ Opportunity Analysis and Forecast, By By Distribution Channel, 2016-2032
- 9.6.3. Supermarkets and Hypermarkets
- 9.6.4. Online Retail
- 9.6.5. Specialty Stores and Health Food Stores
- 9.7. Middle East & Africa Bay Leaf Market Analysis, Opportunity and Forecast, By Country, 2016-2032
- 9.7.1. Middle East & Africa Bay Leaf Market Analysis by Country : Introduction
- 9.7.2. Market Size Absolute $ Opportunity Analysis and Forecast, Country, 2016-2032
- 9.7.2.1. Algeria
- 9.7.2.2. Egypt
- 9.7.2.3. Israel
- 9.7.2.4. Kuwait
- 9.7.2.5. Nigeria
- 9.7.2.6. Saudi Arabia
- 9.7.2.7. South Africa
- 9.7.2.8. Turkey
- 9.7.2.9. The UAE
- 9.7.2.10. Rest of MEA
- 10. Global Bay Leaf Market Analysis, Opportunity and Forecast, By Region, 2016-2032
- 10.1. Global Bay Leaf Market Analysis by Region : Introduction
- 10.2. Market Size Absolute $ Opportunity Analysis and Forecast, By Region, 2016-2032
- 10.2.1. North America
- 10.2.2. Western Europe
- 10.2.3. Eastern Europe
- 10.2.4. APAC
- 10.2.5. Latin America
- 10.2.6. Middle East & Africa
- 11. Global Bay Leaf Market Competitive Landscape, Market Share Analysis, and Company Profiles
- 11.1. Market Share Analysis
- 11.2. Company Profiles
- 11.3. House of Spices (India) Inc.
- 11.3.1. Company Overview
- 11.3.2. Financial Highlights
- 11.3.3. Product Portfolio
- 11.3.4. SWOT Analysis
- 11.3.5. Key Strategies and Developments
- 11.4. Mars Incorporated
- 11.4.1. Company Overview
- 11.4.2. Financial Highlights
- 11.4.3. Product Portfolio
- 11.4.4. SWOT Analysis
- 11.4.5. Key Strategies and Developments
- 11.5. Goya Foods
- 11.5.1. Company Overview
- 11.5.2. Financial Highlights
- 11.5.3. Product Portfolio
- 11.5.4. SWOT Analysis
- 11.5.5. Key Strategies and Developments
- 11.6. Olam International
- 11.6.1. Company Overview
- 11.6.2. Financial Highlights
- 11.6.3. Product Portfolio
- 11.6.4. SWOT Analysis
- 11.6.5. Key Strategies and Developments
- 11.7. McCormick & Company Incorporated
- 11.7.1. Company Overview
- 11.7.2. Financial Highlights
- 11.7.3. Product Portfolio
- 11.7.4. SWOT Analysis
- 11.7.5. Key Strategies and Developments
- 11.8. Frontier Natural Products Co-op Inc.
- 11.8.1. Company Overview
- 11.8.2. Financial Highlights
- 11.8.3. Product Portfolio
- 11.8.4. SWOT Analysis
- 11.8.5. Key Strategies and Developments
- 11.9. Anatoli Spices
- 11.9.1. Company Overview
- 11.9.2. Financial Highlights
- 11.9.3. Product Portfolio
- 11.9.4. SWOT Analysis
- 11.9.5. Key Strategies and Developments
- 11.10. Pacific Spice Company Inc.
- 11.10.1. Company Overview
- 11.10.2. Financial Highlights
- 11.10.3. Product Portfolio
- 11.10.4. SWOT Analysis
- 11.10.5. Key Strategies and Developments
- 11.11. Zizira
- 11.11.1. Company Overview
- 11.11.2. Financial Highlights
- 11.11.3. Product Portfolio
- 11.11.4. SWOT Analysis
- 11.11.5. Key Strategies and Developments
- 11.12. Alpina Organic Company
- 11.12.1. Company Overview
- 11.12.2. Financial Highlights
- 11.12.3. Product Portfolio
- 11.12.4. SWOT Analysis
- 11.12.5. Key Strategies and Developments
- 11.13. Mountain Rose Inc.
- 11.13.1. Company Overview
- 11.13.2. Financial Highlights
- 11.13.3. Product Portfolio
- 11.13.4. SWOT Analysis
- 11.13.5. Key Strategies and Developments
- 11.14. The Spice Hunter Inc.
- 11.14.1. Company Overview
- 11.14.2. Financial Highlights
- 11.14.3. Product Portfolio
- 11.14.4. SWOT Analysis
- 11.14.5. Key Strategies and Developments
- 12. Assumptions and Acronyms
- 13. Research Methodology
- 14. Contact
List of Figures
- Figure 1: Global Bay Leaf Market Revenue (US$ Mn) Market Share By Product Type in 2022
- Figure 2: Global Bay Leaf Market Attractiveness Analysis By Product Type, 2016-2032
- Figure 3: Global Bay Leaf Market Revenue (US$ Mn) Market Share By Formin 2022
- Figure 4: Global Bay Leaf Market Attractiveness Analysis By Form, 2016-2032
- Figure 5: Global Bay Leaf Market Revenue (US$ Mn) Market Share By Applicationin 2022
- Figure 6: Global Bay Leaf Market Attractiveness Analysis By Application, 2016-2032
- Figure 7: Global Bay Leaf Market Revenue (US$ Mn) Market Share By Distribution Channelin 2022
- Figure 8: Global Bay Leaf Market Attractiveness Analysis By Distribution Channel, 2016-2032
- Figure 9: Global Bay Leaf Market Revenue (US$ Mn) Market Share by Region in 2022
- Figure 10: Global Bay Leaf Market Attractiveness Analysis by Region, 2016-2032
- Figure 11: Global Bay Leaf Market Revenue (US$ Mn) (2016-2032)
- Figure 12: Global Bay Leaf Market Revenue (US$ Mn) Comparison by Region (2016-2032)
- Figure 13: Global Bay Leaf Market Revenue (US$ Mn) Comparison By Product Type (2016-2032)
- Figure 14: Global Bay Leaf Market Revenue (US$ Mn) Comparison By Form (2016-2032)
- Figure 15: Global Bay Leaf Market Revenue (US$ Mn) Comparison By Application (2016-2032)
- Figure 16: Global Bay Leaf Market Revenue (US$ Mn) Comparison By Distribution Channel (2016-2032)
- Figure 17: Global Bay Leaf Market Y-o-Y Growth Rate Comparison by Region (2016-2032)
- Figure 18: Global Bay Leaf Market Y-o-Y Growth Rate Comparison By Product Type (2016-2032)
- Figure 19: Global Bay Leaf Market Y-o-Y Growth Rate Comparison By Form (2016-2032)
- Figure 20: Global Bay Leaf Market Y-o-Y Growth Rate Comparison By Application (2016-2032)
- Figure 21: Global Bay Leaf Market Y-o-Y Growth Rate Comparison By Distribution Channel (2016-2032)
- Figure 22: Global Bay Leaf Market Share Comparison by Region (2016-2032)
- Figure 23: Global Bay Leaf Market Share Comparison By Product Type (2016-2032)
- Figure 24: Global Bay Leaf Market Share Comparison By Form (2016-2032)
- Figure 25: Global Bay Leaf Market Share Comparison By Application (2016-2032)
- Figure 26: Global Bay Leaf Market Share Comparison By Distribution Channel (2016-2032)
- Figure 27: North America Bay Leaf Market Revenue (US$ Mn) Market Share By Product Typein 2022
- Figure 28: North America Bay Leaf Market Attractiveness Analysis By Product Type, 2016-2032
- Figure 29: North America Bay Leaf Market Revenue (US$ Mn) Market Share By Formin 2022
- Figure 30: North America Bay Leaf Market Attractiveness Analysis By Form, 2016-2032
- Figure 31: North America Bay Leaf Market Revenue (US$ Mn) Market Share By Applicationin 2022
- Figure 32: North America Bay Leaf Market Attractiveness Analysis By Application, 2016-2032
- Figure 33: North America Bay Leaf Market Revenue (US$ Mn) Market Share By Distribution Channelin 2022
- Figure 34: North America Bay Leaf Market Attractiveness Analysis By Distribution Channel, 2016-2032
- Figure 35: North America Bay Leaf Market Revenue (US$ Mn) Market Share by Country in 2022
- Figure 36: North America Bay Leaf Market Attractiveness Analysis by Country, 2016-2032
- Figure 37: North America Bay Leaf Market Revenue (US$ Mn) (2016-2032)
- Figure 38: North America Bay Leaf Market Revenue (US$ Mn) Comparison by Country (2016-2032)
- Figure 39: North America Bay Leaf Market Revenue (US$ Mn) Comparison By Product Type (2016-2032)
- Figure 40: North America Bay Leaf Market Revenue (US$ Mn) Comparison By Form (2016-2032)
- Figure 41: North America Bay Leaf Market Revenue (US$ Mn) Comparison By Application (2016-2032)
- Figure 42: North America Bay Leaf Market Revenue (US$ Mn) Comparison By Distribution Channel (2016-2032)
- Figure 43: North America Bay Leaf Market Y-o-Y Growth Rate Comparison by Country (2016-2032)
- Figure 44: North America Bay Leaf Market Y-o-Y Growth Rate Comparison By Product Type (2016-2032)
- Figure 45: North America Bay Leaf Market Y-o-Y Growth Rate Comparison By Form (2016-2032)
- Figure 46: North America Bay Leaf Market Y-o-Y Growth Rate Comparison By Application (2016-2032)
- Figure 47: North America Bay Leaf Market Y-o-Y Growth Rate Comparison By Distribution Channel (2016-2032)
- Figure 48: North America Bay Leaf Market Share Comparison by Country (2016-2032)
- Figure 49: North America Bay Leaf Market Share Comparison By Product Type (2016-2032)
- Figure 50: North America Bay Leaf Market Share Comparison By Form (2016-2032)
- Figure 51: North America Bay Leaf Market Share Comparison By Application (2016-2032)
- Figure 52: North America Bay Leaf Market Share Comparison By Distribution Channel (2016-2032)
- Figure 53: Western Europe Bay Leaf Market Revenue (US$ Mn) Market Share By Product Typein 2022
- Figure 54: Western Europe Bay Leaf Market Attractiveness Analysis By Product Type, 2016-2032
- Figure 55: Western Europe Bay Leaf Market Revenue (US$ Mn) Market Share By Formin 2022
- Figure 56: Western Europe Bay Leaf Market Attractiveness Analysis By Form, 2016-2032
- Figure 57: Western Europe Bay Leaf Market Revenue (US$ Mn) Market Share By Applicationin 2022
- Figure 58: Western Europe Bay Leaf Market Attractiveness Analysis By Application, 2016-2032
- Figure 59: Western Europe Bay Leaf Market Revenue (US$ Mn) Market Share By Distribution Channelin 2022
- Figure 60: Western Europe Bay Leaf Market Attractiveness Analysis By Distribution Channel, 2016-2032
- Figure 61: Western Europe Bay Leaf Market Revenue (US$ Mn) Market Share by Country in 2022
- Figure 62: Western Europe Bay Leaf Market Attractiveness Analysis by Country, 2016-2032
- Figure 63: Western Europe Bay Leaf Market Revenue (US$ Mn) (2016-2032)
- Figure 64: Western Europe Bay Leaf Market Revenue (US$ Mn) Comparison by Country (2016-2032)
- Figure 65: Western Europe Bay Leaf Market Revenue (US$ Mn) Comparison By Product Type (2016-2032)
- Figure 66: Western Europe Bay Leaf Market Revenue (US$ Mn) Comparison By Form (2016-2032)
- Figure 67: Western Europe Bay Leaf Market Revenue (US$ Mn) Comparison By Application (2016-2032)
- Figure 68: Western Europe Bay Leaf Market Revenue (US$ Mn) Comparison By Distribution Channel (2016-2032)
- Figure 69: Western Europe Bay Leaf Market Y-o-Y Growth Rate Comparison by Country (2016-2032)
- Figure 70: Western Europe Bay Leaf Market Y-o-Y Growth Rate Comparison By Product Type (2016-2032)
- Figure 71: Western Europe Bay Leaf Market Y-o-Y Growth Rate Comparison By Form (2016-2032)
- Figure 72: Western Europe Bay Leaf Market Y-o-Y Growth Rate Comparison By Application (2016-2032)
- Figure 73: Western Europe Bay Leaf Market Y-o-Y Growth Rate Comparison By Distribution Channel (2016-2032)
- Figure 74: Western Europe Bay Leaf Market Share Comparison by Country (2016-2032)
- Figure 75: Western Europe Bay Leaf Market Share Comparison By Product Type (2016-2032)
- Figure 76: Western Europe Bay Leaf Market Share Comparison By Form (2016-2032)
- Figure 77: Western Europe Bay Leaf Market Share Comparison By Application (2016-2032)
- Figure 78: Western Europe Bay Leaf Market Share Comparison By Distribution Channel (2016-2032)
- Figure 79: Eastern Europe Bay Leaf Market Revenue (US$ Mn) Market Share By Product Typein 2022
- Figure 80: Eastern Europe Bay Leaf Market Attractiveness Analysis By Product Type, 2016-2032
- Figure 81: Eastern Europe Bay Leaf Market Revenue (US$ Mn) Market Share By Formin 2022
- Figure 82: Eastern Europe Bay Leaf Market Attractiveness Analysis By Form, 2016-2032
- Figure 83: Eastern Europe Bay Leaf Market Revenue (US$ Mn) Market Share By Applicationin 2022
- Figure 84: Eastern Europe Bay Leaf Market Attractiveness Analysis By Application, 2016-2032
- Figure 85: Eastern Europe Bay Leaf Market Revenue (US$ Mn) Market Share By Distribution Channelin 2022
- Figure 86: Eastern Europe Bay Leaf Market Attractiveness Analysis By Distribution Channel, 2016-2032
- Figure 87: Eastern Europe Bay Leaf Market Revenue (US$ Mn) Market Share by Country in 2022
- Figure 88: Eastern Europe Bay Leaf Market Attractiveness Analysis by Country, 2016-2032
- Figure 89: Eastern Europe Bay Leaf Market Revenue (US$ Mn) (2016-2032)
- Figure 90: Eastern Europe Bay Leaf Market Revenue (US$ Mn) Comparison by Country (2016-2032)
- Figure 91: Eastern Europe Bay Leaf Market Revenue (US$ Mn) Comparison By Product Type (2016-2032)
- Figure 92: Eastern Europe Bay Leaf Market Revenue (US$ Mn) Comparison By Form (2016-2032)
- Figure 93: Eastern Europe Bay Leaf Market Revenue (US$ Mn) Comparison By Application (2016-2032)
- Figure 94: Eastern Europe Bay Leaf Market Revenue (US$ Mn) Comparison By Distribution Channel (2016-2032)
- Figure 95: Eastern Europe Bay Leaf Market Y-o-Y Growth Rate Comparison by Country (2016-2032)
- Figure 96: Eastern Europe Bay Leaf Market Y-o-Y Growth Rate Comparison By Product Type (2016-2032)
- Figure 97: Eastern Europe Bay Leaf Market Y-o-Y Growth Rate Comparison By Form (2016-2032)
- Figure 98: Eastern Europe Bay Leaf Market Y-o-Y Growth Rate Comparison By Application (2016-2032)
- Figure 99: Eastern Europe Bay Leaf Market Y-o-Y Growth Rate Comparison By Distribution Channel (2016-2032)
- Figure 100: Eastern Europe Bay Leaf Market Share Comparison by Country (2016-2032)
- Figure 101: Eastern Europe Bay Leaf Market Share Comparison By Product Type (2016-2032)
- Figure 102: Eastern Europe Bay Leaf Market Share Comparison By Form (2016-2032)
- Figure 103: Eastern Europe Bay Leaf Market Share Comparison By Application (2016-2032)
- Figure 104: Eastern Europe Bay Leaf Market Share Comparison By Distribution Channel (2016-2032)
- Figure 105: APAC Bay Leaf Market Revenue (US$ Mn) Market Share By Product Typein 2022
- Figure 106: APAC Bay Leaf Market Attractiveness Analysis By Product Type, 2016-2032
- Figure 107: APAC Bay Leaf Market Revenue (US$ Mn) Market Share By Formin 2022
- Figure 108: APAC Bay Leaf Market Attractiveness Analysis By Form, 2016-2032
- Figure 109: APAC Bay Leaf Market Revenue (US$ Mn) Market Share By Applicationin 2022
- Figure 110: APAC Bay Leaf Market Attractiveness Analysis By Application, 2016-2032
- Figure 111: APAC Bay Leaf Market Revenue (US$ Mn) Market Share By Distribution Channelin 2022
- Figure 112: APAC Bay Leaf Market Attractiveness Analysis By Distribution Channel, 2016-2032
- Figure 113: APAC Bay Leaf Market Revenue (US$ Mn) Market Share by Country in 2022
- Figure 114: APAC Bay Leaf Market Attractiveness Analysis by Country, 2016-2032
- Figure 115: APAC Bay Leaf Market Revenue (US$ Mn) (2016-2032)
- Figure 116: APAC Bay Leaf Market Revenue (US$ Mn) Comparison by Country (2016-2032)
- Figure 117: APAC Bay Leaf Market Revenue (US$ Mn) Comparison By Product Type (2016-2032)
- Figure 118: APAC Bay Leaf Market Revenue (US$ Mn) Comparison By Form (2016-2032)
- Figure 119: APAC Bay Leaf Market Revenue (US$ Mn) Comparison By Application (2016-2032)
- Figure 120: APAC Bay Leaf Market Revenue (US$ Mn) Comparison By Distribution Channel (2016-2032)
- Figure 121: APAC Bay Leaf Market Y-o-Y Growth Rate Comparison by Country (2016-2032)
- Figure 122: APAC Bay Leaf Market Y-o-Y Growth Rate Comparison By Product Type (2016-2032)
- Figure 123: APAC Bay Leaf Market Y-o-Y Growth Rate Comparison By Form (2016-2032)
- Figure 124: APAC Bay Leaf Market Y-o-Y Growth Rate Comparison By Application (2016-2032)
- Figure 125: APAC Bay Leaf Market Y-o-Y Growth Rate Comparison By Distribution Channel (2016-2032)
- Figure 126: APAC Bay Leaf Market Share Comparison by Country (2016-2032)
- Figure 127: APAC Bay Leaf Market Share Comparison By Product Type (2016-2032)
- Figure 128: APAC Bay Leaf Market Share Comparison By Form (2016-2032)
- Figure 129: APAC Bay Leaf Market Share Comparison By Application (2016-2032)
- Figure 130: APAC Bay Leaf Market Share Comparison By Distribution Channel (2016-2032)
- Figure 131: Latin America Bay Leaf Market Revenue (US$ Mn) Market Share By Product Typein 2022
- Figure 132: Latin America Bay Leaf Market Attractiveness Analysis By Product Type, 2016-2032
- Figure 133: Latin America Bay Leaf Market Revenue (US$ Mn) Market Share By Formin 2022
- Figure 134: Latin America Bay Leaf Market Attractiveness Analysis By Form, 2016-2032
- Figure 135: Latin America Bay Leaf Market Revenue (US$ Mn) Market Share By Applicationin 2022
- Figure 136: Latin America Bay Leaf Market Attractiveness Analysis By Application, 2016-2032
- Figure 137: Latin America Bay Leaf Market Revenue (US$ Mn) Market Share By Distribution Channelin 2022
- Figure 138: Latin America Bay Leaf Market Attractiveness Analysis By Distribution Channel, 2016-2032
- Figure 139: Latin America Bay Leaf Market Revenue (US$ Mn) Market Share by Country in 2022
- Figure 140: Latin America Bay Leaf Market Attractiveness Analysis by Country, 2016-2032
- Figure 141: Latin America Bay Leaf Market Revenue (US$ Mn) (2016-2032)
- Figure 142: Latin America Bay Leaf Market Revenue (US$ Mn) Comparison by Country (2016-2032)
- Figure 143: Latin America Bay Leaf Market Revenue (US$ Mn) Comparison By Product Type (2016-2032)
- Figure 144: Latin America Bay Leaf Market Revenue (US$ Mn) Comparison By Form (2016-2032)
- Figure 145: Latin America Bay Leaf Market Revenue (US$ Mn) Comparison By Application (2016-2032)
- Figure 146: Latin America Bay Leaf Market Revenue (US$ Mn) Comparison By Distribution Channel (2016-2032)
- Figure 147: Latin America Bay Leaf Market Y-o-Y Growth Rate Comparison by Country (2016-2032)
- Figure 148: Latin America Bay Leaf Market Y-o-Y Growth Rate Comparison By Product Type (2016-2032)
- Figure 149: Latin America Bay Leaf Market Y-o-Y Growth Rate Comparison By Form (2016-2032)
- Figure 150: Latin America Bay Leaf Market Y-o-Y Growth Rate Comparison By Application (2016-2032)
- Figure 151: Latin America Bay Leaf Market Y-o-Y Growth Rate Comparison By Distribution Channel (2016-2032)
- Figure 152: Latin America Bay Leaf Market Share Comparison by Country (2016-2032)
- Figure 153: Latin America Bay Leaf Market Share Comparison By Product Type (2016-2032)
- Figure 154: Latin America Bay Leaf Market Share Comparison By Form (2016-2032)
- Figure 155: Latin America Bay Leaf Market Share Comparison By Application (2016-2032)
- Figure 156: Latin America Bay Leaf Market Share Comparison By Distribution Channel (2016-2032)
- Figure 157: Middle East & Africa Bay Leaf Market Revenue (US$ Mn) Market Share By Product Typein 2022
- Figure 158: Middle East & Africa Bay Leaf Market Attractiveness Analysis By Product Type, 2016-2032
- Figure 159: Middle East & Africa Bay Leaf Market Revenue (US$ Mn) Market Share By Formin 2022
- Figure 160: Middle East & Africa Bay Leaf Market Attractiveness Analysis By Form, 2016-2032
- Figure 161: Middle East & Africa Bay Leaf Market Revenue (US$ Mn) Market Share By Applicationin 2022
- Figure 162: Middle East & Africa Bay Leaf Market Attractiveness Analysis By Application, 2016-2032
- Figure 163: Middle East & Africa Bay Leaf Market Revenue (US$ Mn) Market Share By Distribution Channelin 2022
- Figure 164: Middle East & Africa Bay Leaf Market Attractiveness Analysis By Distribution Channel, 2016-2032
- Figure 165: Middle East & Africa Bay Leaf Market Revenue (US$ Mn) Market Share by Country in 2022
- Figure 166: Middle East & Africa Bay Leaf Market Attractiveness Analysis by Country, 2016-2032
- Figure 167: Middle East & Africa Bay Leaf Market Revenue (US$ Mn) (2016-2032)
- Figure 168: Middle East & Africa Bay Leaf Market Revenue (US$ Mn) Comparison by Country (2016-2032)
- Figure 169: Middle East & Africa Bay Leaf Market Revenue (US$ Mn) Comparison By Product Type (2016-2032)
- Figure 170: Middle East & Africa Bay Leaf Market Revenue (US$ Mn) Comparison By Form (2016-2032)
- Figure 171: Middle East & Africa Bay Leaf Market Revenue (US$ Mn) Comparison By Application (2016-2032)
- Figure 172: Middle East & Africa Bay Leaf Market Revenue (US$ Mn) Comparison By Distribution Channel (2016-2032)
- Figure 173: Middle East & Africa Bay Leaf Market Y-o-Y Growth Rate Comparison by Country (2016-2032)
- Figure 174: Middle East & Africa Bay Leaf Market Y-o-Y Growth Rate Comparison By Product Type (2016-2032)
- Figure 175: Middle East & Africa Bay Leaf Market Y-o-Y Growth Rate Comparison By Form (2016-2032)
- Figure 176: Middle East & Africa Bay Leaf Market Y-o-Y Growth Rate Comparison By Application (2016-2032)
- Figure 177: Middle East & Africa Bay Leaf Market Y-o-Y Growth Rate Comparison By Distribution Channel (2016-2032)
- Figure 178: Middle East & Africa Bay Leaf Market Share Comparison by Country (2016-2032)
- Figure 179: Middle East & Africa Bay Leaf Market Share Comparison By Product Type (2016-2032)
- Figure 180: Middle East & Africa Bay Leaf Market Share Comparison By Form (2016-2032)
- Figure 181: Middle East & Africa Bay Leaf Market Share Comparison By Application (2016-2032)
- Figure 182: Middle East & Africa Bay Leaf Market Share Comparison By Distribution Channel (2016-2032)
List of Tables
- Table 1: Global Bay Leaf Market Comparison By Product Type (2016-2032)
- Table 2: Global Bay Leaf Market Comparison By Form (2016-2032)
- Table 3: Global Bay Leaf Market Comparison By Application (2016-2032)
- Table 4: Global Bay Leaf Market Comparison By Distribution Channel (2016-2032)
- Table 5: Global Bay Leaf Market Revenue (US$ Mn) Comparison by Region (2016-2032)
- Table 6: Global Bay Leaf Market Revenue (US$ Mn) (2016-2032)
- Table 7: Global Bay Leaf Market Revenue (US$ Mn) Comparison by Region (2016-2032)
- Table 8: Global Bay Leaf Market Revenue (US$ Mn) Comparison By Product Type (2016-2032)
- Table 9: Global Bay Leaf Market Revenue (US$ Mn) Comparison By Form (2016-2032)
- Table 10: Global Bay Leaf Market Revenue (US$ Mn) Comparison By Application (2016-2032)
- Table 11: Global Bay Leaf Market Revenue (US$ Mn) Comparison By Distribution Channel (2016-2032)
- Table 12: Global Bay Leaf Market Y-o-Y Growth Rate Comparison by Region (2016-2032)
- Table 13: Global Bay Leaf Market Y-o-Y Growth Rate Comparison By Product Type (2016-2032)
- Table 14: Global Bay Leaf Market Y-o-Y Growth Rate Comparison By Form (2016-2032)
- Table 15: Global Bay Leaf Market Y-o-Y Growth Rate Comparison By Application (2016-2032)
- Table 16: Global Bay Leaf Market Y-o-Y Growth Rate Comparison By Distribution Channel (2016-2032)
- Table 17: Global Bay Leaf Market Share Comparison by Region (2016-2032)
- Table 18: Global Bay Leaf Market Share Comparison By Product Type (2016-2032)
- Table 19: Global Bay Leaf Market Share Comparison By Form (2016-2032)
- Table 20: Global Bay Leaf Market Share Comparison By Application (2016-2032)
- Table 21: Global Bay Leaf Market Share Comparison By Distribution Channel (2016-2032)
- Table 22: North America Bay Leaf Market Comparison By Form (2016-2032)
- Table 23: North America Bay Leaf Market Comparison By Application (2016-2032)
- Table 24: North America Bay Leaf Market Comparison By Distribution Channel (2016-2032)
- Table 25: North America Bay Leaf Market Revenue (US$ Mn) Comparison by Country (2016-2032)
- Table 26: North America Bay Leaf Market Revenue (US$ Mn) (2016-2032)
- Table 27: North America Bay Leaf Market Revenue (US$ Mn) Comparison by Country (2016-2032)
- Table 28: North America Bay Leaf Market Revenue (US$ Mn) Comparison By Product Type (2016-2032)
- Table 29: North America Bay Leaf Market Revenue (US$ Mn) Comparison By Form (2016-2032)
- Table 30: North America Bay Leaf Market Revenue (US$ Mn) Comparison By Application (2016-2032)
- Table 31: North America Bay Leaf Market Revenue (US$ Mn) Comparison By Distribution Channel (2016-2032)
- Table 32: North America Bay Leaf Market Y-o-Y Growth Rate Comparison by Country (2016-2032)
- Table 33: North America Bay Leaf Market Y-o-Y Growth Rate Comparison By Product Type (2016-2032)
- Table 34: North America Bay Leaf Market Y-o-Y Growth Rate Comparison By Form (2016-2032)
- Table 35: North America Bay Leaf Market Y-o-Y Growth Rate Comparison By Application (2016-2032)
- Table 36: North America Bay Leaf Market Y-o-Y Growth Rate Comparison By Distribution Channel (2016-2032)
- Table 37: North America Bay Leaf Market Share Comparison by Country (2016-2032)
- Table 38: North America Bay Leaf Market Share Comparison By Product Type (2016-2032)
- Table 39: North America Bay Leaf Market Share Comparison By Form (2016-2032)
- Table 40: North America Bay Leaf Market Share Comparison By Application (2016-2032)
- Table 41: North America Bay Leaf Market Share Comparison By Distribution Channel (2016-2032)
- Table 42: Western Europe Bay Leaf Market Comparison By Product Type (2016-2032)
- Table 43: Western Europe Bay Leaf Market Comparison By Form (2016-2032)
- Table 44: Western Europe Bay Leaf Market Comparison By Application (2016-2032)
- Table 45: Western Europe Bay Leaf Market Comparison By Distribution Channel (2016-2032)
- Table 46: Western Europe Bay Leaf Market Revenue (US$ Mn) Comparison by Country (2016-2032)
- Table 47: Western Europe Bay Leaf Market Revenue (US$ Mn) (2016-2032)
- Table 48: Western Europe Bay Leaf Market Revenue (US$ Mn) Comparison by Country (2016-2032)
- Table 49: Western Europe Bay Leaf Market Revenue (US$ Mn) Comparison By Product Type (2016-2032)
- Table 50: Western Europe Bay Leaf Market Revenue (US$ Mn) Comparison By Form (2016-2032)
- Table 51: Western Europe Bay Leaf Market Revenue (US$ Mn) Comparison By Application (2016-2032)
- Table 52: Western Europe Bay Leaf Market Revenue (US$ Mn) Comparison By Distribution Channel (2016-2032)
- Table 53: Western Europe Bay Leaf Market Y-o-Y Growth Rate Comparison by Country (2016-2032)
- Table 54: Western Europe Bay Leaf Market Y-o-Y Growth Rate Comparison By Product Type (2016-2032)
- Table 55: Western Europe Bay Leaf Market Y-o-Y Growth Rate Comparison By Form (2016-2032)
- Table 56: Western Europe Bay Leaf Market Y-o-Y Growth Rate Comparison By Application (2016-2032)
- Table 57: Western Europe Bay Leaf Market Y-o-Y Growth Rate Comparison By Distribution Channel (2016-2032)
- Table 58: Western Europe Bay Leaf Market Share Comparison by Country (2016-2032)
- Table 59: Western Europe Bay Leaf Market Share Comparison By Product Type (2016-2032)
- Table 60: Western Europe Bay Leaf Market Share Comparison By Form (2016-2032)
- Table 61: Western Europe Bay Leaf Market Share Comparison By Application (2016-2032)
- Table 62: Western Europe Bay Leaf Market Share Comparison By Distribution Channel (2016-2032)
- Table 63: Eastern Europe Bay Leaf Market Comparison By Product Type (2016-2032)
- Table 64: Eastern Europe Bay Leaf Market Comparison By Form (2016-2032)
- Table 65: Eastern Europe Bay Leaf Market Comparison By Application (2016-2032)
- Table 66: Eastern Europe Bay Leaf Market Comparison By Distribution Channel (2016-2032)
- Table 67: Eastern Europe Bay Leaf Market Revenue (US$ Mn) Comparison by Country (2016-2032)
- Table 68: Eastern Europe Bay Leaf Market Revenue (US$ Mn) (2016-2032)
- Table 69: Eastern Europe Bay Leaf Market Revenue (US$ Mn) Comparison by Country (2016-2032)
- Table 70: Eastern Europe Bay Leaf Market Revenue (US$ Mn) Comparison By Product Type (2016-2032)
- Table 71: Eastern Europe Bay Leaf Market Revenue (US$ Mn) Comparison By Form (2016-2032)
- Table 72: Eastern Europe Bay Leaf Market Revenue (US$ Mn) Comparison By Application (2016-2032)
- Table 73: Eastern Europe Bay Leaf Market Revenue (US$ Mn) Comparison By Distribution Channel (2016-2032)
- Table 74: Eastern Europe Bay Leaf Market Y-o-Y Growth Rate Comparison by Country (2016-2032)
- Table 75: Eastern Europe Bay Leaf Market Y-o-Y Growth Rate Comparison By Product Type (2016-2032)
- Table 76: Eastern Europe Bay Leaf Market Y-o-Y Growth Rate Comparison By Form (2016-2032)
- Table 77: Eastern Europe Bay Leaf Market Y-o-Y Growth Rate Comparison By Application (2016-2032)
- Table 78: Eastern Europe Bay Leaf Market Y-o-Y Growth Rate Comparison By Distribution Channel (2016-2032)
- Table 79: Eastern Europe Bay Leaf Market Share Comparison by Country (2016-2032)
- Table 80: Eastern Europe Bay Leaf Market Share Comparison By Product Type (2016-2032)
- Table 81: Eastern Europe Bay Leaf Market Share Comparison By Form (2016-2032)
- Table 82: Eastern Europe Bay Leaf Market Share Comparison By Application (2016-2032)
- Table 83: Eastern Europe Bay Leaf Market Share Comparison By Distribution Channel (2016-2032)
- Table 84: APAC Bay Leaf Market Comparison By Product Type (2016-2032)
- Table 85: APAC Bay Leaf Market Comparison By Form (2016-2032)
- Table 86: APAC Bay Leaf Market Comparison By Application (2016-2032)
- Table 87: APAC Bay Leaf Market Comparison By Distribution Channel (2016-2032)
- Table 88: APAC Bay Leaf Market Revenue (US$ Mn) Comparison by Country (2016-2032)
- Table 89: APAC Bay Leaf Market Revenue (US$ Mn) (2016-2032)
- Table 90: APAC Bay Leaf Market Revenue (US$ Mn) Comparison by Country (2016-2032)
- Table 91: APAC Bay Leaf Market Revenue (US$ Mn) Comparison By Product Type (2016-2032)
- Table 92: APAC Bay Leaf Market Revenue (US$ Mn) Comparison By Form (2016-2032)
- Table 93: APAC Bay Leaf Market Revenue (US$ Mn) Comparison By Application (2016-2032)
- Table 94: APAC Bay Leaf Market Revenue (US$ Mn) Comparison By Distribution Channel (2016-2032)
- Table 95: APAC Bay Leaf Market Y-o-Y Growth Rate Comparison by Country (2016-2032)
- Table 96: APAC Bay Leaf Market Y-o-Y Growth Rate Comparison By Product Type (2016-2032)
- Table 97: APAC Bay Leaf Market Y-o-Y Growth Rate Comparison By Form (2016-2032)
- Table 98: APAC Bay Leaf Market Y-o-Y Growth Rate Comparison By Application (2016-2032)
- Table 99: APAC Bay Leaf Market Y-o-Y Growth Rate Comparison By Distribution Channel (2016-2032)
- Table 100: APAC Bay Leaf Market Share Comparison by Country (2016-2032)
- Table 101: APAC Bay Leaf Market Share Comparison By Product Type (2016-2032)
- Table 102: APAC Bay Leaf Market Share Comparison By Form (2016-2032)
- Table 103: APAC Bay Leaf Market Share Comparison By Application (2016-2032)
- Table 104: APAC Bay Leaf Market Share Comparison By Distribution Channel (2016-2032)
- Table 105: Latin America Bay Leaf Market Comparison By Product Type (2016-2032)
- Table 106: Latin America Bay Leaf Market Comparison By Form (2016-2032)
- Table 107: Latin America Bay Leaf Market Comparison By Application (2016-2032)
- Table 108: Latin America Bay Leaf Market Comparison By Distribution Channel (2016-2032)
- Table 109: Latin America Bay Leaf Market Revenue (US$ Mn) Comparison by Country (2016-2032)
- Table 110: Latin America Bay Leaf Market Revenue (US$ Mn) (2016-2032)
- Table 111: Latin America Bay Leaf Market Revenue (US$ Mn) Comparison by Country (2016-2032)
- Table 112: Latin America Bay Leaf Market Revenue (US$ Mn) Comparison By Product Type (2016-2032)
- Table 113: Latin America Bay Leaf Market Revenue (US$ Mn) Comparison By Form (2016-2032)
- Table 114: Latin America Bay Leaf Market Revenue (US$ Mn) Comparison By Application (2016-2032)
- Table 115: Latin America Bay Leaf Market Revenue (US$ Mn) Comparison By Distribution Channel (2016-2032)
- Table 116: Latin America Bay Leaf Market Y-o-Y Growth Rate Comparison by Country (2016-2032)
- Table 117: Latin America Bay Leaf Market Y-o-Y Growth Rate Comparison By Product Type (2016-2032)
- Table 118: Latin America Bay Leaf Market Y-o-Y Growth Rate Comparison By Form (2016-2032)
- Table 119: Latin America Bay Leaf Market Y-o-Y Growth Rate Comparison By Application (2016-2032)
- Table 120: Latin America Bay Leaf Market Y-o-Y Growth Rate Comparison By Distribution Channel (2016-2032)
- Table 121: Latin America Bay Leaf Market Share Comparison by Country (2016-2032)
- Table 122: Latin America Bay Leaf Market Share Comparison By Product Type (2016-2032)
- Table 123: Latin America Bay Leaf Market Share Comparison By Form (2016-2032)
- Table 124: Latin America Bay Leaf Market Share Comparison By Application (2016-2032)
- Table 125: Latin America Bay Leaf Market Share Comparison By Distribution Channel (2016-2032)
- Table 126: Middle East & Africa Bay Leaf Market Comparison By Product Type (2016-2032)
- Table 127: Middle East & Africa Bay Leaf Market Comparison By Form (2016-2032)
- Table 128: Middle East & Africa Bay Leaf Market Comparison By Application (2016-2032)
- Table 129: Middle East & Africa Bay Leaf Market Comparison By Distribution Channel (2016-2032)
- Table 130: Middle East & Africa Bay Leaf Market Revenue (US$ Mn) Comparison by Country (2016-2032)
- Table 131: Middle East & Africa Bay Leaf Market Revenue (US$ Mn) (2016-2032)
- Table 132: Middle East & Africa Bay Leaf Market Revenue (US$ Mn) Comparison by Country (2016-2032)
- Table 133: Middle East & Africa Bay Leaf Market Revenue (US$ Mn) Comparison By Product Type (2016-2032)
- Table 134: Middle East & Africa Bay Leaf Market Revenue (US$ Mn) Comparison By Form (2016-2032)
- Table 135: Middle East & Africa Bay Leaf Market Revenue (US$ Mn) Comparison By Application (2016-2032)
- Table 136: Middle East & Africa Bay Leaf Market Revenue (US$ Mn) Comparison By Distribution Channel (2016-2032)
- Table 137: Middle East & Africa Bay Leaf Market Y-o-Y Growth Rate Comparison by Country (2016-2032)
- Table 138: Middle East & Africa Bay Leaf Market Y-o-Y Growth Rate Comparison By Product Type (2016-2032)
- Table 139: Middle East & Africa Bay Leaf Market Y-o-Y Growth Rate Comparison By Form (2016-2032)
- Table 140: Middle East & Africa Bay Leaf Market Y-o-Y Growth Rate Comparison By Application (2016-2032)
- Table 141: Middle East & Africa Bay Leaf Market Y-o-Y Growth Rate Comparison By Distribution Channel (2016-2032)
- Table 142: Middle East & Africa Bay Leaf Market Share Comparison by Country (2016-2032)
- Table 143: Middle East & Africa Bay Leaf Market Share Comparison By Product Type (2016-2032)
- Table 144: Middle East & Africa Bay Leaf Market Share Comparison By Form (2016-2032)
- Table 145: Middle East & Africa Bay Leaf Market Share Comparison By Application (2016-2032)
- Table 146: Middle East & Africa Bay Leaf Market Share Comparison By Distribution Channel (2016-2032)
- 1. Executive Summary
-
- House of Spices (India) Inc.
- Mars Incorporated
- Goya Foods
- Olam International
- McCormick & Company Incorporated
- Frontier Natural Products Co-op Inc.
- Anatoli Spices
- Pacific Spice Company Inc.
- Zizira
- Alpina Organic Company
- Mountain Rose Inc.
- The Spice Hunter Inc.
Our Clients


View Our Licence Options
