
Bamboos Market Report By Species (Phyllostachys, Bambusa, Dendrocalamus, Others), By Application (Construction, Furniture, Pulp & Paper, Textile, Food Products, Bioenergy, Others), By End-User (Residential, Commercial, Industrial), By Distribution Channel (Direct Sales, Online Stores, Offline Stores [Supermarkets/Hypermarkets, Specialty Stores, Others]), By Region and Companies - Industry Segment Outlook, Market Assessment, Competition Scenario, Trends and Forecast 2024-2033
-
1917
-
February 2025
-
325
-


-
This report was compiled by Shreyas Rokade Shreyas Rokade is a seasoned Research Analyst with CMFE, bringing extensive expertise in market research and consulting, with a strong background in Chemical Engineering. Correspondence Team Lead-CMFE Linkedin | Detailed Market research Methodology Our methodology involves a mix of primary research, including interviews with leading mental health experts, and secondary research from reputable medical journals and databases. View Detailed Methodology Page
-
Quick Navigation
Report Overview
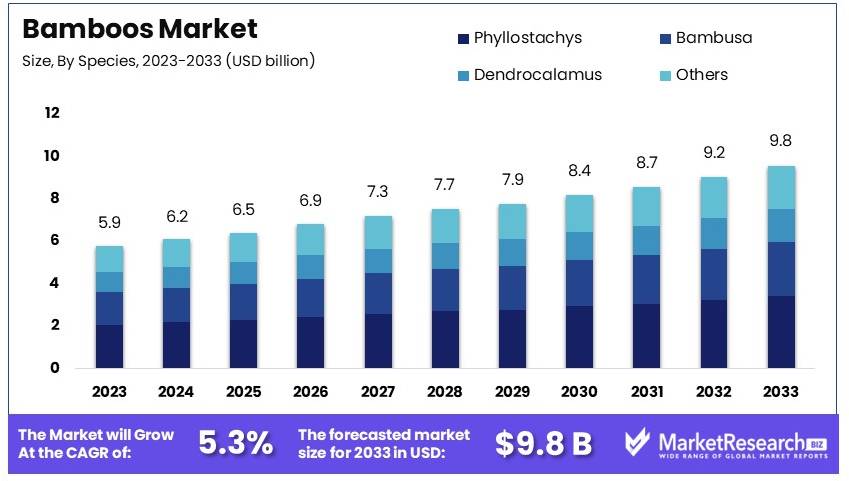
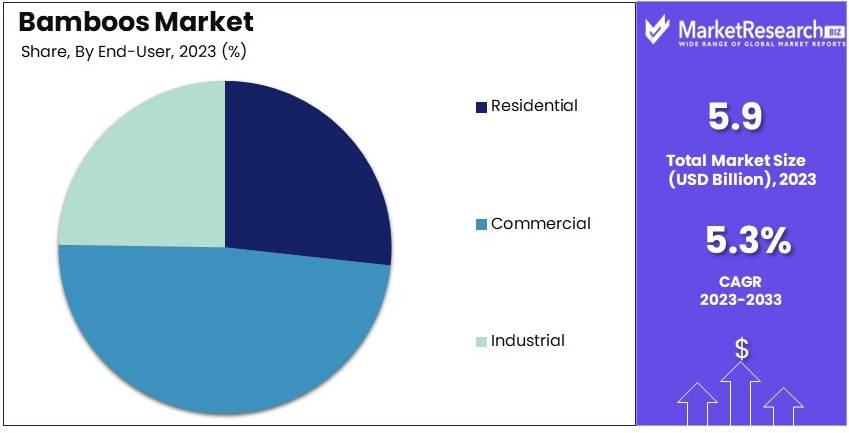
The Global Bamboos Market size is expected to be worth around USD 9.8 Billion by 2033, from USD 5.9 Billion in 2023, growing at a CAGR of 5.3% during the forecast period from 2024 to 2033.
Bamboos are fast-growing, woody plants from the grass family, known for their versatility and sustainability. They are found in diverse climates, from tropical to temperate regions, and are valued for their strength, flexibility, and rapid growth rate. Bamboo has numerous applications, from construction and furniture making to paper production and textiles. Additionally, bamboo is used in the creation of eco-friendly products, such as biodegradable utensils and packaging, making it a popular choice in the growing market for sustainable materials.
Bamboo Market refers to the global industry surrounding the cultivation, processing, and trade of bamboo products. The market includes raw bamboo for construction, bamboo-based products like furniture and textiles, as well as innovative uses such as bamboo in bioplastics, flooring, and even food and beverages. With increasing interest in sustainable, eco-friendly alternatives, the bamboo market has seen considerable growth. It is driven by factors such as growing environmental awareness, rising demand for green building materials, and innovations in bamboo-based consumer goods.
Several factors are fueling the growth of the bamboo market. One of the primary drivers is the increasing demand for sustainable products in industries like construction, textiles, and packaging. Bamboo’s ability to grow quickly and regenerate without replanting makes it a renewable and eco-friendly resource. Additionally, the growing interest in reducing carbon footprints and deforestation has led to greater adoption of bamboo as a substitute for wood and plastic. The rise in consumer awareness about environmental issues and a shift towards eco-conscious living are pushing both manufacturers and consumers to turn to bamboo as a preferred material.
The demand for bamboo products is particularly strong in emerging economies in Asia and Africa, where bamboo is traditionally used in construction and handicrafts. In developed markets like North America and Europe, demand is growing for bamboo-based alternatives in industries such as textiles, furniture, and packaging. Consumers are increasingly drawn to bamboo for its eco-friendly properties and versatility. Additionally, the demand for bamboo in the wellness and lifestyle sectors, such as bamboo-based skincare products, is rising, especially among younger generations looking for sustainable alternatives.
There is a significant opportunity in the bamboo market for innovation and market expansion. As consumers continue to prioritize sustainability, companies can explore new uses for bamboo in diverse industries, such as eco-friendly packaging and biodegradable products. The rising trend of green building and sustainable construction materials presents a major opportunity for bamboo as a substitute for traditional timber. Additionally, expanding into new geographic regions and strengthening supply chains can help meet the growing global demand for bamboo products.
Key Takeaways
- Market Value: The Bamboos Market was valued at USD 5.9 billion in 2023 and is expected to grow to USD 9.8 billion by 2033, with a CAGR of 5.3%.
- Species Analysis: Phyllostachys holds a major share at 34.3%; widely used due to its versatility.
- Application Analysis: Construction is the leading application at 36.4%; bamboo's strength and sustainability drive this trend.
- End User Analysis: Commercial users dominate at 48.9%; extensive use in construction and decor.
- Distribution Channel Analysis: Offline Stores are the predominant channel at 53.2%; offering direct access to various products.
- Dominant Region: North America is prominent at 42.5%; increasing adoption in sustainable building materials.
Driving Factors
Sustainable Construction Materials Drive Market Growth
The construction industry's shift towards sustainable materials is significantly boosting the demand for bamboo. As an eco-friendly alternative to traditional wood, bamboo offers a rapid growth rate and impressive strength. This makes it an attractive option for green building projects. For instance, the International Bamboo and Rattan Organisation (INBAR) highlights bamboo housing projects in countries like Ethiopia, demonstrating bamboo's viability in sustainable construction.
Bamboo's environmental benefits, such as its ability to sequester carbon and its renewable nature, align well with the construction industry's increasing focus on sustainability. This trend is further enhanced by government policies promoting green building practices and the use of sustainable materials. The combined impact of these factors is driving the adoption of bamboo in construction, contributing to market growth.
Expanding Textile Applications Drive Market Growth
Bamboo fiber's unique properties are driving its increased use in the textile industry. Known for its softness, breathability, and antibacterial qualities, bamboo fiber is becoming popular in clothing and bedding. Companies like Ettitude have successfully built their brands around bamboo-based products, capitalizing on the material's eco-friendly appeal and comfort.
This trend is supported by growing consumer demand for sustainable and high-quality textiles. As more people seek out environmentally friendly options, bamboo's natural benefits make it a preferred choice. Additionally, advancements in textile processing technologies are enhancing the quality and versatility of bamboo fabrics, further expanding their applications.
Growing Demand in the Paper and Pulp Industry Drives Market Growth
The rising concerns over deforestation are prompting the paper and pulp industry to seek alternatives to wood pulp, boosting the demand for bamboo. Bamboo's rapid growth and high yield make it an excellent substitute for traditional wood sources. Companies like Chengdu Grace Bamboo Products in China have successfully produced high-quality paper from pulp, demonstrating its viability.
This shift is crucial as it addresses environmental concerns while meeting the industry's needs for sustainable raw materials. The increasing adoption of bamboo in paper production aligns with global efforts to reduce deforestation and promote eco-friendly practices. This interaction between environmental sustainability and industrial demand is propelling the growth of the bamboo market.
Restraining Factors
Limited Large-Scale Cultivation Restrains Market Growth
Limited large-scale cultivation of bamboo is a significant restraint on the market. Despite bamboo's rapid growth, industrial-scale cultivation is restricted in many regions. In the United States, bamboo farming is still developing, resulting in a limited domestic supply for manufacturers.
This constraint affects the availability of raw bamboo, making it difficult to meet the growing demand. Manufacturers rely on imports, which can be costly and time-consuming. The limited cultivation impacts the scalability and competitiveness of bamboo products in the market.
Processing and Treatment Challenges Restrain Market Growth
Processing and treatment challenges hinder the growth of the bamboo market. Bamboo requires specific methods to ensure durability and prevent pest infestations, increasing production costs. Companies like Moso International have invested heavily in research and development to address these issues and produce high-quality bamboo products.
The need for specialized processing limits the ability to produce bamboo at scale, affecting supply and market expansion. Higher production costs can lead to higher prices for consumers, potentially reducing demand. These challenges make it difficult for the bamboo market to compete with other materials, limiting its growth potential.
Species Analysis
Phyllostachys dominates with 34.3% due to its versatility and rapid growth.
Phyllostachys species lead the bamboos market, holding a 34.3% share. This dominance is largely due to its versatility and rapid growth rate, making it highly suitable for various commercial applications. Phyllostachys is widely used in both construction and the manufacture of bamboo furniture because of its strength and flexibility.
Bambusa, accounting for 28.7% of the market, is preferred for its aesthetic appeal and is commonly used in decorative applications and landscaping. Dendrocalamus, with a share of 21.9%, is notable for its larger diameter and wall thickness, making it ideal for structural applications and high-strength requirements.
The 'Others' category, which includes less common species like Guadua and Chusquea, contributes to the market's diversity by offering unique properties for specialized applications. Each species plays a critical role in the market, with Phyllostachys leading due to its adaptability and rapid cultivation capabilities, which meet the fast-paced demand of the bamboo industry.
Application Analysis
Construction dominates with 36.4% due to bamboo’s sustainability and structural properties.
The construction sector is the largest application area for bamboos, accounting for 36.4% of the market. This dominance is driven by the increasing adoption of bamboo as a sustainable alternative to traditional building materials like wood and steel. Bamboo is highly appreciated in green building initiatives due to its low carbon footprint and exceptional growth rate, which make it a renewable resource.
Furniture follows with 22.3%, where bamboo's natural aesthetic and strength are highly valued. The Pulp & Paper industry, which utilizes bamboo for its fibrous properties, holds an 18.2% share. Textile applications, making use of bamboo’s soft fibers, account for 12.6% of the market, favored in eco-friendly fabric production.
Food Products and Bioenergy, with shares of 6.7% and 3.8% respectively, explore bamboo's potential in edibles and as a renewable energy source. The 'Others' category includes various innovative applications like medicinal uses and handicrafts.
Construction’s significant share highlights bamboo’s role in sustainable development, while its diverse applications in other sectors underline bamboo’s versatility and expanding market reach.
End-User Analysis
Commercial dominates with 48.9% due to large-scale adoption of bamboo in various industries.
Commercial end-users hold the largest share in the bamboos market at 48.9%, driven by bamboo's broad adoption across industries such as construction, hospitality, and commercial real estate. Commercial projects often utilize bamboo for structural elements, flooring, and interior decorating, capitalizing on its sustainability to enhance building ratings and aesthetic appeal.
Residential applications, which account for 35.6%, include bamboo in furniture, flooring, and landscaping, appreciated for its durability and natural look. Industrial use, though smaller at 15.5%, is growing, particularly in the bioenergy and pulp & paper sectors where bamboo is a key raw material.
The dominance of the commercial sector underscores the wide-scale implementation of bamboo, while the significant contributions from residential and industrial sectors highlight its diverse utility and potential for growth across different market segments.
Distribution Channel Analysis
Offline Stores dominate with 53.2% due to consumer preference for physical product inspection.
Offline Stores are the predominant distribution channel for bamboos, holding a 53.2% market share. This preference is driven by the customer’s desire to physically inspect the quality of bamboo products, especially for applications like furniture and construction materials. Within offline stores, Specialty Stores, which focus on sustainable and natural products, account for the largest share, followed by Supermarkets/Hypermarkets.
Direct Sales, essential for large-scale and custom orders, represent 28.9% of the market. These are particularly relevant for commercial and industrial buyers who require bulk quantities. Online Stores, with an 18.9% share, are growing as consumers become more comfortable purchasing products online, supported by improved logistics and the convenience of home delivery.
The lead of Offline Stores highlights the importance of tactile buying experiences in the bamboo market, while the roles of Direct Sales and Online Stores show a dynamic market adapting to both traditional and modern buying preferences.
Key Market Segments
By Species
- Phyllostachys
- Bambusa
- Dendrocalamus
- Others
By Application
- Construction
- Furniture
- Pulp & Paper
- Textile
- Food Products
- Bioenergy
- Others
By End-User
- Residential
- Commercial
- Industrial
By Distribution Channel
- Direct Sales
- Online Stores
- Offline Stores
- Supermarkets/Hypermarkets
- Specialty Stores
- Others
Growth Opportunities
Bamboo-based Bioenergy Offers Growth Opportunity
The potential of bamboo as a source of bioenergy presents a significant growth opportunity. Bamboo is highly efficient in biomass production, making it a promising resource for biofuel and biomass energy. Research institutions like the International Network for Bamboo and Rattan are actively exploring bamboo's potential in producing bioenergy.
Bamboo's rapid growth rate and high yield make it a sustainable and renewable energy source. By investing in bamboo-based bioenergy, companies can contribute to reducing reliance on fossil fuels, lower carbon emissions, and meet the increasing demand for green energy. This development can drive market expansion and support global sustainability goals.
Bamboo Water Filtration Systems Offer Growth Opportunity
Bamboo's natural filtration properties present a growth opportunity in the water purification sector. Bamboo-based water filtration systems are especially valuable in developing countries, where access to clean water is limited. For instance, the organization Biosfera in Mexico has developed bamboo-based water filters for rural communities.
These systems harness bamboo's ability to remove contaminants from water, providing an affordable and sustainable solution for clean drinking water. The adoption of bamboo water filtration systems can improve public health, support sustainable development, and drive market growth in regions needing effective water purification solutions.
Trending Factors
Bamboo in Food and Beverage Packaging Are Trending Factors
Bamboo is gaining traction as a sustainable alternative to plastic in food and beverage packaging, presenting a trending factor in the market. Companies like Zume have partnered with global brands to create compostable packaging made from bamboo and other plant-based materials.
This trend aligns with the growing consumer demand for eco-friendly products and the global push to reduce plastic waste. By adopting bamboo-based packaging, companies can enhance their sustainability profiles, meet regulatory requirements, and attract environmentally conscious consumers, driving market growth and innovation in packaging solutions.
Bamboo-based Carbon Credits Are Trending Factors
The high carbon sequestration capacity of bamboo forests opens up opportunities in the carbon credit market, making it a trending factor. Bamboo projects, like the Allahabad Bamboo Afforestation Project in India, have successfully registered for carbon credits, showcasing bamboo's potential in climate change mitigation efforts.
Bamboo's rapid growth and ability to absorb significant amounts of carbon dioxide make it an effective tool for reducing greenhouse gases. Participating in carbon credit markets can provide financial incentives for bamboo cultivation, encourage reforestation, and support global efforts to combat climate change, driving the market for bamboo-based carbon credits.
Regional Analysis
North America Dominates with 42.5% Market Share in the Bamboos Market
North America's significant 42.5% share in the global bamboos market is driven by its increasing adoption of sustainable and eco-friendly materials. The region has seen a surge in the use of bamboo for various applications, including construction, textiles, and furniture, due to its durability and sustainability. Additionally, heightened consumer awareness and preferences for green products have propelled the demand for bamboo in North America.
The market dynamics in North America are influenced by robust supply chains and technological innovations that enhance bamboo cultivation and processing. The integration of bamboo in the housing and decor sectors, coupled with its use in innovative niches like bamboo-based fabrics and utensils, supports a growing market. Furthermore, regulatory support for sustainable practices and the establishment of bamboo plantations have fortified the market’s expansion.
Looking forward, North America's dominance in the bamboos market is likely to continue due to ongoing trends towards sustainability and natural products. The region's focus on reducing carbon footprints and enhancing green building standards predicts an increasing use of bamboo. Investment in research for new bamboo applications and improved cultivation techniques may also increase its market share.
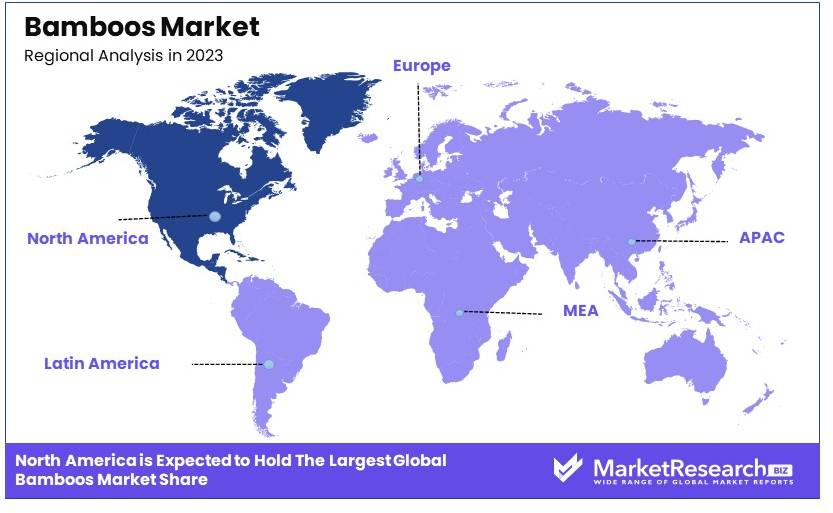
Regional Market Share AnalysisEurope: Europe holds approximately 20% of the global bamboos market. The region's focus on sustainable development and eco-friendly materials drives its market, with increasing use in architectural applications and consumer goods.
Asia Pacific: Commanding about 25% of the market, Asia Pacific benefits from natural bamboo resources and traditional usage. The region’s extensive bamboo forests and longstanding cultural integration of bamboo products fuel its market presence.
Middle East & Africa: This region accounts for around 5% of the market. Although smaller, the market is growing due to the rising interest in sustainable materials and eco-tourism developments that incorporate bamboo structures.
Latin America: Latin America has about 8% of the bamboos market share. The region sees growth driven by its biodiversity and the adoption of bamboo as a key resource in local crafts and building materials, particularly in countries like Brazil and Colombia.
Key Regions and Countries
- North America
- The US
- Canada
- Mexico
- Western Europe
- Germany
- France
- The UK
- Spain
- Italy
- Portugal
- Ireland
- Austria
- Switzerland
- Benelux
- Nordic
- Rest of Western Europe
- Eastern Europe
- Russia
- Poland
- The Czech Republic
- Greece
- Rest of Eastern Europe
- APAC
- China
- Japan
- South Korea
- India
- Australia & New Zealand
- Indonesia
- Malaysia
- Philippines
- Singapore
- Thailand
- Vietnam
- Rest of APAC
- Latin America
- Brazil
- Colombia
- Chile
- Argentina
- Costa Rica
- Rest of Latin America
- Middle East & Africa
- Algeria
- Egypt
- Israel
- Kuwait
- Nigeria
- Saudi Arabia
- South Africa
- Turkey
- United Arab Emirates
- Rest of MEA
Key Players Analysis
The bamboo market features key players driving innovation and market growth through sustainable practices and diverse product offerings. Moso International B.V. leads with its high-quality bamboo products, emphasizing sustainability and environmental benefits. Bamboo Village Company Limited and Kerala State Bamboo Corporation Ltd. are significant players in Asia, focusing on traditional and modern bamboo applications.
Jiangxi Shanyou Industry Co., Ltd. and Shanghai Tenbro Bamboo Textile Co., Ltd. leverage advanced manufacturing processes to produce durable bamboo textiles and materials. Bamboo Australia Pty Ltd. and Dasso Industrial Group Co., Ltd. emphasize eco-friendly solutions, expanding bamboo's market presence in construction and design.
EcoPlanet Bamboo and Fujian Jianou Huayu Bamboo Industry Co., Ltd. focus on large-scale bamboo plantations and industrial applications. Anji Tianzhen Bamboo Flooring Co., Ltd. and Teragren LLC specialize in bamboo flooring and home products, highlighting bamboo's versatility and sustainability.
Smith & Fong Company and Zhejiang Xinyuan Bamboo Products Co., Ltd. innovate in bamboo product development, driving market growth. Kanger International Berhad and CBG Bamboo expand bamboo's global reach through diverse product lines and strategic market positioning. These companies collectively enhance the bamboo market's potential through sustainability and innovation.
Market Key Players
- Moso International B.V.
- Bamboo Village Company Limited
- Kerala State Bamboo Corporation Ltd.
- Jiangxi Shanyou Industry Co., Ltd.
- Shanghai Tenbro Bamboo Textile Co., Ltd.
- Bamboo Australia Pty Ltd.
- Dasso Industrial Group Co., Ltd.
- EcoPlanet Bamboo
- Fujian Jianou Huayu Bamboo Industry Co., Ltd.
- Anji Tianzhen Bamboo Flooring Co., Ltd.
- Teragren LLC
- Smith & Fong Company
- Zhejiang Xinyuan Bamboo Products Co., Ltd.
- Kanger International Berhad
- CBG Bamboo
Recent Developments
- 2024: Valmet has announced its strategic focus on developing cellulose-based textile fibers, leveraging its pulp and papermaking technology. The company sees significant business potential in sustainable textiles, aligning with its mission to convert renewable resources into sustainable results. This initiative is expected to drive revenue growth as the demand for eco-friendly textiles increases.
- 2024: The bamboo pulp production capacity in China has reached 2.4 million tons, with a substantial portion dedicated to household paper products. This growth is supported by government initiatives and increasing consumer preference for sustainable products. The financial success of bamboo pulp products in China underscores the material's commercial viability.
Report Scope
Report Features Description Market Value (2023) USD 5.9 Billion Forecast Revenue (2033) USD 9.8 Billion CAGR (2024-2033) 5.3% Base Year for Estimation 2023 Historic Period 2018-2023 Forecast Period 2024-2033 Report Coverage Revenue Forecast, Market Dynamics, Competitive Landscape, Recent Developments Segments Covered By Species (Phyllostachys, Bambusa, Dendrocalamus, Others), By Application (Construction, Furniture, Pulp & Paper, Textile, Food Products, Bioenergy, Others), By End-User (Residential, Commercial, Industrial), By Distribution Channel (Direct Sales, Online Stores, Offline Stores [Supermarkets/Hypermarkets, Specialty Stores, Others]) Regional Analysis North America - The US, Canada, & Mexico; Western Europe - Germany, France, The UK, Spain, Italy, Portugal, Ireland, Austria, Switzerland, Benelux, Nordic, & Rest of Western Europe; Eastern Europe - Russia, Poland, The Czech Republic, Greece, & Rest of Eastern Europe; APAC - China, Japan, South Korea, India, Australia & New Zealand, Indonesia, Malaysia, Philippines, Singapore, Thailand, Vietnam, & Rest of APAC; Latin America - Brazil, Colombia, Chile, Argentina, Costa Rica, & Rest of Latin America; Middle East & Africa - Algeria, Egypt, Israel, Kuwait, Nigeria, Saudi Arabia, South Africa, Turkey, United Arab Emirates, & Rest of MEA Competitive Landscape Moso International B.V., Bamboo Village Company Limited, Kerala State Bamboo Corporation Ltd., Jiangxi Shanyou Industry Co., Ltd., Shanghai Tenbro Bamboo Textile Co., Ltd., Bamboo Australia Pty Ltd., Dasso Industrial Group Co., Ltd., EcoPlanet Bamboo, Fujian Jianou Huayu Bamboo Industry Co., Ltd., Anji Tianzhen Bamboo Flooring Co., Ltd., Teragren LLC, Smith & Fong Company, Zhejiang Xinyuan Bamboo Products Co., Ltd., Kanger International Berhad, CBG Bamboo Customization Scope Customization for segments, region/country-level will be provided. Moreover, additional customization can be done based on the requirements. Purchase Options We have three licenses to opt for: Single User License, Multi-User License (Up to 5 Users), Corporate Use License (Unlimited User and Printable PDF) -
- 1. Executive Summary
- 1.1. Definition
- 1.2. Taxonomy
- 1.3. Research Scope
- 1.4. Key Analysis
- 1.5. Key Findings by Major Segments
- 1.6. Top strategies by Major Players
- 2. Global Bamboos Market Overview
- 2.1. Bamboos Market Dynamics
- 2.1.1. Drivers
- 2.1.2. Opportunities
- 2.1.3. Restraints
- 2.1.4. Challenges
- 2.2. Macro-economic Factors
- 2.3. Regulatory Framework
- 2.4. Market Investment Feasibility Index
- 2.5. PEST Analysis
- 2.6. PORTER’S Five Force Analysis
- 2.7. Drivers & Restraints Impact Analysis
- 2.8. Industry Chain Analysis
- 2.9. Cost Structure Analysis
- 2.10. Marketing Strategy
- 2.11. Russia-Ukraine War Impact Analysis
- 2.12. Opportunity Map Analysis
- 2.13. Market Competition Scenario Analysis
- 2.14. Product Life Cycle Analysis
- 2.15. Opportunity Orbits
- 2.16. Manufacturer Intensity Map
- 2.17. Major Companies sales by Value & Volume
- 2.1. Bamboos Market Dynamics
- 3. Global Bamboos Market Analysis, Opportunity and Forecast, 2016-2032
- 3.1. Global Bamboos Market Analysis, 2016-2021
- 3.2. Global Bamboos Market Opportunity and Forecast, 2023-2032
- 3.3. Global Bamboos Market Analysis, Opportunity and Forecast, By By End User, 2016-2032
- 3.3.1. Global Bamboos Market Analysis by By End User: Introduction
- 3.3.2. Market Size Absolute $ Opportunity Analysis and Forecast, By By End User, 2016-2032
- 3.3.3. Construction
- 3.3.4. Furniture
- 3.3.5. Paper and Pulp
- 3.3.6. Textile
- 3.3.7. Medical
- 3.3.8. Agriculture
- 4. North America Bamboos Market Analysis, Opportunity and Forecast, 2016-2032
- 4.1. North America Bamboos Market Analysis, 2016-2021
- 4.2. North America Bamboos Market Opportunity and Forecast, 2023-2032
- 4.3. North America Bamboos Market Analysis, Opportunity and Forecast, By By End User, 2016-2032
- 4.3.1. North America Bamboos Market Analysis by By End User: Introduction
- 4.3.2. Market Size Absolute $ Opportunity Analysis and Forecast, By By End User, 2016-2032
- 4.3.3. Construction
- 4.3.4. Furniture
- 4.3.5. Paper and Pulp
- 4.3.6. Textile
- 4.3.7. Medical
- 4.3.8. Agriculture
- 4.4. North America Bamboos Market Analysis, Opportunity and Forecast, By Country , 2016-2032
- 4.4.1. North America Bamboos Market Analysis by Country : Introduction
- 4.4.2. Market Size Absolute $ Opportunity Analysis and Forecast, Country , 2016-2032
- 4.4.2.1. The US
- 4.4.2.2. Canada
- 4.4.2.3. Mexico
- 5. Western Europe Bamboos Market Analysis, Opportunity and Forecast, 2016-2032
- 5.1. Western Europe Bamboos Market Analysis, 2016-2021
- 5.2. Western Europe Bamboos Market Opportunity and Forecast, 2023-2032
- 5.3. Western Europe Bamboos Market Analysis, Opportunity and Forecast, By By End User, 2016-2032
- 5.3.1. Western Europe Bamboos Market Analysis by By End User: Introduction
- 5.3.2. Market Size Absolute $ Opportunity Analysis and Forecast, By By End User, 2016-2032
- 5.3.3. Construction
- 5.3.4. Furniture
- 5.3.5. Paper and Pulp
- 5.3.6. Textile
- 5.3.7. Medical
- 5.3.8. Agriculture
- 5.4. Western Europe Bamboos Market Analysis, Opportunity and Forecast, By Country , 2016-2032
- 5.4.1. Western Europe Bamboos Market Analysis by Country : Introduction
- 5.4.2. Market Size Absolute $ Opportunity Analysis and Forecast, Country , 2016-2032
- 5.4.2.1. Germany
- 5.4.2.2. France
- 5.4.2.3. The UK
- 5.4.2.4. Spain
- 5.4.2.5. Italy
- 5.4.2.6. Portugal
- 5.4.2.7. Ireland
- 5.4.2.8. Austria
- 5.4.2.9. Switzerland
- 5.4.2.10. Benelux
- 5.4.2.11. Nordic
- 5.4.2.12. Rest of Western Europe
- 6. Eastern Europe Bamboos Market Analysis, Opportunity and Forecast, 2016-2032
- 6.1. Eastern Europe Bamboos Market Analysis, 2016-2021
- 6.2. Eastern Europe Bamboos Market Opportunity and Forecast, 2023-2032
- 6.3. Eastern Europe Bamboos Market Analysis, Opportunity and Forecast, By By End User, 2016-2032
- 6.3.1. Eastern Europe Bamboos Market Analysis by By End User: Introduction
- 6.3.2. Market Size Absolute $ Opportunity Analysis and Forecast, By By End User, 2016-2032
- 6.3.3. Construction
- 6.3.4. Furniture
- 6.3.5. Paper and Pulp
- 6.3.6. Textile
- 6.3.7. Medical
- 6.3.8. Agriculture
- 6.4. Eastern Europe Bamboos Market Analysis, Opportunity and Forecast, By Country , 2016-2032
- 6.4.1. Eastern Europe Bamboos Market Analysis by Country : Introduction
- 6.4.2. Market Size Absolute $ Opportunity Analysis and Forecast, Country , 2016-2032
- 6.4.2.1. Russia
- 6.4.2.2. Poland
- 6.4.2.3. The Czech Republic
- 6.4.2.4. Greece
- 6.4.2.5. Rest of Eastern Europe
- 7. APAC Bamboos Market Analysis, Opportunity and Forecast, 2016-2032
- 7.1. APAC Bamboos Market Analysis, 2016-2021
- 7.2. APAC Bamboos Market Opportunity and Forecast, 2023-2032
- 7.3. APAC Bamboos Market Analysis, Opportunity and Forecast, By By End User, 2016-2032
- 7.3.1. APAC Bamboos Market Analysis by By End User: Introduction
- 7.3.2. Market Size Absolute $ Opportunity Analysis and Forecast, By By End User, 2016-2032
- 7.3.3. Construction
- 7.3.4. Furniture
- 7.3.5. Paper and Pulp
- 7.3.6. Textile
- 7.3.7. Medical
- 7.3.8. Agriculture
- 7.4. APAC Bamboos Market Analysis, Opportunity and Forecast, By Country , 2016-2032
- 7.4.1. APAC Bamboos Market Analysis by Country : Introduction
- 7.4.2. Market Size Absolute $ Opportunity Analysis and Forecast, Country , 2016-2032
- 7.4.2.1. China
- 7.4.2.2. Japan
- 7.4.2.3. South Korea
- 7.4.2.4. India
- 7.4.2.5. Australia & New Zeland
- 7.4.2.6. Indonesia
- 7.4.2.7. Malaysia
- 7.4.2.8. Philippines
- 7.4.2.9. Singapore
- 7.4.2.10. Thailand
- 7.4.2.11. Vietnam
- 7.4.2.12. Rest of APAC
- 8. Latin America Bamboos Market Analysis, Opportunity and Forecast, 2016-2032
- 8.1. Latin America Bamboos Market Analysis, 2016-2021
- 8.2. Latin America Bamboos Market Opportunity and Forecast, 2023-2032
- 8.3. Latin America Bamboos Market Analysis, Opportunity and Forecast, By By End User, 2016-2032
- 8.3.1. Latin America Bamboos Market Analysis by By End User: Introduction
- 8.3.2. Market Size Absolute $ Opportunity Analysis and Forecast, By By End User, 2016-2032
- 8.3.3. Construction
- 8.3.4. Furniture
- 8.3.5. Paper and Pulp
- 8.3.6. Textile
- 8.3.7. Medical
- 8.3.8. Agriculture
- 8.4. Latin America Bamboos Market Analysis, Opportunity and Forecast, By Country , 2016-2032
- 8.4.1. Latin America Bamboos Market Analysis by Country : Introduction
- 8.4.2. Market Size Absolute $ Opportunity Analysis and Forecast, Country , 2016-2032
- 8.4.2.1. Brazil
- 8.4.2.2. Colombia
- 8.4.2.3. Chile
- 8.4.2.4. Argentina
- 8.4.2.5. Costa Rica
- 8.4.2.6. Rest of Latin America
- 9. Middle East & Africa Bamboos Market Analysis, Opportunity and Forecast, 2016-2032
- 9.1. Middle East & Africa Bamboos Market Analysis, 2016-2021
- 9.2. Middle East & Africa Bamboos Market Opportunity and Forecast, 2023-2032
- 9.3. Middle East & Africa Bamboos Market Analysis, Opportunity and Forecast, By By End User, 2016-2032
- 9.3.1. Middle East & Africa Bamboos Market Analysis by By End User: Introduction
- 9.3.2. Market Size Absolute $ Opportunity Analysis and Forecast, By By End User, 2016-2032
- 9.3.3. Construction
- 9.3.4. Furniture
- 9.3.5. Paper and Pulp
- 9.3.6. Textile
- 9.3.7. Medical
- 9.3.8. Agriculture
- 9.4. Middle East & Africa Bamboos Market Analysis, Opportunity and Forecast, By Country , 2016-2032
- 9.4.1. Middle East & Africa Bamboos Market Analysis by Country : Introduction
- 9.4.2. Market Size Absolute $ Opportunity Analysis and Forecast, Country , 2016-2032
- 9.4.2.1. Algeria
- 9.4.2.2. Egypt
- 9.4.2.3. Israel
- 9.4.2.4. Kuwait
- 9.4.2.5. Nigeria
- 9.4.2.6. Saudi Arabia
- 9.4.2.7. South Africa
- 9.4.2.8. Turkey
- 9.4.2.9. The UAE
- 9.4.2.10. Rest of MEA
- 10. Global Bamboos Market Analysis, Opportunity and Forecast, By Region , 2016-2032
- 10.1. Global Bamboos Market Analysis by Region : Introduction
- 10.2. Market Size Absolute $ Opportunity Analysis and Forecast, By Region , 2016-2032
- 10.2.1. North America
- 10.2.2. Western Europe
- 10.2.3. Eastern Europe
- 10.2.4. APAC
- 10.2.5. Latin America
- 10.2.6. Middle East & Africa
- 11. Global Bamboos Market Competitive Landscape, Market Share Analysis, and Company Profiles
- 11.1. Market Share Analysis
- 11.2. Company Profiles
- 11.3. Kerala State Bamboo Corporation Ltd.
- 11.3.1. Company Overview
- 11.3.2. Financial Highlights
- 11.3.3. Product Portfolio
- 11.3.4. SWOT Analysis
- 11.3.5. Key Strategies and Developments
- 11.4. Jiangxi Feiyu Industry Co. Ltd.
- 11.4.1. Company Overview
- 11.4.2. Financial Highlights
- 11.4.3. Product Portfolio
- 11.4.4. SWOT Analysis
- 11.4.5. Key Strategies and Developments
- 11.5. Dasso Industrial Group Co., Ltd.
- 11.5.1. Company Overview
- 11.5.2. Financial Highlights
- 11.5.3. Product Portfolio
- 11.5.4. SWOT Analysis
- 11.5.5. Key Strategies and Developments
- 11.6. Xingli Bamboo Products Company
- 11.6.1. Company Overview
- 11.6.2. Financial Highlights
- 11.6.3. Product Portfolio
- 11.6.4. SWOT Analysis
- 11.6.5. Key Strategies and Developments
- 11.7. China Bambro Textile Company Limited
- 11.7.1. Company Overview
- 11.7.2. Financial Highlights
- 11.7.3. Product Portfolio
- 11.7.4. SWOT Analysis
- 11.7.5. Key Strategies and Developments
- 11.8. Fujian Jianou Huayu Bamboo Industry Co., Ltd.
- 11.8.1. Company Overview
- 11.8.2. Financial Highlights
- 11.8.3. Product Portfolio
- 11.8.4. SWOT Analysis
- 11.8.5. Key Strategies and Developments
- 11.9. Tengda Bamboo-Wood Co.
- 11.9.1. Company Overview
- 11.9.2. Financial Highlights
- 11.9.3. Product Portfolio
- 11.9.4. SWOT Analysis
- 11.9.5. Key Strategies and Developments
- 11.10. Jiangxi Kangda Bamboo Ware Group Co.
- 11.10.1. Company Overview
- 11.10.2. Financial Highlights
- 11.10.3. Product Portfolio
- 11.10.4. SWOT Analysis
- 11.10.5. Key Strategies and Developments
- 11.11. Moso International B.V.
- 11.11.1. Company Overview
- 11.11.2. Financial Highlights
- 11.11.3. Product Portfolio
- 11.11.4. SWOT Analysis
- 11.11.5. Key Strategies and Developments
- 11.12. Bamboo Australia Pty Ltd.
- 11.12.1. Company Overview
- 11.12.2. Financial Highlights
- 11.12.3. Product Portfolio
- 11.12.4. SWOT Analysis
- 11.12.5. Key Strategies and Developments
- 12. Assumptions and Acronyms
- 13. Research Methodology
- 14. Contact
- List of Figures
- Figure 1: Global Bamboos Market Revenue (US$ Mn) Market Share by By End User in 2022
- Figure 2: Global Bamboos Market Attractiveness Analysis by By End User, 2016-2032
- Figure 3: Global Bamboos Market Revenue (US$ Mn) Market Share by Region in 2022
- Figure 4: Global Bamboos Market Attractiveness Analysis by Region, 2016-2032
- Figure 5: Global Bamboos Market Revenue (US$ Mn) (2016-2032)
- Figure 6: Global Bamboos Market Revenue (US$ Mn) Comparison by Region (2016-2032)
- Figure 7: Global Bamboos Market Revenue (US$ Mn) Comparison by By End User (2016-2032)
- Figure 8: Global Bamboos Market Y-o-Y Growth Rate Comparison by Region (2016-2032)
- Figure 9: Global Bamboos Market Y-o-Y Growth Rate Comparison by By End User (2016-2032)
- Figure 10: Global Bamboos Market Share Comparison by Region (2016-2032)
- Figure 11: Global Bamboos Market Share Comparison by By End User (2016-2032)
- Figure 12: North America Bamboos Market Revenue (US$ Mn) Market Share by By End Userin 2022
- Figure 13: North America Bamboos Market Attractiveness Analysis by By End User, 2016-2032
- Figure 14: North America Bamboos Market Revenue (US$ Mn) Market Share by Country in 2022
- Figure 15: North America Bamboos Market Attractiveness Analysis by Country, 2016-2032
- Figure 16: North America Bamboos Market Revenue (US$ Mn) (2016-2032)
- Figure 17: North America Bamboos Market Revenue (US$ Mn) Comparison by Country (2016-2032)
- Figure 18: North America Bamboos Market Revenue (US$ Mn) Comparison by By End User (2016-2032)
- Figure 19: North America Bamboos Market Y-o-Y Growth Rate Comparison by Country (2016-2032)
- Figure 20: North America Bamboos Market Y-o-Y Growth Rate Comparison by By End User (2016-2032)
- Figure 21: North America Bamboos Market Share Comparison by Country (2016-2032)
- Figure 22: North America Bamboos Market Share Comparison by By End User (2016-2032)
- Figure 23: Western Europe Bamboos Market Revenue (US$ Mn) Market Share by By End Userin 2022
- Figure 24: Western Europe Bamboos Market Attractiveness Analysis by By End User, 2016-2032
- Figure 25: Western Europe Bamboos Market Revenue (US$ Mn) Market Share by Country in 2022
- Figure 26: Western Europe Bamboos Market Attractiveness Analysis by Country, 2016-2032
- Figure 27: Western Europe Bamboos Market Revenue (US$ Mn) (2016-2032)
- Figure 28: Western Europe Bamboos Market Revenue (US$ Mn) Comparison by Country (2016-2032)
- Figure 29: Western Europe Bamboos Market Revenue (US$ Mn) Comparison by By End User (2016-2032)
- Figure 30: Western Europe Bamboos Market Y-o-Y Growth Rate Comparison by Country (2016-2032)
- Figure 31: Western Europe Bamboos Market Y-o-Y Growth Rate Comparison by By End User (2016-2032)
- Figure 32: Western Europe Bamboos Market Share Comparison by Country (2016-2032)
- Figure 33: Western Europe Bamboos Market Share Comparison by By End User (2016-2032)
- Figure 34: Eastern Europe Bamboos Market Revenue (US$ Mn) Market Share by By End Userin 2022
- Figure 35: Eastern Europe Bamboos Market Attractiveness Analysis by By End User, 2016-2032
- Figure 36: Eastern Europe Bamboos Market Revenue (US$ Mn) Market Share by Country in 2022
- Figure 37: Eastern Europe Bamboos Market Attractiveness Analysis by Country, 2016-2032
- Figure 38: Eastern Europe Bamboos Market Revenue (US$ Mn) (2016-2032)
- Figure 39: Eastern Europe Bamboos Market Revenue (US$ Mn) Comparison by Country (2016-2032)
- Figure 40: Eastern Europe Bamboos Market Revenue (US$ Mn) Comparison by By End User (2016-2032)
- Figure 41: Eastern Europe Bamboos Market Y-o-Y Growth Rate Comparison by Country (2016-2032)
- Figure 42: Eastern Europe Bamboos Market Y-o-Y Growth Rate Comparison by By End User (2016-2032)
- Figure 43: Eastern Europe Bamboos Market Share Comparison by Country (2016-2032)
- Figure 44: Eastern Europe Bamboos Market Share Comparison by By End User (2016-2032)
- Figure 45: APAC Bamboos Market Revenue (US$ Mn) Market Share by By End Userin 2022
- Figure 46: APAC Bamboos Market Attractiveness Analysis by By End User, 2016-2032
- Figure 47: APAC Bamboos Market Revenue (US$ Mn) Market Share by Country in 2022
- Figure 48: APAC Bamboos Market Attractiveness Analysis by Country, 2016-2032
- Figure 49: APAC Bamboos Market Revenue (US$ Mn) (2016-2032)
- Figure 50: APAC Bamboos Market Revenue (US$ Mn) Comparison by Country (2016-2032)
- Figure 51: APAC Bamboos Market Revenue (US$ Mn) Comparison by By End User (2016-2032)
- Figure 52: APAC Bamboos Market Y-o-Y Growth Rate Comparison by Country (2016-2032)
- Figure 53: APAC Bamboos Market Y-o-Y Growth Rate Comparison by By End User (2016-2032)
- Figure 54: APAC Bamboos Market Share Comparison by Country (2016-2032)
- Figure 55: APAC Bamboos Market Share Comparison by By End User (2016-2032)
- Figure 56: Latin America Bamboos Market Revenue (US$ Mn) Market Share by By End Userin 2022
- Figure 57: Latin America Bamboos Market Attractiveness Analysis by By End User, 2016-2032
- Figure 58: Latin America Bamboos Market Revenue (US$ Mn) Market Share by Country in 2022
- Figure 59: Latin America Bamboos Market Attractiveness Analysis by Country, 2016-2032
- Figure 60: Latin America Bamboos Market Revenue (US$ Mn) (2016-2032)
- Figure 61: Latin America Bamboos Market Revenue (US$ Mn) Comparison by Country (2016-2032)
- Figure 62: Latin America Bamboos Market Revenue (US$ Mn) Comparison by By End User (2016-2032)
- Figure 63: Latin America Bamboos Market Y-o-Y Growth Rate Comparison by Country (2016-2032)
- Figure 64: Latin America Bamboos Market Y-o-Y Growth Rate Comparison by By End User (2016-2032)
- Figure 65: Latin America Bamboos Market Share Comparison by Country (2016-2032)
- Figure 66: Latin America Bamboos Market Share Comparison by By End User (2016-2032)
- Figure 67: Middle East & Africa Bamboos Market Revenue (US$ Mn) Market Share by By End Userin 2022
- Figure 68: Middle East & Africa Bamboos Market Attractiveness Analysis by By End User, 2016-2032
- Figure 69: Middle East & Africa Bamboos Market Revenue (US$ Mn) Market Share by Country in 2022
- Figure 70: Middle East & Africa Bamboos Market Attractiveness Analysis by Country, 2016-2032
- Figure 71: Middle East & Africa Bamboos Market Revenue (US$ Mn) (2016-2032)
- Figure 72: Middle East & Africa Bamboos Market Revenue (US$ Mn) Comparison by Country (2016-2032)
- Figure 73: Middle East & Africa Bamboos Market Revenue (US$ Mn) Comparison by By End User (2016-2032)
- Figure 74: Middle East & Africa Bamboos Market Y-o-Y Growth Rate Comparison by Country (2016-2032)
- Figure 75: Middle East & Africa Bamboos Market Y-o-Y Growth Rate Comparison by By End User (2016-2032)
- Figure 76: Middle East & Africa Bamboos Market Share Comparison by Country (2016-2032)
- Figure 77: Middle East & Africa Bamboos Market Share Comparison by By End User (2016-2032)
- List of Tables
- Table 1: Global Bamboos Market Comparison by By End User (2016-2032)
- Table 2: Global Bamboos Market Revenue (US$ Mn) Comparison by Region (2016-2032)
- Table 3: Global Bamboos Market Revenue (US$ Mn) (2016-2032)
- Table 4: Global Bamboos Market Revenue (US$ Mn) Comparison by Region (2016-2032)
- Table 5: Global Bamboos Market Revenue (US$ Mn) Comparison by By End User (2016-2032)
- Table 6: Global Bamboos Market Y-o-Y Growth Rate Comparison by Region (2016-2032)
- Table 7: Global Bamboos Market Y-o-Y Growth Rate Comparison by By End User (2016-2032)
- Table 8: Global Bamboos Market Share Comparison by Region (2016-2032)
- Table 9: Global Bamboos Market Share Comparison by By End User (2016-2032)
- Table 10: North America Bamboos Market Revenue (US$ Mn) Comparison by Country (2016-2032)
- Table 11: North America Bamboos Market Revenue (US$ Mn) (2016-2032)
- Table 12: North America Bamboos Market Revenue (US$ Mn) Comparison by Country (2016-2032)
- Table 13: North America Bamboos Market Revenue (US$ Mn) Comparison by By End User (2016-2032)
- Table 14: North America Bamboos Market Y-o-Y Growth Rate Comparison by Country (2016-2032)
- Table 15: North America Bamboos Market Y-o-Y Growth Rate Comparison by By End User (2016-2032)
- Table 16: North America Bamboos Market Share Comparison by Country (2016-2032)
- Table 17: North America Bamboos Market Share Comparison by By End User (2016-2032)
- Table 18: Western Europe Bamboos Market Comparison by By End User (2016-2032)
- Table 19: Western Europe Bamboos Market Revenue (US$ Mn) Comparison by Country (2016-2032)
- Table 20: Western Europe Bamboos Market Revenue (US$ Mn) (2016-2032)
- Table 21: Western Europe Bamboos Market Revenue (US$ Mn) Comparison by Country (2016-2032)
- Table 22: Western Europe Bamboos Market Revenue (US$ Mn) Comparison by By End User (2016-2032)
- Table 23: Western Europe Bamboos Market Y-o-Y Growth Rate Comparison by Country (2016-2032)
- Table 24: Western Europe Bamboos Market Y-o-Y Growth Rate Comparison by By End User (2016-2032)
- Table 25: Western Europe Bamboos Market Share Comparison by Country (2016-2032)
- Table 26: Western Europe Bamboos Market Share Comparison by By End User (2016-2032)
- Table 27: Eastern Europe Bamboos Market Comparison by By End User (2016-2032)
- Table 28: Eastern Europe Bamboos Market Revenue (US$ Mn) Comparison by Country (2016-2032)
- Table 29: Eastern Europe Bamboos Market Revenue (US$ Mn) (2016-2032)
- Table 30: Eastern Europe Bamboos Market Revenue (US$ Mn) Comparison by Country (2016-2032)
- Table 31: Eastern Europe Bamboos Market Revenue (US$ Mn) Comparison by By End User (2016-2032)
- Table 32: Eastern Europe Bamboos Market Y-o-Y Growth Rate Comparison by Country (2016-2032)
- Table 33: Eastern Europe Bamboos Market Y-o-Y Growth Rate Comparison by By End User (2016-2032)
- Table 34: Eastern Europe Bamboos Market Share Comparison by Country (2016-2032)
- Table 35: Eastern Europe Bamboos Market Share Comparison by By End User (2016-2032)
- Table 36: APAC Bamboos Market Comparison by By End User (2016-2032)
- Table 37: APAC Bamboos Market Revenue (US$ Mn) Comparison by Country (2016-2032)
- Table 38: APAC Bamboos Market Revenue (US$ Mn) (2016-2032)
- Table 39: APAC Bamboos Market Revenue (US$ Mn) Comparison by Country (2016-2032)
- Table 40: APAC Bamboos Market Revenue (US$ Mn) Comparison by By End User (2016-2032)
- Table 41: APAC Bamboos Market Y-o-Y Growth Rate Comparison by Country (2016-2032)
- Table 42: APAC Bamboos Market Y-o-Y Growth Rate Comparison by By End User (2016-2032)
- Table 43: APAC Bamboos Market Share Comparison by Country (2016-2032)
- Table 44: APAC Bamboos Market Share Comparison by By End User (2016-2032)
- Table 45: Latin America Bamboos Market Comparison by By End User (2016-2032)
- Table 46: Latin America Bamboos Market Revenue (US$ Mn) Comparison by Country (2016-2032)
- Table 47: Latin America Bamboos Market Revenue (US$ Mn) (2016-2032)
- Table 48: Latin America Bamboos Market Revenue (US$ Mn) Comparison by Country (2016-2032)
- Table 49: Latin America Bamboos Market Revenue (US$ Mn) Comparison by By End User (2016-2032)
- Table 50: Latin America Bamboos Market Y-o-Y Growth Rate Comparison by Country (2016-2032)
- Table 51: Latin America Bamboos Market Y-o-Y Growth Rate Comparison by By End User (2016-2032)
- Table 52: Latin America Bamboos Market Share Comparison by Country (2016-2032)
- Table 53: Latin America Bamboos Market Share Comparison by By End User (2016-2032)
- Table 54: Middle East & Africa Bamboos Market Comparison by By End User (2016-2032)
- Table 55: Middle East & Africa Bamboos Market Revenue (US$ Mn) Comparison by Country (2016-2032)
- Table 56: Middle East & Africa Bamboos Market Revenue (US$ Mn) (2016-2032)
- Table 57: Middle East & Africa Bamboos Market Revenue (US$ Mn) Comparison by Country (2016-2032)
- Table 58: Middle East & Africa Bamboos Market Revenue (US$ Mn) Comparison by By End User (2016-2032)
- Table 59: Middle East & Africa Bamboos Market Y-o-Y Growth Rate Comparison by Country (2016-2032)
- Table 60: Middle East & Africa Bamboos Market Y-o-Y Growth Rate Comparison by By End User (2016-2032)
- Table 61: Middle East & Africa Bamboos Market Share Comparison by Country (2016-2032)
- Table 62: Middle East & Africa Bamboos Market Share Comparison by By End User (2016-2032)
- 1. Executive Summary
-
- Kerala State Bamboo Corporation Ltd.
- Jiangxi Feiyu Industry Co. Ltd.
- Dasso Industrial Group Co., Ltd.
- Xingli Bamboo Products Company
- China Bambro Textile Company Limited
- Fujian Jianou Huayu Bamboo Industry Co., Ltd.
- Tengda Bamboo-Wood Co.
- Jiangxi Kangda Bamboo Ware Group Co.
- Moso International B.V.
- Bamboo Australia Pty Ltd.
Our Clients


View Our Licence Options
