
Augmented Reality Gaming Market By Component (Hardware, Software), By Device Type (Head-Mounted Displays (HMDs), Mobile Devices, AR Glasses, Other Device Types), By End-User (Individual, Commercial), By Region And Companies - Industry Segment Outlook, Market Assessment, Competition Scenario, Trends, And Forecast 2024-2033
-
51357
-
September 2024
-
300
-


-
This report was compiled by Vishwa Gaul Vishwa is an experienced market research and consulting professional with over 8 years of expertise in the ICT industry, contributing to over 700 reports across telecommunications, software, hardware, and digital solutions. Correspondence Team Lead- ICT Linkedin | Detailed Market research Methodology Our methodology involves a mix of primary research, including interviews with leading mental health experts, and secondary research from reputable medical journals and databases. View Detailed Methodology Page
-
Quick Navigation
Report Overview
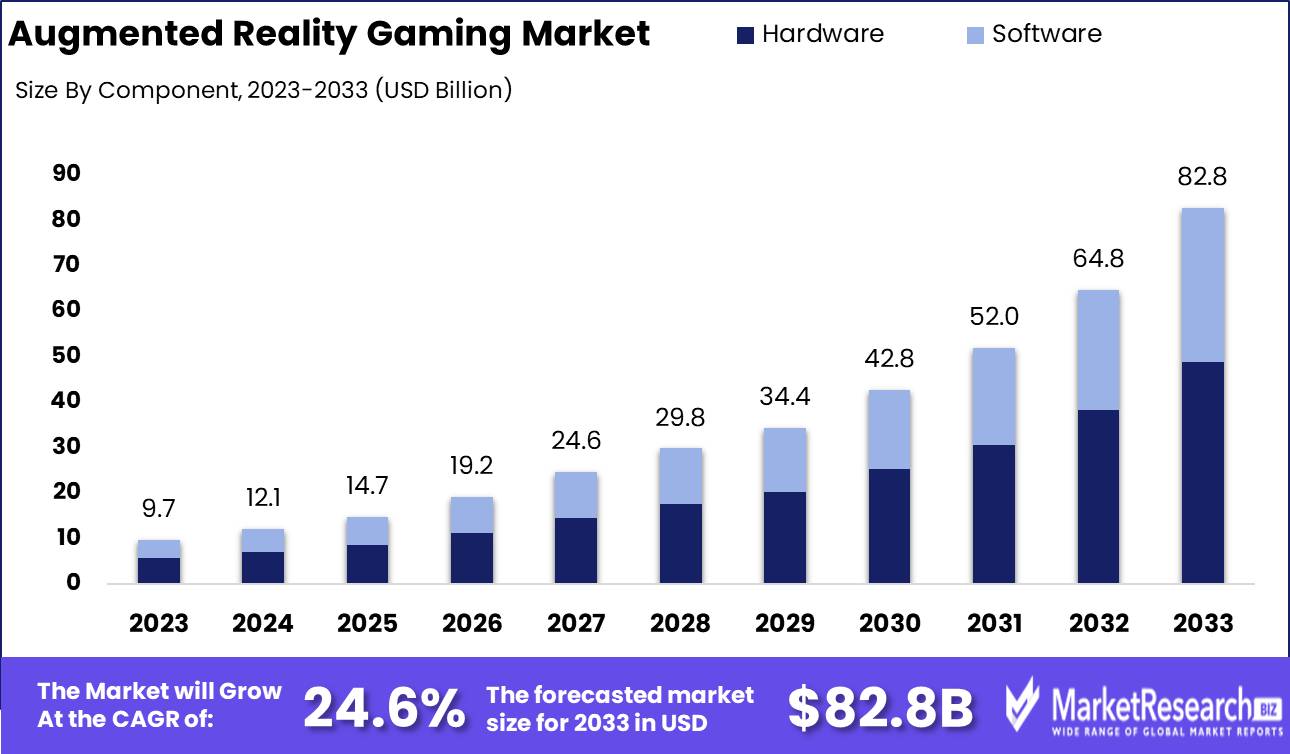
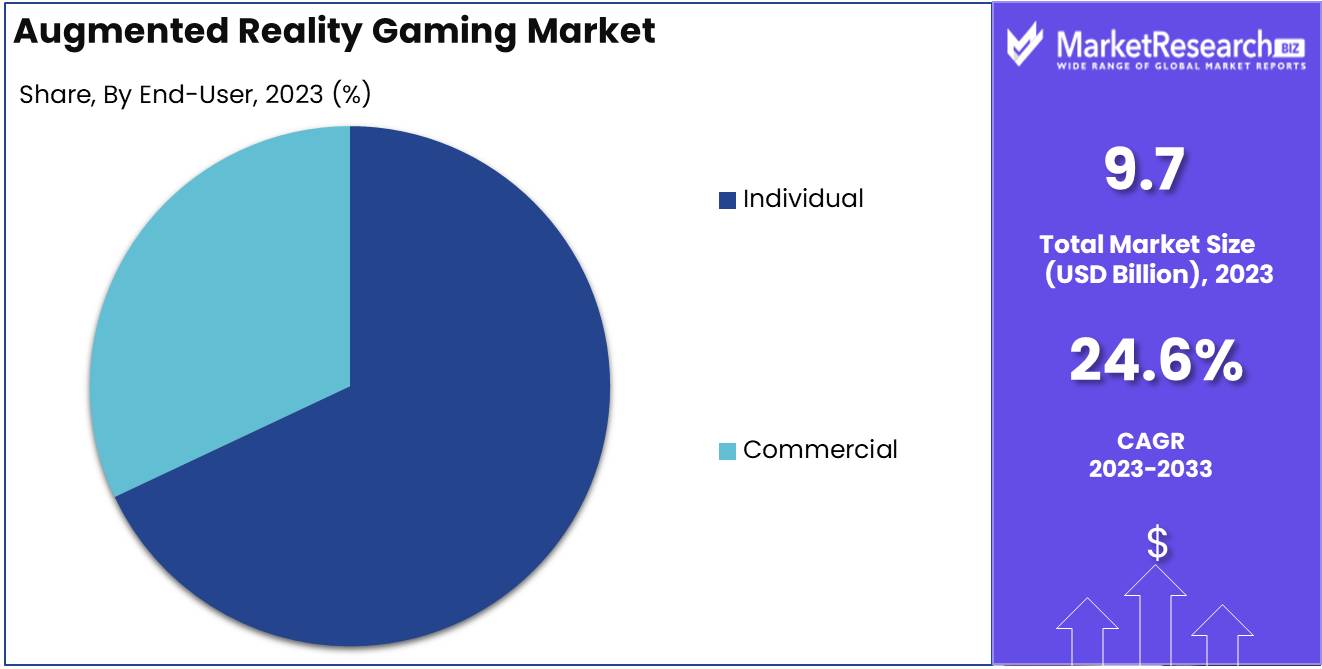
The Augmented Reality Gaming Market was valued at USD 9.7 billion in 2023. It is expected to reach USD 82.8 billion by 2033, with a CAGR of 24.6% during the forecast period from 2024 to 2033.
The Augmented Reality (AR) Gaming Market encompasses interactive gaming experiences where digital elements are overlaid onto the real-world environment, enhancing user immersion and engagement. Leveraging technologies such as smartphones, AR headsets, and advanced software, the market has experienced rapid growth driven by increasing consumer demand for immersive experiences, advancements in mobile computing power, and widespread adoption of 5G networks.
The augmented reality (AR) gaming market is poised for significant growth, driven by increasing investments in AR technologies and the expanding demand for immersive gaming experiences. Industry players are channeling substantial resources into developing more sophisticated AR platforms and content, as evidenced by rising investments from both tech giants and gaming companies. These efforts are contributing to the development of highly interactive, lifelike environments that attract a growing number of consumers seeking novel experiences. The growing popularity of immersive gaming, where players are no longer limited to a screen but can engage with dynamic, interactive environments, is reshaping the market landscape. This trend is accelerating the adoption of AR in mainstream gaming, particularly as younger, tech-savvy audiences continue to favor more engaging and interactive entertainment options.
However, the market still faces several challenges, particularly in the realm of hardware limitations. The need for more affordable, lightweight, and energy-efficient AR hardware remains a critical barrier to widespread adoption. While strides are being made, existing hardware often lacks the processing power and user-friendly design needed for mass market penetration. Despite these challenges, mobile AR continues to dominate the space, driven by the ubiquity of smartphones and the ongoing integration of AR functionalities into mobile applications. As mobile platforms provide a more accessible entry point for consumers, the trend is expected to sustain strong growth for the foreseeable future, positioning mobile AR as a key driver in the evolution of AR gaming.
Key Takeaways
- Market Growth: The Augmented Reality Gaming Market was valued at USD 9.7 billion in 2023. It is expected to reach USD 82.8 billion by 2033, with a CAGR of 24.6% during the forecast period from 2024 to 2033.
- By Component: Hardware dominated the AR Gaming Market with a 58.9% share.
- By Device Type: Head-mounted displays (HMDs) dominated the AR Gaming market with a 55.3% share.
- By End-User: Individuals dominated the market with a 68.5% share.
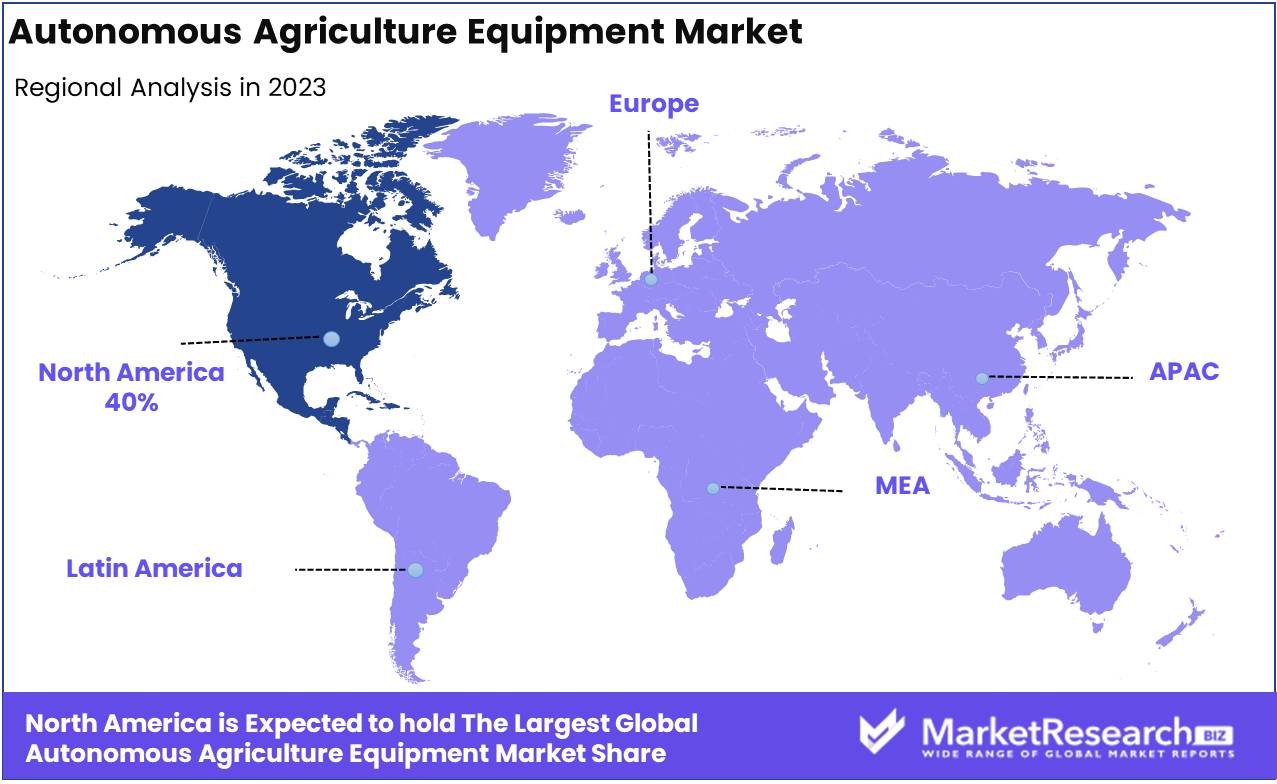
- Regional Dominance: North America dominates the global AR gaming market with a 40% largest market share.
- Growth Opportunity: The global AR gaming market is set for strong growth, driven by 5G technology adoption and mobile device integration, enabling immersive, accessible, and real-time gaming experiences worldwide.
Driving factors
Increased Smartphone Adoption: Expanding the User Base for Augmented Reality Gaming
The widespread adoption of smartphones has been a critical driver in the growth of the Augmented Reality (AR) gaming market. According to industry data, the global smartphone user base has surpassed 6.8 billion as of 2024, offering an enormous and accessible platform for AR gaming applications. Smartphones equipped with advanced sensors, high-resolution cameras, and robust processing power enable users to experience AR games without the need for specialized equipment, such as headsets or consoles.
Additionally, the proliferation of 5G networks, which provide lower latency and faster data speeds, has further enhanced the user experience by reducing lags and supporting smoother gameplay. This broad accessibility fosters a larger, more diverse consumer base, encouraging more developers to invest in AR game production. The affordability and convenience of smartphone-based AR gaming make it an attractive option, propelling market growth across multiple demographics.
Demand for Immersive Experiences: Shaping Consumer Preferences in the AR Gaming Space
Consumers growing desire for more interactive and immersive entertainment experiences has significantly influenced the growth of the AR gaming market. Unlike traditional video games, AR games blend virtual content with the real world, offering an interactive layer that enhances the user's sense of immersion. Games such as Pokémon GO, which was downloaded over 1 billion times, highlight the demand for these immersive experiences by showcasing how AR games can successfully integrate with the physical environment, promoting active engagement and even social interaction. This demand is further accelerated by the millennial and Gen Z demographic, who prioritize engaging, tech-forward experiences. As this trend continues, developers are focusing on creating more sophisticated AR games that offer high levels of customization, interactivity, and realism. This evolution aligns with a broader shift towards personalized entertainment, contributing to sustained market growth.
Technological Advancements: Enhancing AR Gaming Capabilities
Technological advancements in areas such as artificial intelligence (AI), machine learning, and spatial computing have significantly boosted the capabilities of AR gaming, driving market expansion. For example, improvements in AI have allowed for more realistic non-player characters (NPCs) and dynamic environments, offering deeper engagement and more complex gameplay. Additionally, advancements in AR development platforms, such as Apple's ARKit and Google's ARCore, have simplified the process of creating AR applications, allowing developers to produce more sophisticated games with less effort.
Furthermore, the integration of 5G networks enables faster data transmission and lower latency, which is essential for real-time multiplayer AR gaming. These technologies work in tandem to create more compelling, seamless, and scalable AR gaming experiences, thus increasing consumer satisfaction and driving higher adoption rates. With the ongoing improvements in hardware, such as AR glasses and wearables, the market is poised for further growth as these devices become more mainstream.
Restraining Factors
Privacy and Data Security Concerns: Limiting User Adoption and Industry Confidence
The rise of augmented reality (AR) gaming introduces substantial concerns regarding privacy and data security, which significantly restrain market growth. AR gaming platforms rely heavily on real-time data collection, including personal, geographic, and biometric information, to provide immersive and context-aware experiences. This continuous data harvesting has raised fears about the misuse of sensitive user information, either by companies or through malicious cyberattacks. As gaming companies increasingly rely on location-based services and camera-enabled gameplay, consumers are becoming more cautious about how their data is handled.
Moreover, regulatory scrutiny in regions such as the European Union, with the enforcement of stringent data protection laws like the General Data Protection Regulation (GDPR), complicates the operational scope for AR developers. Non-compliance risks substantial penalties, thus deterring smaller firms or new entrants from fully engaging in AR gaming ventures. This limitation not only reduces consumer confidence but also acts as a barrier for companies seeking to scale their AR offerings across different regions with varying legal frameworks.
The lack of universal data security standards exacerbates these concerns. As a result, user adoption rates have not accelerated as expected, impacting the market's projected growth rate. According to industry analysts, ensuring robust privacy measures and transparent data practices is crucial for overcoming this challenge and fostering a trustworthy relationship between AR gaming companies and their user base.
High Development Costs: A Barrier to Innovation and Market Expansion
The high cost associated with developing augmented reality gaming platforms represents a significant restraining factor in the market's growth. Developing AR games demands the integration of advanced technologies such as 3D modeling, real-time processing, and spatial computing, all of which require substantial financial investments in research, development, and high-skilled labor. The costs are further amplified by the need for specialized hardware, including sensors, cameras, and head-mounted displays, which increases the overall expense for both developers and consumers.
Startups and smaller companies often struggle to absorb these costs, leading to a market dominated by established tech giants and gaming companies that have the financial resources to fund long-term R&D initiatives. This monopolization constrains the diversity of AR gaming offerings and reduces the pace of innovation. The expense of AR game development also leads to fewer available titles, limiting the variety and appeal of AR content for consumers.
Furthermore, the costs extend beyond just development; companies must also invest in robust customer support, software updates, and bug fixes due to the evolving nature of AR technology. As a result, AR gaming firms must price their products and in-game purchases at a premium, which may alienate price-sensitive gamers, thereby restricting the market's expansion.
By Component Analysis
In 2023, Hardware dominated the AR Gaming Market with a 58.9% share.
In 2023, Hardware held a dominant market position in the By Component segment of the Augmented Reality Gaming Market, capturing more than 58.9% share. The growing demand for AR-compatible devices, such as headsets, smart glasses, and sensors, has been a major driver of hardware's prominence in this segment. Additionally, the increasing adoption of advanced computing technologies, paired with innovations in gaming hardware, has enhanced the immersive experience for users, contributing to the segment's significant market share.
In contrast, Software accounted for the remaining portion, with notable advancements in AR development platforms and game engines. The software segment is pivotal in enabling developers to create sophisticated AR environments and games, driving continuous innovation in-game content. As AR gaming continues to expand, software development will play an increasingly critical role in defining user experiences, although hardware is expected to retain its leadership due to the necessity of physical devices for AR interaction. Combined, hardware and software are integral to the continued growth of the AR gaming market, with hardware expected to remain dominant shortly.
By Device Type Analysis
In 2023, Head-Mounted Displays (HMDs) dominated the AR Gaming market with a 55.3% share.
In 2023, Head-Mounted Displays (HMDs) held a dominant market position in the By Device Type segment of the Augmented Reality (AR) Gaming Market, capturing more than a 55.3% share. The robust performance of HMDs is driven by their immersive experience and widespread use in both consumer and enterprise applications. Leading manufacturers like Oculus, HTC, and Sony have significantly contributed to the growth of this segment through constant innovation and hardware upgrades.
Mobile Devices, accounting for a considerable market share, appeal to casual gamers due to their accessibility and convenience. Integration with AR gaming apps and the widespread adoption of smartphones has fueled this segment's growth.
AR Glasses are emerging as a promising alternative, although their current market penetration remains modest. Advances in lightweight, user-friendly designs are expected to drive their future adoption.
Finally, Other Device Types, including AR-enabled consoles and projectors, hold a niche market presence. Although their impact is relatively limited compared to the other categories, they cater to specialized gaming experiences and niche audiences, thereby providing incremental value to the overall market.
By End-User Analysis
In 2023, Individuals dominated the market with a 68.5% share.
In 2023, Individuals held a dominant market position in the By End-User segment of the Augmented Reality (AR) Gaming Market, capturing more than a 68.5% share. This dominance can be attributed to the rapid adoption of AR gaming among individuals, particularly casual and mobile gamers, who benefit from the immersive experience offered by AR technology. The widespread use of smartphones and increased accessibility to AR games has further bolstered the individual end-user segment, making it the largest contributor to the market.
Conversely, the Commercial segment accounted for a smaller share, primarily driven by gaming arcades, theme parks, and interactive entertainment centers incorporating AR technology to enhance user engagement. Although its market share was less significant compared to individuals, the commercial sector is projected to witness substantial growth in the coming years, fueled by advancements in hardware and the integration of AR in public entertainment and educational platforms. The rise in corporate partnerships, along with investment in AR infrastructure, is expected to drive the commercial segment forward.
Key Market Segments
By Component
- Hardware
- Software
By Device Type
- Head-Mounted Displays (HMDs)
- Mobile Devices
- AR Glasses
- Other Device Types
By End-User
- Individual
- Commercial
Growth Opportunity
5G Technology Adoption
The adoption of 5G technology is poised to significantly accelerate the growth of the global augmented reality (AR) gaming market. The enhanced bandwidth, ultra-low latency, and faster data transmission capabilities provided by 5G are essential to the seamless operation of AR games, which rely on real-time data processing and high-quality visuals. With 5G networks becoming more widespread, game developers will have the capacity to create more immersive, large-scale AR experiences. This will lead to the development of cloud-based AR games, removing the need for extensive hardware and reducing barriers for consumers. The global rollout of 5G networks is expected to support more stable and dynamic multiplayer AR gaming environments, driving consumer engagement and expanding market size.
Mobile Device Integration
The growing integration of augmented reality gaming with mobile devices offers another substantial growth opportunity. As smartphones and tablets continue to improve in processing power, camera quality, and sensor capabilities, they become increasingly suitable platforms for AR gaming experiences. Mobile AR games, such as “Pokémon GO,” have already demonstrated the commercial viability of this technology. With advancements in mobile device hardware and software, more complex and engaging AR games will emerge, attracting a wider user base. Additionally, mobile integration allows for cross-platform compatibility, making AR gaming more accessible to global audiences and encouraging greater market penetration.
Latest Trends
Integration of Generative AI
The integration of generative AI into augmented reality (AR) gaming is expected to significantly reshape the market. Generative AI will enhance the user experience by creating dynamic, real-time content, such as procedurally generated environments, characters, and quests that adapt to player behavior. This personalized content is poised to increase engagement, as AI-driven narratives and interactions provide a more immersive gaming experience.
Additionally, AI’s ability to analyze player data will allow developers to refine in-game mechanics and optimize user satisfaction, leading to longer player retention and increased revenue potential for gaming companies.
Cross-Industry Applications
AR gaming is expanding beyond entertainment, with significant cross-industry applications in education, healthcare, and retail sectors. AR games will likely serve as tools for skill development and learning, leveraging gamified elements to engage users in various professional and academic settings. In healthcare, AR-based games are anticipated to support mental health treatments and physical rehabilitation, while retailers may employ AR games to enhance consumer engagement through interactive marketing campaigns. This cross-pollination of industries is expected to open new revenue streams and broaden the AR gaming market's addressable audience, as businesses increasingly recognize the value of AR in creating innovative customer experiences.
Regional Analysis
North America dominates the global AR gaming market with a 40% largest market share.
The Augmented Reality (AR) Gaming Market is experiencing significant growth globally, with varying degrees of adoption and advancement across different regions. North America remains the dominant region, driven by advanced technological infrastructure and high consumer adoption of AR gaming, accounting for approximately 40% of the global market share. Major players like Niantic, Inc. and Microsoft have accelerated AR adoption through games such as Pokémon GO and Minecraft Earth. The region benefits from a robust ecosystem of developers, investors, and consumers willing to explore immersive gaming experiences.
Europe follows closely, with a growing AR gaming market bolstered by supportive government initiatives and strong gaming industries in countries like Germany, the UK, and France. Europe holds around 25% of the global market. The region's adoption of AR technology is supported by a surge in smartphone usage and increased investments in immersive technologies.
The Asia Pacific region, particularly countries like Japan, China, and South Korea, is experiencing rapid growth due to a high penetration of smartphones and a strong gaming culture. The region is projected to grow at the highest CAGR, driven by a surge in mobile gaming. Asia Pacific currently holds a 20% market share, but it is expected to overtake other regions in the coming years due to its massive gamer base and innovative AR content.
Middle East & Africa and Latin America are still in the nascent stages of AR gaming adoption, collectively holding less than 15% of the market share. However, increasing smartphone penetration and growing interest in immersive entertainment suggest the potential for future growth.
Key Regions and Countries
North America
- The US
- Canada
- Rest of North America
Europe
- Germany
- France
- The UK
- Spain
- Netherlands
- Russia
- Italy
- Rest of Europe
Asia-Pacific
- China
- Japan
- Singapore
- Thailand
- South Korea
- Vietnam
- India
- New Zealand
- Rest of Asia Pacific
Latin America
- Mexico
- Brazil
- Rest of Latin America
Middle East & Africa
- Saudi Arabia
- South Africa
- UAE
- Rest of the Middle East & Africa
Key Players Analysis
The global Augmented Reality (AR) gaming market is expected to experience significant growth, driven by key players such as Microsoft Corporation, Apple Inc., Sony Corporation, and Meta Platforms, Inc. These industry giants are investing heavily in AR technology, leveraging their extensive resources, established platforms, and diverse ecosystems to dominate the AR gaming landscape.
Microsoft, with its HoloLens and integration of AR in its gaming consoles, continues to innovate, pushing boundaries in immersive gaming. Apple's augmented reality initiatives are primarily driven by its ARKit, enabling developers to create cutting-edge AR games for iOS devices. Its anticipated mixed-reality headset could further strengthen its position in the AR gaming sector.
Sony, known for its PlayStation brand, is anticipated to launch AR-enhanced games in line with its growing investment in immersive technologies, particularly through PlayStation VR. Meta Platforms, through its Oculus division, is poised to expand its AR and mixed-reality gaming content, further driven by its long-term focus on the metaverse.
Innovators like Niantic, Inc., best known for the highly successful AR game *Pokémon GO*, continue to demonstrate the market’s potential. Companies like Blippar, Vuzix Corporation, and Wikitude are also contributing to the market's development by offering software platforms and hardware solutions that enhance AR experiences.
Smaller players such as Zappar Ltd. and Catchoom Technologies are expected to leverage niche applications and partnerships, capitalizing on emerging trends. Overall, the diverse involvement of these companies signals a dynamic and competitive AR gaming market heading.
Market Key Players
- Microsoft Corporation
- Apple Inc.
- Sony Corporation
- Meta Platforms, Inc.
- Niantic, Inc.
- Nintendo Co., Ltd.
- Blippar
- Snap Inc.
- Vuzix Corporation
- Aurasma
- Catchoom Technologies S L
- Metaio
- Total Immersion
- Zappar Ltd.
- Google Inc.
- Augmented Pixels Inc.
- Infinity Augmented Reality Ltd.
- Qualcomm Technologies Inc.
- Wikitude
- VividWorks
- Other Key Players
Recent Development
- In August 2024, Meta announced that its Horizon OS, widely regarded for its robust VR and AR gaming capabilities, will now be available on third-party devices from brands such as ASUS and Lenovo. This move is expected to significantly widen the reach of AR gaming by enabling more headset manufacturers to tap into Meta's ecosystem. It is a pivotal step for AR/VR gaming, potentially increasing competition and innovation in the market.
- In July 2024, UK-based startup Phantom Technology released the PhantomEngine, a mobile AR development platform aimed at enhancing mobile AR gaming. This platform integrates features like spatial mapping and object recognition, offering developers tools to create more realistic and interactive AR games. The platform is expected to accelerate the production of mobile AR games with physics-based mechanics, making AR more accessible to gamers without high-end hardware.
- In June 2024, Apple launched its Vision Pro headset, a mixed-reality device with high-resolution displays, built-in spatial audio, and advanced gesture-tracking capabilities. The headset is positioned as a major advancement for both AR and VR gaming, providing developers with tools like ARKit and RealityKit to build new AR experiences. This premium device is expected to impact AR game development significantly by integrating more sophisticated hardware with immersive game mechanics.
Report Scope
Report Features Description Market Value (2023) USD 9.7 Billion Forecast Revenue (2033) USD 82.8 Billion CAGR (2024-2032) 24.6% Base Year for Estimation 2023 Historic Period 2016-2023 Forecast Period 2024-2033 Report Coverage Revenue Forecast, Market Dynamics, COVID-19 Impact, Competitive Landscape, Recent Developments Segments Covered By Component (Hardware, Software), By Device Type (Head-Mounted Displays (HMDs), Mobile Devices, AR Glasses, Other Device Types), By End-User (Individual, Commercial) Regional Analysis North America - The US, Canada, Rest of North America, Europe - Germany, France, The UK, Spain, Italy, Russia, Netherlands, Rest of Europe, Asia-Pacific - China, Japan, South Korea, India, New Zealand, Singapore, Thailand, Vietnam, Rest of Asia Pacific, Latin America - Brazil, Mexico, Rest of Latin America, Middle East & Africa - South Africa, Saudi Arabia, UAE, Rest of Middle East & Africa Competitive Landscape Microsoft Corporation, Apple Inc., Sony Corporation, Meta Platforms, Inc., Niantic, Inc., Nintendo Co., Ltd., Blippar, Snap Inc., Vuzix Corporation, Aurasma, Catchoom Technologies S L, Metaio, Total Immersion, Zappar Ltd., Google Inc., Augmented Pixels Inc., Infinity Augmented Reality Ltd., Qualcomm Technologies Inc., Wikitude, VividWorks, Other Key Players Customization Scope Customization for segments, region/country-level will be provided. Moreover, additional customization can be done based on the requirements. Purchase Options We have three licenses to opt for Single User License, Multi-User License (Up to 5 Users), Corporate Use License (Unlimited User and Printable PDF) -
- 1. Executive Summary
- 1.1. Definition
- 1.2. Taxonomy
- 1.3. Research Scope
- 1.4. Key Analysis
- 1.5. Key Findings by Major Segments
- 1.6. Top strategies by Major Players
- 2. Global Augmented Reality Gaming Market Overview
- 2.1. Augmented Reality Gaming Market Dynamics
- 2.1.1. Drivers
- 2.1.2. Opportunities
- 2.1.3. Restraints
- 2.1.4. Challenges
- 2.2. Macro-economic Factors
- 2.3. Regulatory Framework
- 2.4. Market Investment Feasibility Index
- 2.5. PEST Analysis
- 2.6. PORTER’S Five Force Analysis
- 2.7. Drivers & Restraints Impact Analysis
- 2.8. Industry Chain Analysis
- 2.9. Cost Structure Analysis
- 2.10. Marketing Strategy
- 2.11. Russia-Ukraine War Impact Analysis
- 2.12. Opportunity Map Analysis
- 2.13. Market Competition Scenario Analysis
- 2.14. Product Life Cycle Analysis
- 2.15. Opportunity Orbits
- 2.16. Manufacturer Intensity Map
- 2.17. Major Companies sales by Value & Volume
- 2.1. Augmented Reality Gaming Market Dynamics
- 3. Global Augmented Reality Gaming Market Analysis, Opportunity and Forecast, 2016-2032
- 3.1. Global Augmented Reality Gaming Market Analysis, 2016-2021
- 3.2. Global Augmented Reality Gaming Market Opportunity and Forecast, 2023-2032
- 3.3. Global Augmented Reality Gaming Market Analysis, Opportunity and Forecast, By Component, 2016-2032
- 3.3.1. Global Augmented Reality Gaming Market Analysis by Component: Introduction
- 3.3.2. Market Size Absolute $ Opportunity Analysis and Forecast, By Component, 2016-2032
- 3.3.3. Hardware
- 3.3.4. Software
- 3.4. Global Augmented Reality Gaming Market Analysis, Opportunity and Forecast, By Device Type, 2016-2032
- 3.4.1. Global Augmented Reality Gaming Market Analysis by Device Type: Introduction
- 3.4.2. Market Size Absolute $ Opportunity Analysis and Forecast, By Device Type, 2016-2032
- 3.4.3. Head-Mounted Displays (HMDs)
- 3.4.4. Mobile Devices
- 3.4.5. AR Glasses
- 3.4.6. Other Device Types
- 3.5. Global Augmented Reality Gaming Market Analysis, Opportunity and Forecast, By End-User, 2016-2032
- 3.5.1. Global Augmented Reality Gaming Market Analysis by End-User: Introduction
- 3.5.2. Market Size Absolute $ Opportunity Analysis and Forecast, By End-User, 2016-2032
- 3.5.3. Individual
- 3.5.4. Commercial
- 4. North America Augmented Reality Gaming Market Analysis, Opportunity and Forecast, 2016-2032
- 4.1. North America Augmented Reality Gaming Market Analysis, 2016-2021
- 4.2. North America Augmented Reality Gaming Market Opportunity and Forecast, 2023-2032
- 4.3. North America Augmented Reality Gaming Market Analysis, Opportunity and Forecast, By Component, 2016-2032
- 4.3.1. North America Augmented Reality Gaming Market Analysis by Component: Introduction
- 4.3.2. Market Size Absolute $ Opportunity Analysis and Forecast, By Component, 2016-2032
- 4.3.3. Hardware
- 4.3.4. Software
- 4.4. North America Augmented Reality Gaming Market Analysis, Opportunity and Forecast, By Device Type, 2016-2032
- 4.4.1. North America Augmented Reality Gaming Market Analysis by Device Type: Introduction
- 4.4.2. Market Size Absolute $ Opportunity Analysis and Forecast, By Device Type, 2016-2032
- 4.4.3. Head-Mounted Displays (HMDs)
- 4.4.4. Mobile Devices
- 4.4.5. AR Glasses
- 4.4.6. Other Device Types
- 4.5. North America Augmented Reality Gaming Market Analysis, Opportunity and Forecast, By End-User, 2016-2032
- 4.5.1. North America Augmented Reality Gaming Market Analysis by End-User: Introduction
- 4.5.2. Market Size Absolute $ Opportunity Analysis and Forecast, By End-User, 2016-2032
- 4.5.3. Individual
- 4.5.4. Commercial
- 4.6. North America Augmented Reality Gaming Market Analysis, Opportunity and Forecast, By Country , 2016-2032
- 4.6.1. North America Augmented Reality Gaming Market Analysis by Country : Introduction
- 4.6.2. Market Size Absolute $ Opportunity Analysis and Forecast, Country , 2016-2032
- 4.6.2.1. The US
- 4.6.2.2. Canada
- 4.6.2.3. Mexico
- 5. Western Europe Augmented Reality Gaming Market Analysis, Opportunity and Forecast, 2016-2032
- 5.1. Western Europe Augmented Reality Gaming Market Analysis, 2016-2021
- 5.2. Western Europe Augmented Reality Gaming Market Opportunity and Forecast, 2023-2032
- 5.3. Western Europe Augmented Reality Gaming Market Analysis, Opportunity and Forecast, By Component, 2016-2032
- 5.3.1. Western Europe Augmented Reality Gaming Market Analysis by Component: Introduction
- 5.3.2. Market Size Absolute $ Opportunity Analysis and Forecast, By Component, 2016-2032
- 5.3.3. Hardware
- 5.3.4. Software
- 5.4. Western Europe Augmented Reality Gaming Market Analysis, Opportunity and Forecast, By Device Type, 2016-2032
- 5.4.1. Western Europe Augmented Reality Gaming Market Analysis by Device Type: Introduction
- 5.4.2. Market Size Absolute $ Opportunity Analysis and Forecast, By Device Type, 2016-2032
- 5.4.3. Head-Mounted Displays (HMDs)
- 5.4.4. Mobile Devices
- 5.4.5. AR Glasses
- 5.4.6. Other Device Types
- 5.5. Western Europe Augmented Reality Gaming Market Analysis, Opportunity and Forecast, By End-User, 2016-2032
- 5.5.1. Western Europe Augmented Reality Gaming Market Analysis by End-User: Introduction
- 5.5.2. Market Size Absolute $ Opportunity Analysis and Forecast, By End-User, 2016-2032
- 5.5.3. Individual
- 5.5.4. Commercial
- 5.6. Western Europe Augmented Reality Gaming Market Analysis, Opportunity and Forecast, By Country , 2016-2032
- 5.6.1. Western Europe Augmented Reality Gaming Market Analysis by Country : Introduction
- 5.6.2. Market Size Absolute $ Opportunity Analysis and Forecast, Country , 2016-2032
- 5.6.2.1. Germany
- 5.6.2.2. France
- 5.6.2.3. The UK
- 5.6.2.4. Spain
- 5.6.2.5. Italy
- 5.6.2.6. Portugal
- 5.6.2.7. Ireland
- 5.6.2.8. Austria
- 5.6.2.9. Switzerland
- 5.6.2.10. Benelux
- 5.6.2.11. Nordic
- 5.6.2.12. Rest of Western Europe
- 6. Eastern Europe Augmented Reality Gaming Market Analysis, Opportunity and Forecast, 2016-2032
- 6.1. Eastern Europe Augmented Reality Gaming Market Analysis, 2016-2021
- 6.2. Eastern Europe Augmented Reality Gaming Market Opportunity and Forecast, 2023-2032
- 6.3. Eastern Europe Augmented Reality Gaming Market Analysis, Opportunity and Forecast, By Component, 2016-2032
- 6.3.1. Eastern Europe Augmented Reality Gaming Market Analysis by Component: Introduction
- 6.3.2. Market Size Absolute $ Opportunity Analysis and Forecast, By Component, 2016-2032
- 6.3.3. Hardware
- 6.3.4. Software
- 6.4. Eastern Europe Augmented Reality Gaming Market Analysis, Opportunity and Forecast, By Device Type, 2016-2032
- 6.4.1. Eastern Europe Augmented Reality Gaming Market Analysis by Device Type: Introduction
- 6.4.2. Market Size Absolute $ Opportunity Analysis and Forecast, By Device Type, 2016-2032
- 6.4.3. Head-Mounted Displays (HMDs)
- 6.4.4. Mobile Devices
- 6.4.5. AR Glasses
- 6.4.6. Other Device Types
- 6.5. Eastern Europe Augmented Reality Gaming Market Analysis, Opportunity and Forecast, By End-User, 2016-2032
- 6.5.1. Eastern Europe Augmented Reality Gaming Market Analysis by End-User: Introduction
- 6.5.2. Market Size Absolute $ Opportunity Analysis and Forecast, By End-User, 2016-2032
- 6.5.3. Individual
- 6.5.4. Commercial
- 6.6. Eastern Europe Augmented Reality Gaming Market Analysis, Opportunity and Forecast, By Country , 2016-2032
- 6.6.1. Eastern Europe Augmented Reality Gaming Market Analysis by Country : Introduction
- 6.6.2. Market Size Absolute $ Opportunity Analysis and Forecast, Country , 2016-2032
- 6.6.2.1. Russia
- 6.6.2.2. Poland
- 6.6.2.3. The Czech Republic
- 6.6.2.4. Greece
- 6.6.2.5. Rest of Eastern Europe
- 7. APAC Augmented Reality Gaming Market Analysis, Opportunity and Forecast, 2016-2032
- 7.1. APAC Augmented Reality Gaming Market Analysis, 2016-2021
- 7.2. APAC Augmented Reality Gaming Market Opportunity and Forecast, 2023-2032
- 7.3. APAC Augmented Reality Gaming Market Analysis, Opportunity and Forecast, By Component, 2016-2032
- 7.3.1. APAC Augmented Reality Gaming Market Analysis by Component: Introduction
- 7.3.2. Market Size Absolute $ Opportunity Analysis and Forecast, By Component, 2016-2032
- 7.3.3. Hardware
- 7.3.4. Software
- 7.4. APAC Augmented Reality Gaming Market Analysis, Opportunity and Forecast, By Device Type, 2016-2032
- 7.4.1. APAC Augmented Reality Gaming Market Analysis by Device Type: Introduction
- 7.4.2. Market Size Absolute $ Opportunity Analysis and Forecast, By Device Type, 2016-2032
- 7.4.3. Head-Mounted Displays (HMDs)
- 7.4.4. Mobile Devices
- 7.4.5. AR Glasses
- 7.4.6. Other Device Types
- 7.5. APAC Augmented Reality Gaming Market Analysis, Opportunity and Forecast, By End-User, 2016-2032
- 7.5.1. APAC Augmented Reality Gaming Market Analysis by End-User: Introduction
- 7.5.2. Market Size Absolute $ Opportunity Analysis and Forecast, By End-User, 2016-2032
- 7.5.3. Individual
- 7.5.4. Commercial
- 7.6. APAC Augmented Reality Gaming Market Analysis, Opportunity and Forecast, By Country , 2016-2032
- 7.6.1. APAC Augmented Reality Gaming Market Analysis by Country : Introduction
- 7.6.2. Market Size Absolute $ Opportunity Analysis and Forecast, Country , 2016-2032
- 7.6.2.1. China
- 7.6.2.2. Japan
- 7.6.2.3. South Korea
- 7.6.2.4. India
- 7.6.2.5. Australia & New Zeland
- 7.6.2.6. Indonesia
- 7.6.2.7. Malaysia
- 7.6.2.8. Philippines
- 7.6.2.9. Singapore
- 7.6.2.10. Thailand
- 7.6.2.11. Vietnam
- 7.6.2.12. Rest of APAC
- 8. Latin America Augmented Reality Gaming Market Analysis, Opportunity and Forecast, 2016-2032
- 8.1. Latin America Augmented Reality Gaming Market Analysis, 2016-2021
- 8.2. Latin America Augmented Reality Gaming Market Opportunity and Forecast, 2023-2032
- 8.3. Latin America Augmented Reality Gaming Market Analysis, Opportunity and Forecast, By Component, 2016-2032
- 8.3.1. Latin America Augmented Reality Gaming Market Analysis by Component: Introduction
- 8.3.2. Market Size Absolute $ Opportunity Analysis and Forecast, By Component, 2016-2032
- 8.3.3. Hardware
- 8.3.4. Software
- 8.4. Latin America Augmented Reality Gaming Market Analysis, Opportunity and Forecast, By Device Type, 2016-2032
- 8.4.1. Latin America Augmented Reality Gaming Market Analysis by Device Type: Introduction
- 8.4.2. Market Size Absolute $ Opportunity Analysis and Forecast, By Device Type, 2016-2032
- 8.4.3. Head-Mounted Displays (HMDs)
- 8.4.4. Mobile Devices
- 8.4.5. AR Glasses
- 8.4.6. Other Device Types
- 8.5. Latin America Augmented Reality Gaming Market Analysis, Opportunity and Forecast, By End-User, 2016-2032
- 8.5.1. Latin America Augmented Reality Gaming Market Analysis by End-User: Introduction
- 8.5.2. Market Size Absolute $ Opportunity Analysis and Forecast, By End-User, 2016-2032
- 8.5.3. Individual
- 8.5.4. Commercial
- 8.6. Latin America Augmented Reality Gaming Market Analysis, Opportunity and Forecast, By Country , 2016-2032
- 8.6.1. Latin America Augmented Reality Gaming Market Analysis by Country : Introduction
- 8.6.2. Market Size Absolute $ Opportunity Analysis and Forecast, Country , 2016-2032
- 8.6.2.1. Brazil
- 8.6.2.2. Colombia
- 8.6.2.3. Chile
- 8.6.2.4. Argentina
- 8.6.2.5. Costa Rica
- 8.6.2.6. Rest of Latin America
- 9. Middle East & Africa Augmented Reality Gaming Market Analysis, Opportunity and Forecast, 2016-2032
- 9.1. Middle East & Africa Augmented Reality Gaming Market Analysis, 2016-2021
- 9.2. Middle East & Africa Augmented Reality Gaming Market Opportunity and Forecast, 2023-2032
- 9.3. Middle East & Africa Augmented Reality Gaming Market Analysis, Opportunity and Forecast, By Component, 2016-2032
- 9.3.1. Middle East & Africa Augmented Reality Gaming Market Analysis by Component: Introduction
- 9.3.2. Market Size Absolute $ Opportunity Analysis and Forecast, By Component, 2016-2032
- 9.3.3. Hardware
- 9.3.4. Software
- 9.4. Middle East & Africa Augmented Reality Gaming Market Analysis, Opportunity and Forecast, By Device Type, 2016-2032
- 9.4.1. Middle East & Africa Augmented Reality Gaming Market Analysis by Device Type: Introduction
- 9.4.2. Market Size Absolute $ Opportunity Analysis and Forecast, By Device Type, 2016-2032
- 9.4.3. Head-Mounted Displays (HMDs)
- 9.4.4. Mobile Devices
- 9.4.5. AR Glasses
- 9.4.6. Other Device Types
- 9.5. Middle East & Africa Augmented Reality Gaming Market Analysis, Opportunity and Forecast, By End-User, 2016-2032
- 9.5.1. Middle East & Africa Augmented Reality Gaming Market Analysis by End-User: Introduction
- 9.5.2. Market Size Absolute $ Opportunity Analysis and Forecast, By End-User, 2016-2032
- 9.5.3. Individual
- 9.5.4. Commercial
- 9.6. Middle East & Africa Augmented Reality Gaming Market Analysis, Opportunity and Forecast, By Country , 2016-2032
- 9.6.1. Middle East & Africa Augmented Reality Gaming Market Analysis by Country : Introduction
- 9.6.2. Market Size Absolute $ Opportunity Analysis and Forecast, Country , 2016-2032
- 9.6.2.1. Algeria
- 9.6.2.2. Egypt
- 9.6.2.3. Israel
- 9.6.2.4. Kuwait
- 9.6.2.5. Nigeria
- 9.6.2.6. Saudi Arabia
- 9.6.2.7. South Africa
- 9.6.2.8. Turkey
- 9.6.2.9. The UAE
- 9.6.2.10. Rest of MEA
- 10. Global Augmented Reality Gaming Market Analysis, Opportunity and Forecast, By Region , 2016-2032
- 10.1. Global Augmented Reality Gaming Market Analysis by Region : Introduction
- 10.2. Market Size Absolute $ Opportunity Analysis and Forecast, By Region , 2016-2032
- 10.2.1. North America
- 10.2.2. Western Europe
- 10.2.3. Eastern Europe
- 10.2.4. APAC
- 10.2.5. Latin America
- 10.2.6. Middle East & Africa
- 11. Global Augmented Reality Gaming Market Competitive Landscape, Market Share Analysis, and Company Profiles
- 11.1. Market Share Analysis
- 11.2. Company Profiles
- 11.3. Microsoft Corporation
- 11.3.1. Company Overview
- 11.3.2. Financial Highlights
- 11.3.3. Product Portfolio
- 11.3.4. SWOT Analysis
- 11.3.5. Key Strategies and Developments
- 11.4. Apple Inc.
- 11.4.1. Company Overview
- 11.4.2. Financial Highlights
- 11.4.3. Product Portfolio
- 11.4.4. SWOT Analysis
- 11.4.5. Key Strategies and Developments
- 11.5. Sony Corporation
- 11.5.1. Company Overview
- 11.5.2. Financial Highlights
- 11.5.3. Product Portfolio
- 11.5.4. SWOT Analysis
- 11.5.5. Key Strategies and Developments
- 11.6. Meta Platforms, Inc.
- 11.6.1. Company Overview
- 11.6.2. Financial Highlights
- 11.6.3. Product Portfolio
- 11.6.4. SWOT Analysis
- 11.6.5. Key Strategies and Developments
- 11.7. Niantic, Inc.
- 11.7.1. Company Overview
- 11.7.2. Financial Highlights
- 11.7.3. Product Portfolio
- 11.7.4. SWOT Analysis
- 11.7.5. Key Strategies and Developments
- 11.8. Nintendo Co., Ltd.
- 11.8.1. Company Overview
- 11.8.2. Financial Highlights
- 11.8.3. Product Portfolio
- 11.8.4. SWOT Analysis
- 11.8.5. Key Strategies and Developments
- 11.9. Blippar
- 11.9.1. Company Overview
- 11.9.2. Financial Highlights
- 11.9.3. Product Portfolio
- 11.9.4. SWOT Analysis
- 11.9.5. Key Strategies and Developments
- 11.10. Snap Inc.
- 11.10.1. Company Overview
- 11.10.2. Financial Highlights
- 11.10.3. Product Portfolio
- 11.10.4. SWOT Analysis
- 11.10.5. Key Strategies and Developments
- 11.11. Vuzix Corporation
- 11.11.1. Company Overview
- 11.11.2. Financial Highlights
- 11.11.3. Product Portfolio
- 11.11.4. SWOT Analysis
- 11.11.5. Key Strategies and Developments
- 11.12. Aurasma
- 11.12.1. Company Overview
- 11.12.2. Financial Highlights
- 11.12.3. Product Portfolio
- 11.12.4. SWOT Analysis
- 11.12.5. Key Strategies and Developments
- 11.13.1. Company Overview
- 11.13.2. Financial Highlights
- 11.13.3. Product Portfolio
- 11.13.4. SWOT Analysis
- 11.13.5. Key Strategies and Developments
- 11.14. Catchoom Technologies S L
- 11.14.1. Company Overview
- 11.14.2. Financial Highlights
- 11.14.3. Product Portfolio
- 11.14.4. SWOT Analysis
- 11.14.5. Key Strategies and Developments
- 11.15. Total Immersion
- 11.15.1. Company Overview
- 11.15.2. Financial Highlights
- 11.15.3. Product Portfolio
- 11.15.4. SWOT Analysis
- 11.15.5. Key Strategies and Developments
- 11.16. Zappar Ltd.
- 11.16.1. Company Overview
- 11.16.2. Financial Highlights
- 11.16.3. Product Portfolio
- 11.16.4. SWOT Analysis
- 11.16.5. Key Strategies and Developments
- 11.17. Google Inc.
- 11.17.1. Company Overview
- 11.17.2. Financial Highlights
- 11.17.3. Product Portfolio
- 11.17.4. SWOT Analysis
- 11.17.5. Key Strategies and Developments
- 11.18. Augmented Pixels Inc.
- 11.18.1. Company Overview
- 11.18.2. Financial Highlights
- 11.18.3. Product Portfolio
- 11.18.4. SWOT Analysis
- 11.18.5. Key Strategies and Developments
- 11.19. Infinity Augmented Reality Ltd.
- 11.19.1. Company Overview
- 11.19.2. Financial Highlights
- 11.19.3. Product Portfolio
- 11.19.4. SWOT Analysis
- 11.19.5. Key Strategies and Developments
- 11.20. Qualcomm Technologies Inc.
- 11.20.1. Company Overview
- 11.20.2. Financial Highlights
- 11.20.3. Product Portfolio
- 11.20.4. SWOT Analysis
- 11.20.5. Key Strategies and Developments
- 11.21. Wikitude
- 11.21.1. Company Overview
- 11.21.2. Financial Highlights
- 11.21.3. Product Portfolio
- 11.21.4. SWOT Analysis
- 11.21.5. Key Strategies and Developments
- 11.22. VividWorks
- 11.22.1. Company Overview
- 11.22.2. Financial Highlights
- 11.22.3. Product Portfolio
- 11.22.4. SWOT Analysis
- 11.22.5. Key Strategies and Developments
- 12. Assumptions and Acronyms
- 13. Research Methodology
- 14. Contact
"
- List of Figures
- "
- Figure 1: Global Augmented Reality Gaming Market Revenue (US$ Mn) Market Share by Component in 2022
- Figure 2: Global Augmented Reality Gaming Market Market Attractiveness Analysis by Component, 2016-2032
- Figure 3: Global Augmented Reality Gaming Market Revenue (US$ Mn) Market Share by Device Typein 2022
- Figure 4: Global Augmented Reality Gaming Market Market Attractiveness Analysis by Device Type, 2016-2032
- Figure 5: Global Augmented Reality Gaming Market Revenue (US$ Mn) Market Share by End-Userin 2022
- Figure 6: Global Augmented Reality Gaming Market Market Attractiveness Analysis by End-User, 2016-2032
- Figure 7: Global Augmented Reality Gaming Market Revenue (US$ Mn) Market Share by Region in 2022
- Figure 8: Global Augmented Reality Gaming Market Market Attractiveness Analysis by Region, 2016-2032
- Figure 9: Global Augmented Reality Gaming Market Market Revenue (US$ Mn) (2016-2032)
- Figure 10: Global Augmented Reality Gaming Market Market Revenue (US$ Mn) Comparison by Region (2016-2032)
- Figure 11: Global Augmented Reality Gaming Market Market Revenue (US$ Mn) Comparison by Component (2016-2032)
- Figure 12: Global Augmented Reality Gaming Market Market Revenue (US$ Mn) Comparison by Device Type (2016-2032)
- Figure 13: Global Augmented Reality Gaming Market Market Revenue (US$ Mn) Comparison by End-User (2016-2032)
- Figure 14: Global Augmented Reality Gaming Market Market Y-o-Y Growth Rate Comparison by Region (2016-2032)
- Figure 15: Global Augmented Reality Gaming Market Market Y-o-Y Growth Rate Comparison by Component (2016-2032)
- Figure 16: Global Augmented Reality Gaming Market Market Y-o-Y Growth Rate Comparison by Device Type (2016-2032)
- Figure 17: Global Augmented Reality Gaming Market Market Y-o-Y Growth Rate Comparison by End-User (2016-2032)
- Figure 18: Global Augmented Reality Gaming Market Market Share Comparison by Region (2016-2032)
- Figure 19: Global Augmented Reality Gaming Market Market Share Comparison by Component (2016-2032)
- Figure 20: Global Augmented Reality Gaming Market Market Share Comparison by Device Type (2016-2032)
- Figure 21: Global Augmented Reality Gaming Market Market Share Comparison by End-User (2016-2032)
- Figure 22: North America Augmented Reality Gaming Market Revenue (US$ Mn) Market Share by Componentin 2022
- Figure 23: North America Augmented Reality Gaming Market Market Attractiveness Analysis by Component, 2016-2032
- Figure 24: North America Augmented Reality Gaming Market Revenue (US$ Mn) Market Share by Device Typein 2022
- Figure 25: North America Augmented Reality Gaming Market Market Attractiveness Analysis by Device Type, 2016-2032
- Figure 26: North America Augmented Reality Gaming Market Revenue (US$ Mn) Market Share by End-Userin 2022
- Figure 27: North America Augmented Reality Gaming Market Market Attractiveness Analysis by End-User, 2016-2032
- Figure 28: North America Augmented Reality Gaming Market Revenue (US$ Mn) Market Share by Country in 2022
- Figure 29: North America Augmented Reality Gaming Market Market Attractiveness Analysis by Country, 2016-2032
- Figure 30: North America Augmented Reality Gaming Market Market Revenue (US$ Mn) (2016-2032)
- Figure 31: North America Augmented Reality Gaming Market Market Revenue (US$ Mn) Comparison by Country (2016-2032)
- Figure 32: North America Augmented Reality Gaming Market Market Revenue (US$ Mn) Comparison by Component (2016-2032)
- Figure 33: North America Augmented Reality Gaming Market Market Revenue (US$ Mn) Comparison by Device Type (2016-2032)
- Figure 34: North America Augmented Reality Gaming Market Market Revenue (US$ Mn) Comparison by End-User (2016-2032)
- Figure 35: North America Augmented Reality Gaming Market Market Y-o-Y Growth Rate Comparison by Country (2016-2032)
- Figure 36: North America Augmented Reality Gaming Market Market Y-o-Y Growth Rate Comparison by Component (2016-2032)
- Figure 37: North America Augmented Reality Gaming Market Market Y-o-Y Growth Rate Comparison by Device Type (2016-2032)
- Figure 38: North America Augmented Reality Gaming Market Market Y-o-Y Growth Rate Comparison by End-User (2016-2032)
- Figure 39: North America Augmented Reality Gaming Market Market Share Comparison by Country (2016-2032)
- Figure 40: North America Augmented Reality Gaming Market Market Share Comparison by Component (2016-2032)
- Figure 41: North America Augmented Reality Gaming Market Market Share Comparison by Device Type (2016-2032)
- Figure 42: North America Augmented Reality Gaming Market Market Share Comparison by End-User (2016-2032)
- Figure 43: Western Europe Augmented Reality Gaming Market Revenue (US$ Mn) Market Share by Componentin 2022
- Figure 44: Western Europe Augmented Reality Gaming Market Market Attractiveness Analysis by Component, 2016-2032
- Figure 45: Western Europe Augmented Reality Gaming Market Revenue (US$ Mn) Market Share by Device Typein 2022
- Figure 46: Western Europe Augmented Reality Gaming Market Market Attractiveness Analysis by Device Type, 2016-2032
- Figure 47: Western Europe Augmented Reality Gaming Market Revenue (US$ Mn) Market Share by End-Userin 2022
- Figure 48: Western Europe Augmented Reality Gaming Market Market Attractiveness Analysis by End-User, 2016-2032
- Figure 49: Western Europe Augmented Reality Gaming Market Revenue (US$ Mn) Market Share by Country in 2022
- Figure 50: Western Europe Augmented Reality Gaming Market Market Attractiveness Analysis by Country, 2016-2032
- Figure 51: Western Europe Augmented Reality Gaming Market Market Revenue (US$ Mn) (2016-2032)
- Figure 52: Western Europe Augmented Reality Gaming Market Market Revenue (US$ Mn) Comparison by Country (2016-2032)
- Figure 53: Western Europe Augmented Reality Gaming Market Market Revenue (US$ Mn) Comparison by Component (2016-2032)
- Figure 54: Western Europe Augmented Reality Gaming Market Market Revenue (US$ Mn) Comparison by Device Type (2016-2032)
- Figure 55: Western Europe Augmented Reality Gaming Market Market Revenue (US$ Mn) Comparison by End-User (2016-2032)
- Figure 56: Western Europe Augmented Reality Gaming Market Market Y-o-Y Growth Rate Comparison by Country (2016-2032)
- Figure 57: Western Europe Augmented Reality Gaming Market Market Y-o-Y Growth Rate Comparison by Component (2016-2032)
- Figure 58: Western Europe Augmented Reality Gaming Market Market Y-o-Y Growth Rate Comparison by Device Type (2016-2032)
- Figure 59: Western Europe Augmented Reality Gaming Market Market Y-o-Y Growth Rate Comparison by End-User (2016-2032)
- Figure 60: Western Europe Augmented Reality Gaming Market Market Share Comparison by Country (2016-2032)
- Figure 61: Western Europe Augmented Reality Gaming Market Market Share Comparison by Component (2016-2032)
- Figure 62: Western Europe Augmented Reality Gaming Market Market Share Comparison by Device Type (2016-2032)
- Figure 63: Western Europe Augmented Reality Gaming Market Market Share Comparison by End-User (2016-2032)
- Figure 64: Eastern Europe Augmented Reality Gaming Market Revenue (US$ Mn) Market Share by Componentin 2022
- Figure 65: Eastern Europe Augmented Reality Gaming Market Market Attractiveness Analysis by Component, 2016-2032
- Figure 66: Eastern Europe Augmented Reality Gaming Market Revenue (US$ Mn) Market Share by Device Typein 2022
- Figure 67: Eastern Europe Augmented Reality Gaming Market Market Attractiveness Analysis by Device Type, 2016-2032
- Figure 68: Eastern Europe Augmented Reality Gaming Market Revenue (US$ Mn) Market Share by End-Userin 2022
- Figure 69: Eastern Europe Augmented Reality Gaming Market Market Attractiveness Analysis by End-User, 2016-2032
- Figure 70: Eastern Europe Augmented Reality Gaming Market Revenue (US$ Mn) Market Share by Country in 2022
- Figure 71: Eastern Europe Augmented Reality Gaming Market Market Attractiveness Analysis by Country, 2016-2032
- Figure 72: Eastern Europe Augmented Reality Gaming Market Market Revenue (US$ Mn) (2016-2032)
- Figure 73: Eastern Europe Augmented Reality Gaming Market Market Revenue (US$ Mn) Comparison by Country (2016-2032)
- Figure 74: Eastern Europe Augmented Reality Gaming Market Market Revenue (US$ Mn) Comparison by Component (2016-2032)
- Figure 75: Eastern Europe Augmented Reality Gaming Market Market Revenue (US$ Mn) Comparison by Device Type (2016-2032)
- Figure 76: Eastern Europe Augmented Reality Gaming Market Market Revenue (US$ Mn) Comparison by End-User (2016-2032)
- Figure 77: Eastern Europe Augmented Reality Gaming Market Market Y-o-Y Growth Rate Comparison by Country (2016-2032)
- Figure 78: Eastern Europe Augmented Reality Gaming Market Market Y-o-Y Growth Rate Comparison by Component (2016-2032)
- Figure 79: Eastern Europe Augmented Reality Gaming Market Market Y-o-Y Growth Rate Comparison by Device Type (2016-2032)
- Figure 80: Eastern Europe Augmented Reality Gaming Market Market Y-o-Y Growth Rate Comparison by End-User (2016-2032)
- Figure 81: Eastern Europe Augmented Reality Gaming Market Market Share Comparison by Country (2016-2032)
- Figure 82: Eastern Europe Augmented Reality Gaming Market Market Share Comparison by Component (2016-2032)
- Figure 83: Eastern Europe Augmented Reality Gaming Market Market Share Comparison by Device Type (2016-2032)
- Figure 84: Eastern Europe Augmented Reality Gaming Market Market Share Comparison by End-User (2016-2032)
- Figure 85: APAC Augmented Reality Gaming Market Revenue (US$ Mn) Market Share by Componentin 2022
- Figure 86: APAC Augmented Reality Gaming Market Market Attractiveness Analysis by Component, 2016-2032
- Figure 87: APAC Augmented Reality Gaming Market Revenue (US$ Mn) Market Share by Device Typein 2022
- Figure 88: APAC Augmented Reality Gaming Market Market Attractiveness Analysis by Device Type, 2016-2032
- Figure 89: APAC Augmented Reality Gaming Market Revenue (US$ Mn) Market Share by End-Userin 2022
- Figure 90: APAC Augmented Reality Gaming Market Market Attractiveness Analysis by End-User, 2016-2032
- Figure 91: APAC Augmented Reality Gaming Market Revenue (US$ Mn) Market Share by Country in 2022
- Figure 92: APAC Augmented Reality Gaming Market Market Attractiveness Analysis by Country, 2016-2032
- Figure 93: APAC Augmented Reality Gaming Market Market Revenue (US$ Mn) (2016-2032)
- Figure 94: APAC Augmented Reality Gaming Market Market Revenue (US$ Mn) Comparison by Country (2016-2032)
- Figure 95: APAC Augmented Reality Gaming Market Market Revenue (US$ Mn) Comparison by Component (2016-2032)
- Figure 96: APAC Augmented Reality Gaming Market Market Revenue (US$ Mn) Comparison by Device Type (2016-2032)
- Figure 97: APAC Augmented Reality Gaming Market Market Revenue (US$ Mn) Comparison by End-User (2016-2032)
- Figure 98: APAC Augmented Reality Gaming Market Market Y-o-Y Growth Rate Comparison by Country (2016-2032)
- Figure 99: APAC Augmented Reality Gaming Market Market Y-o-Y Growth Rate Comparison by Component (2016-2032)
- Figure 100: APAC Augmented Reality Gaming Market Market Y-o-Y Growth Rate Comparison by Device Type (2016-2032)
- Figure 101: APAC Augmented Reality Gaming Market Market Y-o-Y Growth Rate Comparison by End-User (2016-2032)
- Figure 102: APAC Augmented Reality Gaming Market Market Share Comparison by Country (2016-2032)
- Figure 103: APAC Augmented Reality Gaming Market Market Share Comparison by Component (2016-2032)
- Figure 104: APAC Augmented Reality Gaming Market Market Share Comparison by Device Type (2016-2032)
- Figure 105: APAC Augmented Reality Gaming Market Market Share Comparison by End-User (2016-2032)
- Figure 106: Latin America Augmented Reality Gaming Market Revenue (US$ Mn) Market Share by Componentin 2022
- Figure 107: Latin America Augmented Reality Gaming Market Market Attractiveness Analysis by Component, 2016-2032
- Figure 108: Latin America Augmented Reality Gaming Market Revenue (US$ Mn) Market Share by Device Typein 2022
- Figure 109: Latin America Augmented Reality Gaming Market Market Attractiveness Analysis by Device Type, 2016-2032
- Figure 110: Latin America Augmented Reality Gaming Market Revenue (US$ Mn) Market Share by End-Userin 2022
- Figure 111: Latin America Augmented Reality Gaming Market Market Attractiveness Analysis by End-User, 2016-2032
- Figure 112: Latin America Augmented Reality Gaming Market Revenue (US$ Mn) Market Share by Country in 2022
- Figure 113: Latin America Augmented Reality Gaming Market Market Attractiveness Analysis by Country, 2016-2032
- Figure 114: Latin America Augmented Reality Gaming Market Market Revenue (US$ Mn) (2016-2032)
- Figure 115: Latin America Augmented Reality Gaming Market Market Revenue (US$ Mn) Comparison by Country (2016-2032)
- Figure 116: Latin America Augmented Reality Gaming Market Market Revenue (US$ Mn) Comparison by Component (2016-2032)
- Figure 117: Latin America Augmented Reality Gaming Market Market Revenue (US$ Mn) Comparison by Device Type (2016-2032)
- Figure 118: Latin America Augmented Reality Gaming Market Market Revenue (US$ Mn) Comparison by End-User (2016-2032)
- Figure 119: Latin America Augmented Reality Gaming Market Market Y-o-Y Growth Rate Comparison by Country (2016-2032)
- Figure 120: Latin America Augmented Reality Gaming Market Market Y-o-Y Growth Rate Comparison by Component (2016-2032)
- Figure 121: Latin America Augmented Reality Gaming Market Market Y-o-Y Growth Rate Comparison by Device Type (2016-2032)
- Figure 122: Latin America Augmented Reality Gaming Market Market Y-o-Y Growth Rate Comparison by End-User (2016-2032)
- Figure 123: Latin America Augmented Reality Gaming Market Market Share Comparison by Country (2016-2032)
- Figure 124: Latin America Augmented Reality Gaming Market Market Share Comparison by Component (2016-2032)
- Figure 125: Latin America Augmented Reality Gaming Market Market Share Comparison by Device Type (2016-2032)
- Figure 126: Latin America Augmented Reality Gaming Market Market Share Comparison by End-User (2016-2032)
- Figure 127: Middle East & Africa Augmented Reality Gaming Market Revenue (US$ Mn) Market Share by Componentin 2022
- Figure 128: Middle East & Africa Augmented Reality Gaming Market Market Attractiveness Analysis by Component, 2016-2032
- Figure 129: Middle East & Africa Augmented Reality Gaming Market Revenue (US$ Mn) Market Share by Device Typein 2022
- Figure 130: Middle East & Africa Augmented Reality Gaming Market Market Attractiveness Analysis by Device Type, 2016-2032
- Figure 131: Middle East & Africa Augmented Reality Gaming Market Revenue (US$ Mn) Market Share by End-Userin 2022
- Figure 132: Middle East & Africa Augmented Reality Gaming Market Market Attractiveness Analysis by End-User, 2016-2032
- Figure 133: Middle East & Africa Augmented Reality Gaming Market Revenue (US$ Mn) Market Share by Country in 2022
- Figure 134: Middle East & Africa Augmented Reality Gaming Market Market Attractiveness Analysis by Country, 2016-2032
- Figure 135: Middle East & Africa Augmented Reality Gaming Market Market Revenue (US$ Mn) (2016-2032)
- Figure 136: Middle East & Africa Augmented Reality Gaming Market Market Revenue (US$ Mn) Comparison by Country (2016-2032)
- Figure 137: Middle East & Africa Augmented Reality Gaming Market Market Revenue (US$ Mn) Comparison by Component (2016-2032)
- Figure 138: Middle East & Africa Augmented Reality Gaming Market Market Revenue (US$ Mn) Comparison by Device Type (2016-2032)
- Figure 139: Middle East & Africa Augmented Reality Gaming Market Market Revenue (US$ Mn) Comparison by End-User (2016-2032)
- Figure 140: Middle East & Africa Augmented Reality Gaming Market Market Y-o-Y Growth Rate Comparison by Country (2016-2032)
- Figure 141: Middle East & Africa Augmented Reality Gaming Market Market Y-o-Y Growth Rate Comparison by Component (2016-2032)
- Figure 142: Middle East & Africa Augmented Reality Gaming Market Market Y-o-Y Growth Rate Comparison by Device Type (2016-2032)
- Figure 143: Middle East & Africa Augmented Reality Gaming Market Market Y-o-Y Growth Rate Comparison by End-User (2016-2032)
- Figure 144: Middle East & Africa Augmented Reality Gaming Market Market Share Comparison by Country (2016-2032)
- Figure 145: Middle East & Africa Augmented Reality Gaming Market Market Share Comparison by Component (2016-2032)
- Figure 146: Middle East & Africa Augmented Reality Gaming Market Market Share Comparison by Device Type (2016-2032)
- Figure 147: Middle East & Africa Augmented Reality Gaming Market Market Share Comparison by End-User (2016-2032)
"
- List of Tables
- "
- Table 1: Global Augmented Reality Gaming Market Market Comparison by Component (2016-2032)
- Table 2: Global Augmented Reality Gaming Market Market Comparison by Device Type (2016-2032)
- Table 3: Global Augmented Reality Gaming Market Market Comparison by End-User (2016-2032)
- Table 4: Global Augmented Reality Gaming Market Revenue (US$ Mn) Comparison by Region (2016-2032)
- Table 5: Global Augmented Reality Gaming Market Market Revenue (US$ Mn) (2016-2032)
- Table 6: Global Augmented Reality Gaming Market Market Revenue (US$ Mn) Comparison by Region (2016-2032)
- Table 7: Global Augmented Reality Gaming Market Market Revenue (US$ Mn) Comparison by Component (2016-2032)
- Table 8: Global Augmented Reality Gaming Market Market Revenue (US$ Mn) Comparison by Device Type (2016-2032)
- Table 9: Global Augmented Reality Gaming Market Market Revenue (US$ Mn) Comparison by End-User (2016-2032)
- Table 10: Global Augmented Reality Gaming Market Market Y-o-Y Growth Rate Comparison by Region (2016-2032)
- Table 11: Global Augmented Reality Gaming Market Market Y-o-Y Growth Rate Comparison by Component (2016-2032)
- Table 12: Global Augmented Reality Gaming Market Market Y-o-Y Growth Rate Comparison by Device Type (2016-2032)
- Table 13: Global Augmented Reality Gaming Market Market Y-o-Y Growth Rate Comparison by End-User (2016-2032)
- Table 14: Global Augmented Reality Gaming Market Market Share Comparison by Region (2016-2032)
- Table 15: Global Augmented Reality Gaming Market Market Share Comparison by Component (2016-2032)
- Table 16: Global Augmented Reality Gaming Market Market Share Comparison by Device Type (2016-2032)
- Table 17: Global Augmented Reality Gaming Market Market Share Comparison by End-User (2016-2032)
- Table 18: North America Augmented Reality Gaming Market Market Comparison by Device Type (2016-2032)
- Table 19: North America Augmented Reality Gaming Market Market Comparison by End-User (2016-2032)
- Table 20: North America Augmented Reality Gaming Market Revenue (US$ Mn) Comparison by Country (2016-2032)
- Table 21: North America Augmented Reality Gaming Market Market Revenue (US$ Mn) (2016-2032)
- Table 22: North America Augmented Reality Gaming Market Market Revenue (US$ Mn) Comparison by Country (2016-2032)
- Table 23: North America Augmented Reality Gaming Market Market Revenue (US$ Mn) Comparison by Component (2016-2032)
- Table 24: North America Augmented Reality Gaming Market Market Revenue (US$ Mn) Comparison by Device Type (2016-2032)
- Table 25: North America Augmented Reality Gaming Market Market Revenue (US$ Mn) Comparison by End-User (2016-2032)
- Table 26: North America Augmented Reality Gaming Market Market Y-o-Y Growth Rate Comparison by Country (2016-2032)
- Table 27: North America Augmented Reality Gaming Market Market Y-o-Y Growth Rate Comparison by Component (2016-2032)
- Table 28: North America Augmented Reality Gaming Market Market Y-o-Y Growth Rate Comparison by Device Type (2016-2032)
- Table 29: North America Augmented Reality Gaming Market Market Y-o-Y Growth Rate Comparison by End-User (2016-2032)
- Table 30: North America Augmented Reality Gaming Market Market Share Comparison by Country (2016-2032)
- Table 31: North America Augmented Reality Gaming Market Market Share Comparison by Component (2016-2032)
- Table 32: North America Augmented Reality Gaming Market Market Share Comparison by Device Type (2016-2032)
- Table 33: North America Augmented Reality Gaming Market Market Share Comparison by End-User (2016-2032)
- Table 34: Western Europe Augmented Reality Gaming Market Market Comparison by Component (2016-2032)
- Table 35: Western Europe Augmented Reality Gaming Market Market Comparison by Device Type (2016-2032)
- Table 36: Western Europe Augmented Reality Gaming Market Market Comparison by End-User (2016-2032)
- Table 37: Western Europe Augmented Reality Gaming Market Revenue (US$ Mn) Comparison by Country (2016-2032)
- Table 38: Western Europe Augmented Reality Gaming Market Market Revenue (US$ Mn) (2016-2032)
- Table 39: Western Europe Augmented Reality Gaming Market Market Revenue (US$ Mn) Comparison by Country (2016-2032)
- Table 40: Western Europe Augmented Reality Gaming Market Market Revenue (US$ Mn) Comparison by Component (2016-2032)
- Table 41: Western Europe Augmented Reality Gaming Market Market Revenue (US$ Mn) Comparison by Device Type (2016-2032)
- Table 42: Western Europe Augmented Reality Gaming Market Market Revenue (US$ Mn) Comparison by End-User (2016-2032)
- Table 43: Western Europe Augmented Reality Gaming Market Market Y-o-Y Growth Rate Comparison by Country (2016-2032)
- Table 44: Western Europe Augmented Reality Gaming Market Market Y-o-Y Growth Rate Comparison by Component (2016-2032)
- Table 45: Western Europe Augmented Reality Gaming Market Market Y-o-Y Growth Rate Comparison by Device Type (2016-2032)
- Table 46: Western Europe Augmented Reality Gaming Market Market Y-o-Y Growth Rate Comparison by End-User (2016-2032)
- Table 47: Western Europe Augmented Reality Gaming Market Market Share Comparison by Country (2016-2032)
- Table 48: Western Europe Augmented Reality Gaming Market Market Share Comparison by Component (2016-2032)
- Table 49: Western Europe Augmented Reality Gaming Market Market Share Comparison by Device Type (2016-2032)
- Table 50: Western Europe Augmented Reality Gaming Market Market Share Comparison by End-User (2016-2032)
- Table 51: Eastern Europe Augmented Reality Gaming Market Market Comparison by Component (2016-2032)
- Table 52: Eastern Europe Augmented Reality Gaming Market Market Comparison by Device Type (2016-2032)
- Table 53: Eastern Europe Augmented Reality Gaming Market Market Comparison by End-User (2016-2032)
- Table 54: Eastern Europe Augmented Reality Gaming Market Revenue (US$ Mn) Comparison by Country (2016-2032)
- Table 55: Eastern Europe Augmented Reality Gaming Market Market Revenue (US$ Mn) (2016-2032)
- Table 56: Eastern Europe Augmented Reality Gaming Market Market Revenue (US$ Mn) Comparison by Country (2016-2032)
- Table 57: Eastern Europe Augmented Reality Gaming Market Market Revenue (US$ Mn) Comparison by Component (2016-2032)
- Table 58: Eastern Europe Augmented Reality Gaming Market Market Revenue (US$ Mn) Comparison by Device Type (2016-2032)
- Table 59: Eastern Europe Augmented Reality Gaming Market Market Revenue (US$ Mn) Comparison by End-User (2016-2032)
- Table 60: Eastern Europe Augmented Reality Gaming Market Market Y-o-Y Growth Rate Comparison by Country (2016-2032)
- Table 61: Eastern Europe Augmented Reality Gaming Market Market Y-o-Y Growth Rate Comparison by Component (2016-2032)
- Table 62: Eastern Europe Augmented Reality Gaming Market Market Y-o-Y Growth Rate Comparison by Device Type (2016-2032)
- Table 63: Eastern Europe Augmented Reality Gaming Market Market Y-o-Y Growth Rate Comparison by End-User (2016-2032)
- Table 64: Eastern Europe Augmented Reality Gaming Market Market Share Comparison by Country (2016-2032)
- Table 65: Eastern Europe Augmented Reality Gaming Market Market Share Comparison by Component (2016-2032)
- Table 66: Eastern Europe Augmented Reality Gaming Market Market Share Comparison by Device Type (2016-2032)
- Table 67: Eastern Europe Augmented Reality Gaming Market Market Share Comparison by End-User (2016-2032)
- Table 68: APAC Augmented Reality Gaming Market Market Comparison by Component (2016-2032)
- Table 69: APAC Augmented Reality Gaming Market Market Comparison by Device Type (2016-2032)
- Table 70: APAC Augmented Reality Gaming Market Market Comparison by End-User (2016-2032)
- Table 71: APAC Augmented Reality Gaming Market Revenue (US$ Mn) Comparison by Country (2016-2032)
- Table 72: APAC Augmented Reality Gaming Market Market Revenue (US$ Mn) (2016-2032)
- Table 73: APAC Augmented Reality Gaming Market Market Revenue (US$ Mn) Comparison by Country (2016-2032)
- Table 74: APAC Augmented Reality Gaming Market Market Revenue (US$ Mn) Comparison by Component (2016-2032)
- Table 75: APAC Augmented Reality Gaming Market Market Revenue (US$ Mn) Comparison by Device Type (2016-2032)
- Table 76: APAC Augmented Reality Gaming Market Market Revenue (US$ Mn) Comparison by End-User (2016-2032)
- Table 77: APAC Augmented Reality Gaming Market Market Y-o-Y Growth Rate Comparison by Country (2016-2032)
- Table 78: APAC Augmented Reality Gaming Market Market Y-o-Y Growth Rate Comparison by Component (2016-2032)
- Table 79: APAC Augmented Reality Gaming Market Market Y-o-Y Growth Rate Comparison by Device Type (2016-2032)
- Table 80: APAC Augmented Reality Gaming Market Market Y-o-Y Growth Rate Comparison by End-User (2016-2032)
- Table 81: APAC Augmented Reality Gaming Market Market Share Comparison by Country (2016-2032)
- Table 82: APAC Augmented Reality Gaming Market Market Share Comparison by Component (2016-2032)
- Table 83: APAC Augmented Reality Gaming Market Market Share Comparison by Device Type (2016-2032)
- Table 84: APAC Augmented Reality Gaming Market Market Share Comparison by End-User (2016-2032)
- Table 85: Latin America Augmented Reality Gaming Market Market Comparison by Component (2016-2032)
- Table 86: Latin America Augmented Reality Gaming Market Market Comparison by Device Type (2016-2032)
- Table 87: Latin America Augmented Reality Gaming Market Market Comparison by End-User (2016-2032)
- Table 88: Latin America Augmented Reality Gaming Market Revenue (US$ Mn) Comparison by Country (2016-2032)
- Table 89: Latin America Augmented Reality Gaming Market Market Revenue (US$ Mn) (2016-2032)
- Table 90: Latin America Augmented Reality Gaming Market Market Revenue (US$ Mn) Comparison by Country (2016-2032)
- Table 91: Latin America Augmented Reality Gaming Market Market Revenue (US$ Mn) Comparison by Component (2016-2032)
- Table 92: Latin America Augmented Reality Gaming Market Market Revenue (US$ Mn) Comparison by Device Type (2016-2032)
- Table 93: Latin America Augmented Reality Gaming Market Market Revenue (US$ Mn) Comparison by End-User (2016-2032)
- Table 94: Latin America Augmented Reality Gaming Market Market Y-o-Y Growth Rate Comparison by Country (2016-2032)
- Table 95: Latin America Augmented Reality Gaming Market Market Y-o-Y Growth Rate Comparison by Component (2016-2032)
- Table 96: Latin America Augmented Reality Gaming Market Market Y-o-Y Growth Rate Comparison by Device Type (2016-2032)
- Table 97: Latin America Augmented Reality Gaming Market Market Y-o-Y Growth Rate Comparison by End-User (2016-2032)
- Table 98: Latin America Augmented Reality Gaming Market Market Share Comparison by Country (2016-2032)
- Table 99: Latin America Augmented Reality Gaming Market Market Share Comparison by Component (2016-2032)
- Table 100: Latin America Augmented Reality Gaming Market Market Share Comparison by Device Type (2016-2032)
- Table 101: Latin America Augmented Reality Gaming Market Market Share Comparison by End-User (2016-2032)
- Table 102: Middle East & Africa Augmented Reality Gaming Market Market Comparison by Component (2016-2032)
- Table 103: Middle East & Africa Augmented Reality Gaming Market Market Comparison by Device Type (2016-2032)
- Table 104: Middle East & Africa Augmented Reality Gaming Market Market Comparison by End-User (2016-2032)
- Table 105: Middle East & Africa Augmented Reality Gaming Market Revenue (US$ Mn) Comparison by Country (2016-2032)
- Table 106: Middle East & Africa Augmented Reality Gaming Market Market Revenue (US$ Mn) (2016-2032)
- Table 107: Middle East & Africa Augmented Reality Gaming Market Market Revenue (US$ Mn) Comparison by Country (2016-2032)
- Table 108: Middle East & Africa Augmented Reality Gaming Market Market Revenue (US$ Mn) Comparison by Component (2016-2032)
- Table 109: Middle East & Africa Augmented Reality Gaming Market Market Revenue (US$ Mn) Comparison by Device Type (2016-2032)
- Table 110: Middle East & Africa Augmented Reality Gaming Market Market Revenue (US$ Mn) Comparison by End-User (2016-2032)
- Table 111: Middle East & Africa Augmented Reality Gaming Market Market Y-o-Y Growth Rate Comparison by Country (2016-2032)
- Table 112: Middle East & Africa Augmented Reality Gaming Market Market Y-o-Y Growth Rate Comparison by Component (2016-2032)
- Table 113: Middle East & Africa Augmented Reality Gaming Market Market Y-o-Y Growth Rate Comparison by Device Type (2016-2032)
- Table 114: Middle East & Africa Augmented Reality Gaming Market Market Y-o-Y Growth Rate Comparison by End-User (2016-2032)
- Table 115: Middle East & Africa Augmented Reality Gaming Market Market Share Comparison by Country (2016-2032)
- Table 116: Middle East & Africa Augmented Reality Gaming Market Market Share Comparison by Component (2016-2032)
- Table 117: Middle East & Africa Augmented Reality Gaming Market Market Share Comparison by Device Type (2016-2032)
- Table 118: Middle East & Africa Augmented Reality Gaming Market Market Share Comparison by End-User (2016-2032)
- 1. Executive Summary
-
- Microsoft Corporation
- Apple Inc.
- Sony Corporation
- Meta Platforms, Inc.
- Niantic, Inc.
- Nintendo Co., Ltd.
- Blippar
- Snap Inc.
- Vuzix Corporation
- Aurasma
- Catchoom Technologies S L
- Metaio
- Total Immersion
- Zappar Ltd.
- Google Inc.
- Augmented Pixels Inc.
- Infinity Augmented Reality Ltd.
- Qualcomm Technologies Inc.
- Wikitude
- VividWorks
- Other Key Players
Our Clients


View Our Licence Options
