Augmented Industrial Reality Market By Application (Warehouse, Manufacturing, Inventory Management, Quality Control), By Component (Hardware, Software), By Technology (Marker based AR technology, Marker less AR technology, Anchor based AR Technology), By End User (Companies, Consumers), By Region And Companies - Industry Segment Outlook, Market Assessment, Competition Scenario, Trends, And Forecast 2024-2033
-
51059
-
September 2024
-
300
-


-
This report was compiled by Vishwa Gaul Vishwa is an experienced market research and consulting professional with over 8 years of expertise in the ICT industry, contributing to over 700 reports across telecommunications, software, hardware, and digital solutions. Correspondence Team Lead- ICT Linkedin | Detailed Market research Methodology Our methodology involves a mix of primary research, including interviews with leading mental health experts, and secondary research from reputable medical journals and databases. View Detailed Methodology Page
-
Quick Navigation
Report Overview
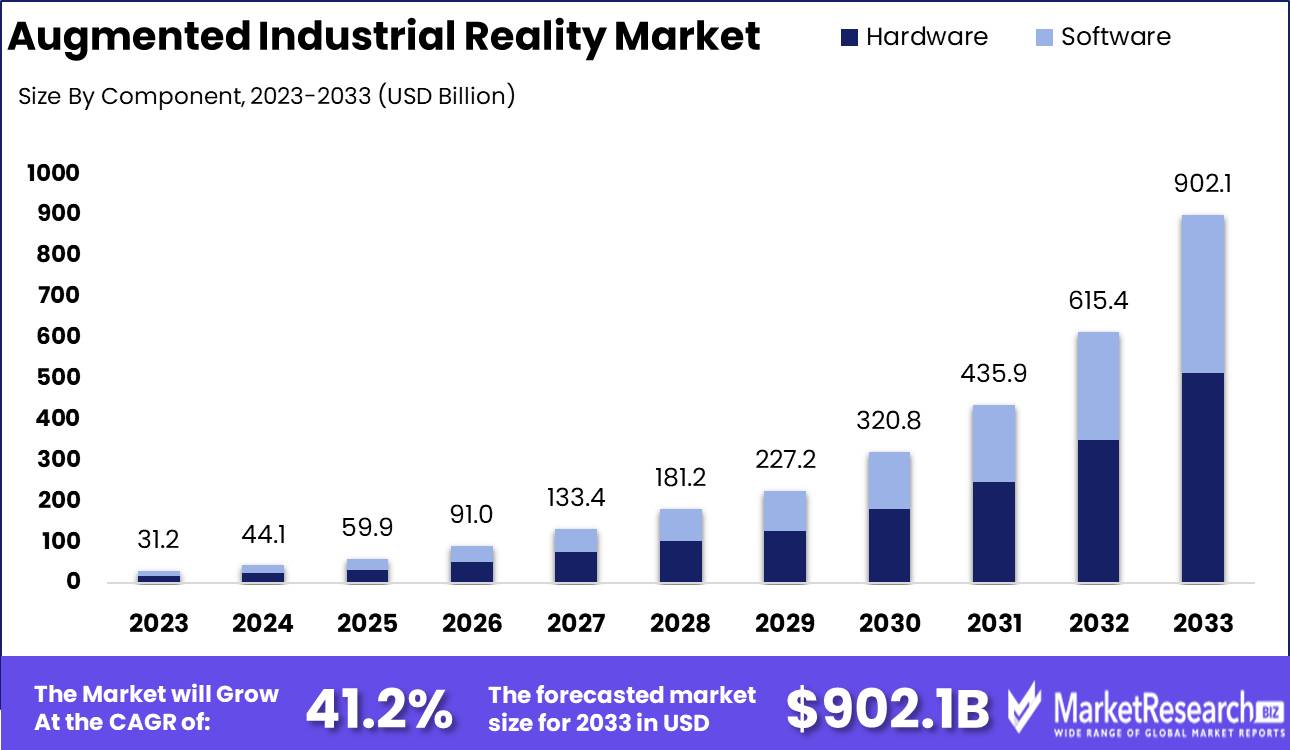
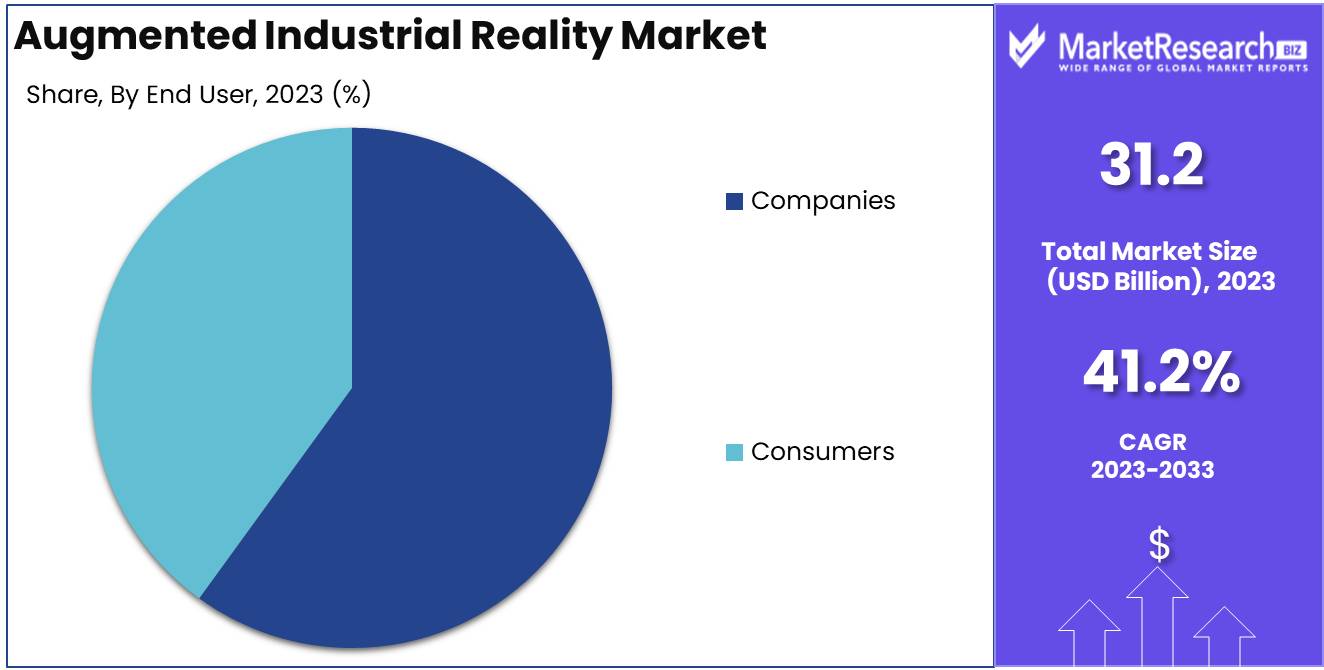
The Augmented Industrial Reality Market was valued at USD 31.2 billion in 2023. It is expected to reach USD 902.1 billion by 2033, with a CAGR of 41.2% during the forecast period from 2024 to 2033.
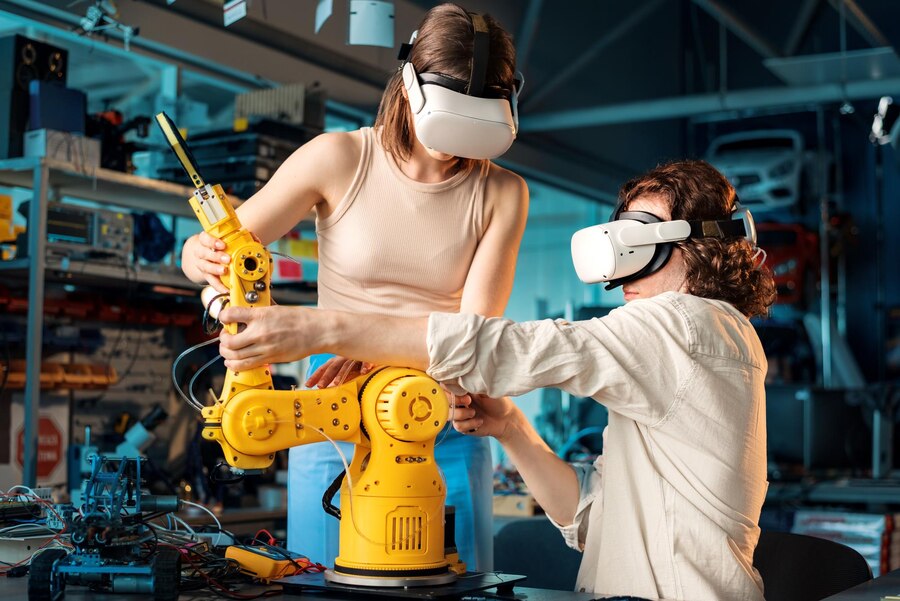
The Augmented Industrial Reality Market refers to the integration of augmented reality (AR) technologies within industrial settings to enhance operational efficiency, safety, and decision-making processes. By overlaying digital information onto physical environments, AR enables real-time visualization of data, improving workflows in manufacturing, maintenance, and training.
The Augmented Industrial Reality (AIR) market is positioned for significant growth, driven by its ability to transform operational efficiency and decision-making in industrial sectors. The demand for real-time data is a key factor fueling this market, as companies seek to enhance productivity by accessing instant, actionable insights. This technology empowers organizations to overlay digital information onto physical environments, facilitating enhanced asset management, predictive maintenance, and remote monitoring. Additionally, AIR’s role in worker safety and training cannot be overlooked. Augmented Reality (AR) applications enable immersive training programs and real-time safety alerts, reducing workplace accidents and ensuring compliance with safety protocols.
However, despite these clear benefits, the market is hindered by the high initial investment required to implement AIR solutions. The need for specialized hardware, software, and skilled personnel creates a barrier to widespread adoption, particularly among smaller enterprises. Nevertheless, ongoing technological advancements are expected to mitigate these challenges by reducing costs and improving scalability. For instance, innovations in wearables and 5G networks are enhancing AIR’s capabilities, offering faster, more reliable connections and greater data processing power. As a result, the long-term outlook for the Augmented Industrial Reality market remains positive, with sustained growth anticipated as industries continue to prioritize operational efficiency, safety, and technological integration.
Key Takeaways
- Market Growth: The Augmented Industrial Reality Market was valued at USD 31.2 billion in 2023. It is expected to reach USD 902.1 billion by 2033, with a CAGR of 41.2% during the forecast period from 2024 to 2033.
- By Application: Warehouses dominated the AR market by optimizing operational efficiency.
- By Component: Hardware dominated the Augmented Industrial Reality Market segment.
- By Technology: Marker-based AR technology dominated industrial augmented reality applications.
- By End User: Dominant Companies drove widespread adoption of Augmented Industrial Reality.
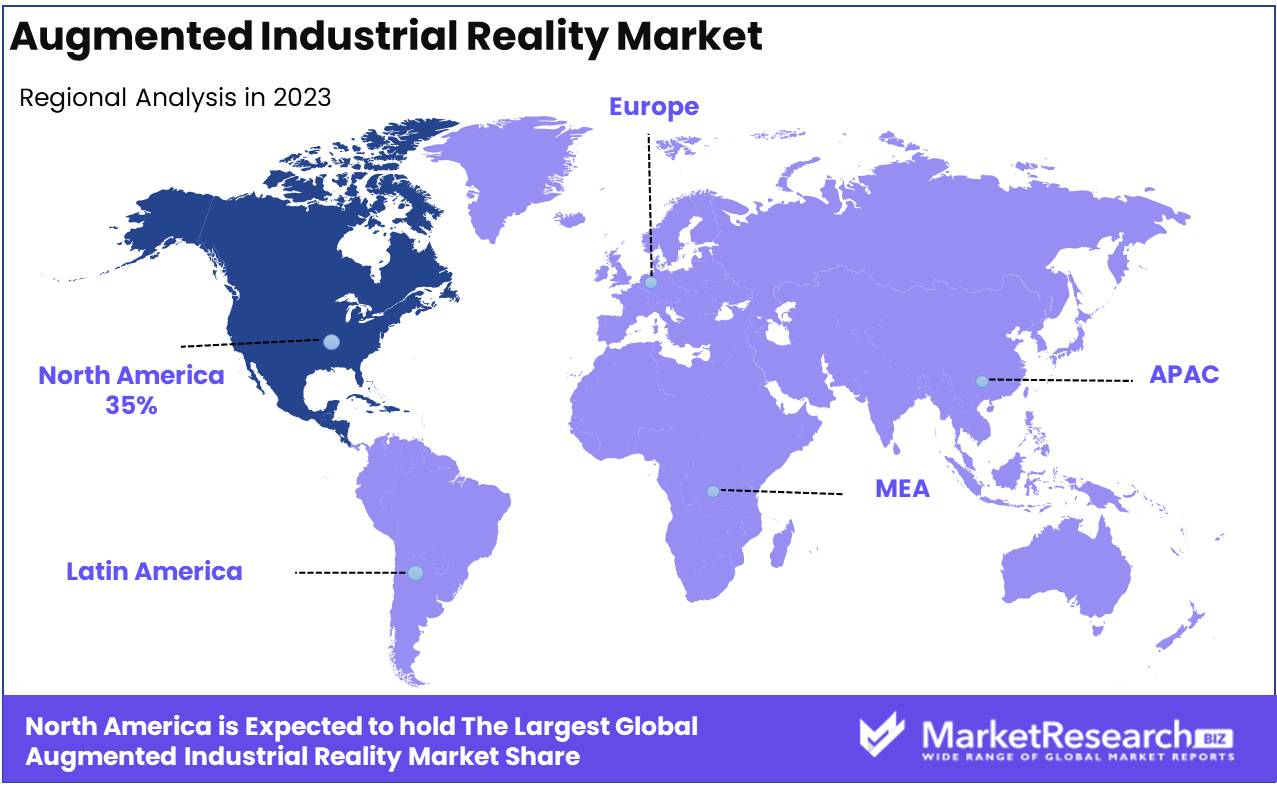
- Regional Dominance: North America dominates the augmented industrial reality market with a 35% largest share.
- Growth Opportunity: The global Augmented Industrial Reality market offers significant growth opportunities, driven by the adoption of AR-assisted assembly processes and virtual safety training, enhancing industrial efficiency and workplace safety.
Driving factors
Increased Demand for Efficiency Drives Adoption of Augmented Industrial Reality Solutions
The growing emphasis on operational efficiency across industrial sectors has become a significant catalyst for the augmented industrial reality (AIR) market. Industries are under continuous pressure to streamline processes, reduce downtime, and enhance workforce productivity. Augmented reality (AR) solutions, by overlaying real-time data on physical environments, provide workers with step-by-step visual instructions, reducing errors and increasing precision.
This demand for efficiency is particularly strong in sectors such as manufacturing, logistics, and maintenance, where AR-driven applications assist in predictive maintenance, real-time monitoring, and remote assistance. By cutting down manual intervention and speeding up troubleshooting, AIR directly enhances productivity. For instance, companies utilizing AR for machine repair can reduce downtime by up to 40%, significantly impacting operational output and cost-effectiveness. As industries seek to maintain competitive advantages, AR solutions become essential tools for achieving greater operational efficiencies.
Technological Advancements Propel Innovation and Adoption in the Augmented Industrial Reality Market
Technological advancements, especially in areas like 5G connectivity, edge computing, and advanced AR devices, are pivotal to the growth of the AIR market. High-speed networks, particularly 5G, enable faster data transfer and real-time, high-quality streaming of AR content, making it possible to deploy AR solutions even in remote or high-demand environments. The enhanced connectivity also allows for more complex AR applications, including multi-user, real-time collaboration in industrial settings.
Additionally, edge computing provides the necessary computational power to process AR applications closer to the source of data, reducing latency and enhancing the overall user experience. This combination of 5G and edge computing ensures that AR solutions can be seamlessly integrated into industrial operations, facilitating complex tasks such as remote diagnostics, virtual prototyping, and real-time simulations.
Furthermore, advancements in AR hardware, including lightweight and ergonomically improved smart glasses, make it easier for workers to use these devices for extended periods. These improvements in comfort, paired with increased processing power and better visualization capabilities, are contributing to the rising adoption of AIR technologies in various industries.
Integration with IoT Enhances the Functionality and Scope of Augmented Industrial Reality Applications
The integration of Augmented Reality with the Internet of Things (IoT) is accelerating the growth of the AIR market by providing real-time, data-rich environments. IoT-enabled devices generate vast amounts of data from industrial machines, equipment, and assets. When combined with AR, this data can be visualized in real-time, enabling workers to interact with digital twins of physical assets or monitor key performance indicators (KPIs) through AR interfaces.
This integration enhances decision-making and predictive maintenance, as AR overlays can guide technicians to parts that require attention, displaying critical information such as temperature, pressure, or operational status directly on the equipment. For example, in the manufacturing sector, IoT-connected sensors paired with AR can notify workers of potential equipment failures before they occur, preventing costly downtime. The combination of AR and IoT leads to improved situational awareness and more efficient workflows, thereby driving the market's expansion.
The synergy between AR and IoT is particularly transformative in industries such as oil & gas, utilities, and transportation, where real-time monitoring of complex, distributed systems is essential. As IoT adoption grows across these sectors, it creates new opportunities for AR to enhance visibility, streamline operations, and provide real-time insights, further contributing to the growth of the AIR market.
Restraining Factors
Lack of Network Connectivity Impedes Real-Time Capabilities
A major restraining factor in the growth of the Augmented Industrial Reality (AIR) market is the limited availability of robust network connectivity, particularly in industrial environments that require constant real-time data exchange. Augmented reality (AR) applications in industries such as manufacturing, logistics, and field services heavily depend on stable, high-speed internet connections to deliver timely, actionable insights through AR overlays. For example, real-time monitoring of machinery or the use of AR for remote assistance in maintenance requires low-latency, high-bandwidth connections to function effectively.
The slow deployment of 5G networks globally exacerbates this issue, especially in remote or rural areas where industrial facilities are often located. The lower network speed and reliability associated with legacy 4G or Wi-Fi networks limit the scalability of AIR solutions, reducing operational efficiency and worker productivity, and thus dampening market growth. The shift toward Industry 4.0 is reliant on advanced connectivity infrastructure, and any delays in network improvements directly constrain the adoption rate of AR technologies in industrial sectors.
While 5G technology has been projected to reach widespread coverage in the coming years, the current lack of consistent high-speed connectivity represents a significant barrier to the accelerated growth of the AIR market.
Content and Data Availability Constrains Practical Implementation
Another critical restraining factor is the limited availability of contextually relevant and accurate AR content and industrial data, which significantly affects the utility and deployment of AIR technologies. For AR applications to provide value in industrial settings, they must rely on detailed, up-to-date 3D models, schematics, machine data, and operational protocols to enhance user experience and decision-making processes.
However, industries often face challenges in generating, integrating, and updating the necessary data for AR platforms. Legacy systems, proprietary data formats, and inconsistent data collection methods further complicate the creation of AR-compatible content. Moreover, a lack of standardized formats across various industries means that adapting AR solutions to specific industrial environments can be costly and time-consuming. For instance, developing AR overlays for a particular machine requires a digital twin or accurate 3D models, which might not be readily available for older machinery or systems.
By Application Analysis
In 2023, Warehouses dominated the AR market by optimizing operational efficiency.
In 2023, The Warehouse segment held a dominant market position in the "By Application" segment of the Augmented Industrial Reality (AR) Market. The integration of AR in warehouses significantly improved operational efficiency by optimizing logistics, real-time tracking, and error reduction in stock handling. The adoption of AR solutions enabled seamless inventory management, enhancing workers' productivity and minimizing mistakes during pick and pack operations. The technology also enabled real-time data visualization and remote assistance, streamlining complex warehouse processes.
Manufacturing was another key segment in 2023, leveraging AR to facilitate machine maintenance, training, and complex assembly operations. The technology provided on-the-spot guidance, reducing errors and enhancing precision, resulting in lower downtime and improved operational outcomes.
Inventory management saw substantial growth as AR applications enabled more accurate stock monitoring, predictive analytics for stock replenishment, and enhanced transparency throughout the supply chain.
Quality control benefited from AR by offering real-time defect detection and detailed inspection tools, enabling manufacturers to maintain higher standards while reducing waste. AR-based quality assurance tools minimized human error, improving product consistency and compliance with industry standards.
By Component Analysis
In 2023, Hardware dominated the Augmented Industrial Reality Market segment.
In 2023, Hardware held a dominant market position in the "By Component" segment of the Augmented Industrial Reality Market. The hardware component, which includes devices such as smart glasses, head-mounted displays (HMDs), sensors, and cameras, accounted for a significant share due to the increasing adoption of these devices across various industrial sectors. Factors driving this growth include enhanced performance, improved durability, and advancements in wireless connectivity. Hardware advancements also allowed for better integration of augmented reality (AR) systems in complex industrial applications, including manufacturing, logistics, and maintenance.
On the other hand, software also played a vital role in driving the Augmented Industrial Reality Market. Software solutions that enable AR experiences such as AR content creation tools, platforms for industrial applications, and data analytics tools are essential for the smooth operation of AR hardware. Software's adaptability and scalability across industries like automotive, aerospace, and healthcare provide significant growth opportunities in the forecast period.
By Technology Analysis
In 2023, Marker-based AR technology dominated industrial augmented reality applications.
In 2023, Marker-based AR technology held a dominant market position in the By Technology segment of the Augmented Industrial Reality Market. This technology relies on predefined visual markers, such as QR codes or images, to trigger the display of augmented content, providing highly accurate and stable AR experiences in industrial settings. It is widely utilized for assembly line guidance, quality control, and maintenance tasks due to its precision and low computational requirements, making it particularly suitable for environments where reliability is critical.
In contrast, Marker-less AR technology uses object recognition or spatial tracking to deliver augmented content without the need for specific markers. This method enables greater flexibility and ease of use across varied industrial applications, such as remote assistance and complex design visualizations. It is increasingly adopted in scenarios where dynamic environments or non-structured tasks demand a more adaptable solution.
Finally, Anchor-based AR technology leverages geospatial anchors and digital coordinates to create persistent AR content, which is especially effective for large-scale projects like site inspections or infrastructure maintenance, offering long-term AR experiences tied to specific physical locations.
By End User Analysis
In 2023, dominant companies drove the widespread adoption of Augmented Industrial Reality.
In 2023, Several key companies held a dominant market position in the end-user segment of the Augmented Industrial Reality (AIR) Market. Major players such as Microsoft, PTC, and Siemens maintained their leadership through a robust portfolio of advanced augmented reality (AR) solutions targeting industries like manufacturing, automotive, and healthcare. Their dominance can be attributed to their strong R&D capabilities, strategic partnerships, and the adoption of AR technologies to enhance productivity, training, and maintenance operations. These companies have focused on integrating AR with IoT and AI to create comprehensive solutions, driving demand across industrial sectors.
Meanwhile, consumers of Augmented Industrial Reality have been increasingly leveraging these solutions to enhance operational efficiency, streamline workflows, and minimize downtime. The adoption is particularly high in sectors requiring precision and real-time data analytics, such as aerospace, defense, and energy. End users are attracted to the tangible benefits of AIR in improving safety, reducing errors, and optimizing production lines, creating a surge in demand that contributes to the market's overall growth trajectory. The convergence of AR, AI, and digital twin technologies has further accelerated consumer adoption in this segment.
Key Market Segments
By Application
- Warehouse
- Manufacturing
- Inventory Management
- Quality Control
By Component
- Hardware
- Software
By Technology
- Marker-based AR technology
- Markerless AR technology
- Anchor-based AR Technology
By End User
- Companies
- Consumers
Growth Opportunity
Increasing Adoption of AR-Assisted Assembly Processes
One of the significant growth opportunities for the global Augmented Industrial Reality (AR) market is the increasing adoption of AR-assisted assembly processes. As industries continue to face challenges related to complex assembly lines and quality assurance, AR is poised to streamline operations by providing real-time, step-by-step visual guidance to workers. This not only improves assembly speed but also reduces the margin for error, thus leading to higher efficiency and cost savings. The automotive and aerospace sectors are particularly seeing early adoption of these technologies, allowing workers to enhance their productivity and ensure precision in the manufacturing process.
Expanding Utilization of AR for Virtual Safety Training
Another key opportunity lies in the utilization of AR for virtual safety training, especially in industries like oil & gas, construction, and heavy manufacturing. Traditional safety training methods can be costly, time-consuming, and often disconnected from real-world scenarios. AR offers an immersive, risk-free environment where employees can learn and practice safety protocols virtually, reducing the likelihood of workplace accidents. As global regulations around workplace safety become more stringent, AR-powered training solutions are gaining traction, offering companies an efficient and effective way to ensure compliance while protecting their workforce.
Latest Trends
Integration with Artificial Intelligence (AI)
The integration of Artificial Intelligence (AI) is expected to accelerate the growth of the Augmented Industrial Reality (AIR) market. AI's ability to process and analyze vast amounts of data in real time will enhance the precision and functionality of AIR solutions. By enabling more intuitive interfaces and predictive maintenance, AI will help streamline complex industrial processes. Machine learning algorithms embedded within AIR systems can facilitate real-time decision-making, optimizing performance in industries such as manufacturing, logistics, and energy. This integration is also expected to drive the development of autonomous systems, reducing reliance on human operators and improving operational efficiency.
Increased Adoption in Healthcare
The healthcare sector will likely witness a significant increase in the adoption of Augmented Industrial Reality. AIR solutions are poised to revolutionize medical training, remote surgeries, and diagnostics by overlaying critical information in the real world. Surgeons can benefit from real-time visual aids during procedures, while medical professionals can receive advanced training through immersive simulations.
Additionally, AIR is anticipated to improve patient care by providing enhanced diagnostic tools and enabling more accurate, data-driven treatments. As healthcare providers seek innovative solutions to improve outcomes and reduce costs, AIR adoption will become a key growth driver in the sector.
Regional Analysis
North America dominates the augmented industrial reality market with a 35% largest share.
The augmented industrial reality (AR) market exhibits significant regional variation, with North America leading as the dominant region, accounting for approximately 35% of the market share in 2023. The region’s dominance is driven by high technology adoption rates, a strong industrial base, and the presence of key AR solution providers such as PTC, Microsoft, and Google. The U.S. and Canada are the primary contributors to this growth, supported by increasing investments in smart manufacturing and digital transformation across various industries.
Europe follows closely, holding around 25% of the market share. Countries like Germany, France, and the UK are at the forefront, leveraging AR for advanced manufacturing, automotive, and aerospace industries. The European Union’s emphasis on Industry 4.0 further boosts the adoption of AR technologies.
In the Asia Pacific, rapid industrialization, particularly in China, Japan, and South Korea, is propelling the market, which holds nearly 22% of the global share. The region’s burgeoning manufacturing sector and government initiatives supporting industrial innovation contribute to its growth.
Meanwhile, the Middle East & Africa and Latin America are emerging markets with a combined share of about 18%, where industrial modernization and increased investments in infrastructure are driving adoption, albeit at a slower pace compared to other regions.
Key Regions and Countries
North America
- The US
- Canada
- Rest of North America
Europe
- Germany
- France
- The UK
- Spain
- Netherlands
- Russia
- Italy
- Rest of Europe
Asia-Pacific
- China
- Japan
- Singapore
- Thailand
- South Korea
- Vietnam
- India
- New Zealand
- Rest of Asia Pacific
Latin America
- Mexico
- Brazil
- Rest of Latin America
Middle East & Africa
- Saudi Arabia
- South Africa
- UAE
- Rest of the Middle East & Africa
Key Players Analysis
The global augmented industrial reality market is expected to experience significant advancements, driven by the strategic initiatives of key players. Companies such as Apple Inc., Google LLC, and Microsoft Corporation are leveraging their established ecosystems and advanced AR technologies to enhance industrial applications. Apple's focus on integrating AR into its hardware and software platforms positions it as a major contributor to the market's growth, particularly in the manufacturing and design industries.
Google LLC continues to enhance its AR capabilities, particularly through Google Glass, targeting enterprise applications like training and remote assistance. Similarly, Microsoft's HoloLens is a key product in industrial settings, enabling real-time collaboration and augmented visualization for complex tasks.
Emerging players like Magic Leap and Vuzix Corporation focus on enterprise-focused AR solutions, with Magic Leap innovating in areas such as remote collaboration and AR-assisted workflows, while Vuzix is expanding its AR smart glasses offerings across various industrial sectors.
Meta and Snap Inc., traditionally consumer-focused companies, are diversifying their AR applications toward enterprise use cases, particularly in training and remote support. Lenovo Group and Sony Corporation are enhancing AR hardware, while PTC Inc. leads in providing industrial AR software solutions, driving digital transformation in areas such as maintenance, product design, and training.
Key players such as TeamViewer AG, Wikitude GmbH, and Blippar Limited contribute to the market by offering scalable AR software and services, while companies like Xiaomi and Zappar Limited expand affordable AR solutions, particularly in emerging markets.
Market Key Players
- Apple, Inc.
- Blippar Limited
- Google LLC
- Lenovo Group
- Magic Leap, Incorporated
- Meta
- Microsoft Corporation
- PTC Inc.
- Snap, Inc.
- Sony Corporation
- TeamViewer AG
- Vuzix Corporation
- Wikitude GmbH
- Xiaomi Corporation
- Zappar Limited
Recent Development
- In August 2024, Microsoft announced new partnerships to deploy its HoloLens 2 in various industrial sectors. The device’s capabilities, such as real-time collaboration, hand and eye tracking, and spatial mapping, have been further refined for use in design, training, and remote assistance in industries like automotive and manufacturing. This development emphasizes mixed reality's growing role in streamlining industrial operations.
- In July 2024, Vuzix Corporation released significant updates to its M4000 AR glasses, enhancing its performance for professional use across industries like logistics, healthcare, and field services. The M4000 now supports advanced features such as a transparent waveguide display and a Qualcomm XR1 processor, designed to improve hands-free operations in challenging environments. This upgrade aims to bolster workplace productivity and safety.
- In February 2024, Atlas Copco AB strategically acquired Extend3D GmbH, a leader in AR-based visual guidance systems. This move expands Atlas Copco's ability to integrate augmented reality into industrial applications like assembly, maintenance, and quality assurance, further enhancing efficiency in manufacturing processes. The acquisition aligns with the company's strategy to lead innovations in industrial tools and systems.
Report Scope
Report Features Description Market Value (2023) USD 31.2 Billion Forecast Revenue (2033) USD 902.1 Billion CAGR (2024-2032) 41.2% Base Year for Estimation 2023 Historic Period 2016-2023 Forecast Period 2024-2033 Report Coverage Revenue Forecast, Market Dynamics, COVID-19 Impact, Competitive Landscape, Recent Developments Segments Covered By Application (Warehouse, Manufacturing, Inventory Management, Quality Control), By Component (Hardware, Software), By Technology (Marker based AR technology, Markerless AR technology, Anchor based AR Technology), By End User (Companies, Consumers) Regional Analysis North America - The US, Canada, Rest of North America, Europe - Germany, France, The UK, Spain, Italy, Russia, Netherlands, Rest of Europe, Asia-Pacific - China, Japan, South Korea, India, New Zealand, Singapore, Thailand, Vietnam, Rest of Asia Pacific, Latin America - Brazil, Mexico, Rest of Latin America, Middle East & Africa - South Africa, Saudi Arabia, UAE, Rest of Middle East & Africa Competitive Landscape Apple, Inc., Blippar Limited, Google LLC, Lenovo Group, Magic Leap, Incorporated, Meta, Microsoft Corporation, PTC Inc., Snap, Inc., Sony Corporation, TeamViewer AG, Vuzix Corporation, Wikitude GmbH, Xiaomi Corporation, Zappar Limited Customization Scope Customization for segments, region/country-level will be provided. Moreover, additional customization can be done based on the requirements. Purchase Options We have three licenses to opt for Single User License, Multi-User License (Up to 5 Users), Corporate Use License (Unlimited User and Printable PDF) -
- 1. Executive Summary
- 1.1. Definition
- 1.2. Taxonomy
- 1.3. Research Scope
- 1.4. Key Analysis
- 1.5. Key Findings by Major Segments
- 1.6. Top strategies by Major Players
- 2. Global Augmented Industrial Reality Market Overview
- 2.1. Augmented Industrial Reality Market Dynamics
- 2.1.1. Drivers
- 2.1.2. Opportunities
- 2.1.3. Restraints
- 2.1.4. Challenges
- 2.2. Macro-economic Factors
- 2.3. Regulatory Framework
- 2.4. Market Investment Feasibility Index
- 2.5. PEST Analysis
- 2.6. PORTER’S Five Force Analysis
- 2.7. Drivers & Restraints Impact Analysis
- 2.8. Industry Chain Analysis
- 2.9. Cost Structure Analysis
- 2.10. Marketing Strategy
- 2.11. Russia-Ukraine War Impact Analysis
- 2.12. Opportunity Map Analysis
- 2.13. Market Competition Scenario Analysis
- 2.14. Product Life Cycle Analysis
- 2.15. Opportunity Orbits
- 2.16. Manufacturer Intensity Map
- 2.17. Major Companies sales by Value & Volume
- 2.1. Augmented Industrial Reality Market Dynamics
- 3. Global Augmented Industrial Reality Market Analysis, Opportunity and Forecast, 2016-2032
- 3.1. Global Augmented Industrial Reality Market Analysis, 2016-2021
- 3.2. Global Augmented Industrial Reality Market Opportunity and Forecast, 2023-2032
- 3.3. Global Augmented Industrial Reality Market Analysis, Opportunity and Forecast, By Application, 2016-2032
- 3.3.1. Global Augmented Industrial Reality Market Analysis by Application: Introduction
- 3.3.2. Market Size Absolute $ Opportunity Analysis and Forecast, By Application, 2016-2032
- 3.3.3. Warehouse
- 3.3.4. Manufacturing
- 3.3.5. Inventory Management
- 3.3.6. Quality Control
- 3.4. Global Augmented Industrial Reality Market Analysis, Opportunity and Forecast, By Component, 2016-2032
- 3.4.1. Global Augmented Industrial Reality Market Analysis by Component: Introduction
- 3.4.2. Market Size Absolute $ Opportunity Analysis and Forecast, By Component, 2016-2032
- 3.4.3. Hardware
- 3.4.4. Software
- 3.5. Global Augmented Industrial Reality Market Analysis, Opportunity and Forecast, By Technology, 2016-2032
- 3.5.1. Global Augmented Industrial Reality Market Analysis by Technology: Introduction
- 3.5.2. Market Size Absolute $ Opportunity Analysis and Forecast, By Technology, 2016-2032
- 3.5.3. Marker based AR technology
- 3.5.4. Marker less AR technology
- 3.5.5. Anchor based AR Technology
- 3.6. Global Augmented Industrial Reality Market Analysis, Opportunity and Forecast, By End User, 2016-2032
- 3.6.1. Global Augmented Industrial Reality Market Analysis by End User: Introduction
- 3.6.2. Market Size Absolute $ Opportunity Analysis and Forecast, By End User, 2016-2032
- 3.6.3. Companies
- 3.6.4. Consumers
- 4. North America Augmented Industrial Reality Market Analysis, Opportunity and Forecast, 2016-2032
- 4.1. North America Augmented Industrial Reality Market Analysis, 2016-2021
- 4.2. North America Augmented Industrial Reality Market Opportunity and Forecast, 2023-2032
- 4.3. North America Augmented Industrial Reality Market Analysis, Opportunity and Forecast, By Application, 2016-2032
- 4.3.1. North America Augmented Industrial Reality Market Analysis by Application: Introduction
- 4.3.2. Market Size Absolute $ Opportunity Analysis and Forecast, By Application, 2016-2032
- 4.3.3. Warehouse
- 4.3.4. Manufacturing
- 4.3.5. Inventory Management
- 4.3.6. Quality Control
- 4.4. North America Augmented Industrial Reality Market Analysis, Opportunity and Forecast, By Component, 2016-2032
- 4.4.1. North America Augmented Industrial Reality Market Analysis by Component: Introduction
- 4.4.2. Market Size Absolute $ Opportunity Analysis and Forecast, By Component, 2016-2032
- 4.4.3. Hardware
- 4.4.4. Software
- 4.5. North America Augmented Industrial Reality Market Analysis, Opportunity and Forecast, By Technology, 2016-2032
- 4.5.1. North America Augmented Industrial Reality Market Analysis by Technology: Introduction
- 4.5.2. Market Size Absolute $ Opportunity Analysis and Forecast, By Technology, 2016-2032
- 4.5.3. Marker based AR technology
- 4.5.4. Marker less AR technology
- 4.5.5. Anchor based AR Technology
- 4.6. North America Augmented Industrial Reality Market Analysis, Opportunity and Forecast, By End User, 2016-2032
- 4.6.1. North America Augmented Industrial Reality Market Analysis by End User: Introduction
- 4.6.2. Market Size Absolute $ Opportunity Analysis and Forecast, By End User, 2016-2032
- 4.6.3. Companies
- 4.6.4. Consumers
- 4.7. North America Augmented Industrial Reality Market Analysis, Opportunity and Forecast, By Country , 2016-2032
- 4.7.1. North America Augmented Industrial Reality Market Analysis by Country : Introduction
- 4.7.2. Market Size Absolute $ Opportunity Analysis and Forecast, Country , 2016-2032
- 4.7.2.1. The US
- 4.7.2.2. Canada
- 4.7.2.3. Mexico
- 5. Western Europe Augmented Industrial Reality Market Analysis, Opportunity and Forecast, 2016-2032
- 5.1. Western Europe Augmented Industrial Reality Market Analysis, 2016-2021
- 5.2. Western Europe Augmented Industrial Reality Market Opportunity and Forecast, 2023-2032
- 5.3. Western Europe Augmented Industrial Reality Market Analysis, Opportunity and Forecast, By Application, 2016-2032
- 5.3.1. Western Europe Augmented Industrial Reality Market Analysis by Application: Introduction
- 5.3.2. Market Size Absolute $ Opportunity Analysis and Forecast, By Application, 2016-2032
- 5.3.3. Warehouse
- 5.3.4. Manufacturing
- 5.3.5. Inventory Management
- 5.3.6. Quality Control
- 5.4. Western Europe Augmented Industrial Reality Market Analysis, Opportunity and Forecast, By Component, 2016-2032
- 5.4.1. Western Europe Augmented Industrial Reality Market Analysis by Component: Introduction
- 5.4.2. Market Size Absolute $ Opportunity Analysis and Forecast, By Component, 2016-2032
- 5.4.3. Hardware
- 5.4.4. Software
- 5.5. Western Europe Augmented Industrial Reality Market Analysis, Opportunity and Forecast, By Technology, 2016-2032
- 5.5.1. Western Europe Augmented Industrial Reality Market Analysis by Technology: Introduction
- 5.5.2. Market Size Absolute $ Opportunity Analysis and Forecast, By Technology, 2016-2032
- 5.5.3. Marker based AR technology
- 5.5.4. Marker less AR technology
- 5.5.5. Anchor based AR Technology
- 5.6. Western Europe Augmented Industrial Reality Market Analysis, Opportunity and Forecast, By End User, 2016-2032
- 5.6.1. Western Europe Augmented Industrial Reality Market Analysis by End User: Introduction
- 5.6.2. Market Size Absolute $ Opportunity Analysis and Forecast, By End User, 2016-2032
- 5.6.3. Companies
- 5.6.4. Consumers
- 5.7. Western Europe Augmented Industrial Reality Market Analysis, Opportunity and Forecast, By Country , 2016-2032
- 5.7.1. Western Europe Augmented Industrial Reality Market Analysis by Country : Introduction
- 5.7.2. Market Size Absolute $ Opportunity Analysis and Forecast, Country , 2016-2032
- 5.7.2.1. Germany
- 5.7.2.2. France
- 5.7.2.3. The UK
- 5.7.2.4. Spain
- 5.7.2.5. Italy
- 5.7.2.6. Portugal
- 5.7.2.7. Ireland
- 5.7.2.8. Austria
- 5.7.2.9. Switzerland
- 5.7.2.10. Benelux
- 5.7.2.11. Nordic
- 5.7.2.12. Rest of Western Europe
- 6. Eastern Europe Augmented Industrial Reality Market Analysis, Opportunity and Forecast, 2016-2032
- 6.1. Eastern Europe Augmented Industrial Reality Market Analysis, 2016-2021
- 6.2. Eastern Europe Augmented Industrial Reality Market Opportunity and Forecast, 2023-2032
- 6.3. Eastern Europe Augmented Industrial Reality Market Analysis, Opportunity and Forecast, By Application, 2016-2032
- 6.3.1. Eastern Europe Augmented Industrial Reality Market Analysis by Application: Introduction
- 6.3.2. Market Size Absolute $ Opportunity Analysis and Forecast, By Application, 2016-2032
- 6.3.3. Warehouse
- 6.3.4. Manufacturing
- 6.3.5. Inventory Management
- 6.3.6. Quality Control
- 6.4. Eastern Europe Augmented Industrial Reality Market Analysis, Opportunity and Forecast, By Component, 2016-2032
- 6.4.1. Eastern Europe Augmented Industrial Reality Market Analysis by Component: Introduction
- 6.4.2. Market Size Absolute $ Opportunity Analysis and Forecast, By Component, 2016-2032
- 6.4.3. Hardware
- 6.4.4. Software
- 6.5. Eastern Europe Augmented Industrial Reality Market Analysis, Opportunity and Forecast, By Technology, 2016-2032
- 6.5.1. Eastern Europe Augmented Industrial Reality Market Analysis by Technology: Introduction
- 6.5.2. Market Size Absolute $ Opportunity Analysis and Forecast, By Technology, 2016-2032
- 6.5.3. Marker based AR technology
- 6.5.4. Marker less AR technology
- 6.5.5. Anchor based AR Technology
- 6.6. Eastern Europe Augmented Industrial Reality Market Analysis, Opportunity and Forecast, By End User, 2016-2032
- 6.6.1. Eastern Europe Augmented Industrial Reality Market Analysis by End User: Introduction
- 6.6.2. Market Size Absolute $ Opportunity Analysis and Forecast, By End User, 2016-2032
- 6.6.3. Companies
- 6.6.4. Consumers
- 6.7. Eastern Europe Augmented Industrial Reality Market Analysis, Opportunity and Forecast, By Country , 2016-2032
- 6.7.1. Eastern Europe Augmented Industrial Reality Market Analysis by Country : Introduction
- 6.7.2. Market Size Absolute $ Opportunity Analysis and Forecast, Country , 2016-2032
- 6.7.2.1. Russia
- 6.7.2.2. Poland
- 6.7.2.3. The Czech Republic
- 6.7.2.4. Greece
- 6.7.2.5. Rest of Eastern Europe
- 7. APAC Augmented Industrial Reality Market Analysis, Opportunity and Forecast, 2016-2032
- 7.1. APAC Augmented Industrial Reality Market Analysis, 2016-2021
- 7.2. APAC Augmented Industrial Reality Market Opportunity and Forecast, 2023-2032
- 7.3. APAC Augmented Industrial Reality Market Analysis, Opportunity and Forecast, By Application, 2016-2032
- 7.3.1. APAC Augmented Industrial Reality Market Analysis by Application: Introduction
- 7.3.2. Market Size Absolute $ Opportunity Analysis and Forecast, By Application, 2016-2032
- 7.3.3. Warehouse
- 7.3.4. Manufacturing
- 7.3.5. Inventory Management
- 7.3.6. Quality Control
- 7.4. APAC Augmented Industrial Reality Market Analysis, Opportunity and Forecast, By Component, 2016-2032
- 7.4.1. APAC Augmented Industrial Reality Market Analysis by Component: Introduction
- 7.4.2. Market Size Absolute $ Opportunity Analysis and Forecast, By Component, 2016-2032
- 7.4.3. Hardware
- 7.4.4. Software
- 7.5. APAC Augmented Industrial Reality Market Analysis, Opportunity and Forecast, By Technology, 2016-2032
- 7.5.1. APAC Augmented Industrial Reality Market Analysis by Technology: Introduction
- 7.5.2. Market Size Absolute $ Opportunity Analysis and Forecast, By Technology, 2016-2032
- 7.5.3. Marker based AR technology
- 7.5.4. Marker less AR technology
- 7.5.5. Anchor based AR Technology
- 7.6. APAC Augmented Industrial Reality Market Analysis, Opportunity and Forecast, By End User, 2016-2032
- 7.6.1. APAC Augmented Industrial Reality Market Analysis by End User: Introduction
- 7.6.2. Market Size Absolute $ Opportunity Analysis and Forecast, By End User, 2016-2032
- 7.6.3. Companies
- 7.6.4. Consumers
- 7.7. APAC Augmented Industrial Reality Market Analysis, Opportunity and Forecast, By Country , 2016-2032
- 7.7.1. APAC Augmented Industrial Reality Market Analysis by Country : Introduction
- 7.7.2. Market Size Absolute $ Opportunity Analysis and Forecast, Country , 2016-2032
- 7.7.2.1. China
- 7.7.2.2. Japan
- 7.7.2.3. South Korea
- 7.7.2.4. India
- 7.7.2.5. Australia & New Zeland
- 7.7.2.6. Indonesia
- 7.7.2.7. Malaysia
- 7.7.2.8. Philippines
- 7.7.2.9. Singapore
- 7.7.2.10. Thailand
- 7.7.2.11. Vietnam
- 7.7.2.12. Rest of APAC
- 8. Latin America Augmented Industrial Reality Market Analysis, Opportunity and Forecast, 2016-2032
- 8.1. Latin America Augmented Industrial Reality Market Analysis, 2016-2021
- 8.2. Latin America Augmented Industrial Reality Market Opportunity and Forecast, 2023-2032
- 8.3. Latin America Augmented Industrial Reality Market Analysis, Opportunity and Forecast, By Application, 2016-2032
- 8.3.1. Latin America Augmented Industrial Reality Market Analysis by Application: Introduction
- 8.3.2. Market Size Absolute $ Opportunity Analysis and Forecast, By Application, 2016-2032
- 8.3.3. Warehouse
- 8.3.4. Manufacturing
- 8.3.5. Inventory Management
- 8.3.6. Quality Control
- 8.4. Latin America Augmented Industrial Reality Market Analysis, Opportunity and Forecast, By Component, 2016-2032
- 8.4.1. Latin America Augmented Industrial Reality Market Analysis by Component: Introduction
- 8.4.2. Market Size Absolute $ Opportunity Analysis and Forecast, By Component, 2016-2032
- 8.4.3. Hardware
- 8.4.4. Software
- 8.5. Latin America Augmented Industrial Reality Market Analysis, Opportunity and Forecast, By Technology, 2016-2032
- 8.5.1. Latin America Augmented Industrial Reality Market Analysis by Technology: Introduction
- 8.5.2. Market Size Absolute $ Opportunity Analysis and Forecast, By Technology, 2016-2032
- 8.5.3. Marker based AR technology
- 8.5.4. Marker less AR technology
- 8.5.5. Anchor based AR Technology
- 8.6. Latin America Augmented Industrial Reality Market Analysis, Opportunity and Forecast, By End User, 2016-2032
- 8.6.1. Latin America Augmented Industrial Reality Market Analysis by End User: Introduction
- 8.6.2. Market Size Absolute $ Opportunity Analysis and Forecast, By End User, 2016-2032
- 8.6.3. Companies
- 8.6.4. Consumers
- 8.7. Latin America Augmented Industrial Reality Market Analysis, Opportunity and Forecast, By Country , 2016-2032
- 8.7.1. Latin America Augmented Industrial Reality Market Analysis by Country : Introduction
- 8.7.2. Market Size Absolute $ Opportunity Analysis and Forecast, Country , 2016-2032
- 8.7.2.1. Brazil
- 8.7.2.2. Colombia
- 8.7.2.3. Chile
- 8.7.2.4. Argentina
- 8.7.2.5. Costa Rica
- 8.7.2.6. Rest of Latin America
- 9. Middle East & Africa Augmented Industrial Reality Market Analysis, Opportunity and Forecast, 2016-2032
- 9.1. Middle East & Africa Augmented Industrial Reality Market Analysis, 2016-2021
- 9.2. Middle East & Africa Augmented Industrial Reality Market Opportunity and Forecast, 2023-2032
- 9.3. Middle East & Africa Augmented Industrial Reality Market Analysis, Opportunity and Forecast, By Application, 2016-2032
- 9.3.1. Middle East & Africa Augmented Industrial Reality Market Analysis by Application: Introduction
- 9.3.2. Market Size Absolute $ Opportunity Analysis and Forecast, By Application, 2016-2032
- 9.3.3. Warehouse
- 9.3.4. Manufacturing
- 9.3.5. Inventory Management
- 9.3.6. Quality Control
- 9.4. Middle East & Africa Augmented Industrial Reality Market Analysis, Opportunity and Forecast, By Component, 2016-2032
- 9.4.1. Middle East & Africa Augmented Industrial Reality Market Analysis by Component: Introduction
- 9.4.2. Market Size Absolute $ Opportunity Analysis and Forecast, By Component, 2016-2032
- 9.4.3. Hardware
- 9.4.4. Software
- 9.5. Middle East & Africa Augmented Industrial Reality Market Analysis, Opportunity and Forecast, By Technology, 2016-2032
- 9.5.1. Middle East & Africa Augmented Industrial Reality Market Analysis by Technology: Introduction
- 9.5.2. Market Size Absolute $ Opportunity Analysis and Forecast, By Technology, 2016-2032
- 9.5.3. Marker based AR technology
- 9.5.4. Marker less AR technology
- 9.5.5. Anchor based AR Technology
- 9.6. Middle East & Africa Augmented Industrial Reality Market Analysis, Opportunity and Forecast, By End User, 2016-2032
- 9.6.1. Middle East & Africa Augmented Industrial Reality Market Analysis by End User: Introduction
- 9.6.2. Market Size Absolute $ Opportunity Analysis and Forecast, By End User, 2016-2032
- 9.6.3. Companies
- 9.6.4. Consumers
- 9.7. Middle East & Africa Augmented Industrial Reality Market Analysis, Opportunity and Forecast, By Country , 2016-2032
- 9.7.1. Middle East & Africa Augmented Industrial Reality Market Analysis by Country : Introduction
- 9.7.2. Market Size Absolute $ Opportunity Analysis and Forecast, Country , 2016-2032
- 9.7.2.1. Algeria
- 9.7.2.2. Egypt
- 9.7.2.3. Israel
- 9.7.2.4. Kuwait
- 9.7.2.5. Nigeria
- 9.7.2.6. Saudi Arabia
- 9.7.2.7. South Africa
- 9.7.2.8. Turkey
- 9.7.2.9. The UAE
- 9.7.2.10. Rest of MEA
- 10. Global Augmented Industrial Reality Market Analysis, Opportunity and Forecast, By Region , 2016-2032
- 10.1. Global Augmented Industrial Reality Market Analysis by Region : Introduction
- 10.2. Market Size Absolute $ Opportunity Analysis and Forecast, By Region , 2016-2032
- 10.2.1. North America
- 10.2.2. Western Europe
- 10.2.3. Eastern Europe
- 10.2.4. APAC
- 10.2.5. Latin America
- 10.2.6. Middle East & Africa
- 11. Global Augmented Industrial Reality Market Competitive Landscape, Market Share Analysis, and Company Profiles
- 11.1. Market Share Analysis
- 11.2. Company Profiles
- 11.3. Apple, Inc.
- 11.3.1. Company Overview
- 11.3.2. Financial Highlights
- 11.3.3. Product Portfolio
- 11.3.4. SWOT Analysis
- 11.3.5. Key Strategies and Developments
- 11.4. Blippar Limited
- 11.4.1. Company Overview
- 11.4.2. Financial Highlights
- 11.4.3. Product Portfolio
- 11.4.4. SWOT Analysis
- 11.4.5. Key Strategies and Developments
- 11.5. Google LLC
- 11.5.1. Company Overview
- 11.5.2. Financial Highlights
- 11.5.3. Product Portfolio
- 11.5.4. SWOT Analysis
- 11.5.5. Key Strategies and Developments
- 11.6. Lenovo Group
- 11.6.1. Company Overview
- 11.6.2. Financial Highlights
- 11.6.3. Product Portfolio
- 11.6.4. SWOT Analysis
- 11.6.5. Key Strategies and Developments
- 11.7. Magic Leap, Incorporated
- 11.7.1. Company Overview
- 11.7.2. Financial Highlights
- 11.7.3. Product Portfolio
- 11.7.4. SWOT Analysis
- 11.7.5. Key Strategies and Developments
- 11.8. Meta
- 11.8.1. Company Overview
- 11.8.2. Financial Highlights
- 11.8.3. Product Portfolio
- 11.8.4. SWOT Analysis
- 11.8.5. Key Strategies and Developments
- 11.9. Microsoft Corporation
- 11.9.1. Company Overview
- 11.9.2. Financial Highlights
- 11.9.3. Product Portfolio
- 11.9.4. SWOT Analysis
- 11.9.5. Key Strategies and Developments
- 11.10. PTC Inc.
- 11.10.1. Company Overview
- 11.10.2. Financial Highlights
- 11.10.3. Product Portfolio
- 11.10.4. SWOT Analysis
- 11.10.5. Key Strategies and Developments
- 11.11. Snap, Inc.
- 11.11.1. Company Overview
- 11.11.2. Financial Highlights
- 11.11.3. Product Portfolio
- 11.11.4. SWOT Analysis
- 11.11.5. Key Strategies and Developments
- 11.12. Sony Corporation
- 11.12.1. Company Overview
- 11.12.2. Financial Highlights
- 11.12.3. Product Portfolio
- 11.12.4. SWOT Analysis
- 11.12.5. Key Strategies and Developments
- 11.13.1. Company Overview
- 11.13.2. Financial Highlights
- 11.13.3. Product Portfolio
- 11.13.4. SWOT Analysis
- 11.13.5. Key Strategies and Developments
- 11.14. TeamViewer AG
- 11.14.1. Company Overview
- 11.14.2. Financial Highlights
- 11.14.3. Product Portfolio
- 11.14.4. SWOT Analysis
- 11.14.5. Key Strategies and Developments
- 11.15. Wikitude GmbH
- 11.15.1. Company Overview
- 11.15.2. Financial Highlights
- 11.15.3. Product Portfolio
- 11.15.4. SWOT Analysis
- 11.15.5. Key Strategies and Developments
- 11.16. Xiaomi Corporation
- 11.16.1. Company Overview
- 11.16.2. Financial Highlights
- 11.16.3. Product Portfolio
- 11.16.4. SWOT Analysis
- 11.16.5. Key Strategies and Developments
- 11.17. Zappar Limited
- 11.17.1. Company Overview
- 11.17.2. Financial Highlights
- 11.17.3. Product Portfolio
- 11.17.4. SWOT Analysis
- 11.17.5. Key Strategies and Developments
- 12. Assumptions and Acronyms
- 13. Research Methodology
- 14. Contact
"
- List of Figures
- "
- Figure 1: Global Augmented Industrial Reality Market Revenue (US$ Mn) Market Share by Application in 2022
- Figure 2: Global Augmented Industrial Reality Market Market Attractiveness Analysis by Application, 2016-2032
- Figure 3: Global Augmented Industrial Reality Market Revenue (US$ Mn) Market Share by Componentin 2022
- Figure 4: Global Augmented Industrial Reality Market Market Attractiveness Analysis by Component, 2016-2032
- Figure 5: Global Augmented Industrial Reality Market Revenue (US$ Mn) Market Share by Technologyin 2022
- Figure 6: Global Augmented Industrial Reality Market Market Attractiveness Analysis by Technology, 2016-2032
- Figure 7: Global Augmented Industrial Reality Market Revenue (US$ Mn) Market Share by End Userin 2022
- Figure 8: Global Augmented Industrial Reality Market Market Attractiveness Analysis by End User, 2016-2032
- Figure 9: Global Augmented Industrial Reality Market Revenue (US$ Mn) Market Share by Region in 2022
- Figure 10: Global Augmented Industrial Reality Market Market Attractiveness Analysis by Region, 2016-2032
- Figure 11: Global Augmented Industrial Reality Market Market Revenue (US$ Mn) (2016-2032)
- Figure 12: Global Augmented Industrial Reality Market Market Revenue (US$ Mn) Comparison by Region (2016-2032)
- Figure 13: Global Augmented Industrial Reality Market Market Revenue (US$ Mn) Comparison by Application (2016-2032)
- Figure 14: Global Augmented Industrial Reality Market Market Revenue (US$ Mn) Comparison by Component (2016-2032)
- Figure 15: Global Augmented Industrial Reality Market Market Revenue (US$ Mn) Comparison by Technology (2016-2032)
- Figure 16: Global Augmented Industrial Reality Market Market Revenue (US$ Mn) Comparison by End User (2016-2032)
- Figure 17: Global Augmented Industrial Reality Market Market Y-o-Y Growth Rate Comparison by Region (2016-2032)
- Figure 18: Global Augmented Industrial Reality Market Market Y-o-Y Growth Rate Comparison by Application (2016-2032)
- Figure 19: Global Augmented Industrial Reality Market Market Y-o-Y Growth Rate Comparison by Component (2016-2032)
- Figure 20: Global Augmented Industrial Reality Market Market Y-o-Y Growth Rate Comparison by Technology (2016-2032)
- Figure 21: Global Augmented Industrial Reality Market Market Y-o-Y Growth Rate Comparison by End User (2016-2032)
- Figure 22: Global Augmented Industrial Reality Market Market Share Comparison by Region (2016-2032)
- Figure 23: Global Augmented Industrial Reality Market Market Share Comparison by Application (2016-2032)
- Figure 24: Global Augmented Industrial Reality Market Market Share Comparison by Component (2016-2032)
- Figure 25: Global Augmented Industrial Reality Market Market Share Comparison by Technology (2016-2032)
- Figure 26: Global Augmented Industrial Reality Market Market Share Comparison by End User (2016-2032)
- Figure 27: North America Augmented Industrial Reality Market Revenue (US$ Mn) Market Share by Applicationin 2022
- Figure 28: North America Augmented Industrial Reality Market Market Attractiveness Analysis by Application, 2016-2032
- Figure 29: North America Augmented Industrial Reality Market Revenue (US$ Mn) Market Share by Componentin 2022
- Figure 30: North America Augmented Industrial Reality Market Market Attractiveness Analysis by Component, 2016-2032
- Figure 31: North America Augmented Industrial Reality Market Revenue (US$ Mn) Market Share by Technologyin 2022
- Figure 32: North America Augmented Industrial Reality Market Market Attractiveness Analysis by Technology, 2016-2032
- Figure 33: North America Augmented Industrial Reality Market Revenue (US$ Mn) Market Share by End Userin 2022
- Figure 34: North America Augmented Industrial Reality Market Market Attractiveness Analysis by End User, 2016-2032
- Figure 35: North America Augmented Industrial Reality Market Revenue (US$ Mn) Market Share by Country in 2022
- Figure 36: North America Augmented Industrial Reality Market Market Attractiveness Analysis by Country, 2016-2032
- Figure 37: North America Augmented Industrial Reality Market Market Revenue (US$ Mn) (2016-2032)
- Figure 38: North America Augmented Industrial Reality Market Market Revenue (US$ Mn) Comparison by Country (2016-2032)
- Figure 39: North America Augmented Industrial Reality Market Market Revenue (US$ Mn) Comparison by Application (2016-2032)
- Figure 40: North America Augmented Industrial Reality Market Market Revenue (US$ Mn) Comparison by Component (2016-2032)
- Figure 41: North America Augmented Industrial Reality Market Market Revenue (US$ Mn) Comparison by Technology (2016-2032)
- Figure 42: North America Augmented Industrial Reality Market Market Revenue (US$ Mn) Comparison by End User (2016-2032)
- Figure 43: North America Augmented Industrial Reality Market Market Y-o-Y Growth Rate Comparison by Country (2016-2032)
- Figure 44: North America Augmented Industrial Reality Market Market Y-o-Y Growth Rate Comparison by Application (2016-2032)
- Figure 45: North America Augmented Industrial Reality Market Market Y-o-Y Growth Rate Comparison by Component (2016-2032)
- Figure 46: North America Augmented Industrial Reality Market Market Y-o-Y Growth Rate Comparison by Technology (2016-2032)
- Figure 47: North America Augmented Industrial Reality Market Market Y-o-Y Growth Rate Comparison by End User (2016-2032)
- Figure 48: North America Augmented Industrial Reality Market Market Share Comparison by Country (2016-2032)
- Figure 49: North America Augmented Industrial Reality Market Market Share Comparison by Application (2016-2032)
- Figure 50: North America Augmented Industrial Reality Market Market Share Comparison by Component (2016-2032)
- Figure 51: North America Augmented Industrial Reality Market Market Share Comparison by Technology (2016-2032)
- Figure 52: North America Augmented Industrial Reality Market Market Share Comparison by End User (2016-2032)
- Figure 53: Western Europe Augmented Industrial Reality Market Revenue (US$ Mn) Market Share by Applicationin 2022
- Figure 54: Western Europe Augmented Industrial Reality Market Market Attractiveness Analysis by Application, 2016-2032
- Figure 55: Western Europe Augmented Industrial Reality Market Revenue (US$ Mn) Market Share by Componentin 2022
- Figure 56: Western Europe Augmented Industrial Reality Market Market Attractiveness Analysis by Component, 2016-2032
- Figure 57: Western Europe Augmented Industrial Reality Market Revenue (US$ Mn) Market Share by Technologyin 2022
- Figure 58: Western Europe Augmented Industrial Reality Market Market Attractiveness Analysis by Technology, 2016-2032
- Figure 59: Western Europe Augmented Industrial Reality Market Revenue (US$ Mn) Market Share by End Userin 2022
- Figure 60: Western Europe Augmented Industrial Reality Market Market Attractiveness Analysis by End User, 2016-2032
- Figure 61: Western Europe Augmented Industrial Reality Market Revenue (US$ Mn) Market Share by Country in 2022
- Figure 62: Western Europe Augmented Industrial Reality Market Market Attractiveness Analysis by Country, 2016-2032
- Figure 63: Western Europe Augmented Industrial Reality Market Market Revenue (US$ Mn) (2016-2032)
- Figure 64: Western Europe Augmented Industrial Reality Market Market Revenue (US$ Mn) Comparison by Country (2016-2032)
- Figure 65: Western Europe Augmented Industrial Reality Market Market Revenue (US$ Mn) Comparison by Application (2016-2032)
- Figure 66: Western Europe Augmented Industrial Reality Market Market Revenue (US$ Mn) Comparison by Component (2016-2032)
- Figure 67: Western Europe Augmented Industrial Reality Market Market Revenue (US$ Mn) Comparison by Technology (2016-2032)
- Figure 68: Western Europe Augmented Industrial Reality Market Market Revenue (US$ Mn) Comparison by End User (2016-2032)
- Figure 69: Western Europe Augmented Industrial Reality Market Market Y-o-Y Growth Rate Comparison by Country (2016-2032)
- Figure 70: Western Europe Augmented Industrial Reality Market Market Y-o-Y Growth Rate Comparison by Application (2016-2032)
- Figure 71: Western Europe Augmented Industrial Reality Market Market Y-o-Y Growth Rate Comparison by Component (2016-2032)
- Figure 72: Western Europe Augmented Industrial Reality Market Market Y-o-Y Growth Rate Comparison by Technology (2016-2032)
- Figure 73: Western Europe Augmented Industrial Reality Market Market Y-o-Y Growth Rate Comparison by End User (2016-2032)
- Figure 74: Western Europe Augmented Industrial Reality Market Market Share Comparison by Country (2016-2032)
- Figure 75: Western Europe Augmented Industrial Reality Market Market Share Comparison by Application (2016-2032)
- Figure 76: Western Europe Augmented Industrial Reality Market Market Share Comparison by Component (2016-2032)
- Figure 77: Western Europe Augmented Industrial Reality Market Market Share Comparison by Technology (2016-2032)
- Figure 78: Western Europe Augmented Industrial Reality Market Market Share Comparison by End User (2016-2032)
- Figure 79: Eastern Europe Augmented Industrial Reality Market Revenue (US$ Mn) Market Share by Applicationin 2022
- Figure 80: Eastern Europe Augmented Industrial Reality Market Market Attractiveness Analysis by Application, 2016-2032
- Figure 81: Eastern Europe Augmented Industrial Reality Market Revenue (US$ Mn) Market Share by Componentin 2022
- Figure 82: Eastern Europe Augmented Industrial Reality Market Market Attractiveness Analysis by Component, 2016-2032
- Figure 83: Eastern Europe Augmented Industrial Reality Market Revenue (US$ Mn) Market Share by Technologyin 2022
- Figure 84: Eastern Europe Augmented Industrial Reality Market Market Attractiveness Analysis by Technology, 2016-2032
- Figure 85: Eastern Europe Augmented Industrial Reality Market Revenue (US$ Mn) Market Share by End Userin 2022
- Figure 86: Eastern Europe Augmented Industrial Reality Market Market Attractiveness Analysis by End User, 2016-2032
- Figure 87: Eastern Europe Augmented Industrial Reality Market Revenue (US$ Mn) Market Share by Country in 2022
- Figure 88: Eastern Europe Augmented Industrial Reality Market Market Attractiveness Analysis by Country, 2016-2032
- Figure 89: Eastern Europe Augmented Industrial Reality Market Market Revenue (US$ Mn) (2016-2032)
- Figure 90: Eastern Europe Augmented Industrial Reality Market Market Revenue (US$ Mn) Comparison by Country (2016-2032)
- Figure 91: Eastern Europe Augmented Industrial Reality Market Market Revenue (US$ Mn) Comparison by Application (2016-2032)
- Figure 92: Eastern Europe Augmented Industrial Reality Market Market Revenue (US$ Mn) Comparison by Component (2016-2032)
- Figure 93: Eastern Europe Augmented Industrial Reality Market Market Revenue (US$ Mn) Comparison by Technology (2016-2032)
- Figure 94: Eastern Europe Augmented Industrial Reality Market Market Revenue (US$ Mn) Comparison by End User (2016-2032)
- Figure 95: Eastern Europe Augmented Industrial Reality Market Market Y-o-Y Growth Rate Comparison by Country (2016-2032)
- Figure 96: Eastern Europe Augmented Industrial Reality Market Market Y-o-Y Growth Rate Comparison by Application (2016-2032)
- Figure 97: Eastern Europe Augmented Industrial Reality Market Market Y-o-Y Growth Rate Comparison by Component (2016-2032)
- Figure 98: Eastern Europe Augmented Industrial Reality Market Market Y-o-Y Growth Rate Comparison by Technology (2016-2032)
- Figure 99: Eastern Europe Augmented Industrial Reality Market Market Y-o-Y Growth Rate Comparison by End User (2016-2032)
- Figure 100: Eastern Europe Augmented Industrial Reality Market Market Share Comparison by Country (2016-2032)
- Figure 101: Eastern Europe Augmented Industrial Reality Market Market Share Comparison by Application (2016-2032)
- Figure 102: Eastern Europe Augmented Industrial Reality Market Market Share Comparison by Component (2016-2032)
- Figure 103: Eastern Europe Augmented Industrial Reality Market Market Share Comparison by Technology (2016-2032)
- Figure 104: Eastern Europe Augmented Industrial Reality Market Market Share Comparison by End User (2016-2032)
- Figure 105: APAC Augmented Industrial Reality Market Revenue (US$ Mn) Market Share by Applicationin 2022
- Figure 106: APAC Augmented Industrial Reality Market Market Attractiveness Analysis by Application, 2016-2032
- Figure 107: APAC Augmented Industrial Reality Market Revenue (US$ Mn) Market Share by Componentin 2022
- Figure 108: APAC Augmented Industrial Reality Market Market Attractiveness Analysis by Component, 2016-2032
- Figure 109: APAC Augmented Industrial Reality Market Revenue (US$ Mn) Market Share by Technologyin 2022
- Figure 110: APAC Augmented Industrial Reality Market Market Attractiveness Analysis by Technology, 2016-2032
- Figure 111: APAC Augmented Industrial Reality Market Revenue (US$ Mn) Market Share by End Userin 2022
- Figure 112: APAC Augmented Industrial Reality Market Market Attractiveness Analysis by End User, 2016-2032
- Figure 113: APAC Augmented Industrial Reality Market Revenue (US$ Mn) Market Share by Country in 2022
- Figure 114: APAC Augmented Industrial Reality Market Market Attractiveness Analysis by Country, 2016-2032
- Figure 115: APAC Augmented Industrial Reality Market Market Revenue (US$ Mn) (2016-2032)
- Figure 116: APAC Augmented Industrial Reality Market Market Revenue (US$ Mn) Comparison by Country (2016-2032)
- Figure 117: APAC Augmented Industrial Reality Market Market Revenue (US$ Mn) Comparison by Application (2016-2032)
- Figure 118: APAC Augmented Industrial Reality Market Market Revenue (US$ Mn) Comparison by Component (2016-2032)
- Figure 119: APAC Augmented Industrial Reality Market Market Revenue (US$ Mn) Comparison by Technology (2016-2032)
- Figure 120: APAC Augmented Industrial Reality Market Market Revenue (US$ Mn) Comparison by End User (2016-2032)
- Figure 121: APAC Augmented Industrial Reality Market Market Y-o-Y Growth Rate Comparison by Country (2016-2032)
- Figure 122: APAC Augmented Industrial Reality Market Market Y-o-Y Growth Rate Comparison by Application (2016-2032)
- Figure 123: APAC Augmented Industrial Reality Market Market Y-o-Y Growth Rate Comparison by Component (2016-2032)
- Figure 124: APAC Augmented Industrial Reality Market Market Y-o-Y Growth Rate Comparison by Technology (2016-2032)
- Figure 125: APAC Augmented Industrial Reality Market Market Y-o-Y Growth Rate Comparison by End User (2016-2032)
- Figure 126: APAC Augmented Industrial Reality Market Market Share Comparison by Country (2016-2032)
- Figure 127: APAC Augmented Industrial Reality Market Market Share Comparison by Application (2016-2032)
- Figure 128: APAC Augmented Industrial Reality Market Market Share Comparison by Component (2016-2032)
- Figure 129: APAC Augmented Industrial Reality Market Market Share Comparison by Technology (2016-2032)
- Figure 130: APAC Augmented Industrial Reality Market Market Share Comparison by End User (2016-2032)
- Figure 131: Latin America Augmented Industrial Reality Market Revenue (US$ Mn) Market Share by Applicationin 2022
- Figure 132: Latin America Augmented Industrial Reality Market Market Attractiveness Analysis by Application, 2016-2032
- Figure 133: Latin America Augmented Industrial Reality Market Revenue (US$ Mn) Market Share by Componentin 2022
- Figure 134: Latin America Augmented Industrial Reality Market Market Attractiveness Analysis by Component, 2016-2032
- Figure 135: Latin America Augmented Industrial Reality Market Revenue (US$ Mn) Market Share by Technologyin 2022
- Figure 136: Latin America Augmented Industrial Reality Market Market Attractiveness Analysis by Technology, 2016-2032
- Figure 137: Latin America Augmented Industrial Reality Market Revenue (US$ Mn) Market Share by End Userin 2022
- Figure 138: Latin America Augmented Industrial Reality Market Market Attractiveness Analysis by End User, 2016-2032
- Figure 139: Latin America Augmented Industrial Reality Market Revenue (US$ Mn) Market Share by Country in 2022
- Figure 140: Latin America Augmented Industrial Reality Market Market Attractiveness Analysis by Country, 2016-2032
- Figure 141: Latin America Augmented Industrial Reality Market Market Revenue (US$ Mn) (2016-2032)
- Figure 142: Latin America Augmented Industrial Reality Market Market Revenue (US$ Mn) Comparison by Country (2016-2032)
- Figure 143: Latin America Augmented Industrial Reality Market Market Revenue (US$ Mn) Comparison by Application (2016-2032)
- Figure 144: Latin America Augmented Industrial Reality Market Market Revenue (US$ Mn) Comparison by Component (2016-2032)
- Figure 145: Latin America Augmented Industrial Reality Market Market Revenue (US$ Mn) Comparison by Technology (2016-2032)
- Figure 146: Latin America Augmented Industrial Reality Market Market Revenue (US$ Mn) Comparison by End User (2016-2032)
- Figure 147: Latin America Augmented Industrial Reality Market Market Y-o-Y Growth Rate Comparison by Country (2016-2032)
- Figure 148: Latin America Augmented Industrial Reality Market Market Y-o-Y Growth Rate Comparison by Application (2016-2032)
- Figure 149: Latin America Augmented Industrial Reality Market Market Y-o-Y Growth Rate Comparison by Component (2016-2032)
- Figure 150: Latin America Augmented Industrial Reality Market Market Y-o-Y Growth Rate Comparison by Technology (2016-2032)
- Figure 151: Latin America Augmented Industrial Reality Market Market Y-o-Y Growth Rate Comparison by End User (2016-2032)
- Figure 152: Latin America Augmented Industrial Reality Market Market Share Comparison by Country (2016-2032)
- Figure 153: Latin America Augmented Industrial Reality Market Market Share Comparison by Application (2016-2032)
- Figure 154: Latin America Augmented Industrial Reality Market Market Share Comparison by Component (2016-2032)
- Figure 155: Latin America Augmented Industrial Reality Market Market Share Comparison by Technology (2016-2032)
- Figure 156: Latin America Augmented Industrial Reality Market Market Share Comparison by End User (2016-2032)
- Figure 157: Middle East & Africa Augmented Industrial Reality Market Revenue (US$ Mn) Market Share by Applicationin 2022
- Figure 158: Middle East & Africa Augmented Industrial Reality Market Market Attractiveness Analysis by Application, 2016-2032
- Figure 159: Middle East & Africa Augmented Industrial Reality Market Revenue (US$ Mn) Market Share by Componentin 2022
- Figure 160: Middle East & Africa Augmented Industrial Reality Market Market Attractiveness Analysis by Component, 2016-2032
- Figure 161: Middle East & Africa Augmented Industrial Reality Market Revenue (US$ Mn) Market Share by Technologyin 2022
- Figure 162: Middle East & Africa Augmented Industrial Reality Market Market Attractiveness Analysis by Technology, 2016-2032
- Figure 163: Middle East & Africa Augmented Industrial Reality Market Revenue (US$ Mn) Market Share by End Userin 2022
- Figure 164: Middle East & Africa Augmented Industrial Reality Market Market Attractiveness Analysis by End User, 2016-2032
- Figure 165: Middle East & Africa Augmented Industrial Reality Market Revenue (US$ Mn) Market Share by Country in 2022
- Figure 166: Middle East & Africa Augmented Industrial Reality Market Market Attractiveness Analysis by Country, 2016-2032
- Figure 167: Middle East & Africa Augmented Industrial Reality Market Market Revenue (US$ Mn) (2016-2032)
- Figure 168: Middle East & Africa Augmented Industrial Reality Market Market Revenue (US$ Mn) Comparison by Country (2016-2032)
- Figure 169: Middle East & Africa Augmented Industrial Reality Market Market Revenue (US$ Mn) Comparison by Application (2016-2032)
- Figure 170: Middle East & Africa Augmented Industrial Reality Market Market Revenue (US$ Mn) Comparison by Component (2016-2032)
- Figure 171: Middle East & Africa Augmented Industrial Reality Market Market Revenue (US$ Mn) Comparison by Technology (2016-2032)
- Figure 172: Middle East & Africa Augmented Industrial Reality Market Market Revenue (US$ Mn) Comparison by End User (2016-2032)
- Figure 173: Middle East & Africa Augmented Industrial Reality Market Market Y-o-Y Growth Rate Comparison by Country (2016-2032)
- Figure 174: Middle East & Africa Augmented Industrial Reality Market Market Y-o-Y Growth Rate Comparison by Application (2016-2032)
- Figure 175: Middle East & Africa Augmented Industrial Reality Market Market Y-o-Y Growth Rate Comparison by Component (2016-2032)
- Figure 176: Middle East & Africa Augmented Industrial Reality Market Market Y-o-Y Growth Rate Comparison by Technology (2016-2032)
- Figure 177: Middle East & Africa Augmented Industrial Reality Market Market Y-o-Y Growth Rate Comparison by End User (2016-2032)
- Figure 178: Middle East & Africa Augmented Industrial Reality Market Market Share Comparison by Country (2016-2032)
- Figure 179: Middle East & Africa Augmented Industrial Reality Market Market Share Comparison by Application (2016-2032)
- Figure 180: Middle East & Africa Augmented Industrial Reality Market Market Share Comparison by Component (2016-2032)
- Figure 181: Middle East & Africa Augmented Industrial Reality Market Market Share Comparison by Technology (2016-2032)
- Figure 182: Middle East & Africa Augmented Industrial Reality Market Market Share Comparison by End User (2016-2032)
"
- List of Tables
- "
- Table 1: Global Augmented Industrial Reality Market Market Comparison by Application (2016-2032)
- Table 2: Global Augmented Industrial Reality Market Market Comparison by Component (2016-2032)
- Table 3: Global Augmented Industrial Reality Market Market Comparison by Technology (2016-2032)
- Table 4: Global Augmented Industrial Reality Market Market Comparison by End User (2016-2032)
- Table 5: Global Augmented Industrial Reality Market Revenue (US$ Mn) Comparison by Region (2016-2032)
- Table 6: Global Augmented Industrial Reality Market Market Revenue (US$ Mn) (2016-2032)
- Table 7: Global Augmented Industrial Reality Market Market Revenue (US$ Mn) Comparison by Region (2016-2032)
- Table 8: Global Augmented Industrial Reality Market Market Revenue (US$ Mn) Comparison by Application (2016-2032)
- Table 9: Global Augmented Industrial Reality Market Market Revenue (US$ Mn) Comparison by Component (2016-2032)
- Table 10: Global Augmented Industrial Reality Market Market Revenue (US$ Mn) Comparison by Technology (2016-2032)
- Table 11: Global Augmented Industrial Reality Market Market Revenue (US$ Mn) Comparison by End User (2016-2032)
- Table 12: Global Augmented Industrial Reality Market Market Y-o-Y Growth Rate Comparison by Region (2016-2032)
- Table 13: Global Augmented Industrial Reality Market Market Y-o-Y Growth Rate Comparison by Application (2016-2032)
- Table 14: Global Augmented Industrial Reality Market Market Y-o-Y Growth Rate Comparison by Component (2016-2032)
- Table 15: Global Augmented Industrial Reality Market Market Y-o-Y Growth Rate Comparison by Technology (2016-2032)
- Table 16: Global Augmented Industrial Reality Market Market Y-o-Y Growth Rate Comparison by End User (2016-2032)
- Table 17: Global Augmented Industrial Reality Market Market Share Comparison by Region (2016-2032)
- Table 18: Global Augmented Industrial Reality Market Market Share Comparison by Application (2016-2032)
- Table 19: Global Augmented Industrial Reality Market Market Share Comparison by Component (2016-2032)
- Table 20: Global Augmented Industrial Reality Market Market Share Comparison by Technology (2016-2032)
- Table 21: Global Augmented Industrial Reality Market Market Share Comparison by End User (2016-2032)
- Table 22: North America Augmented Industrial Reality Market Market Comparison by Component (2016-2032)
- Table 23: North America Augmented Industrial Reality Market Market Comparison by Technology (2016-2032)
- Table 24: North America Augmented Industrial Reality Market Market Comparison by End User (2016-2032)
- Table 25: North America Augmented Industrial Reality Market Revenue (US$ Mn) Comparison by Country (2016-2032)
- Table 26: North America Augmented Industrial Reality Market Market Revenue (US$ Mn) (2016-2032)
- Table 27: North America Augmented Industrial Reality Market Market Revenue (US$ Mn) Comparison by Country (2016-2032)
- Table 28: North America Augmented Industrial Reality Market Market Revenue (US$ Mn) Comparison by Application (2016-2032)
- Table 29: North America Augmented Industrial Reality Market Market Revenue (US$ Mn) Comparison by Component (2016-2032)
- Table 30: North America Augmented Industrial Reality Market Market Revenue (US$ Mn) Comparison by Technology (2016-2032)
- Table 31: North America Augmented Industrial Reality Market Market Revenue (US$ Mn) Comparison by End User (2016-2032)
- Table 32: North America Augmented Industrial Reality Market Market Y-o-Y Growth Rate Comparison by Country (2016-2032)
- Table 33: North America Augmented Industrial Reality Market Market Y-o-Y Growth Rate Comparison by Application (2016-2032)
- Table 34: North America Augmented Industrial Reality Market Market Y-o-Y Growth Rate Comparison by Component (2016-2032)
- Table 35: North America Augmented Industrial Reality Market Market Y-o-Y Growth Rate Comparison by Technology (2016-2032)
- Table 36: North America Augmented Industrial Reality Market Market Y-o-Y Growth Rate Comparison by End User (2016-2032)
- Table 37: North America Augmented Industrial Reality Market Market Share Comparison by Country (2016-2032)
- Table 38: North America Augmented Industrial Reality Market Market Share Comparison by Application (2016-2032)
- Table 39: North America Augmented Industrial Reality Market Market Share Comparison by Component (2016-2032)
- Table 40: North America Augmented Industrial Reality Market Market Share Comparison by Technology (2016-2032)
- Table 41: North America Augmented Industrial Reality Market Market Share Comparison by End User (2016-2032)
- Table 42: Western Europe Augmented Industrial Reality Market Market Comparison by Application (2016-2032)
- Table 43: Western Europe Augmented Industrial Reality Market Market Comparison by Component (2016-2032)
- Table 44: Western Europe Augmented Industrial Reality Market Market Comparison by Technology (2016-2032)
- Table 45: Western Europe Augmented Industrial Reality Market Market Comparison by End User (2016-2032)
- Table 46: Western Europe Augmented Industrial Reality Market Revenue (US$ Mn) Comparison by Country (2016-2032)
- Table 47: Western Europe Augmented Industrial Reality Market Market Revenue (US$ Mn) (2016-2032)
- Table 48: Western Europe Augmented Industrial Reality Market Market Revenue (US$ Mn) Comparison by Country (2016-2032)
- Table 49: Western Europe Augmented Industrial Reality Market Market Revenue (US$ Mn) Comparison by Application (2016-2032)
- Table 50: Western Europe Augmented Industrial Reality Market Market Revenue (US$ Mn) Comparison by Component (2016-2032)
- Table 51: Western Europe Augmented Industrial Reality Market Market Revenue (US$ Mn) Comparison by Technology (2016-2032)
- Table 52: Western Europe Augmented Industrial Reality Market Market Revenue (US$ Mn) Comparison by End User (2016-2032)
- Table 53: Western Europe Augmented Industrial Reality Market Market Y-o-Y Growth Rate Comparison by Country (2016-2032)
- Table 54: Western Europe Augmented Industrial Reality Market Market Y-o-Y Growth Rate Comparison by Application (2016-2032)
- Table 55: Western Europe Augmented Industrial Reality Market Market Y-o-Y Growth Rate Comparison by Component (2016-2032)
- Table 56: Western Europe Augmented Industrial Reality Market Market Y-o-Y Growth Rate Comparison by Technology (2016-2032)
- Table 57: Western Europe Augmented Industrial Reality Market Market Y-o-Y Growth Rate Comparison by End User (2016-2032)
- Table 58: Western Europe Augmented Industrial Reality Market Market Share Comparison by Country (2016-2032)
- Table 59: Western Europe Augmented Industrial Reality Market Market Share Comparison by Application (2016-2032)
- Table 60: Western Europe Augmented Industrial Reality Market Market Share Comparison by Component (2016-2032)
- Table 61: Western Europe Augmented Industrial Reality Market Market Share Comparison by Technology (2016-2032)
- Table 62: Western Europe Augmented Industrial Reality Market Market Share Comparison by End User (2016-2032)
- Table 63: Eastern Europe Augmented Industrial Reality Market Market Comparison by Application (2016-2032)
- Table 64: Eastern Europe Augmented Industrial Reality Market Market Comparison by Component (2016-2032)
- Table 65: Eastern Europe Augmented Industrial Reality Market Market Comparison by Technology (2016-2032)
- Table 66: Eastern Europe Augmented Industrial Reality Market Market Comparison by End User (2016-2032)
- Table 67: Eastern Europe Augmented Industrial Reality Market Revenue (US$ Mn) Comparison by Country (2016-2032)
- Table 68: Eastern Europe Augmented Industrial Reality Market Market Revenue (US$ Mn) (2016-2032)
- Table 69: Eastern Europe Augmented Industrial Reality Market Market Revenue (US$ Mn) Comparison by Country (2016-2032)
- Table 70: Eastern Europe Augmented Industrial Reality Market Market Revenue (US$ Mn) Comparison by Application (2016-2032)
- Table 71: Eastern Europe Augmented Industrial Reality Market Market Revenue (US$ Mn) Comparison by Component (2016-2032)
- Table 72: Eastern Europe Augmented Industrial Reality Market Market Revenue (US$ Mn) Comparison by Technology (2016-2032)
- Table 73: Eastern Europe Augmented Industrial Reality Market Market Revenue (US$ Mn) Comparison by End User (2016-2032)
- Table 74: Eastern Europe Augmented Industrial Reality Market Market Y-o-Y Growth Rate Comparison by Country (2016-2032)
- Table 75: Eastern Europe Augmented Industrial Reality Market Market Y-o-Y Growth Rate Comparison by Application (2016-2032)
- Table 76: Eastern Europe Augmented Industrial Reality Market Market Y-o-Y Growth Rate Comparison by Component (2016-2032)
- Table 77: Eastern Europe Augmented Industrial Reality Market Market Y-o-Y Growth Rate Comparison by Technology (2016-2032)
- Table 78: Eastern Europe Augmented Industrial Reality Market Market Y-o-Y Growth Rate Comparison by End User (2016-2032)
- Table 79: Eastern Europe Augmented Industrial Reality Market Market Share Comparison by Country (2016-2032)
- Table 80: Eastern Europe Augmented Industrial Reality Market Market Share Comparison by Application (2016-2032)
- Table 81: Eastern Europe Augmented Industrial Reality Market Market Share Comparison by Component (2016-2032)
- Table 82: Eastern Europe Augmented Industrial Reality Market Market Share Comparison by Technology (2016-2032)
- Table 83: Eastern Europe Augmented Industrial Reality Market Market Share Comparison by End User (2016-2032)
- Table 84: APAC Augmented Industrial Reality Market Market Comparison by Application (2016-2032)
- Table 85: APAC Augmented Industrial Reality Market Market Comparison by Component (2016-2032)
- Table 86: APAC Augmented Industrial Reality Market Market Comparison by Technology (2016-2032)
- Table 87: APAC Augmented Industrial Reality Market Market Comparison by End User (2016-2032)
- Table 88: APAC Augmented Industrial Reality Market Revenue (US$ Mn) Comparison by Country (2016-2032)
- Table 89: APAC Augmented Industrial Reality Market Market Revenue (US$ Mn) (2016-2032)
- Table 90: APAC Augmented Industrial Reality Market Market Revenue (US$ Mn) Comparison by Country (2016-2032)
- Table 91: APAC Augmented Industrial Reality Market Market Revenue (US$ Mn) Comparison by Application (2016-2032)
- Table 92: APAC Augmented Industrial Reality Market Market Revenue (US$ Mn) Comparison by Component (2016-2032)
- Table 93: APAC Augmented Industrial Reality Market Market Revenue (US$ Mn) Comparison by Technology (2016-2032)
- Table 94: APAC Augmented Industrial Reality Market Market Revenue (US$ Mn) Comparison by End User (2016-2032)
- Table 95: APAC Augmented Industrial Reality Market Market Y-o-Y Growth Rate Comparison by Country (2016-2032)
- Table 96: APAC Augmented Industrial Reality Market Market Y-o-Y Growth Rate Comparison by Application (2016-2032)
- Table 97: APAC Augmented Industrial Reality Market Market Y-o-Y Growth Rate Comparison by Component (2016-2032)
- Table 98: APAC Augmented Industrial Reality Market Market Y-o-Y Growth Rate Comparison by Technology (2016-2032)
- Table 99: APAC Augmented Industrial Reality Market Market Y-o-Y Growth Rate Comparison by End User (2016-2032)
- Table 100: APAC Augmented Industrial Reality Market Market Share Comparison by Country (2016-2032)
- Table 101: APAC Augmented Industrial Reality Market Market Share Comparison by Application (2016-2032)
- Table 102: APAC Augmented Industrial Reality Market Market Share Comparison by Component (2016-2032)
- Table 103: APAC Augmented Industrial Reality Market Market Share Comparison by Technology (2016-2032)
- Table 104: APAC Augmented Industrial Reality Market Market Share Comparison by End User (2016-2032)
- Table 105: Latin America Augmented Industrial Reality Market Market Comparison by Application (2016-2032)
- Table 106: Latin America Augmented Industrial Reality Market Market Comparison by Component (2016-2032)
- Table 107: Latin America Augmented Industrial Reality Market Market Comparison by Technology (2016-2032)
- Table 108: Latin America Augmented Industrial Reality Market Market Comparison by End User (2016-2032)
- Table 109: Latin America Augmented Industrial Reality Market Revenue (US$ Mn) Comparison by Country (2016-2032)
- Table 110: Latin America Augmented Industrial Reality Market Market Revenue (US$ Mn) (2016-2032)
- Table 111: Latin America Augmented Industrial Reality Market Market Revenue (US$ Mn) Comparison by Country (2016-2032)
- Table 112: Latin America Augmented Industrial Reality Market Market Revenue (US$ Mn) Comparison by Application (2016-2032)
- Table 113: Latin America Augmented Industrial Reality Market Market Revenue (US$ Mn) Comparison by Component (2016-2032)
- Table 114: Latin America Augmented Industrial Reality Market Market Revenue (US$ Mn) Comparison by Technology (2016-2032)
- Table 115: Latin America Augmented Industrial Reality Market Market Revenue (US$ Mn) Comparison by End User (2016-2032)
- Table 116: Latin America Augmented Industrial Reality Market Market Y-o-Y Growth Rate Comparison by Country (2016-2032)
- Table 117: Latin America Augmented Industrial Reality Market Market Y-o-Y Growth Rate Comparison by Application (2016-2032)
- Table 118: Latin America Augmented Industrial Reality Market Market Y-o-Y Growth Rate Comparison by Component (2016-2032)
- Table 119: Latin America Augmented Industrial Reality Market Market Y-o-Y Growth Rate Comparison by Technology (2016-2032)
- Table 120: Latin America Augmented Industrial Reality Market Market Y-o-Y Growth Rate Comparison by End User (2016-2032)
- Table 121: Latin America Augmented Industrial Reality Market Market Share Comparison by Country (2016-2032)
- Table 122: Latin America Augmented Industrial Reality Market Market Share Comparison by Application (2016-2032)
- Table 123: Latin America Augmented Industrial Reality Market Market Share Comparison by Component (2016-2032)
- Table 124: Latin America Augmented Industrial Reality Market Market Share Comparison by Technology (2016-2032)
- Table 125: Latin America Augmented Industrial Reality Market Market Share Comparison by End User (2016-2032)
- Table 126: Middle East & Africa Augmented Industrial Reality Market Market Comparison by Application (2016-2032)
- Table 127: Middle East & Africa Augmented Industrial Reality Market Market Comparison by Component (2016-2032)
- Table 128: Middle East & Africa Augmented Industrial Reality Market Market Comparison by Technology (2016-2032)
- Table 129: Middle East & Africa Augmented Industrial Reality Market Market Comparison by End User (2016-2032)
- Table 130: Middle East & Africa Augmented Industrial Reality Market Revenue (US$ Mn) Comparison by Country (2016-2032)
- Table 131: Middle East & Africa Augmented Industrial Reality Market Market Revenue (US$ Mn) (2016-2032)
- Table 132: Middle East & Africa Augmented Industrial Reality Market Market Revenue (US$ Mn) Comparison by Country (2016-2032)
- Table 133: Middle East & Africa Augmented Industrial Reality Market Market Revenue (US$ Mn) Comparison by Application (2016-2032)
- Table 134: Middle East & Africa Augmented Industrial Reality Market Market Revenue (US$ Mn) Comparison by Component (2016-2032)
- Table 135: Middle East & Africa Augmented Industrial Reality Market Market Revenue (US$ Mn) Comparison by Technology (2016-2032)
- Table 136: Middle East & Africa Augmented Industrial Reality Market Market Revenue (US$ Mn) Comparison by End User (2016-2032)
- Table 137: Middle East & Africa Augmented Industrial Reality Market Market Y-o-Y Growth Rate Comparison by Country (2016-2032)
- Table 138: Middle East & Africa Augmented Industrial Reality Market Market Y-o-Y Growth Rate Comparison by Application (2016-2032)
- Table 139: Middle East & Africa Augmented Industrial Reality Market Market Y-o-Y Growth Rate Comparison by Component (2016-2032)
- Table 140: Middle East & Africa Augmented Industrial Reality Market Market Y-o-Y Growth Rate Comparison by Technology (2016-2032)
- Table 141: Middle East & Africa Augmented Industrial Reality Market Market Y-o-Y Growth Rate Comparison by End User (2016-2032)
- Table 142: Middle East & Africa Augmented Industrial Reality Market Market Share Comparison by Country (2016-2032)
- Table 143: Middle East & Africa Augmented Industrial Reality Market Market Share Comparison by Application (2016-2032)
- Table 144: Middle East & Africa Augmented Industrial Reality Market Market Share Comparison by Component (2016-2032)
- Table 145: Middle East & Africa Augmented Industrial Reality Market Market Share Comparison by Technology (2016-2032)
- Table 146: Middle East & Africa Augmented Industrial Reality Market Market Share Comparison by End User (2016-2032)
- 1. Executive Summary
-
- Apple, Inc.
- Blippar Limited
- Google LLC
- Lenovo Group
- Magic Leap, Incorporated
- Meta
- Microsoft Corporation
- PTC Inc.
- Snap, Inc.
- Sony Corporation
- TeamViewer AG
- Vuzix Corporation
- Wikitude GmbH
- Xiaomi Corporation
- Zappar Limited
Our Clients


View Our Licence Options
