
Atropine Market Report By Formulation (Oral, Injectable, Ophthalmic), By Indication (Ophthalmology, Cardiology, Anesthesia, Gastroenterology, Respiratory Medicine, Poisoning Treatment, Others), By End Users (Hospitals, Clinics, Ambulatory Surgical Centers, Emergency Medical Services, Retail Pharmacies), By Region and Companies - Industry Segment Outlook, Market Assessment, Competition Scenario, Trends and Forecast 2024-2033
-
45326
-
May 2024
-
291
-


-
This report was compiled by Trishita Deb Trishita Deb is an experienced market research and consulting professional with over 7 years of expertise across healthcare, consumer goods, and materials, contributing to over 400 healthcare-related reports. Correspondence Team Lead- Healthcare Linkedin | Detailed Market research Methodology Our methodology involves a mix of primary research, including interviews with leading mental health experts, and secondary research from reputable medical journals and databases. View Detailed Methodology Page
-
Quick Navigation
Report Overview
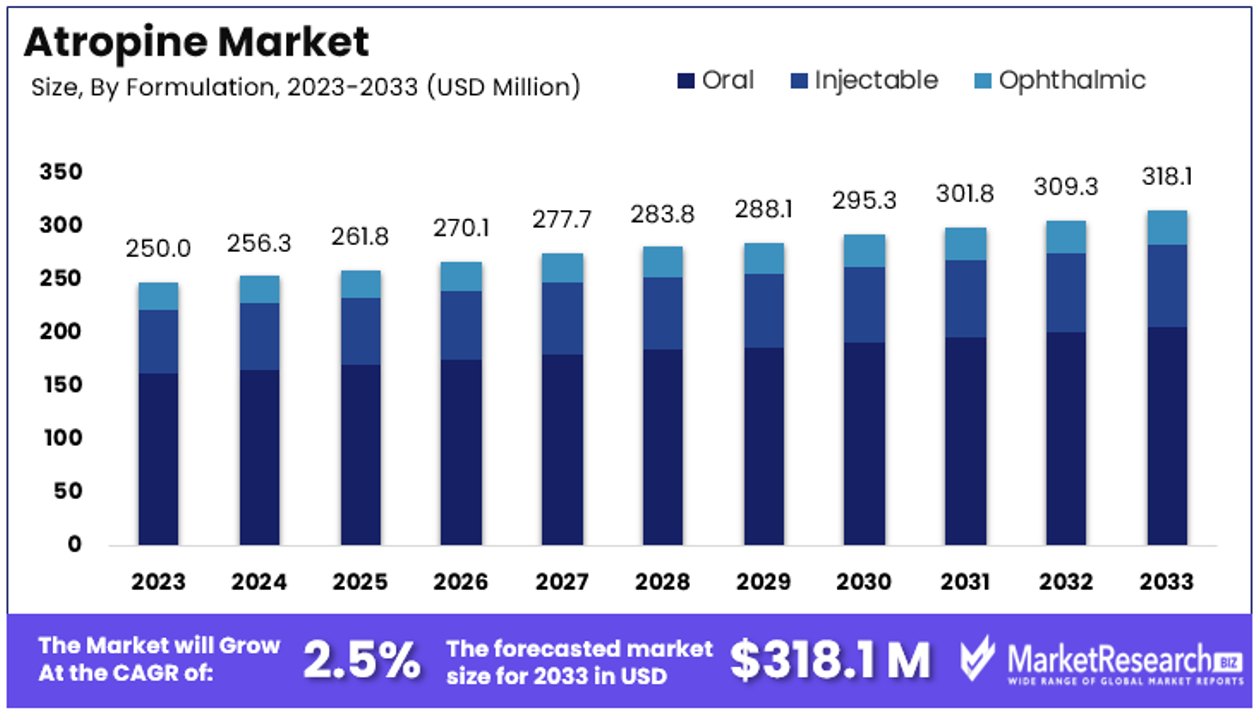
The Global Atropine Market size is expected to be worth around USD 318.1 Million by 2033, from USD 250 Million in 2023, growing at a CAGR of 2.5% during the forecast period from 2024 to 2033.
The Atropine Market refers to the industry focused on the production and distribution of atropine, a vital pharmaceutical used primarily to treat certain types of nerve agent and pesticide poisonings, as well as to reduce saliva production during surgery.
This market serves a critical role in healthcare and emergency medical services, providing essential products to hospitals, emergency responders, and military units worldwide. As a sector influenced by regulatory standards and healthcare policies, it requires continuous innovation to enhance product efficacy and safety.
The Atropine Market is experiencing a dynamic expansion, primarily driven by its critical applications in diverse medical scenarios. Atropine's utilization spans several essential medical treatments, such as addressing specific types of nerve agent and pesticide poisonings, managing slow heart rates (bradycardia), and treating heart block variations like second-degree Mobitz type 1 and third-degree with adequate Purkinje or AV-nodal escape rhythms. These applications underscore its indispensable role in acute medical care settings.
Further broadening its market reach, atropine is also employed in ophthalmology. It is used topically to temporarily blur vision in the good eye to treat conditions like refractive and accommodative amblyopia, and has shown efficacy in decelerating myopia progression among children. This dual use in both emergency medicine and chronic condition management enhances its market stability and growth potential.
The administration of atropine varies significantly with patient demographics, necessitating precise dosing protocols. For instance, the recommended dose is 2 milligrams for adults and children over ten years old who weigh more than 41 kilograms, delivered intramuscularly. This precise dosing not only ensures effective treatment but also minimizes risks, thus reinforcing trust and reliability in atropine's therapeutic claims.
Given these multifaceted applications and its critical role in healthcare, the Atropine Market is poised for continued growth. Stakeholders, including pharmaceutical companies and healthcare providers, must navigate regulatory landscapes, innovate continuously, and ensure the highest safety standards to capitalize on this growing demand. As such, executives and product managers should remain vigilant of technological advancements and regulatory changes that could influence market dynamics and opportunities.
Key Takeaways
- Market Value: The Global Atropine Market is projected to reach approximately USD 318.1 million by 2033, marking notable growth from USD 250 million in 2023, with a steady CAGR of 2.5% during the forecast period from 2024 to 2033.
- Formulation Analysis: The injectable sub-segment dominates significantly due to its critical role in emergency and surgical applications, while the oral and ophthalmic formulations play important but lesser roles in specific medical conditions and diagnostic procedures.
- Indication Analysis: Ophthalmology leads as the dominant sub-segment, driven by the rising prevalence of eye disorders globally, followed by cardiology, anesthesia, gastroenterology, respiratory medicine, and poisoning treatment, showcasing the versatility of atropine across various medical fields.
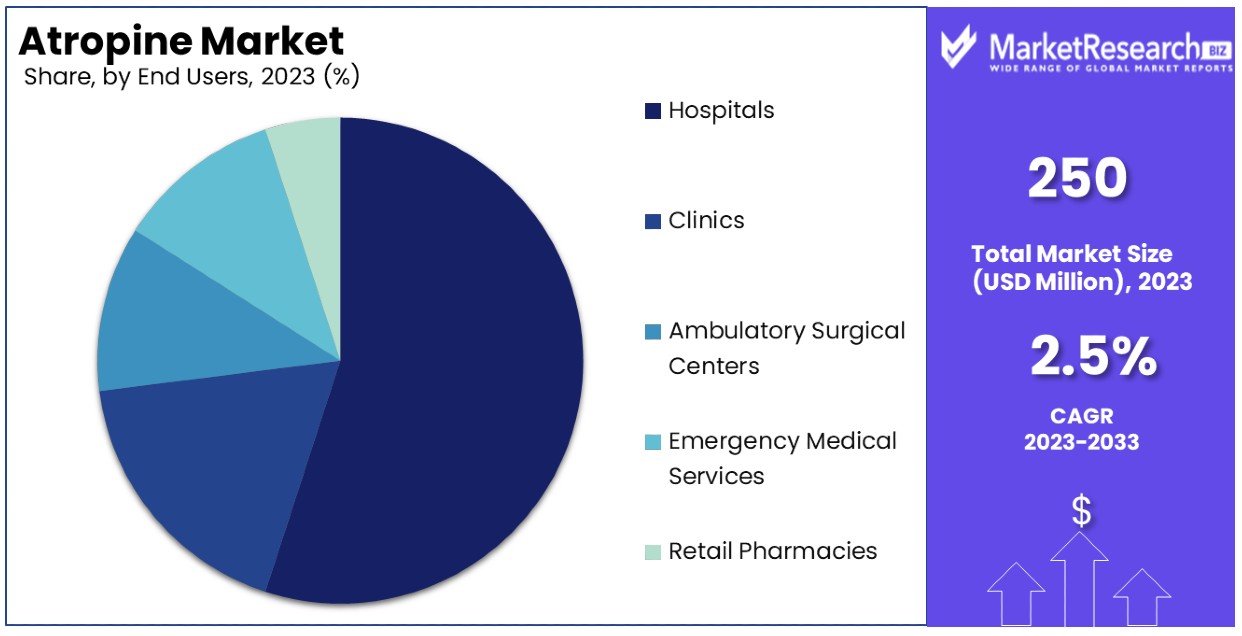
- End Users Analysis: Hospitals are the dominant sub-segment due to their pivotal role in delivering comprehensive medical treatments involving atropine, followed by clinics, ambulatory surgical centers, emergency medical services, and retail pharmacies, each contributing to different aspects of atropine usage and distribution.
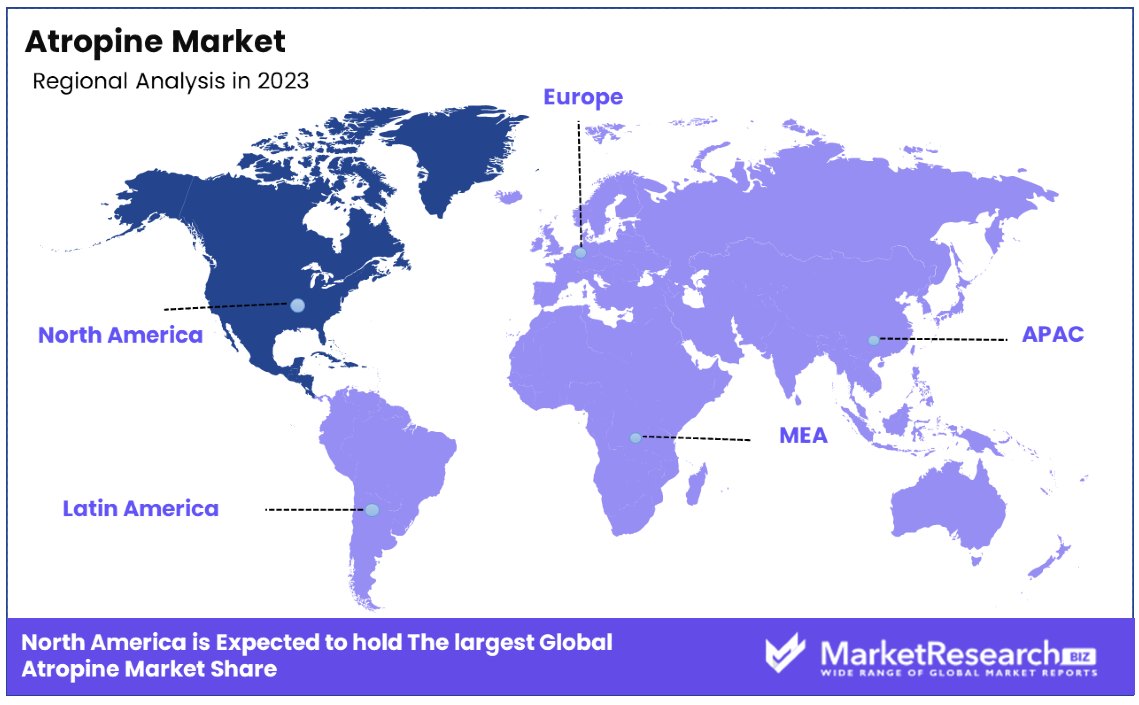
- North America: Dominates the market with a 35% share, driven by strong healthcare systems and an active pharmaceutical sector.
- Europe: Holds a significant 25% market share, supported by robust healthcare systems and infrastructure.
- Analyst Viewpoint: The detailed analysis of each segment underscores the importance of targeted interventions and specialized care for enhancing patient outcomes and driving market growth. Continued advancements in diagnostic techniques, treatment modalities, and healthcare infrastructure are expected to further fuel market expansion and innovation in the field of Atropine.
Driving Factors
Increasing Prevalence of Cardiovascular Diseases Drives Market Growth
The rising global incidence of cardiovascular diseases significantly contributes to the expanding Atropine Market. Atropine is crucial in various cardiac procedures, including cardiac stress tests and surgeries, where it is used to regulate heart rhythms and prevent bradycardia—a common complication.
With cardiovascular diseases recognized by the World Health Organization as the leading cause of death globally, causing an estimated 17.9 million deaths annually, the demand for effective cardiac management solutions like atropine is surging. This trend underscores a direct correlation between the prevalence of heart-related ailments and the increased use of atropine in medical settings. As healthcare systems worldwide continue to combat these conditions, atropine's role remains indispensable, thereby driving market growth.
Growing Demand in Ophthalmology Drives Market Growth
Atropine's application in ophthalmology is another significant growth driver for its market. Used extensively to dilate pupils during eye examinations and surgeries, atropine addresses the needs arising from the increasing prevalence of eye disorders, particularly among the aging population.
According to the National Eye Institute, the number of people suffering from age-related macular degeneration in the U.S. is expected to double from 11 million in 2020 to 22 million by 2050. This demographic shift not only boosts the demand for ophthalmic procedures but also elevates the need for atropine, supporting its market expansion. The interconnected rise of both age-related eye conditions and the requirement for diagnostic and surgical interventions in ophthalmology propels the Atropine Market forward.
Use in Anesthesia and Emergency Care Drives Market Growth
Atropine's vital role in anesthesia and emergency care also catalyzes its market growth. It is essential in managing the side effects of various anesthetics and in treating emergency conditions such as bradycardia during surgical procedures. The Centers for Disease Control and Prevention (CDC) reported over 51 million inpatient surgical procedures in the United States alone in 2018, reflecting a substantial demand for atropine.
This demand is poised to grow as the volume of surgical and emergency procedures continues to rise globally. The increase in medical emergencies and surgical interventions creates a consistent need for atropine, ensuring its steady market demand. As surgeries become more frequent and complex, the reliance on atropine for effective patient management during these critical conditions enhances its market potential.
Restraining Factors
Potential Side Effects and Contraindications Restrain Market Growth
The range of potential side effects associated with atropine significantly restrains its market growth. Common adverse reactions include dry mouth, blurred vision, constipation, and tachycardia, which can deter its use in routine medical treatments.
Moreover, atropine carries contraindications for patients with conditions like narrow-angle glaucoma, pyloric obstruction, and certain types of cardiac arrhythmias. These limitations restrict its applicability across a broader patient demographic, ultimately limiting market expansion. Healthcare providers often weigh these risks against the benefits of atropine, which may lead to preference for alternative treatments when the risk of side effects is deemed too high.
Availability of Alternative Treatments Restrains Market Growth
The presence of alternative treatments in fields where atropine is traditionally used poses a significant challenge to its market dominance. In ophthalmology, for instance, drugs such as phenylephrine and tropicamide offer similar pupil dilation effects without some of the side effects associated with atropine.
This availability of alternatives can divert both physician preferences and patient demand away from atropine, curbing its market growth. As more alternatives enter the market and existing ones improve in efficacy and safety profiles, atropine's market share could further diminish, impacting its overall growth trajectory in the competitive pharmaceutical landscape.
Formulation Analysis
The injectable sub-segment dominates with a significant percentage due to its critical role in emergency and surgical applications.
The atropine market can be comprehensively analyzed by considering its various formulations: oral, injectable, and ophthalmic. The injectable formulation is particularly dominant, capturing a substantial market share. This predominance is attributable to the essential role that injectable atropine plays in emergency medicine and surgeries, where rapid response is crucial. Atropine injections are vital in managing conditions like bradycardia and as an antidote in poisonings, where its ability to quickly counteract life-threatening symptoms is unmatched.
The oral formulation of atropine, while not as predominant as injectable forms, still plays a crucial role in treating certain medical conditions such as bradycardia in a non-emergency setting. It allows for easier administration and controlled dosing, which is suitable for long-term management of diseases.
The ophthalmic formulation of atropine, used primarily for eye conditions such as myopia and cycloplegia, although a smaller segment, is witnessing growth due to increasing incidences of eye-related ailments and the rising demand for non-invasive treatment options.
Indication Analysis
Ophthalmology leads as the dominant sub-segment with a robust percentage, driven by the rising prevalence of eye disorders globally.
In the atropine market, diverse medical indications such as ophthalmology, cardiology, anesthesia, gastroenterology, respiratory medicine, poisoning treatment, and others highlight its versatility. The ophthalmology segment emerges as the most significant, propelled by the increasing global incidence of eye conditions like myopia and the use of atropine in diagnostic procedures like cycloplegia. This segment benefits from ongoing research and development activities aimed at expanding the applications of atropine in eye care, further cementing its market dominance.
The cardiology segment utilizes atropine primarily to manage heart-related emergencies, including bradycardia and heart block. Its critical role in life-saving interventions underscores its importance within the atropine market.
Anesthesia is another prominent segment where atropine is used to reduce salivation and the risk of aspiration during surgical procedures, showcasing its integral role in operative settings.
In gastroenterology, atropine serves as an antispasmodic, providing relief from gastrointestinal discomfort and disorders, thus supporting its steady demand in this segment.
Respiratory medicine sees atropine used for bronchodilation, particularly in treatments involving respiratory emergencies, highlighting its importance in managing respiratory conditions.
The poisoning treatment segment, where atropine is a critical antidote for organophosphate poisoning, showcases the drug’s essential role in emergency medical services, contributing significantly to its market presence.
End Users Analysis
Hospitals are the dominant sub-segment with a substantial percentage, due to their pivotal role in delivering comprehensive medical treatments involving atropine.
Atropine's utilization across various end users—hospitals, clinics, ambulatory surgical centers, emergency medical services, and retail pharmacies—demonstrates its broad applicability. Hospitals, as the dominant sub-segment, account for a major share of the atropine market, attributed to their comprehensive healthcare services that often require the urgent administration of atropine, especially in surgical and emergency settings.
Clinics and ambulatory surgical centers also make significant use of atropine, particularly in less critical interventions or procedures where immediate recovery and discharge of the patient are possible. Their role in the market is crucial for providing accessible healthcare services, especially in suburban and rural areas.
Emergency medical services (EMS) are vital in scenarios where atropine is needed urgently, such as in cases of cardiac arrest or poisoning. The prompt availability and administration of atropine in these settings are critical, making EMS an essential segment of the atropine market.
Retail pharmacies contribute to the atropine market by facilitating the distribution of oral and ophthalmic formulations. This segment is particularly important for ongoing patient care, allowing for the continued treatment of conditions like myopia control in a non-hospital setting.
Key Market Segments
By Formulation
- Oral
- Injectable
- Ophthalmic
By Indication
- Ophthalmology
- Cardiology
- Anesthesia
- Gastroenterology
- Respiratory Medicine
- Poisoning Treatment
- Others
By End Users
- Hospitals
- Clinics
- Ambulatory Surgical Centers
- Emergency Medical Services
- Retail Pharmacies
Growth Opportunities
Development of Novel Drug Delivery Systems Offers Growth Opportunity
The exploration of innovative drug delivery systems for atropine is poised to significantly enhance market growth. Novel methods like transdermal patches, nasal sprays, and implants offer improved drug bioavailability and efficacy, while simultaneously increasing patient compliance. For instance, the development of an atropine implant by researchers at the University of California, San Francisco, aimed at treating myopia in children, underscores a pivotal shift.
This innovation could potentially obviate the need for frequent eye drops, thus providing a more efficient treatment regimen. The adoption of such advanced delivery technologies not only caters to unmet medical needs but also broadens the therapeutic applications of atropine, potentially driving substantial market expansion.
Diversification into Veterinary Applications Offers Growth Opportunity
The burgeoning pet ownership and increased spending on animal healthcare present lucrative growth avenues for the atropine market through veterinary applications. Atropine's utility in treating conditions such as bradycardia, respiratory distress, and organophosphate poisoning in animals positions it as a critical drug in veterinary medicine.
Leading companies like Merck Animal Health and Zoetis are already capitalizing on this trend by developing atropine formulations specifically for animals. This strategic shift not only diversifies the market but also stabilizes revenue streams by tapping into the companion animal and livestock sectors, thereby multiplying the potential user base and driving market growth.
Trending Factors
Integration of Atropine in Myopia Control Are Trending Factors
Atropine's role in controlling myopia, particularly among children and adolescents, is emerging as a significant trend in the market. The growing global concern over myopia has spurred research into effective treatments, with low-dose atropine eye drops proving successful in slowing its progression.
The landmark Low-Concentration Atropine for Myopia Progression (LAMP) study by the Singapore Eye Research Institute has highlighted the effectiveness of this approach, providing robust data supporting the widespread use of atropine in myopia management. This trend not only expands the therapeutic application of atropine but also opens up new markets and opportunities for growth within pediatric ophthalmology.
Combination Therapies Are Trending Factors
The exploration of atropine in combination therapies, particularly with opioid analgesics for post-operative pain management, represents a growing trend. This innovative approach helps mitigate the adverse side effects of opioids like bradycardia and respiratory depression.
By improving the safety and efficacy of pain management protocols, atropine is becoming integral in multi-drug regimens, thus broadening its usage and enhancing its market potential. The trend towards combination therapies is driven by the need to optimize treatment outcomes and minimize drug doses, which is gaining traction across various medical fields.
Regional Analysis
North America Dominates with 35% Market Share
North America's substantial 35% share of the global atropine market can be attributed to several key factors. The region boasts advanced healthcare infrastructure, significant investment in research and development, and a robust regulatory framework supporting drug innovation and approval. Additionally, the prevalence of chronic diseases and the increasing aging population drive the demand for effective therapeutic solutions, including those involving atropine.
The dynamics of the atropine market in North America are influenced by the region's emphasis on healthcare innovation and patient safety. The strong presence of leading pharmaceutical companies and research institutions supports continuous development in medications like atropine. Moreover, public awareness and healthcare spending further bolster the market growth in this region.
The dominant position of North America in the atropine market is expected to persist. Continuous innovations, coupled with increasing healthcare expenditures and the integration of atropine into new therapeutic areas, are likely to sustain the region’s leading status. Growth in personalized medicine and biotechnology may also drive further expansion of the atropine market in North America.
Regional Market Shares:
- Europe: Holds a significant 25% market share. This is driven by the region's strong healthcare systems and active pharmaceutical sector.
- Asia Pacific: Fast-growing, currently at 20% market share, driven by expanding healthcare infrastructure and increasing access to medical treatment.
- Middle East & Africa: Smaller, yet growing share of 10%, influenced by gradually improving healthcare systems and investment in medical research.
- Latin America: Maintains a 10% share, supported by gradual improvements in healthcare infrastructure and regulatory frameworks.
Key Regions and Countries
- North America
- The US
- Canada
- Mexico
- Western Europe
- Germany
- France
- The UK
- Spain
- Italy
- Portugal
- Ireland
- Austria
- Switzerland
- Benelux
- Nordic
- Rest of Western Europe
- Eastern Europe
- Russia
- Poland
- The Czech Republic
- Greece
- Rest of Eastern Europe
- APAC
- China
- Japan
- South Korea
- India
- Australia & New Zealand
- Indonesia
- Malaysia
- Philippines
- Singapore
- Thailand
- Vietnam
- Rest of APAC
- Latin America
- Brazil
- Colombia
- Chile
- Argentina
- Costa Rica
- Rest of Latin America
- Middle East & Africa
- Algeria
- Egypt
- Israel
- Kuwait
- Nigeria
- Saudi Arabia
- South Africa
- Turkey
- United Arab Emirates
- Rest of MEA
Key Players Analysis
Within the atropine market, key companies such as AdvaCare Pharma, Sydnexis, and SUNY College of Optometry have strategically positioned themselves by focusing on the progression of myopia, particularly in children. These entities contribute significantly to research and development initiatives, influencing the forecast period dynamics and addressing the rising prevalence of myopia globally. Companies like Abbott Laboratories, Amgen Inc, and Eli Lilly and Company have enhanced market development through innovative treatments for progressive myopia, helping to mitigate adverse events associated with myopia treatments.
Furthermore, Asia Pacific market experts from firms such as Takeda Pharmaceuticals and Bayer AG are pivotal in exploring the refractive error treatments, responding to the increase in myopia and the worsening conditions of myopic children. The strategic contributions of these KEY COMPANIES, including biotechnology giants like Bristol-Myers Squibb Company and Zoetis Inc, underscore their market influence. Their efforts are supported by robust company profiles and collaborations with academic institutions, driving targeted market development through both pharmaceutical advancements and detailed Asian studies over the specified time period, highlighting the key factors influencing the sector.
Market Key Players
- AdvaCare Pharma
- Sydnexis
- SUNY College of Optometry
- Abbott Laboratories
- Amgen Inc
- Eli Lilly and Company
- Bristol-Myers Squibb Company
- Bayer AG
- Takeda Pharmaceuticals
- Zoetis Inc
Recent Developments
- On April 2024, Eyenovia acquired the development and commercialization rights for MicroPine and MicroLine from Nicox. These are innovative microdose atropine formulations designed to treat progressive myopia and presbyopia. Eyenovia aims to advance these products through clinical development and regulatory approval processes to address the growing demand for myopia and presbyopia treatments.
- On February 2023, Harrow launched next-generation compounded atropine formulations that do not contain preservatives or boric acid, with a physiologic pH of 5.5. These formulations can be stored at room temperature for up to 180 days. The company's mission is to make ophthalmic medications accessible and affordable, addressing the unmet needs of patients.
- On May 2022, DCGI approved ENTOD Pharma's Phase III study of 0.05 per cent Atropine eye drops. These eye drops are intended to treat myopia, especially in children, by slowing its progression. ENTOD Pharmaceuticals aims to be the first company globally to market 0.05 per cent atropine eye drops, subject to successful safety and efficacy demonstration in clinical studies.
Report Scope
Report Features Description Market Value (2023) USD 250 Million Forecast Revenue (2033) USD 318.1 Million CAGR (2024-2033) 2.5% Base Year for Estimation 2023 Historic Period 2018-2023 Forecast Period 2024-2033 Report Coverage Revenue Forecast, Market Dynamics, Competitive Landscape, Recent Developments Segments Covered By Formulation (Oral, Injectable, Ophthalmic), By Indication (Ophthalmology, Cardiology, Anesthesia, Gastroenterology, Respiratory Medicine, Poisoning Treatment, Others), By End Users (Hospitals, Clinics, Ambulatory Surgical Centers, Emergency Medical Services, Retail Pharmacies) Regional Analysis North America - The US, Canada, & Mexico; Western Europe - Germany, France, The UK, Spain, Italy, Portugal, Ireland, Austria, Switzerland, Benelux, Nordic, & Rest of Western Europe; Eastern Europe - Russia, Poland, The Czech Republic, Greece, & Rest of Eastern Europe; APAC - China, Japan, South Korea, India, Australia & New Zealand, Indonesia, Malaysia, Philippines, Singapore, Thailand, Vietnam, & Rest of APAC; Latin America - Brazil, Colombia, Chile, Argentina, Costa Rica, & Rest of Latin America; Middle East & Africa - Algeria, Egypt, Israel, Kuwait, Nigeria, Saudi Arabia, South Africa, Turkey, United Arab Emirates, & Rest of MEA Competitive Landscape AdvaCare Pharma, Sydnexis, SUNY College of Optometry, Abbott Laboratories, Amgen Inc., Eli Lilly and Company, Bristol-Myers Squibb Company, Bayer AG, Takeda Pharmaceuticals, Zoetis Inc. Customization Scope Customization for segments, region/country-level will be provided. Moreover, additional customization can be done based on the requirements. Purchase Options We have three licenses to opt for: Single User License, Multi-User License (Up to 5 Users), Corporate Use License (Unlimited User and Printable PDF) -
- 1. Executive Summary
- 1.1. Definition
- 1.2. Taxonomy
- 1.3. Research Scope
- 1.4. Key Analysis
- 1.5. Key Findings by Major Segments
- 1.6. Top strategies by Major Players
- 2. Global Atropine Market Overview
- 2.1. Atropine Market Dynamics
- 2.1.1. Drivers
- 2.1.2. Opportunities
- 2.1.3. Restraints
- 2.1.4. Challenges
- 2.2. Macro-economic Factors
- 2.3. Regulatory Framework
- 2.4. Market Investment Feasibility Index
- 2.5. PEST Analysis
- 2.6. PORTER’S Five Force Analysis
- 2.7. Drivers & Restraints Impact Analysis
- 2.8. Industry Chain Analysis
- 2.9. Cost Structure Analysis
- 2.10. Marketing Strategy
- 2.11. Russia-Ukraine War Impact Analysis
- 2.12. Opportunity Map Analysis
- 2.13. Market Competition Scenario Analysis
- 2.14. Product Life Cycle Analysis
- 2.15. Opportunity Orbits
- 2.16. Manufacturer Intensity Map
- 2.17. Major Companies sales by Value & Volume
- 2.1. Atropine Market Dynamics
- 3. Global Atropine Market Analysis, Opportunity and Forecast, 2016-2032
- 3.1. Global Atropine Market Analysis, 2016-2021
- 3.2. Global Atropine Market Opportunity and Forecast, 2023-2032
- 3.3. Global Atropine Market Analysis, Opportunity and Forecast, By Formulation, 2016-2032
- 3.3.1. Global Atropine Market Analysis by Formulation: Introduction
- 3.3.2. Market Size Absolute $ Opportunity Analysis and Forecast, By Formulation, 2016-2032
- 3.3.3. Oral
- 3.3.4. Injectable
- 3.3.5. Ophthalmic
- 3.4. Global Atropine Market Analysis, Opportunity and Forecast, By Indication, 2016-2032
- 3.4.1. Global Atropine Market Analysis by Indication: Introduction
- 3.4.2. Market Size Absolute $ Opportunity Analysis and Forecast, By Indication, 2016-2032
- 3.4.3. Ophthalmology
- 3.4.4. Cardiology
- 3.4.5. Anesthesia
- 3.4.6. Gastroenterology
- 3.4.7. Respiratory Medicine
- 3.4.8. Poisoning Treatment
- 3.4.9. Others
- 3.5. Global Atropine Market Analysis, Opportunity and Forecast, By End Users, 2016-2032
- 3.5.1. Global Atropine Market Analysis by End Users: Introduction
- 3.5.2. Market Size Absolute $ Opportunity Analysis and Forecast, By End Users, 2016-2032
- 3.5.3. Hospitals
- 3.5.4. Clinics
- 3.5.5. Ambulatory Surgical Centers
- 3.5.6. Emergency Medical Services
- 3.5.7. Retail Pharmacies
- 4. North America Atropine Market Analysis, Opportunity and Forecast, 2016-2032
- 4.1. North America Atropine Market Analysis, 2016-2021
- 4.2. North America Atropine Market Opportunity and Forecast, 2023-2032
- 4.3. North America Atropine Market Analysis, Opportunity and Forecast, By Formulation, 2016-2032
- 4.3.1. North America Atropine Market Analysis by Formulation: Introduction
- 4.3.2. Market Size Absolute $ Opportunity Analysis and Forecast, By Formulation, 2016-2032
- 4.3.3. Oral
- 4.3.4. Injectable
- 4.3.5. Ophthalmic
- 4.4. North America Atropine Market Analysis, Opportunity and Forecast, By Indication, 2016-2032
- 4.4.1. North America Atropine Market Analysis by Indication: Introduction
- 4.4.2. Market Size Absolute $ Opportunity Analysis and Forecast, By Indication, 2016-2032
- 4.4.3. Ophthalmology
- 4.4.4. Cardiology
- 4.4.5. Anesthesia
- 4.4.6. Gastroenterology
- 4.4.7. Respiratory Medicine
- 4.4.8. Poisoning Treatment
- 4.4.9. Others
- 4.5. North America Atropine Market Analysis, Opportunity and Forecast, By End Users, 2016-2032
- 4.5.1. North America Atropine Market Analysis by End Users: Introduction
- 4.5.2. Market Size Absolute $ Opportunity Analysis and Forecast, By End Users, 2016-2032
- 4.5.3. Hospitals
- 4.5.4. Clinics
- 4.5.5. Ambulatory Surgical Centers
- 4.5.6. Emergency Medical Services
- 4.5.7. Retail Pharmacies
- 4.6. North America Atropine Market Analysis, Opportunity and Forecast, By Country , 2016-2032
- 4.6.1. North America Atropine Market Analysis by Country : Introduction
- 4.6.2. Market Size Absolute $ Opportunity Analysis and Forecast, Country , 2016-2032
- 4.6.2.1. The US
- 4.6.2.2. Canada
- 4.6.2.3. Mexico
- 5. Western Europe Atropine Market Analysis, Opportunity and Forecast, 2016-2032
- 5.1. Western Europe Atropine Market Analysis, 2016-2021
- 5.2. Western Europe Atropine Market Opportunity and Forecast, 2023-2032
- 5.3. Western Europe Atropine Market Analysis, Opportunity and Forecast, By Formulation, 2016-2032
- 5.3.1. Western Europe Atropine Market Analysis by Formulation: Introduction
- 5.3.2. Market Size Absolute $ Opportunity Analysis and Forecast, By Formulation, 2016-2032
- 5.3.3. Oral
- 5.3.4. Injectable
- 5.3.5. Ophthalmic
- 5.4. Western Europe Atropine Market Analysis, Opportunity and Forecast, By Indication, 2016-2032
- 5.4.1. Western Europe Atropine Market Analysis by Indication: Introduction
- 5.4.2. Market Size Absolute $ Opportunity Analysis and Forecast, By Indication, 2016-2032
- 5.4.3. Ophthalmology
- 5.4.4. Cardiology
- 5.4.5. Anesthesia
- 5.4.6. Gastroenterology
- 5.4.7. Respiratory Medicine
- 5.4.8. Poisoning Treatment
- 5.4.9. Others
- 5.5. Western Europe Atropine Market Analysis, Opportunity and Forecast, By End Users, 2016-2032
- 5.5.1. Western Europe Atropine Market Analysis by End Users: Introduction
- 5.5.2. Market Size Absolute $ Opportunity Analysis and Forecast, By End Users, 2016-2032
- 5.5.3. Hospitals
- 5.5.4. Clinics
- 5.5.5. Ambulatory Surgical Centers
- 5.5.6. Emergency Medical Services
- 5.5.7. Retail Pharmacies
- 5.6. Western Europe Atropine Market Analysis, Opportunity and Forecast, By Country , 2016-2032
- 5.6.1. Western Europe Atropine Market Analysis by Country : Introduction
- 5.6.2. Market Size Absolute $ Opportunity Analysis and Forecast, Country , 2016-2032
- 5.6.2.1. Germany
- 5.6.2.2. France
- 5.6.2.3. The UK
- 5.6.2.4. Spain
- 5.6.2.5. Italy
- 5.6.2.6. Portugal
- 5.6.2.7. Ireland
- 5.6.2.8. Austria
- 5.6.2.9. Switzerland
- 5.6.2.10. Benelux
- 5.6.2.11. Nordic
- 5.6.2.12. Rest of Western Europe
- 6. Eastern Europe Atropine Market Analysis, Opportunity and Forecast, 2016-2032
- 6.1. Eastern Europe Atropine Market Analysis, 2016-2021
- 6.2. Eastern Europe Atropine Market Opportunity and Forecast, 2023-2032
- 6.3. Eastern Europe Atropine Market Analysis, Opportunity and Forecast, By Formulation, 2016-2032
- 6.3.1. Eastern Europe Atropine Market Analysis by Formulation: Introduction
- 6.3.2. Market Size Absolute $ Opportunity Analysis and Forecast, By Formulation, 2016-2032
- 6.3.3. Oral
- 6.3.4. Injectable
- 6.3.5. Ophthalmic
- 6.4. Eastern Europe Atropine Market Analysis, Opportunity and Forecast, By Indication, 2016-2032
- 6.4.1. Eastern Europe Atropine Market Analysis by Indication: Introduction
- 6.4.2. Market Size Absolute $ Opportunity Analysis and Forecast, By Indication, 2016-2032
- 6.4.3. Ophthalmology
- 6.4.4. Cardiology
- 6.4.5. Anesthesia
- 6.4.6. Gastroenterology
- 6.4.7. Respiratory Medicine
- 6.4.8. Poisoning Treatment
- 6.4.9. Others
- 6.5. Eastern Europe Atropine Market Analysis, Opportunity and Forecast, By End Users, 2016-2032
- 6.5.1. Eastern Europe Atropine Market Analysis by End Users: Introduction
- 6.5.2. Market Size Absolute $ Opportunity Analysis and Forecast, By End Users, 2016-2032
- 6.5.3. Hospitals
- 6.5.4. Clinics
- 6.5.5. Ambulatory Surgical Centers
- 6.5.6. Emergency Medical Services
- 6.5.7. Retail Pharmacies
- 6.6. Eastern Europe Atropine Market Analysis, Opportunity and Forecast, By Country , 2016-2032
- 6.6.1. Eastern Europe Atropine Market Analysis by Country : Introduction
- 6.6.2. Market Size Absolute $ Opportunity Analysis and Forecast, Country , 2016-2032
- 6.6.2.1. Russia
- 6.6.2.2. Poland
- 6.6.2.3. The Czech Republic
- 6.6.2.4. Greece
- 6.6.2.5. Rest of Eastern Europe
- 7. APAC Atropine Market Analysis, Opportunity and Forecast, 2016-2032
- 7.1. APAC Atropine Market Analysis, 2016-2021
- 7.2. APAC Atropine Market Opportunity and Forecast, 2023-2032
- 7.3. APAC Atropine Market Analysis, Opportunity and Forecast, By Formulation, 2016-2032
- 7.3.1. APAC Atropine Market Analysis by Formulation: Introduction
- 7.3.2. Market Size Absolute $ Opportunity Analysis and Forecast, By Formulation, 2016-2032
- 7.3.3. Oral
- 7.3.4. Injectable
- 7.3.5. Ophthalmic
- 7.4. APAC Atropine Market Analysis, Opportunity and Forecast, By Indication, 2016-2032
- 7.4.1. APAC Atropine Market Analysis by Indication: Introduction
- 7.4.2. Market Size Absolute $ Opportunity Analysis and Forecast, By Indication, 2016-2032
- 7.4.3. Ophthalmology
- 7.4.4. Cardiology
- 7.4.5. Anesthesia
- 7.4.6. Gastroenterology
- 7.4.7. Respiratory Medicine
- 7.4.8. Poisoning Treatment
- 7.4.9. Others
- 7.5. APAC Atropine Market Analysis, Opportunity and Forecast, By End Users, 2016-2032
- 7.5.1. APAC Atropine Market Analysis by End Users: Introduction
- 7.5.2. Market Size Absolute $ Opportunity Analysis and Forecast, By End Users, 2016-2032
- 7.5.3. Hospitals
- 7.5.4. Clinics
- 7.5.5. Ambulatory Surgical Centers
- 7.5.6. Emergency Medical Services
- 7.5.7. Retail Pharmacies
- 7.6. APAC Atropine Market Analysis, Opportunity and Forecast, By Country , 2016-2032
- 7.6.1. APAC Atropine Market Analysis by Country : Introduction
- 7.6.2. Market Size Absolute $ Opportunity Analysis and Forecast, Country , 2016-2032
- 7.6.2.1. China
- 7.6.2.2. Japan
- 7.6.2.3. South Korea
- 7.6.2.4. India
- 7.6.2.5. Australia & New Zeland
- 7.6.2.6. Indonesia
- 7.6.2.7. Malaysia
- 7.6.2.8. Philippines
- 7.6.2.9. Singapore
- 7.6.2.10. Thailand
- 7.6.2.11. Vietnam
- 7.6.2.12. Rest of APAC
- 8. Latin America Atropine Market Analysis, Opportunity and Forecast, 2016-2032
- 8.1. Latin America Atropine Market Analysis, 2016-2021
- 8.2. Latin America Atropine Market Opportunity and Forecast, 2023-2032
- 8.3. Latin America Atropine Market Analysis, Opportunity and Forecast, By Formulation, 2016-2032
- 8.3.1. Latin America Atropine Market Analysis by Formulation: Introduction
- 8.3.2. Market Size Absolute $ Opportunity Analysis and Forecast, By Formulation, 2016-2032
- 8.3.3. Oral
- 8.3.4. Injectable
- 8.3.5. Ophthalmic
- 8.4. Latin America Atropine Market Analysis, Opportunity and Forecast, By Indication, 2016-2032
- 8.4.1. Latin America Atropine Market Analysis by Indication: Introduction
- 8.4.2. Market Size Absolute $ Opportunity Analysis and Forecast, By Indication, 2016-2032
- 8.4.3. Ophthalmology
- 8.4.4. Cardiology
- 8.4.5. Anesthesia
- 8.4.6. Gastroenterology
- 8.4.7. Respiratory Medicine
- 8.4.8. Poisoning Treatment
- 8.4.9. Others
- 8.5. Latin America Atropine Market Analysis, Opportunity and Forecast, By End Users, 2016-2032
- 8.5.1. Latin America Atropine Market Analysis by End Users: Introduction
- 8.5.2. Market Size Absolute $ Opportunity Analysis and Forecast, By End Users, 2016-2032
- 8.5.3. Hospitals
- 8.5.4. Clinics
- 8.5.5. Ambulatory Surgical Centers
- 8.5.6. Emergency Medical Services
- 8.5.7. Retail Pharmacies
- 8.6. Latin America Atropine Market Analysis, Opportunity and Forecast, By Country , 2016-2032
- 8.6.1. Latin America Atropine Market Analysis by Country : Introduction
- 8.6.2. Market Size Absolute $ Opportunity Analysis and Forecast, Country , 2016-2032
- 8.6.2.1. Brazil
- 8.6.2.2. Colombia
- 8.6.2.3. Chile
- 8.6.2.4. Argentina
- 8.6.2.5. Costa Rica
- 8.6.2.6. Rest of Latin America
- 9. Middle East & Africa Atropine Market Analysis, Opportunity and Forecast, 2016-2032
- 9.1. Middle East & Africa Atropine Market Analysis, 2016-2021
- 9.2. Middle East & Africa Atropine Market Opportunity and Forecast, 2023-2032
- 9.3. Middle East & Africa Atropine Market Analysis, Opportunity and Forecast, By Formulation, 2016-2032
- 9.3.1. Middle East & Africa Atropine Market Analysis by Formulation: Introduction
- 9.3.2. Market Size Absolute $ Opportunity Analysis and Forecast, By Formulation, 2016-2032
- 9.3.3. Oral
- 9.3.4. Injectable
- 9.3.5. Ophthalmic
- 9.4. Middle East & Africa Atropine Market Analysis, Opportunity and Forecast, By Indication, 2016-2032
- 9.4.1. Middle East & Africa Atropine Market Analysis by Indication: Introduction
- 9.4.2. Market Size Absolute $ Opportunity Analysis and Forecast, By Indication, 2016-2032
- 9.4.3. Ophthalmology
- 9.4.4. Cardiology
- 9.4.5. Anesthesia
- 9.4.6. Gastroenterology
- 9.4.7. Respiratory Medicine
- 9.4.8. Poisoning Treatment
- 9.4.9. Others
- 9.5. Middle East & Africa Atropine Market Analysis, Opportunity and Forecast, By End Users, 2016-2032
- 9.5.1. Middle East & Africa Atropine Market Analysis by End Users: Introduction
- 9.5.2. Market Size Absolute $ Opportunity Analysis and Forecast, By End Users, 2016-2032
- 9.5.3. Hospitals
- 9.5.4. Clinics
- 9.5.5. Ambulatory Surgical Centers
- 9.5.6. Emergency Medical Services
- 9.5.7. Retail Pharmacies
- 9.6. Middle East & Africa Atropine Market Analysis, Opportunity and Forecast, By Country , 2016-2032
- 9.6.1. Middle East & Africa Atropine Market Analysis by Country : Introduction
- 9.6.2. Market Size Absolute $ Opportunity Analysis and Forecast, Country , 2016-2032
- 9.6.2.1. Algeria
- 9.6.2.2. Egypt
- 9.6.2.3. Israel
- 9.6.2.4. Kuwait
- 9.6.2.5. Nigeria
- 9.6.2.6. Saudi Arabia
- 9.6.2.7. South Africa
- 9.6.2.8. Turkey
- 9.6.2.9. The UAE
- 9.6.2.10. Rest of MEA
- 10. Global Atropine Market Analysis, Opportunity and Forecast, By Region , 2016-2032
- 10.1. Global Atropine Market Analysis by Region : Introduction
- 10.2. Market Size Absolute $ Opportunity Analysis and Forecast, By Region , 2016-2032
- 10.2.1. North America
- 10.2.2. Western Europe
- 10.2.3. Eastern Europe
- 10.2.4. APAC
- 10.2.5. Latin America
- 10.2.6. Middle East & Africa
- 11. Global Atropine Market Competitive Landscape, Market Share Analysis, and Company Profiles
- 11.1. Market Share Analysis
- 11.2. Company Profiles
- 11.3. AdvaCare Pharma
- 11.3.1. Company Overview
- 11.3.2. Financial Highlights
- 11.3.3. Product Portfolio
- 11.3.4. SWOT Analysis
- 11.3.5. Key Strategies and Developments
- 11.4. Sydnexis
- 11.4.1. Company Overview
- 11.4.2. Financial Highlights
- 11.4.3. Product Portfolio
- 11.4.4. SWOT Analysis
- 11.4.5. Key Strategies and Developments
- 11.5. SUNY College of Optometry
- 11.5.1. Company Overview
- 11.5.2. Financial Highlights
- 11.5.3. Product Portfolio
- 11.5.4. SWOT Analysis
- 11.5.5. Key Strategies and Developments
- 11.6. Abbott Laboratories
- 11.6.1. Company Overview
- 11.6.2. Financial Highlights
- 11.6.3. Product Portfolio
- 11.6.4. SWOT Analysis
- 11.6.5. Key Strategies and Developments
- 11.7. Amgen Inc
- 11.7.1. Company Overview
- 11.7.2. Financial Highlights
- 11.7.3. Product Portfolio
- 11.7.4. SWOT Analysis
- 11.7.5. Key Strategies and Developments
- 11.8. Eli Lilly and Company
- 11.8.1. Company Overview
- 11.8.2. Financial Highlights
- 11.8.3. Product Portfolio
- 11.8.4. SWOT Analysis
- 11.8.5. Key Strategies and Developments
- 11.9. Bristol-Myers Squibb Company
- 11.9.1. Company Overview
- 11.9.2. Financial Highlights
- 11.9.3. Product Portfolio
- 11.9.4. SWOT Analysis
- 11.9.5. Key Strategies and Developments
- 11.10. Bayer AG
- 11.10.1. Company Overview
- 11.10.2. Financial Highlights
- 11.10.3. Product Portfolio
- 11.10.4. SWOT Analysis
- 11.10.5. Key Strategies and Developments
- 11.11. Takeda Pharmaceuticals
- 11.11.1. Company Overview
- 11.11.2. Financial Highlights
- 11.11.3. Product Portfolio
- 11.11.4. SWOT Analysis
- 11.11.5. Key Strategies and Developments
- 11.12. Zoetis Inc
- 11.12.1. Company Overview
- 11.12.2. Financial Highlights
- 11.12.3. Product Portfolio
- 11.12.4. SWOT Analysis
- 11.12.5. Key Strategies and Developments
- 11.13.1. Company Overview
- 11.13.2. Financial Highlights
- 11.13.3. Product Portfolio
- 11.13.4. SWOT Analysis
- 11.13.5. Key Strategies and Developments
- 12. Assumptions and Acronyms
- 13. Research Methodology
- 14. Contact
- List of Figures
- Figure 1: Global Atropine Market Revenue (US$ Mn) Market Share by Formulation in 2022
- Figure 2: Global Atropine Market Attractiveness Analysis by Formulation, 2016-2032
- Figure 3: Global Atropine Market Revenue (US$ Mn) Market Share by Indicationin 2022
- Figure 4: Global Atropine Market Attractiveness Analysis by Indication, 2016-2032
- Figure 5: Global Atropine Market Revenue (US$ Mn) Market Share by End Usersin 2022
- Figure 6: Global Atropine Market Attractiveness Analysis by End Users, 2016-2032
- Figure 7: Global Atropine Market Revenue (US$ Mn) Market Share by Region in 2022
- Figure 8: Global Atropine Market Attractiveness Analysis by Region, 2016-2032
- Figure 9: Global Atropine Market Revenue (US$ Mn) (2016-2032)
- Figure 10: Global Atropine Market Revenue (US$ Mn) Comparison by Region (2016-2032)
- Figure 11: Global Atropine Market Revenue (US$ Mn) Comparison by Formulation (2016-2032)
- Figure 12: Global Atropine Market Revenue (US$ Mn) Comparison by Indication (2016-2032)
- Figure 13: Global Atropine Market Revenue (US$ Mn) Comparison by End Users (2016-2032)
- Figure 14: Global Atropine Market Y-o-Y Growth Rate Comparison by Region (2016-2032)
- Figure 15: Global Atropine Market Y-o-Y Growth Rate Comparison by Formulation (2016-2032)
- Figure 16: Global Atropine Market Y-o-Y Growth Rate Comparison by Indication (2016-2032)
- Figure 17: Global Atropine Market Y-o-Y Growth Rate Comparison by End Users (2016-2032)
- Figure 18: Global Atropine Market Share Comparison by Region (2016-2032)
- Figure 19: Global Atropine Market Share Comparison by Formulation (2016-2032)
- Figure 20: Global Atropine Market Share Comparison by Indication (2016-2032)
- Figure 21: Global Atropine Market Share Comparison by End Users (2016-2032)
- Figure 22: North America Atropine Market Revenue (US$ Mn) Market Share by Formulationin 2022
- Figure 23: North America Atropine Market Attractiveness Analysis by Formulation, 2016-2032
- Figure 24: North America Atropine Market Revenue (US$ Mn) Market Share by Indicationin 2022
- Figure 25: North America Atropine Market Attractiveness Analysis by Indication, 2016-2032
- Figure 26: North America Atropine Market Revenue (US$ Mn) Market Share by End Usersin 2022
- Figure 27: North America Atropine Market Attractiveness Analysis by End Users, 2016-2032
- Figure 28: North America Atropine Market Revenue (US$ Mn) Market Share by Country in 2022
- Figure 29: North America Atropine Market Attractiveness Analysis by Country, 2016-2032
- Figure 30: North America Atropine Market Revenue (US$ Mn) (2016-2032)
- Figure 31: North America Atropine Market Revenue (US$ Mn) Comparison by Country (2016-2032)
- Figure 32: North America Atropine Market Revenue (US$ Mn) Comparison by Formulation (2016-2032)
- Figure 33: North America Atropine Market Revenue (US$ Mn) Comparison by Indication (2016-2032)
- Figure 34: North America Atropine Market Revenue (US$ Mn) Comparison by End Users (2016-2032)
- Figure 35: North America Atropine Market Y-o-Y Growth Rate Comparison by Country (2016-2032)
- Figure 36: North America Atropine Market Y-o-Y Growth Rate Comparison by Formulation (2016-2032)
- Figure 37: North America Atropine Market Y-o-Y Growth Rate Comparison by Indication (2016-2032)
- Figure 38: North America Atropine Market Y-o-Y Growth Rate Comparison by End Users (2016-2032)
- Figure 39: North America Atropine Market Share Comparison by Country (2016-2032)
- Figure 40: North America Atropine Market Share Comparison by Formulation (2016-2032)
- Figure 41: North America Atropine Market Share Comparison by Indication (2016-2032)
- Figure 42: North America Atropine Market Share Comparison by End Users (2016-2032)
- Figure 43: Western Europe Atropine Market Revenue (US$ Mn) Market Share by Formulationin 2022
- Figure 44: Western Europe Atropine Market Attractiveness Analysis by Formulation, 2016-2032
- Figure 45: Western Europe Atropine Market Revenue (US$ Mn) Market Share by Indicationin 2022
- Figure 46: Western Europe Atropine Market Attractiveness Analysis by Indication, 2016-2032
- Figure 47: Western Europe Atropine Market Revenue (US$ Mn) Market Share by End Usersin 2022
- Figure 48: Western Europe Atropine Market Attractiveness Analysis by End Users, 2016-2032
- Figure 49: Western Europe Atropine Market Revenue (US$ Mn) Market Share by Country in 2022
- Figure 50: Western Europe Atropine Market Attractiveness Analysis by Country, 2016-2032
- Figure 51: Western Europe Atropine Market Revenue (US$ Mn) (2016-2032)
- Figure 52: Western Europe Atropine Market Revenue (US$ Mn) Comparison by Country (2016-2032)
- Figure 53: Western Europe Atropine Market Revenue (US$ Mn) Comparison by Formulation (2016-2032)
- Figure 54: Western Europe Atropine Market Revenue (US$ Mn) Comparison by Indication (2016-2032)
- Figure 55: Western Europe Atropine Market Revenue (US$ Mn) Comparison by End Users (2016-2032)
- Figure 56: Western Europe Atropine Market Y-o-Y Growth Rate Comparison by Country (2016-2032)
- Figure 57: Western Europe Atropine Market Y-o-Y Growth Rate Comparison by Formulation (2016-2032)
- Figure 58: Western Europe Atropine Market Y-o-Y Growth Rate Comparison by Indication (2016-2032)
- Figure 59: Western Europe Atropine Market Y-o-Y Growth Rate Comparison by End Users (2016-2032)
- Figure 60: Western Europe Atropine Market Share Comparison by Country (2016-2032)
- Figure 61: Western Europe Atropine Market Share Comparison by Formulation (2016-2032)
- Figure 62: Western Europe Atropine Market Share Comparison by Indication (2016-2032)
- Figure 63: Western Europe Atropine Market Share Comparison by End Users (2016-2032)
- Figure 64: Eastern Europe Atropine Market Revenue (US$ Mn) Market Share by Formulationin 2022
- Figure 65: Eastern Europe Atropine Market Attractiveness Analysis by Formulation, 2016-2032
- Figure 66: Eastern Europe Atropine Market Revenue (US$ Mn) Market Share by Indicationin 2022
- Figure 67: Eastern Europe Atropine Market Attractiveness Analysis by Indication, 2016-2032
- Figure 68: Eastern Europe Atropine Market Revenue (US$ Mn) Market Share by End Usersin 2022
- Figure 69: Eastern Europe Atropine Market Attractiveness Analysis by End Users, 2016-2032
- Figure 70: Eastern Europe Atropine Market Revenue (US$ Mn) Market Share by Country in 2022
- Figure 71: Eastern Europe Atropine Market Attractiveness Analysis by Country, 2016-2032
- Figure 72: Eastern Europe Atropine Market Revenue (US$ Mn) (2016-2032)
- Figure 73: Eastern Europe Atropine Market Revenue (US$ Mn) Comparison by Country (2016-2032)
- Figure 74: Eastern Europe Atropine Market Revenue (US$ Mn) Comparison by Formulation (2016-2032)
- Figure 75: Eastern Europe Atropine Market Revenue (US$ Mn) Comparison by Indication (2016-2032)
- Figure 76: Eastern Europe Atropine Market Revenue (US$ Mn) Comparison by End Users (2016-2032)
- Figure 77: Eastern Europe Atropine Market Y-o-Y Growth Rate Comparison by Country (2016-2032)
- Figure 78: Eastern Europe Atropine Market Y-o-Y Growth Rate Comparison by Formulation (2016-2032)
- Figure 79: Eastern Europe Atropine Market Y-o-Y Growth Rate Comparison by Indication (2016-2032)
- Figure 80: Eastern Europe Atropine Market Y-o-Y Growth Rate Comparison by End Users (2016-2032)
- Figure 81: Eastern Europe Atropine Market Share Comparison by Country (2016-2032)
- Figure 82: Eastern Europe Atropine Market Share Comparison by Formulation (2016-2032)
- Figure 83: Eastern Europe Atropine Market Share Comparison by Indication (2016-2032)
- Figure 84: Eastern Europe Atropine Market Share Comparison by End Users (2016-2032)
- Figure 85: APAC Atropine Market Revenue (US$ Mn) Market Share by Formulationin 2022
- Figure 86: APAC Atropine Market Attractiveness Analysis by Formulation, 2016-2032
- Figure 87: APAC Atropine Market Revenue (US$ Mn) Market Share by Indicationin 2022
- Figure 88: APAC Atropine Market Attractiveness Analysis by Indication, 2016-2032
- Figure 89: APAC Atropine Market Revenue (US$ Mn) Market Share by End Usersin 2022
- Figure 90: APAC Atropine Market Attractiveness Analysis by End Users, 2016-2032
- Figure 91: APAC Atropine Market Revenue (US$ Mn) Market Share by Country in 2022
- Figure 92: APAC Atropine Market Attractiveness Analysis by Country, 2016-2032
- Figure 93: APAC Atropine Market Revenue (US$ Mn) (2016-2032)
- Figure 94: APAC Atropine Market Revenue (US$ Mn) Comparison by Country (2016-2032)
- Figure 95: APAC Atropine Market Revenue (US$ Mn) Comparison by Formulation (2016-2032)
- Figure 96: APAC Atropine Market Revenue (US$ Mn) Comparison by Indication (2016-2032)
- Figure 97: APAC Atropine Market Revenue (US$ Mn) Comparison by End Users (2016-2032)
- Figure 98: APAC Atropine Market Y-o-Y Growth Rate Comparison by Country (2016-2032)
- Figure 99: APAC Atropine Market Y-o-Y Growth Rate Comparison by Formulation (2016-2032)
- Figure 100: APAC Atropine Market Y-o-Y Growth Rate Comparison by Indication (2016-2032)
- Figure 101: APAC Atropine Market Y-o-Y Growth Rate Comparison by End Users (2016-2032)
- Figure 102: APAC Atropine Market Share Comparison by Country (2016-2032)
- Figure 103: APAC Atropine Market Share Comparison by Formulation (2016-2032)
- Figure 104: APAC Atropine Market Share Comparison by Indication (2016-2032)
- Figure 105: APAC Atropine Market Share Comparison by End Users (2016-2032)
- Figure 106: Latin America Atropine Market Revenue (US$ Mn) Market Share by Formulationin 2022
- Figure 107: Latin America Atropine Market Attractiveness Analysis by Formulation, 2016-2032
- Figure 108: Latin America Atropine Market Revenue (US$ Mn) Market Share by Indicationin 2022
- Figure 109: Latin America Atropine Market Attractiveness Analysis by Indication, 2016-2032
- Figure 110: Latin America Atropine Market Revenue (US$ Mn) Market Share by End Usersin 2022
- Figure 111: Latin America Atropine Market Attractiveness Analysis by End Users, 2016-2032
- Figure 112: Latin America Atropine Market Revenue (US$ Mn) Market Share by Country in 2022
- Figure 113: Latin America Atropine Market Attractiveness Analysis by Country, 2016-2032
- Figure 114: Latin America Atropine Market Revenue (US$ Mn) (2016-2032)
- Figure 115: Latin America Atropine Market Revenue (US$ Mn) Comparison by Country (2016-2032)
- Figure 116: Latin America Atropine Market Revenue (US$ Mn) Comparison by Formulation (2016-2032)
- Figure 117: Latin America Atropine Market Revenue (US$ Mn) Comparison by Indication (2016-2032)
- Figure 118: Latin America Atropine Market Revenue (US$ Mn) Comparison by End Users (2016-2032)
- Figure 119: Latin America Atropine Market Y-o-Y Growth Rate Comparison by Country (2016-2032)
- Figure 120: Latin America Atropine Market Y-o-Y Growth Rate Comparison by Formulation (2016-2032)
- Figure 121: Latin America Atropine Market Y-o-Y Growth Rate Comparison by Indication (2016-2032)
- Figure 122: Latin America Atropine Market Y-o-Y Growth Rate Comparison by End Users (2016-2032)
- Figure 123: Latin America Atropine Market Share Comparison by Country (2016-2032)
- Figure 124: Latin America Atropine Market Share Comparison by Formulation (2016-2032)
- Figure 125: Latin America Atropine Market Share Comparison by Indication (2016-2032)
- Figure 126: Latin America Atropine Market Share Comparison by End Users (2016-2032)
- Figure 127: Middle East & Africa Atropine Market Revenue (US$ Mn) Market Share by Formulationin 2022
- Figure 128: Middle East & Africa Atropine Market Attractiveness Analysis by Formulation, 2016-2032
- Figure 129: Middle East & Africa Atropine Market Revenue (US$ Mn) Market Share by Indicationin 2022
- Figure 130: Middle East & Africa Atropine Market Attractiveness Analysis by Indication, 2016-2032
- Figure 131: Middle East & Africa Atropine Market Revenue (US$ Mn) Market Share by End Usersin 2022
- Figure 132: Middle East & Africa Atropine Market Attractiveness Analysis by End Users, 2016-2032
- Figure 133: Middle East & Africa Atropine Market Revenue (US$ Mn) Market Share by Country in 2022
- Figure 134: Middle East & Africa Atropine Market Attractiveness Analysis by Country, 2016-2032
- Figure 135: Middle East & Africa Atropine Market Revenue (US$ Mn) (2016-2032)
- Figure 136: Middle East & Africa Atropine Market Revenue (US$ Mn) Comparison by Country (2016-2032)
- Figure 137: Middle East & Africa Atropine Market Revenue (US$ Mn) Comparison by Formulation (2016-2032)
- Figure 138: Middle East & Africa Atropine Market Revenue (US$ Mn) Comparison by Indication (2016-2032)
- Figure 139: Middle East & Africa Atropine Market Revenue (US$ Mn) Comparison by End Users (2016-2032)
- Figure 140: Middle East & Africa Atropine Market Y-o-Y Growth Rate Comparison by Country (2016-2032)
- Figure 141: Middle East & Africa Atropine Market Y-o-Y Growth Rate Comparison by Formulation (2016-2032)
- Figure 142: Middle East & Africa Atropine Market Y-o-Y Growth Rate Comparison by Indication (2016-2032)
- Figure 143: Middle East & Africa Atropine Market Y-o-Y Growth Rate Comparison by End Users (2016-2032)
- Figure 144: Middle East & Africa Atropine Market Share Comparison by Country (2016-2032)
- Figure 145: Middle East & Africa Atropine Market Share Comparison by Formulation (2016-2032)
- Figure 146: Middle East & Africa Atropine Market Share Comparison by Indication (2016-2032)
- Figure 147: Middle East & Africa Atropine Market Share Comparison by End Users (2016-2032)
- List of Tables
- Table 1: Global Atropine Market Comparison by Formulation (2016-2032)
- Table 2: Global Atropine Market Comparison by Indication (2016-2032)
- Table 3: Global Atropine Market Comparison by End Users (2016-2032)
- Table 4: Global Atropine Market Revenue (US$ Mn) Comparison by Region (2016-2032)
- Table 5: Global Atropine Market Revenue (US$ Mn) (2016-2032)
- Table 6: Global Atropine Market Revenue (US$ Mn) Comparison by Region (2016-2032)
- Table 7: Global Atropine Market Revenue (US$ Mn) Comparison by Formulation (2016-2032)
- Table 8: Global Atropine Market Revenue (US$ Mn) Comparison by Indication (2016-2032)
- Table 9: Global Atropine Market Revenue (US$ Mn) Comparison by End Users (2016-2032)
- Table 10: Global Atropine Market Y-o-Y Growth Rate Comparison by Region (2016-2032)
- Table 11: Global Atropine Market Y-o-Y Growth Rate Comparison by Formulation (2016-2032)
- Table 12: Global Atropine Market Y-o-Y Growth Rate Comparison by Indication (2016-2032)
- Table 13: Global Atropine Market Y-o-Y Growth Rate Comparison by End Users (2016-2032)
- Table 14: Global Atropine Market Share Comparison by Region (2016-2032)
- Table 15: Global Atropine Market Share Comparison by Formulation (2016-2032)
- Table 16: Global Atropine Market Share Comparison by Indication (2016-2032)
- Table 17: Global Atropine Market Share Comparison by End Users (2016-2032)
- Table 18: North America Atropine Market Comparison by Indication (2016-2032)
- Table 19: North America Atropine Market Comparison by End Users (2016-2032)
- Table 20: North America Atropine Market Revenue (US$ Mn) Comparison by Country (2016-2032)
- Table 21: North America Atropine Market Revenue (US$ Mn) (2016-2032)
- Table 22: North America Atropine Market Revenue (US$ Mn) Comparison by Country (2016-2032)
- Table 23: North America Atropine Market Revenue (US$ Mn) Comparison by Formulation (2016-2032)
- Table 24: North America Atropine Market Revenue (US$ Mn) Comparison by Indication (2016-2032)
- Table 25: North America Atropine Market Revenue (US$ Mn) Comparison by End Users (2016-2032)
- Table 26: North America Atropine Market Y-o-Y Growth Rate Comparison by Country (2016-2032)
- Table 27: North America Atropine Market Y-o-Y Growth Rate Comparison by Formulation (2016-2032)
- Table 28: North America Atropine Market Y-o-Y Growth Rate Comparison by Indication (2016-2032)
- Table 29: North America Atropine Market Y-o-Y Growth Rate Comparison by End Users (2016-2032)
- Table 30: North America Atropine Market Share Comparison by Country (2016-2032)
- Table 31: North America Atropine Market Share Comparison by Formulation (2016-2032)
- Table 32: North America Atropine Market Share Comparison by Indication (2016-2032)
- Table 33: North America Atropine Market Share Comparison by End Users (2016-2032)
- Table 34: Western Europe Atropine Market Comparison by Formulation (2016-2032)
- Table 35: Western Europe Atropine Market Comparison by Indication (2016-2032)
- Table 36: Western Europe Atropine Market Comparison by End Users (2016-2032)
- Table 37: Western Europe Atropine Market Revenue (US$ Mn) Comparison by Country (2016-2032)
- Table 38: Western Europe Atropine Market Revenue (US$ Mn) (2016-2032)
- Table 39: Western Europe Atropine Market Revenue (US$ Mn) Comparison by Country (2016-2032)
- Table 40: Western Europe Atropine Market Revenue (US$ Mn) Comparison by Formulation (2016-2032)
- Table 41: Western Europe Atropine Market Revenue (US$ Mn) Comparison by Indication (2016-2032)
- Table 42: Western Europe Atropine Market Revenue (US$ Mn) Comparison by End Users (2016-2032)
- Table 43: Western Europe Atropine Market Y-o-Y Growth Rate Comparison by Country (2016-2032)
- Table 44: Western Europe Atropine Market Y-o-Y Growth Rate Comparison by Formulation (2016-2032)
- Table 45: Western Europe Atropine Market Y-o-Y Growth Rate Comparison by Indication (2016-2032)
- Table 46: Western Europe Atropine Market Y-o-Y Growth Rate Comparison by End Users (2016-2032)
- Table 47: Western Europe Atropine Market Share Comparison by Country (2016-2032)
- Table 48: Western Europe Atropine Market Share Comparison by Formulation (2016-2032)
- Table 49: Western Europe Atropine Market Share Comparison by Indication (2016-2032)
- Table 50: Western Europe Atropine Market Share Comparison by End Users (2016-2032)
- Table 51: Eastern Europe Atropine Market Comparison by Formulation (2016-2032)
- Table 52: Eastern Europe Atropine Market Comparison by Indication (2016-2032)
- Table 53: Eastern Europe Atropine Market Comparison by End Users (2016-2032)
- Table 54: Eastern Europe Atropine Market Revenue (US$ Mn) Comparison by Country (2016-2032)
- Table 55: Eastern Europe Atropine Market Revenue (US$ Mn) (2016-2032)
- Table 56: Eastern Europe Atropine Market Revenue (US$ Mn) Comparison by Country (2016-2032)
- Table 57: Eastern Europe Atropine Market Revenue (US$ Mn) Comparison by Formulation (2016-2032)
- Table 58: Eastern Europe Atropine Market Revenue (US$ Mn) Comparison by Indication (2016-2032)
- Table 59: Eastern Europe Atropine Market Revenue (US$ Mn) Comparison by End Users (2016-2032)
- Table 60: Eastern Europe Atropine Market Y-o-Y Growth Rate Comparison by Country (2016-2032)
- Table 61: Eastern Europe Atropine Market Y-o-Y Growth Rate Comparison by Formulation (2016-2032)
- Table 62: Eastern Europe Atropine Market Y-o-Y Growth Rate Comparison by Indication (2016-2032)
- Table 63: Eastern Europe Atropine Market Y-o-Y Growth Rate Comparison by End Users (2016-2032)
- Table 64: Eastern Europe Atropine Market Share Comparison by Country (2016-2032)
- Table 65: Eastern Europe Atropine Market Share Comparison by Formulation (2016-2032)
- Table 66: Eastern Europe Atropine Market Share Comparison by Indication (2016-2032)
- Table 67: Eastern Europe Atropine Market Share Comparison by End Users (2016-2032)
- Table 68: APAC Atropine Market Comparison by Formulation (2016-2032)
- Table 69: APAC Atropine Market Comparison by Indication (2016-2032)
- Table 70: APAC Atropine Market Comparison by End Users (2016-2032)
- Table 71: APAC Atropine Market Revenue (US$ Mn) Comparison by Country (2016-2032)
- Table 72: APAC Atropine Market Revenue (US$ Mn) (2016-2032)
- Table 73: APAC Atropine Market Revenue (US$ Mn) Comparison by Country (2016-2032)
- Table 74: APAC Atropine Market Revenue (US$ Mn) Comparison by Formulation (2016-2032)
- Table 75: APAC Atropine Market Revenue (US$ Mn) Comparison by Indication (2016-2032)
- Table 76: APAC Atropine Market Revenue (US$ Mn) Comparison by End Users (2016-2032)
- Table 77: APAC Atropine Market Y-o-Y Growth Rate Comparison by Country (2016-2032)
- Table 78: APAC Atropine Market Y-o-Y Growth Rate Comparison by Formulation (2016-2032)
- Table 79: APAC Atropine Market Y-o-Y Growth Rate Comparison by Indication (2016-2032)
- Table 80: APAC Atropine Market Y-o-Y Growth Rate Comparison by End Users (2016-2032)
- Table 81: APAC Atropine Market Share Comparison by Country (2016-2032)
- Table 82: APAC Atropine Market Share Comparison by Formulation (2016-2032)
- Table 83: APAC Atropine Market Share Comparison by Indication (2016-2032)
- Table 84: APAC Atropine Market Share Comparison by End Users (2016-2032)
- Table 85: Latin America Atropine Market Comparison by Formulation (2016-2032)
- Table 86: Latin America Atropine Market Comparison by Indication (2016-2032)
- Table 87: Latin America Atropine Market Comparison by End Users (2016-2032)
- Table 88: Latin America Atropine Market Revenue (US$ Mn) Comparison by Country (2016-2032)
- Table 89: Latin America Atropine Market Revenue (US$ Mn) (2016-2032)
- Table 90: Latin America Atropine Market Revenue (US$ Mn) Comparison by Country (2016-2032)
- Table 91: Latin America Atropine Market Revenue (US$ Mn) Comparison by Formulation (2016-2032)
- Table 92: Latin America Atropine Market Revenue (US$ Mn) Comparison by Indication (2016-2032)
- Table 93: Latin America Atropine Market Revenue (US$ Mn) Comparison by End Users (2016-2032)
- Table 94: Latin America Atropine Market Y-o-Y Growth Rate Comparison by Country (2016-2032)
- Table 95: Latin America Atropine Market Y-o-Y Growth Rate Comparison by Formulation (2016-2032)
- Table 96: Latin America Atropine Market Y-o-Y Growth Rate Comparison by Indication (2016-2032)
- Table 97: Latin America Atropine Market Y-o-Y Growth Rate Comparison by End Users (2016-2032)
- Table 98: Latin America Atropine Market Share Comparison by Country (2016-2032)
- Table 99: Latin America Atropine Market Share Comparison by Formulation (2016-2032)
- Table 100: Latin America Atropine Market Share Comparison by Indication (2016-2032)
- Table 101: Latin America Atropine Market Share Comparison by End Users (2016-2032)
- Table 102: Middle East & Africa Atropine Market Comparison by Formulation (2016-2032)
- Table 103: Middle East & Africa Atropine Market Comparison by Indication (2016-2032)
- Table 104: Middle East & Africa Atropine Market Comparison by End Users (2016-2032)
- Table 105: Middle East & Africa Atropine Market Revenue (US$ Mn) Comparison by Country (2016-2032)
- Table 106: Middle East & Africa Atropine Market Revenue (US$ Mn) (2016-2032)
- Table 107: Middle East & Africa Atropine Market Revenue (US$ Mn) Comparison by Country (2016-2032)
- Table 108: Middle East & Africa Atropine Market Revenue (US$ Mn) Comparison by Formulation (2016-2032)
- Table 109: Middle East & Africa Atropine Market Revenue (US$ Mn) Comparison by Indication (2016-2032)
- Table 110: Middle East & Africa Atropine Market Revenue (US$ Mn) Comparison by End Users (2016-2032)
- Table 111: Middle East & Africa Atropine Market Y-o-Y Growth Rate Comparison by Country (2016-2032)
- Table 112: Middle East & Africa Atropine Market Y-o-Y Growth Rate Comparison by Formulation (2016-2032)
- Table 113: Middle East & Africa Atropine Market Y-o-Y Growth Rate Comparison by Indication (2016-2032)
- Table 114: Middle East & Africa Atropine Market Y-o-Y Growth Rate Comparison by End Users (2016-2032)
- Table 115: Middle East & Africa Atropine Market Share Comparison by Country (2016-2032)
- Table 116: Middle East & Africa Atropine Market Share Comparison by Formulation (2016-2032)
- Table 117: Middle East & Africa Atropine Market Share Comparison by Indication (2016-2032)
- Table 118: Middle East & Africa Atropine Market Share Comparison by End Users (2016-2032)
- 1. Executive Summary
-
- AdvaCare Pharma
- Sydnexis
- SUNY College of Optometry
- Abbott Laboratories
- Amgen Inc
- Eli Lilly and Company
- Bristol-Myers Squibb Company
- Bayer AG
- Takeda Pharmaceuticals
- Zoetis Inc
Our Clients


View Our Licence Options
