
Asia Pacific Travel Insurance Market Report By Coverage Type (Single-Trip Travel Insurance, Annual Multi-Trip Travel Insurance), By Distribution Channel (Insurance Companies, Insurance Agents, Insurance Brokers, Banks, Online Aggregators), By End User (Leisure Travelers, Business Travelers), By Insurance Cover, By Region and Companies - Industry Segment Outlook, Market Assessment, Competition Scenario, Trends and Forecast 2024-2033
-
23590
-
March 2024
-
179
-


-
This report was compiled by Research Team Research team of over 50 passionate professionals leverages advanced research methodologies and analytical expertise to deliver insightful, data-driven market intelligence that empowers businesses across diverse industries to make strategic, well-informed Correspondence Research Team Linkedin | Detailed Market research Methodology Our methodology involves a mix of primary research, including interviews with leading mental health experts, and secondary research from reputable medical journals and databases. View Detailed Methodology Page
-
Quick Navigation
Report Overview
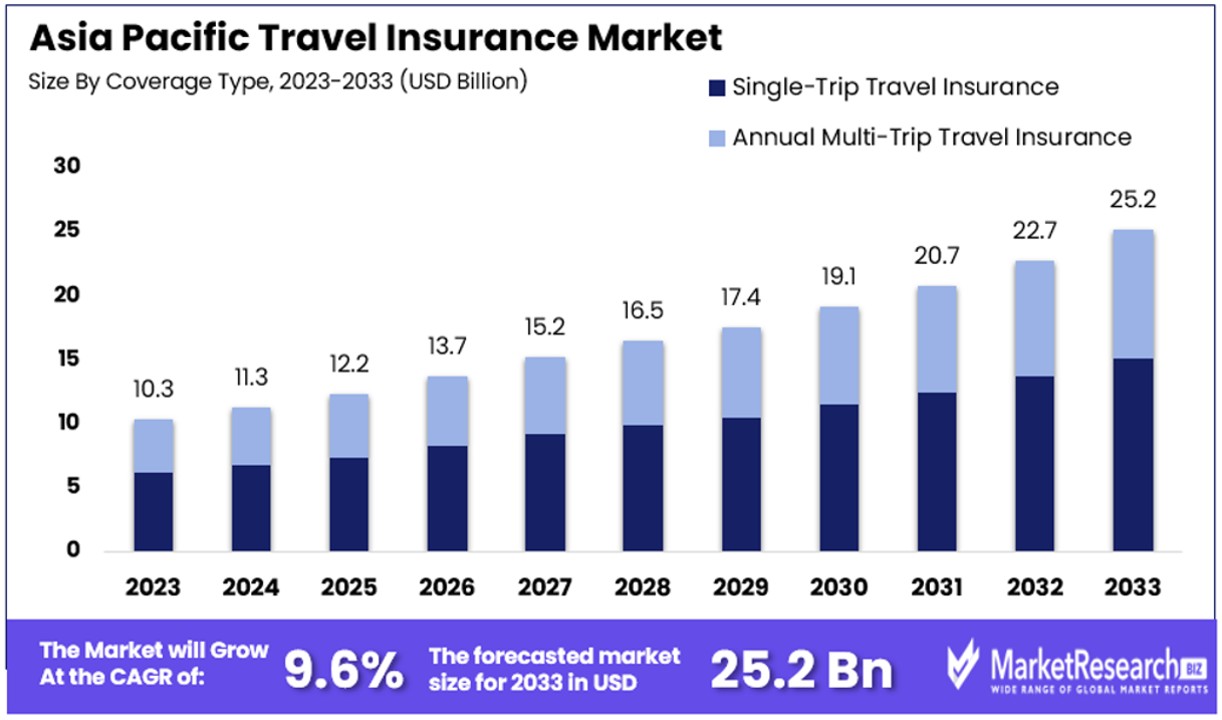
The Asia Pacific Travel Insurance Market size is expected to be worth around USD 25.2 Billion by 2033, from USD 10.3 Billion in 2023, growing at a CAGR of 9.60% during the forecast period from 2024 to 2033.
The surge in demand for travel insurance plans and rise in frequency for travelling are some of the main key driving factors for the Asia Pacific travel insurance.
Asia pacific travel insurance defines as the type of insurance coverage created to shield travellers against unpredicted events and challenges at the time of journey in the Asia pacific regions. This insurance generally offers coverage for a range of incidents comprises of trip cancellations, medical emergencies, lost or delayed baggage and travel related accidents.
 Policies can vary in scope and coverages restricts, but they basically provide monetory reimbursement or support for cost incurred due to covered evets during travelling. Asia pacific travel insurance focus to offer travellers with peace of mind and financial safeguarding by permitting them to enjoy their trips without worrying about capable mishaps and emergencies. It is particularly important for international travellers discovering multiple destinations across Asia pacific by providing support and assistance in steering unacquainted surroundings and addressing unexpected risks that may arise at the time of their travels.
According to an article published by Travel daily news in November 2023, highlights that TATA AIG associates with Air India to provide travel insurance to its passengers. The aim is to improve Air India passengers journey, thereby permitting travellers to enjoy their travels. Many customers can buy travel insurance while booking their flights through Air India’s different booking platforms.
According to an article published by Insurance business in March 2023, highlights that Cost Friendly Malaysian carrier MYAirline has secured Zurich Malaysia as its official travel insurance providers in a bid to ease the method of getting travel protection for its passengers.
The new partnership will witness Zurich cover all present and future routes for the Malaysian airliners. The present route network of MYAirline includes 8 domestic destinations, and it assumes 30 flights a day. In its second month of operations in January this year, the airline hovered about 5,000 daily passengers.
Asia Pacific travel insurance offers unique advantages like detailed medical coverages, that includes emergency evacuation, specifically beneficial in remote or unfamiliar destinations. It also provides protection against trip cancellations, deferrals and unpredicted events by making financial security and peace of mind for travellers discovering multiple regions in the Asia pacific. The demand for the Asia pacific travel insurance will increase due to its requirement in the travel industry that will help in market expansion in the coming years.
Key Takeaways
- Market Value: The Asia Pacific Travel Insurance Market is anticipated to reach a substantial value of around USD 25.2 Billion by 2033, exhibiting significant growth from its 2023 value, with a robust CAGR during the forecast period from 2024 to 2033.
- Dominant Segments:
- Coverage Type Analysis: Single-Trip Travel Insurance dominates the market with a commanding 60% market share, driven by the region's travel behaviors favoring distinct journeys and the convenience of single-trip coverage.
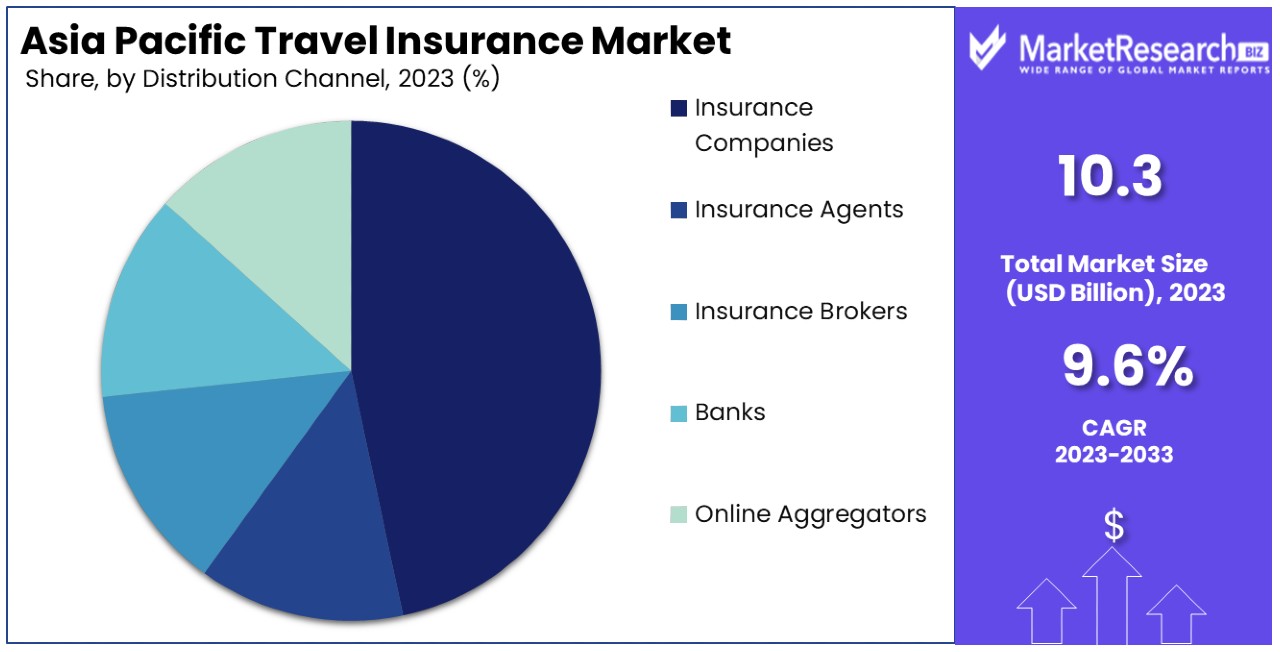
- Distribution Channel Analysis: Insurance Companies lead in the distribution channel, offering comprehensive and customizable insurance products directly to customers, with personalized service and tailored coverage options.
- End User Analysis: Leisure Travelers dominate the market, contributing significantly to growth, driven by rising disposable income and the desire for travel experiences, necessitating comprehensive coverage for peace of mind.
- Insurance Cover Analysis: Medical Expenses coverage emerges as a priority for travelers, reflecting concerns over healthcare costs abroad and heightened awareness due to the COVID-19 pandemic.
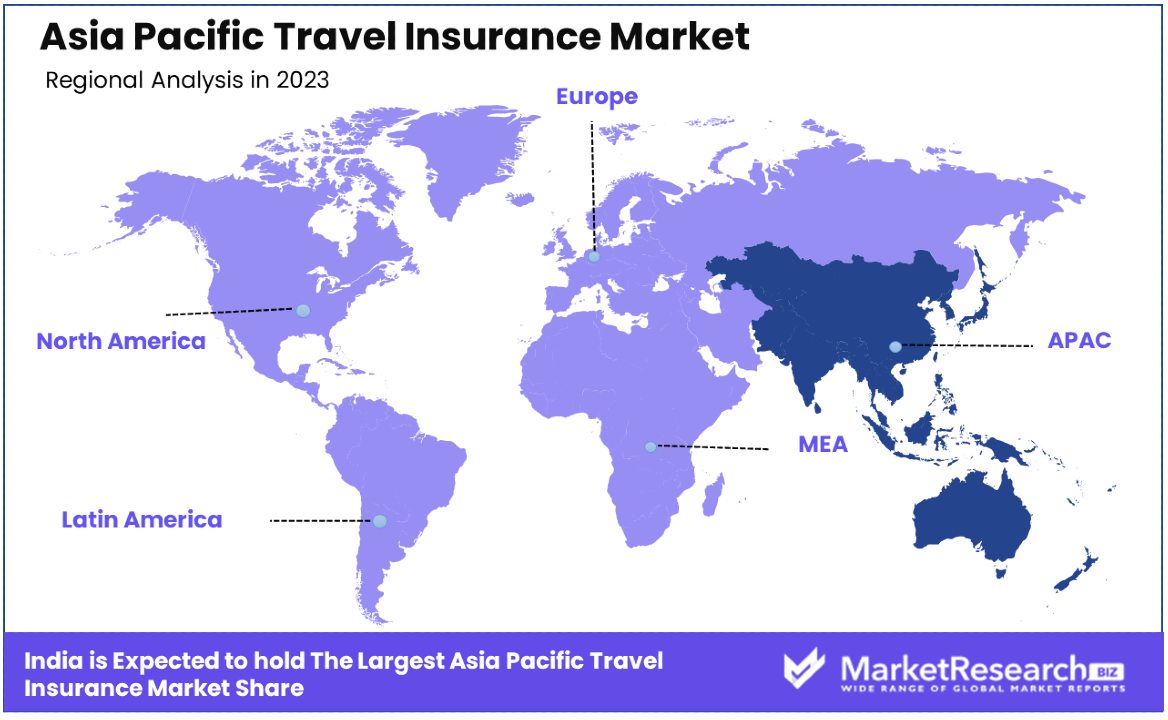
- Regional Analysis: India dominates the market with a 29% market share, driven by factors like outbound tourism and health and safety concerns among travelers. China also plays a significant role, with a robust outbound tourism sector and a high adoption rate of travel insurance products.
- Analyst Viewpoint: The market's growth is propelled by factors like rising disposable income, changing travel behaviors, and increased awareness of travel-related risks. Growth opportunities lie in catering to diverse traveler needs through innovative insurance products, leveraging digital platforms for distribution, and addressing emerging risks such as health concerns and travel disruptions.
Driving Factors
Rising Middle Class and Disposable Incomes Drive Market Growth
The burgeoning middle class and escalating disposable incomes in the Asia Pacific region are pivotal factors fueling the expansion of the travel insurance market. Notably, countries like China and India are experiencing remarkable growth in consumer spending power, with China's per capita disposable income soaring by approximately 700% from 2000 to 2020. India is on a similar trajectory, poised to emerge as the world's third-largest consumer market by 2027, with household spending anticipated to surpass $3 trillion, driven by an annual compounded growth rate of 14.6% in disposable income.
This economic prosperity enables more individuals and families to allocate funds for leisure activities, including travel, inherently increasing the demand for travel insurance products. As travel becomes more accessible to a broader section of the population, the need for financial protection against travel-related risks grows, propelling the travel insurance market forward. This surge in demand is further amplified by the World Travel & Tourism Council's forecast, which highlights significant growth in travel and tourism in the region, attributable to rising disposable incomes.
Infrastructure Development Enables Market Expansion
Governments across the Asia Pacific region are heavily investing in transportation infrastructure, such as airports and high-speed rail systems, enhancing connectivity and making travel more accessible. Initiatives like the ASEAN Framework Agreement on the Facilitation of Cross Border Transport of Passengers by Road Vehicles aim to simplify the cross-border movement of tourists, fostering over-land travel between ASEAN states.
This infrastructural enhancement not only boosts the region's attractiveness as a travel destination but also supports the growth of the travel insurance market by increasing the volume of travelers. Improved accessibility to various destinations within the Asia Pacific encourages more people to explore the region, necessitating the protection offered by travel insurance against potential travel inconveniences and emergencies.
Attractive Destinations Cultivate Market Opportunities
The Asia Pacific's diverse array of attractive destinations, from Southeast Asia's beach resorts to the Himalayan treks and Australian road trips, significantly contributes to the growth of the travel insurance market. This region's allure is amplified by rapid hotel construction and a burgeoning interest in niche tourism segments like wellness and nature trips like glamping.
For instance, Bali's recognition as a top wellness tourism destination by the Indonesian Ministry of Tourism and Creative Economy exemplifies how specific attractions can draw global tourists. The increasing influx of tourists, driven by the region's appeal, directly impacts the demand for travel insurance, as travelers seek to safeguard their journeys against unforeseen events. The synergy between the region's tourism appeal and the protective assurance offered by travel insurance products creates a conducive environment for market growth, underscoring the significance of destination attractiveness in driving the travel insurance market.
Restraining Factors
Health and Safety Concerns Restrain Market Growth
Health and safety concerns, including the impact of disease outbreaks such as COVID-19, natural disasters, political instability, high crime rates, and poor emergency services, significantly deter travelers, limiting the growth of the Asia Pacific Travel Insurance Market. The region experienced a sharp decline in international tourist arrivals, plummeting between 70% to 90% due to these factors.
Although there is evidence of recovery, with the Asia and the Pacific region reaching 62% of pre-pandemic levels, the rebound has been uneven across subregions. South Asia has shown a robust recovery at 95% of pre-pandemic levels, while North-East Asia lags behind at approximately 50%. This disparity highlights the varying degrees to which health and safety concerns impact travel decisions and insurance purchases, underlining the importance of addressing these issues to fully unlock the market's potential.
Regional Tensions Impede Market Expansion
Political conflicts and territorial disputes within the Asia Pacific region, such as those between the two Koreas and in the South China Sea, further complicate the travel landscape, impeding market growth. These tensions create uncertainty and perceived risks among travelers, affecting their willingness to visit or insure trips within certain areas.
The impact of regional tensions not only affects the direct destinations involved but also influences the overall perception of safety and stability in the Asia Pacific, making potential travelers more hesitant to explore the region. As such, political stability and the resolution of conflicts are crucial for the recovery and expansion of the travel insurance market in this diverse and culturally rich region.
Coverage Type Analysis
Single-Trip Travel Insurance Dominates with 60% Market Share
The Asia Pacific Travel Insurance Market has seen significant growth, with Single-Trip Travel Insurance emerging as the dominant sub-segment, holding a 60% market share. This dominance can be attributed to the unique travel behaviors and preferences observed within the region, where travelers often opt for single, distinct journeys over multiple trips within a year. Factors such as varied destination offerings, from short domestic excursions to international visits, and the convenience of purchasing single-trip insurance tailored to specific travel plans contribute to its widespread popularity.
Single-Trip Travel Insurance's prominence is further supported by the rising middle class in countries like China and India, where increased disposable incomes have led to a surge in first-time and infrequent travelers who favor single-trip coverage for its simplicity and cost-effectiveness. Moreover, the segment benefits from the digital revolution, with online platforms making it easier for travelers to purchase insurance on a per-trip basis, often influenced by last-minute deals and spontaneous travel decisions.
While Single-Trip Travel Insurance holds the lion's share, Annual Multi-Trip Travel Insurance remains relevant, particularly among frequent business travelers and those with family abroad. This segment caters to a niche yet steady customer base that values the convenience and cost savings associated with insuring multiple trips under one policy. Despite its smaller market share, this sub-segment complements the overall growth of the travel insurance market by addressing the diverse needs of Asia Pacific's vast traveler demographic.
Distribution Channel Analysis
Insurance Companies Lead in Distribution Channel
In the distribution of travel insurance, Insurance Companies emerge as the leading channel, favored for their direct offering of comprehensive and customizable insurance products. This dominance is facilitated by the trusted reputation and extensive reach of established insurance firms, which have historically been the go-to source for travel insurance purchases. The direct engagement between insurers and customers allows for personalized service, where travelers can have their coverage tailored to meet specific needs, including adventure sports coverage, high-value item insurance, and medical emergencies.
Insurance Agents, Brokers, Banks, and Online Aggregators also play vital roles in the market's ecosystem, catering to different customer preferences and buying behaviors. Insurance Agents and Brokers are crucial for providing personalized advice and facilitating the comparison of different policies, while Banks offer travel insurance as a value-added service to their account holders or credit card users. Online Aggregators have gained traction by offering a platform for quick comparison across multiple insurers, appealing to tech-savvy travelers looking for convenience and the best deals.
End User Analysis
Leisure Travelers Dominate the Market
In the Asia Pacific region, Leisure Travelers emerge as the dominant end-user segment in the travel insurance market. This group significantly contributes to the market's growth, driven by the increasing disposable income and the rising middle class in countries like China and India. The desire for travel experiences, from exploring local cultures to international vacations, has surged, making travel insurance a necessary safeguard for unforeseen circumstances. Leisure travelers prioritize comprehensive coverage that offers peace of mind, covering aspects from trip cancellations to medical emergencies, reflecting the diverse needs and risks associated with personal travel.
Business Travelers, while a smaller segment, play a crucial role in the market by requiring specific travel insurance products tailored to their needs, such as coverage for lost business equipment or last-minute trip changes. The business segment's demand is consistent, fueled by the globalization of companies and the necessity for employees to travel for work, training, and conferences.
Insurance Cover Analysis
Medical Expenses Coverage Is A Priority for Travelers
Medical Expenses coverage stands out as the most sought-after insurance cover within the Asia Pacific Travel Insurance Market. This priority reflects travelers' concerns over the high costs of healthcare abroad and the potential financial impact of medical emergencies during their trips. The COVID-19 pandemic has heightened awareness of health risks while traveling, further emphasizing the importance of medical coverage.
Other insurance covers, like Trip Cancellation/Interruption, Personal Accident, Baggage Loss/Delay, and Emergency Evacuation/Repatriation, also contribute to the market's dynamics. Each plays a vital role in catering to the comprehensive needs of travelers, ensuring protection against a wide range of travel-related incidents. Trip Cancellation/Interruption coverage is particularly valued for its protection against the unpredictability of travel plans, while Personal Accident and Baggage Loss/Delay covers provide added security for personal safety and belongings. Emergency Evacuation/Repatriation is critical for ensuring travelers can return home safely in extreme circumstances.
Key Market Segments
By Coverage Type
- Single-Trip Travel Insurance
- Annual Multi-Trip Travel Insurance
By Distribution Channel
- Insurance Companies
- Insurance Agents
- Insurance Brokers
- Banks
- Online Aggregators
By End User
- Leisure Travelers
- Business Travelers
By Insurance Cover
- Medical Expenses
- Trip Cancellation/Interruption
- Personal Accident
- Baggage Loss/Delay
- Emergency Evacuation/Repatriation
Growth Opportunities
Unique Experiences Offer Growth Opportunity
The pursuit of unique and authentic local experiences presents a significant growth opportunity within the Asia Pacific Travel Insurance Market. Travelers are increasingly seeking "transformational" travel experiences that go beyond traditional tourist attractions, favoring immersive activities that allow them to engage with local cultures, cuisines, and environments. Culinary tours in Tokyo, cooking classes in Chiang Mai, or eco-adventure trips in Australia and New Zealand cater to this demand, offering personalized experiences that resonate with modern travelers' desire for authenticity and adventure.
These unique experiences not only attract a diverse range of travelers but also encourage longer stays and higher spending, directly impacting the demand for travel insurance products tailored to these specific activities. Insurance providers that recognize and adapt to this trend by offering customized coverage for unique travel experiences are well-positioned to capture a growing segment of the market, driving expansion and differentiation in a competitive landscape.
Digital Transformation Enables Market Expansion
Investing in digital transformation technologies such as analytics, cloud services, AI, and personalized digital engagement channels is enabling significant growth opportunities in the Asia Pacific Travel Insurance Market. Travel brands in the region, including luxury hotel chains like Mandarin Oriental, are leveraging these technologies to enhance customer experiences, from smart chatbots that provide instant assistance to omnichannel solutions that ensure a seamless customer journey across digital and physical touchpoints.
This digital shift not only improves operational efficiency and customer satisfaction but also opens up new avenues for travel insurance providers to engage with customers, personalize offerings, and streamline the insurance purchasing process. By integrating digital technologies like generative ai into their operations, insurance companies can better understand customer preferences, tailor their products to meet the evolving needs of digital-savvy travelers, and ultimately, expand their market presence in the Asia Pacific region.
Trending Factors
Regulatory Changes and Foreign Investment Opportunities Are Trending Factors
Regulatory changes and foreign investment opportunities are significantly influencing the Asia Pacific Travel Insurance Market, marking them as key trending factors. Countries across the region, like Singapore, are updating their regulations, easing foreign ownership restrictions in the insurance sector. This shift is a strategic move to attract international insurers, fostering a more competitive and diverse market landscape. Such regulatory relaxation enables global insurance players to enter or expand their footprint in the Asia Pacific market, either by setting up new operations or through mergers and acquisitions with domestic companies.
This trend not only diversifies the travel insurance offerings available to consumers but also enhances the innovation and financial strength of the market. International insurers bring in global best practices, advanced technology, and a wealth of experience in customizing travel insurance products, which can significantly improve the value proposition for travelers in the Asia Pacific. Additionally, the inflow of foreign investments strengthens the financial capabilities of local insurers, enabling them to offer more comprehensive coverage options and invest in customer service and digital transformation initiatives.
Regional Analysis
India Dominates with 29% Market Share
India's commanding 29% share of the Asia Pacific Travel Insurance Market is a reflection of its burgeoning travel industry, driven by a growing middle class, increased international and domestic travel, and a rising awareness of travel insurance benefits. Key factors contributing to this dominance include economic growth, a spike in outbound tourism, and government initiatives promoting travel insurance for securing visas and safeguarding against unforeseen travel and medical expenses abroad.
The regional dynamics of India's market are influenced by its vast and diverse population, showing a preference for exploring both domestic and international destinations. Digitalization and the proliferation of online travel and insurance platforms have also simplified the process of purchasing travel insurance, making it more accessible to a wider audience.
Forecasting into the future, India's influence in the Asia Pacific Travel Insurance Market is poised to grow, driven by increasing disposable incomes, digital penetration, and a growing inclination towards secure and well-planned travel experiences. The region's market dynamics, characterized by a blend of traditional and online sales channels, are expected to evolve with technology playing a pivotal role in shaping consumer behavior and preferences.
Regional Market Overview:
- China is a significant player in the market, with a robust outbound tourism sector and a high adoption rate of travel insurance products, driven by health and safety concerns among travelers.
- Southeast Asia, including countries like Thailand, Indonesia, and Singapore, shows varied growth rates, with markets expanding due to a surge in regional travel and tourism initiatives.
- Australia and New Zealand exhibit a mature market with high penetration rates, where comprehensive coverages are preferred due to long-haul travel tendencies.
- Pacific Islands and Central Asia regions, though smaller in market share, present unique opportunities for growth, particularly in niche travel and adventure tourism insurance products.
Key Regions and Countries
- East Asia
- China
- Japan
- South Korea
- Taiwan
- Southeast Asia
- Thailand
- Indonesia
- Malaysia
- Singapore
- Vietnam
- Philippines
- Others
- South Asia
- India
- Bangladesh
- Sri Lanka
- Nepal
- Pakistan
- Australia and New Zealand
- Pacific Islands
- Fiji
- Papua New Guinea
- Samoa
- Others
- Central Asia
- Kazakhstan
- Uzbekistan
- Kyrgyzstan
- Tajikistan
Key Players Analysis
In the Asia Pacific Travel Insurance Market, companies such as Nippon Life Insurance Company, Life Insurance Corporation of India, and China Life Insurance Company are major players contributing to the regional market's dynamics. These companies, along with others like Hong Leong Assurance Berhad and Samsung Life Insurance, have been pivotal in adapting their insurance policies to meet the growing demand for tourism-related products.
The rise in tourism, especially in destinations like Hong Kong and throughout Asia Pacific, has driven an increased need for comprehensive travel insurance, pushing these companies to innovate and expand their travel insurance market share.
Muang Thai Life Assurance Public Co. Ltd., Sun Life of Canada (Philippines) Inc, and American International Group Inc. are also key in shaping the travel insurance industry, offering tailored solutions that cater to the diverse needs of travelers. With the annual growth rate of the travel insurance sector mirroring the rise in tourism across Asia Pacific, these insurers have focused on leveraging technological advancements to enhance customer experience and ease of access to their products.
Insurance Brokers and firms like Berkshire Hathaway Specialty Insurance, China Pacific Insurance Co., Ltd., and Ping An Insurance Company of China have capitalized on this trend by offering innovative products that address specific traveler concerns and preferences. Moreover, international players such as Zurich Insurance Group Ltd, HanseMerkur Insurance Group, and Allianz Global Assistance have expanded their presence in the Asia Pacific region, bringing global expertise and comprehensive coverage options to local markets.
This concentration of insurance giants within the Asia Pacific not only fuels competition but also fosters collaboration, with companies like Generali Group and SOMPO Holdings, Inc., enhancing their offerings to capture a larger share of the travel insurance market. The industry's evolution is further supported by niche players such as Arch Capital Group Ltd., Corners Inc, Wingman Insurance, and Rock Insurance Group, who contribute to the market's diversity with specialized policies and services.
Despite being geographically distant from North America, the influence of global trends and the interconnected nature of the travel industry mean that developments in one region can have significant implications across the globe. As such, the Asia Pacific travel insurance market continues to evolve, driven by a combination of local demand, international travel trends, and the continuous pursuit of innovation by key market players.
Market Key Players
- Nippon Life Insurance Company
- Life Insurance Corporation of India
- China Life Insurance Company
- Hong Leong Assurance Berhad
- Samsung Life Insurance
- Muang Thai Life Assurance Public Co. Ltd.
- Sun Life of Canada (Philippines) Inc
- American International Group Inc.
- Berkshire Hathaway Specialty Insurance
- China Pacific Insurance Co., Ltd.
- Ping An Insurance Company of China
- Zurich Insurance Group Ltd
- HanseMerkur Insurance Group
- Allianz Group
- Generali Group
- Assicurazioni Generali Group
- SOMPO Holdings, Inc.
- Arch Capital Group Ltd.
- Corners Inc
- Wingman Insurance
- Rock Insurance Group
Recent Developments
- On February 2024, Blink Parametric and Zurich Insurance in Asia Pacific announced the integration of Blink Parametric’s real-time flight delay assistance and claims solution with the Zurich Edge Platform as part of their regionwide digital strategy.
- On January 2024, Allianz Partners and bolttech announced a strategic partnership to provide embedded device and appliance protection insurance across Asia Pacific (APAC) and the United States.
- On June 2023, Europ Assistance expanded its presence in the Asia-Pacific region through the acquisition of several assistance businesses from AXA Partners.
Report Scope
Report Features Description Market Value (2023) USD 10.3 Billion Forecast Revenue (2033) USD 25.2 Billion CAGR (2024-2033) 9.60% Base Year for Estimation 2023 Historic Period 2018-2023 Forecast Period 2024-2033 Report Coverage Revenue Forecast, Market Dynamics, Competitive Landscape, Recent Developments Segments Covered By Coverage Type (Single-Trip Travel Insurance, Annual Multi-Trip Travel Insurance), By Distribution Channel (Insurance Companies, Insurance Agents, Insurance Brokers, Banks, Online Aggregators), By End User (Leisure Travelers, Business Travelers), By Insurance Cover (Medical Expenses, Trip Cancellation/Interruption, Personal Accident, Baggage Loss/Delay, Emergency Evacuation/Repatriation) Regional Analysis East Asia: China, Japan, South Korea, Taiwan;
Southeast Asia: Thailand, Indonesia, Malaysia, Singapore, Vietnam, Philippines, Others;
South Asia: India, Bangladesh, Sri Lanka, Nepal, Pakistan;
Australia and New Zealand;
Pacific Islands: Fiji, Papua New Guinea, Samoa, Others;
Central Asia: Kazakhstan, Uzbekistan, Kyrgyzstan, TajikistanCompetitive Landscape Nippon Life Insurance Company, Life Insurance Corporation of India, China Life Insurance Company, Hong Leong Assurance Berhad, Samsung Life Insurance, Muang Thai Life Assurance Public Co. Ltd., Sun Life of Canada (Philippines) Inc, American International Group Inc., Berkshire Hathaway Specialty Insurance, China Pacific Insurance Co., Ltd., Ping An Insurance Company of China, Zurich Insurance Group Ltd, HanseMerkur Insurance Group, Allianz Global Assistance, Generali Group, Assicurazioni Generali Group, SOMPO Holdings, Inc., Arch Capital Group Ltd., Corners Inc, Wingman Insurance, Rock Insurance Group Customization Scope Customization for segments, region/country-level will be provided. Moreover, additional customization can be done based on the requirements. Purchase Options We have three licenses to opt for: Single User License, Multi-User License (Up to 5 Users), Corporate Use License (Unlimited User and Printable PDF) -
- 1. Executive Summary
- 1.1. Definition
- 1.2. Taxonomy
- 1.3. Research Scope
- 1.4. Key Analysis
- 1.5. Key Findings by Major Segments
- 1.6. Top strategies by Major Players
- 2. Asia Pacific Travel Insurance Market Overview
- 2.1. Asia Pacific Travel Insurance Market Dynamics
- 2.1.1. Drivers
- 2.1.2. Opportunities
- 2.1.3. Restraints
- 2.1.4. Challenges
- 2.2. Macro-economic Factors
- 2.3. Regulatory Framework
- 2.4. Market Investment Feasibility Index
- 2.5. PEST Analysis
- 2.6. PORTER’S Five Force Analysis
- 2.7. Drivers & Restraints Impact Analysis
- 2.8. Industry Chain Analysis
- 2.9. Cost Structure Analysis
- 2.10. Marketing Strategy
- 2.11. Russia-Ukraine War Impact Analysis
- 2.12. Opportunity Map Analysis
- 2.13. Market Competition Scenario Analysis
- 2.14. Product Life Cycle Analysis
- 2.15. Opportunity Orbits
- 2.16. Manufacturer Intensity Map
- 2.17. Major Companies sales by Value & Volume
- 2.1. Asia Pacific Travel Insurance Market Dynamics
- 3. Asia Pacific Travel Insurance Market Analysis, Opportunity and Forecast, 2016-2032
- 3.1. Asia Pacific Travel Insurance Market Analysis, 2016-2021
- 3.2. Asia Pacific Travel Insurance Market Opportunity and Forecast, 2023-2032
- 3.3. Asia Pacific Travel Insurance Market Analysis, Opportunity and Forecast, By Coverage Type, 2016-2032
- 3.3.1. Asia Pacific Travel Insurance Market Analysis by Coverage Type: Introduction
- 3.3.2. Market Size Absolute $ Opportunity Analysis and Forecast, By Coverage Type, 2016-2032
- 3.3.3. Single-Trip Travel Insurance
- 3.3.4. Annual Multi-Trip Travel Insurance
- 3.4. Asia Pacific Travel Insurance Market Analysis, Opportunity and Forecast, By Distribution Channel, 2016-2032
- 3.4.1. Asia Pacific Travel Insurance Market Analysis by Distribution Channel: Introduction
- 3.4.2. Market Size Absolute $ Opportunity Analysis and Forecast, By Distribution Channel, 2016-2032
- 3.4.3. Insurance Companies
- 3.4.4. Insurance Agents
- 3.4.5. Insurance Brokers
- 3.4.6. Banks
- 3.4.7. Online Aggregators
- 3.5. Asia Pacific Travel Insurance Market Analysis, Opportunity and Forecast, By End User, 2016-2032
- 3.5.1. Asia Pacific Travel Insurance Market Analysis by End User: Introduction
- 3.5.2. Market Size Absolute $ Opportunity Analysis and Forecast, By End User, 2016-2032
- 3.5.3. Leisure Travelers
- 3.5.4. Business Travelers
- 3.6. Asia Pacific Travel Insurance Market Analysis, Opportunity and Forecast, By Insurance Cover, 2016-2032
- 3.6.1. Asia Pacific Travel Insurance Market Analysis by Insurance Cover: Introduction
- 3.6.2. Market Size Absolute $ Opportunity Analysis and Forecast, By Insurance Cover, 2016-2032
- 3.6.3. Medical Expenses
- 3.6.4. Trip Cancellation/Interruption
- 3.6.5. Personal Accident
- 3.6.6. Baggage Loss/Delay
- 3.6.7. Emergency Evacuation/Repatriation
- 4. North America Asia Pacific Travel Insurance Market Analysis, Opportunity and Forecast, 2016-2032
- 4.1. North America Asia Pacific Travel Insurance Market Analysis, 2016-2021
- 4.2. North America Asia Pacific Travel Insurance Market Opportunity and Forecast, 2023-2032
- 4.3. North America Asia Pacific Travel Insurance Market Analysis, Opportunity and Forecast, By Coverage Type, 2016-2032
- 4.3.1. North America Asia Pacific Travel Insurance Market Analysis by Coverage Type: Introduction
- 4.3.2. Market Size Absolute $ Opportunity Analysis and Forecast, By Coverage Type, 2016-2032
- 4.3.3. Single-Trip Travel Insurance
- 4.3.4. Annual Multi-Trip Travel Insurance
- 4.4. North America Asia Pacific Travel Insurance Market Analysis, Opportunity and Forecast, By Distribution Channel, 2016-2032
- 4.4.1. North America Asia Pacific Travel Insurance Market Analysis by Distribution Channel: Introduction
- 4.4.2. Market Size Absolute $ Opportunity Analysis and Forecast, By Distribution Channel, 2016-2032
- 4.4.3. Insurance Companies
- 4.4.4. Insurance Agents
- 4.4.5. Insurance Brokers
- 4.4.6. Banks
- 4.4.7. Online Aggregators
- 4.5. North America Asia Pacific Travel Insurance Market Analysis, Opportunity and Forecast, By End User, 2016-2032
- 4.5.1. North America Asia Pacific Travel Insurance Market Analysis by End User: Introduction
- 4.5.2. Market Size Absolute $ Opportunity Analysis and Forecast, By End User, 2016-2032
- 4.5.3. Leisure Travelers
- 4.5.4. Business Travelers
- 4.6. North America Asia Pacific Travel Insurance Market Analysis, Opportunity and Forecast, By Insurance Cover, 2016-2032
- 4.6.1. North America Asia Pacific Travel Insurance Market Analysis by Insurance Cover: Introduction
- 4.6.2. Market Size Absolute $ Opportunity Analysis and Forecast, By Insurance Cover, 2016-2032
- 4.6.3. Medical Expenses
- 4.6.4. Trip Cancellation/Interruption
- 4.6.5. Personal Accident
- 4.6.6. Baggage Loss/Delay
- 4.6.7. Emergency Evacuation/Repatriation
- 4.7. North America Asia Pacific Travel Insurance Market Analysis, Opportunity and Forecast, By Country , 2016-2032
- 4.7.1. North America Asia Pacific Travel Insurance Market Analysis by Country : Introduction
- 4.7.2. Market Size Absolute $ Opportunity Analysis and Forecast, Country , 2016-2032
- 4.7.2.1. The US
- 4.7.2.2. Canada
- 4.7.2.3. Mexico
- 5. Western Europe Asia Pacific Travel Insurance Market Analysis, Opportunity and Forecast, 2016-2032
- 5.1. Western Europe Asia Pacific Travel Insurance Market Analysis, 2016-2021
- 5.2. Western Europe Asia Pacific Travel Insurance Market Opportunity and Forecast, 2023-2032
- 5.3. Western Europe Asia Pacific Travel Insurance Market Analysis, Opportunity and Forecast, By Coverage Type, 2016-2032
- 5.3.1. Western Europe Asia Pacific Travel Insurance Market Analysis by Coverage Type: Introduction
- 5.3.2. Market Size Absolute $ Opportunity Analysis and Forecast, By Coverage Type, 2016-2032
- 5.3.3. Single-Trip Travel Insurance
- 5.3.4. Annual Multi-Trip Travel Insurance
- 5.4. Western Europe Asia Pacific Travel Insurance Market Analysis, Opportunity and Forecast, By Distribution Channel, 2016-2032
- 5.4.1. Western Europe Asia Pacific Travel Insurance Market Analysis by Distribution Channel: Introduction
- 5.4.2. Market Size Absolute $ Opportunity Analysis and Forecast, By Distribution Channel, 2016-2032
- 5.4.3. Insurance Companies
- 5.4.4. Insurance Agents
- 5.4.5. Insurance Brokers
- 5.4.6. Banks
- 5.4.7. Online Aggregators
- 5.5. Western Europe Asia Pacific Travel Insurance Market Analysis, Opportunity and Forecast, By End User, 2016-2032
- 5.5.1. Western Europe Asia Pacific Travel Insurance Market Analysis by End User: Introduction
- 5.5.2. Market Size Absolute $ Opportunity Analysis and Forecast, By End User, 2016-2032
- 5.5.3. Leisure Travelers
- 5.5.4. Business Travelers
- 5.6. Western Europe Asia Pacific Travel Insurance Market Analysis, Opportunity and Forecast, By Insurance Cover, 2016-2032
- 5.6.1. Western Europe Asia Pacific Travel Insurance Market Analysis by Insurance Cover: Introduction
- 5.6.2. Market Size Absolute $ Opportunity Analysis and Forecast, By Insurance Cover, 2016-2032
- 5.6.3. Medical Expenses
- 5.6.4. Trip Cancellation/Interruption
- 5.6.5. Personal Accident
- 5.6.6. Baggage Loss/Delay
- 5.6.7. Emergency Evacuation/Repatriation
- 5.7. Western Europe Asia Pacific Travel Insurance Market Analysis, Opportunity and Forecast, By Country , 2016-2032
- 5.7.1. Western Europe Asia Pacific Travel Insurance Market Analysis by Country : Introduction
- 5.7.2. Market Size Absolute $ Opportunity Analysis and Forecast, Country , 2016-2032
- 5.7.2.1. Germany
- 5.7.2.2. France
- 5.7.2.3. The UK
- 5.7.2.4. Spain
- 5.7.2.5. Italy
- 5.7.2.6. Portugal
- 5.7.2.7. Ireland
- 5.7.2.8. Austria
- 5.7.2.9. Switzerland
- 5.7.2.10. Benelux
- 5.7.2.11. Nordic
- 5.7.2.12. Rest of Western Europe
- 6. Eastern Europe Asia Pacific Travel Insurance Market Analysis, Opportunity and Forecast, 2016-2032
- 6.1. Eastern Europe Asia Pacific Travel Insurance Market Analysis, 2016-2021
- 6.2. Eastern Europe Asia Pacific Travel Insurance Market Opportunity and Forecast, 2023-2032
- 6.3. Eastern Europe Asia Pacific Travel Insurance Market Analysis, Opportunity and Forecast, By Coverage Type, 2016-2032
- 6.3.1. Eastern Europe Asia Pacific Travel Insurance Market Analysis by Coverage Type: Introduction
- 6.3.2. Market Size Absolute $ Opportunity Analysis and Forecast, By Coverage Type, 2016-2032
- 6.3.3. Single-Trip Travel Insurance
- 6.3.4. Annual Multi-Trip Travel Insurance
- 6.4. Eastern Europe Asia Pacific Travel Insurance Market Analysis, Opportunity and Forecast, By Distribution Channel, 2016-2032
- 6.4.1. Eastern Europe Asia Pacific Travel Insurance Market Analysis by Distribution Channel: Introduction
- 6.4.2. Market Size Absolute $ Opportunity Analysis and Forecast, By Distribution Channel, 2016-2032
- 6.4.3. Insurance Companies
- 6.4.4. Insurance Agents
- 6.4.5. Insurance Brokers
- 6.4.6. Banks
- 6.4.7. Online Aggregators
- 6.5. Eastern Europe Asia Pacific Travel Insurance Market Analysis, Opportunity and Forecast, By End User, 2016-2032
- 6.5.1. Eastern Europe Asia Pacific Travel Insurance Market Analysis by End User: Introduction
- 6.5.2. Market Size Absolute $ Opportunity Analysis and Forecast, By End User, 2016-2032
- 6.5.3. Leisure Travelers
- 6.5.4. Business Travelers
- 6.6. Eastern Europe Asia Pacific Travel Insurance Market Analysis, Opportunity and Forecast, By Insurance Cover, 2016-2032
- 6.6.1. Eastern Europe Asia Pacific Travel Insurance Market Analysis by Insurance Cover: Introduction
- 6.6.2. Market Size Absolute $ Opportunity Analysis and Forecast, By Insurance Cover, 2016-2032
- 6.6.3. Medical Expenses
- 6.6.4. Trip Cancellation/Interruption
- 6.6.5. Personal Accident
- 6.6.6. Baggage Loss/Delay
- 6.6.7. Emergency Evacuation/Repatriation
- 6.7. Eastern Europe Asia Pacific Travel Insurance Market Analysis, Opportunity and Forecast, By Country , 2016-2032
- 6.7.1. Eastern Europe Asia Pacific Travel Insurance Market Analysis by Country : Introduction
- 6.7.2. Market Size Absolute $ Opportunity Analysis and Forecast, Country , 2016-2032
- 6.7.2.1. Russia
- 6.7.2.2. Poland
- 6.7.2.3. The Czech Republic
- 6.7.2.4. Greece
- 6.7.2.5. Rest of Eastern Europe
- 7. Asia Pacific Travel Insurance Market Analysis, Opportunity and Forecast, 2016-2032
- 7.1. Asia Pacific Travel Insurance Market Analysis, 2016-2021
- 7.2. Asia Pacific Travel Insurance Market Opportunity and Forecast, 2023-2032
- 7.3. Asia Pacific Travel Insurance Market Analysis, Opportunity and Forecast, By Coverage Type, 2016-2032
- 7.3.1. Asia Pacific Travel Insurance Market Analysis by Coverage Type: Introduction
- 7.3.2. Market Size Absolute $ Opportunity Analysis and Forecast, By Coverage Type, 2016-2032
- 7.3.3. Single-Trip Travel Insurance
- 7.3.4. Annual Multi-Trip Travel Insurance
- 7.4. Asia Pacific Travel Insurance Market Analysis, Opportunity and Forecast, By Distribution Channel, 2016-2032
- 7.4.1. Asia Pacific Travel Insurance Market Analysis by Distribution Channel: Introduction
- 7.4.2. Market Size Absolute $ Opportunity Analysis and Forecast, By Distribution Channel, 2016-2032
- 7.4.3. Insurance Companies
- 7.4.4. Insurance Agents
- 7.4.5. Insurance Brokers
- 7.4.6. Banks
- 7.4.7. Online Aggregators
- 7.5. Asia Pacific Travel Insurance Market Analysis, Opportunity and Forecast, By End User, 2016-2032
- 7.5.1. Asia Pacific Travel Insurance Market Analysis by End User: Introduction
- 7.5.2. Market Size Absolute $ Opportunity Analysis and Forecast, By End User, 2016-2032
- 7.5.3. Leisure Travelers
- 7.5.4. Business Travelers
- 7.6. Asia Pacific Travel Insurance Market Analysis, Opportunity and Forecast, By Insurance Cover, 2016-2032
- 7.6.1. Asia Pacific Travel Insurance Market Analysis by Insurance Cover: Introduction
- 7.6.2. Market Size Absolute $ Opportunity Analysis and Forecast, By Insurance Cover, 2016-2032
- 7.6.3. Medical Expenses
- 7.6.4. Trip Cancellation/Interruption
- 7.6.5. Personal Accident
- 7.6.6. Baggage Loss/Delay
- 7.6.7. Emergency Evacuation/Repatriation
- 7.7. Asia Pacific Travel Insurance Market Analysis, Opportunity and Forecast, By Country , 2016-2032
- 7.7.1. Asia Pacific Travel Insurance Market Analysis by Country : Introduction
- 7.7.2. Market Size Absolute $ Opportunity Analysis and Forecast, Country , 2016-2032
- 7.7.2.1. China
- 7.7.2.2. Japan
- 7.7.2.3. South Korea
- 7.7.2.4. India
- 7.7.2.5. Australia & New Zeland
- 7.7.2.6. Indonesia
- 7.7.2.7. Malaysia
- 7.7.2.8. Philippines
- 7.7.2.9. Singapore
- 7.7.2.10. Thailand
- 7.7.2.11. Vietnam
- 7.7.2.12. Rest of
- 8. Latin America Asia Pacific Travel Insurance Market Analysis, Opportunity and Forecast, 2016-2032
- 8.1. Latin America Asia Pacific Travel Insurance Market Analysis, 2016-2021
- 8.2. Latin America Asia Pacific Travel Insurance Market Opportunity and Forecast, 2023-2032
- 8.3. Latin America Asia Pacific Travel Insurance Market Analysis, Opportunity and Forecast, By Coverage Type, 2016-2032
- 8.3.1. Latin America Asia Pacific Travel Insurance Market Analysis by Coverage Type: Introduction
- 8.3.2. Market Size Absolute $ Opportunity Analysis and Forecast, By Coverage Type, 2016-2032
- 8.3.3. Single-Trip Travel Insurance
- 8.3.4. Annual Multi-Trip Travel Insurance
- 8.4. Latin America Asia Pacific Travel Insurance Market Analysis, Opportunity and Forecast, By Distribution Channel, 2016-2032
- 8.4.1. Latin America Asia Pacific Travel Insurance Market Analysis by Distribution Channel: Introduction
- 8.4.2. Market Size Absolute $ Opportunity Analysis and Forecast, By Distribution Channel, 2016-2032
- 8.4.3. Insurance Companies
- 8.4.4. Insurance Agents
- 8.4.5. Insurance Brokers
- 8.4.6. Banks
- 8.4.7. Online Aggregators
- 8.5. Latin America Asia Pacific Travel Insurance Market Analysis, Opportunity and Forecast, By End User, 2016-2032
- 8.5.1. Latin America Asia Pacific Travel Insurance Market Analysis by End User: Introduction
- 8.5.2. Market Size Absolute $ Opportunity Analysis and Forecast, By End User, 2016-2032
- 8.5.3. Leisure Travelers
- 8.5.4. Business Travelers
- 8.6. Latin America Asia Pacific Travel Insurance Market Analysis, Opportunity and Forecast, By Insurance Cover, 2016-2032
- 8.6.1. Latin America Asia Pacific Travel Insurance Market Analysis by Insurance Cover: Introduction
- 8.6.2. Market Size Absolute $ Opportunity Analysis and Forecast, By Insurance Cover, 2016-2032
- 8.6.3. Medical Expenses
- 8.6.4. Trip Cancellation/Interruption
- 8.6.5. Personal Accident
- 8.6.6. Baggage Loss/Delay
- 8.6.7. Emergency Evacuation/Repatriation
- 8.7. Latin America Asia Pacific Travel Insurance Market Analysis, Opportunity and Forecast, By Country , 2016-2032
- 8.7.1. Latin America Asia Pacific Travel Insurance Market Analysis by Country : Introduction
- 8.7.2. Market Size Absolute $ Opportunity Analysis and Forecast, Country , 2016-2032
- 8.7.2.1. Brazil
- 8.7.2.2. Colombia
- 8.7.2.3. Chile
- 8.7.2.4. Argentina
- 8.7.2.5. Costa Rica
- 8.7.2.6. Rest of Latin America
- 9. Middle East & Africa Asia Pacific Travel Insurance Market Analysis, Opportunity and Forecast, 2016-2032
- 9.1. Middle East & Africa Asia Pacific Travel Insurance Market Analysis, 2016-2021
- 9.2. Middle East & Africa Asia Pacific Travel Insurance Market Opportunity and Forecast, 2023-2032
- 9.3. Middle East & Africa Asia Pacific Travel Insurance Market Analysis, Opportunity and Forecast, By Coverage Type, 2016-2032
- 9.3.1. Middle East & Africa Asia Pacific Travel Insurance Market Analysis by Coverage Type: Introduction
- 9.3.2. Market Size Absolute $ Opportunity Analysis and Forecast, By Coverage Type, 2016-2032
- 9.3.3. Single-Trip Travel Insurance
- 9.3.4. Annual Multi-Trip Travel Insurance
- 9.4. Middle East & Africa Asia Pacific Travel Insurance Market Analysis, Opportunity and Forecast, By Distribution Channel, 2016-2032
- 9.4.1. Middle East & Africa Asia Pacific Travel Insurance Market Analysis by Distribution Channel: Introduction
- 9.4.2. Market Size Absolute $ Opportunity Analysis and Forecast, By Distribution Channel, 2016-2032
- 9.4.3. Insurance Companies
- 9.4.4. Insurance Agents
- 9.4.5. Insurance Brokers
- 9.4.6. Banks
- 9.4.7. Online Aggregators
- 9.5. Middle East & Africa Asia Pacific Travel Insurance Market Analysis, Opportunity and Forecast, By End User, 2016-2032
- 9.5.1. Middle East & Africa Asia Pacific Travel Insurance Market Analysis by End User: Introduction
- 9.5.2. Market Size Absolute $ Opportunity Analysis and Forecast, By End User, 2016-2032
- 9.5.3. Leisure Travelers
- 9.5.4. Business Travelers
- 9.6. Middle East & Africa Asia Pacific Travel Insurance Market Analysis, Opportunity and Forecast, By Insurance Cover, 2016-2032
- 9.6.1. Middle East & Africa Asia Pacific Travel Insurance Market Analysis by Insurance Cover: Introduction
- 9.6.2. Market Size Absolute $ Opportunity Analysis and Forecast, By Insurance Cover, 2016-2032
- 9.6.3. Medical Expenses
- 9.6.4. Trip Cancellation/Interruption
- 9.6.5. Personal Accident
- 9.6.6. Baggage Loss/Delay
- 9.6.7. Emergency Evacuation/Repatriation
- 9.7. Middle East & Africa Asia Pacific Travel Insurance Market Analysis, Opportunity and Forecast, By Country , 2016-2032
- 9.7.1. Middle East & Africa Asia Pacific Travel Insurance Market Analysis by Country : Introduction
- 9.7.2. Market Size Absolute $ Opportunity Analysis and Forecast, Country , 2016-2032
- 9.7.2.1. Algeria
- 9.7.2.2. Egypt
- 9.7.2.3. Israel
- 9.7.2.4. Kuwait
- 9.7.2.5. Nigeria
- 9.7.2.6. Saudi Arabia
- 9.7.2.7. South Africa
- 9.7.2.8. Turkey
- 9.7.2.9. The UAE
- 9.7.2.10. Rest of MEA
- 10. Asia Pacific Travel Insurance Market Analysis, Opportunity and Forecast, By Region , 2016-2032
- 10.1. Asia Pacific Travel Insurance Market Analysis by Region : Introduction
- 10.2. Market Size Absolute $ Opportunity Analysis and Forecast, By Region , 2016-2032
- 10.2.1. North America
- 10.2.2. Western Europe
- 10.2.3. Eastern Europe
- 10.2.4.
- 10.2.5. Latin America
- 10.2.6. Middle East & Africa
- 11. Asia Pacific Travel Insurance Market Competitive Landscape, Market Share Analysis, and Company Profiles
- 11.1. Market Share Analysis
- 11.2. Company Profiles
- 11.3. Nippon Life Insurance Company
- 11.3.1. Company Overview
- 11.3.2. Financial Highlights
- 11.3.3. Product Portfolio
- 11.3.4. SWOT Analysis
- 11.3.5. Key Strategies and Developments
- 11.4. Life Insurance Corporation of India
- 11.4.1. Company Overview
- 11.4.2. Financial Highlights
- 11.4.3. Product Portfolio
- 11.4.4. SWOT Analysis
- 11.4.5. Key Strategies and Developments
- 11.5. China Life Insurance Company
- 11.5.1. Company Overview
- 11.5.2. Financial Highlights
- 11.5.3. Product Portfolio
- 11.5.4. SWOT Analysis
- 11.5.5. Key Strategies and Developments
- 11.6. Hong Leong Assurance Berhad
- 11.6.1. Company Overview
- 11.6.2. Financial Highlights
- 11.6.3. Product Portfolio
- 11.6.4. SWOT Analysis
- 11.6.5. Key Strategies and Developments
- 11.7. Samsung Life Insurance
- 11.7.1. Company Overview
- 11.7.2. Financial Highlights
- 11.7.3. Product Portfolio
- 11.7.4. SWOT Analysis
- 11.7.5. Key Strategies and Developments
- 11.8. Muang Thai Life Assurance Public Co. Ltd.
- 11.8.1. Company Overview
- 11.8.2. Financial Highlights
- 11.8.3. Product Portfolio
- 11.8.4. SWOT Analysis
- 11.8.5. Key Strategies and Developments
- 11.9. Sun Life of Canada (Philippines) Inc
- 11.9.1. Company Overview
- 11.9.2. Financial Highlights
- 11.9.3. Product Portfolio
- 11.9.4. SWOT Analysis
- 11.9.5. Key Strategies and Developments
- 11.10. American International Group Inc.
- 11.10.1. Company Overview
- 11.10.2. Financial Highlights
- 11.10.3. Product Portfolio
- 11.10.4. SWOT Analysis
- 11.10.5. Key Strategies and Developments
- 11.11. Berkshire Hathaway Specialty Insurance
- 11.11.1. Company Overview
- 11.11.2. Financial Highlights
- 11.11.3. Product Portfolio
- 11.11.4. SWOT Analysis
- 11.11.5. Key Strategies and Developments
- 11.12. China Pacific Insurance Co., Ltd.
- 11.12.1. Company Overview
- 11.12.2. Financial Highlights
- 11.12.3. Product Portfolio
- 11.12.4. SWOT Analysis
- 11.12.5. Key Strategies and Developments
- 11.13.1. Company Overview
- 11.13.2. Financial Highlights
- 11.13.3. Product Portfolio
- 11.13.4. SWOT Analysis
- 11.13.5. Key Strategies and Developments
- 11.14. Ping An Insurance Company of China
- 11.14.1. Company Overview
- 11.14.2. Financial Highlights
- 11.14.3. Product Portfolio
- 11.14.4. SWOT Analysis
- 11.14.5. Key Strategies and Developments
- 11.15. HanseMerkur Insurance Group
- 11.15.1. Company Overview
- 11.15.2. Financial Highlights
- 11.15.3. Product Portfolio
- 11.15.4. SWOT Analysis
- 11.15.5. Key Strategies and Developments
- 11.16. Allianz Assistance
- 11.16.1. Company Overview
- 11.16.2. Financial Highlights
- 11.16.3. Product Portfolio
- 11.16.4. SWOT Analysis
- 11.16.5. Key Strategies and Developments
- 11.17. Generali Group
- 11.17.1. Company Overview
- 11.17.2. Financial Highlights
- 11.17.3. Product Portfolio
- 11.17.4. SWOT Analysis
- 11.17.5. Key Strategies and Developments
- 11.18. Assicurazioni Generali Group
- 11.18.1. Company Overview
- 11.18.2. Financial Highlights
- 11.18.3. Product Portfolio
- 11.18.4. SWOT Analysis
- 11.18.5. Key Strategies and Developments
- 11.19. SOMPO Holdings, Inc.
- 11.19.1. Company Overview
- 11.19.2. Financial Highlights
- 11.19.3. Product Portfolio
- 11.19.4. SWOT Analysis
- 11.19.5. Key Strategies and Developments
- 11.20. Arch Capital Group Ltd.
- 11.20.1. Company Overview
- 11.20.2. Financial Highlights
- 11.20.3. Product Portfolio
- 11.20.4. SWOT Analysis
- 11.20.5. Key Strategies and Developments
- 11.21. Corners Inc
- 11.21.1. Company Overview
- 11.21.2. Financial Highlights
- 11.21.3. Product Portfolio
- 11.21.4. SWOT Analysis
- 11.21.5. Key Strategies and Developments
- 11.22. Wingman Insurance
- 11.22.1. Company Overview
- 11.22.2. Financial Highlights
- 11.22.3. Product Portfolio
- 11.22.4. SWOT Analysis
- 11.22.5. Key Strategies and Developments
- 12. Assumptions and Acronyms
- 13. Research Methodology
- 14. Contact
- List of Figures
- Figure 1: Asia Pacific Travel Insurance Market Revenue (US$ Mn) Market Share by Coverage Type in 2022
- Figure 2: Asia Pacific Travel Insurance Market Attractiveness Analysis by Coverage Type, 2016-2032
- Figure 3: Asia Pacific Travel Insurance Market Revenue (US$ Mn) Market Share by Distribution Channelin 2022
- Figure 4: Asia Pacific Travel Insurance Market Attractiveness Analysis by Distribution Channel, 2016-2032
- Figure 5: Asia Pacific Travel Insurance Market Revenue (US$ Mn) Market Share by End Userin 2022
- Figure 6: Asia Pacific Travel Insurance Market Attractiveness Analysis by End User, 2016-2032
- Figure 7: Asia Pacific Travel Insurance Market Revenue (US$ Mn) Market Share by Insurance Coverin 2022
- Figure 8: Asia Pacific Travel Insurance Market Attractiveness Analysis by Insurance Cover, 2016-2032
- Figure 9: Asia Pacific Travel Insurance Market Revenue (US$ Mn) Market Share by Region in 2022
- Figure 10: Asia Pacific Travel Insurance Market Attractiveness Analysis by Region, 2016-2032
- Figure 11: Asia Pacific Travel Insurance Market Revenue (US$ Mn) (2016-2032)
- Figure 12: Asia Pacific Travel Insurance Market Revenue (US$ Mn) Comparison by Region (2016-2032)
- Figure 13: Asia Pacific Travel Insurance Market Revenue (US$ Mn) Comparison by Coverage Type (2016-2032)
- Figure 14: Asia Pacific Travel Insurance Market Revenue (US$ Mn) Comparison by Distribution Channel (2016-2032)
- Figure 15: Asia Pacific Travel Insurance Market Revenue (US$ Mn) Comparison by End User (2016-2032)
- Figure 16: Asia Pacific Travel Insurance Market Revenue (US$ Mn) Comparison by Insurance Cover (2016-2032)
- Figure 17: Asia Pacific Travel Insurance Market Y-o-Y Growth Rate Comparison by Region (2016-2032)
- Figure 18: Asia Pacific Travel Insurance Market Y-o-Y Growth Rate Comparison by Coverage Type (2016-2032)
- Figure 19: Asia Pacific Travel Insurance Market Y-o-Y Growth Rate Comparison by Distribution Channel (2016-2032)
- Figure 20: Asia Pacific Travel Insurance Market Y-o-Y Growth Rate Comparison by End User (2016-2032)
- Figure 21: Asia Pacific Travel Insurance Market Y-o-Y Growth Rate Comparison by Insurance Cover (2016-2032)
- Figure 22: Asia Pacific Travel Insurance Market Share Comparison by Region (2016-2032)
- Figure 23: Asia Pacific Travel Insurance Market Share Comparison by Coverage Type (2016-2032)
- Figure 24: Asia Pacific Travel Insurance Market Share Comparison by Distribution Channel (2016-2032)
- Figure 25: Asia Pacific Travel Insurance Market Share Comparison by End User (2016-2032)
- Figure 26: Asia Pacific Travel Insurance Market Share Comparison by Insurance Cover (2016-2032)
- Figure 27: North America Asia Pacific Travel Insurance Market Revenue (US$ Mn) Market Share by Coverage Typein 2022
- Figure 28: North America Asia Pacific Travel Insurance Market Attractiveness Analysis by Coverage Type, 2016-2032
- Figure 29: North America Asia Pacific Travel Insurance Market Revenue (US$ Mn) Market Share by Distribution Channelin 2022
- Figure 30: North America Asia Pacific Travel Insurance Market Attractiveness Analysis by Distribution Channel, 2016-2032
- Figure 31: North America Asia Pacific Travel Insurance Market Revenue (US$ Mn) Market Share by End Userin 2022
- Figure 32: North America Asia Pacific Travel Insurance Market Attractiveness Analysis by End User, 2016-2032
- Figure 33: North America Asia Pacific Travel Insurance Market Revenue (US$ Mn) Market Share by Insurance Coverin 2022
- Figure 34: North America Asia Pacific Travel Insurance Market Attractiveness Analysis by Insurance Cover, 2016-2032
- Figure 35: North America Asia Pacific Travel Insurance Market Revenue (US$ Mn) Market Share by Country in 2022
- Figure 36: North America Asia Pacific Travel Insurance Market Attractiveness Analysis by Country, 2016-2032
- Figure 37: North America Asia Pacific Travel Insurance Market Revenue (US$ Mn) (2016-2032)
- Figure 38: North America Asia Pacific Travel Insurance Market Revenue (US$ Mn) Comparison by Country (2016-2032)
- Figure 39: North America Asia Pacific Travel Insurance Market Revenue (US$ Mn) Comparison by Coverage Type (2016-2032)
- Figure 40: North America Asia Pacific Travel Insurance Market Revenue (US$ Mn) Comparison by Distribution Channel (2016-2032)
- Figure 41: North America Asia Pacific Travel Insurance Market Revenue (US$ Mn) Comparison by End User (2016-2032)
- Figure 42: North America Asia Pacific Travel Insurance Market Revenue (US$ Mn) Comparison by Insurance Cover (2016-2032)
- Figure 43: North America Asia Pacific Travel Insurance Market Y-o-Y Growth Rate Comparison by Country (2016-2032)
- Figure 44: North America Asia Pacific Travel Insurance Market Y-o-Y Growth Rate Comparison by Coverage Type (2016-2032)
- Figure 45: North America Asia Pacific Travel Insurance Market Y-o-Y Growth Rate Comparison by Distribution Channel (2016-2032)
- Figure 46: North America Asia Pacific Travel Insurance Market Y-o-Y Growth Rate Comparison by End User (2016-2032)
- Figure 47: North America Asia Pacific Travel Insurance Market Y-o-Y Growth Rate Comparison by Insurance Cover (2016-2032)
- Figure 48: North America Asia Pacific Travel Insurance Market Share Comparison by Country (2016-2032)
- Figure 49: North America Asia Pacific Travel Insurance Market Share Comparison by Coverage Type (2016-2032)
- Figure 50: North America Asia Pacific Travel Insurance Market Share Comparison by Distribution Channel (2016-2032)
- Figure 51: North America Asia Pacific Travel Insurance Market Share Comparison by End User (2016-2032)
- Figure 52: North America Asia Pacific Travel Insurance Market Share Comparison by Insurance Cover (2016-2032)
- Figure 53: Western Europe Asia Pacific Travel Insurance Market Revenue (US$ Mn) Market Share by Coverage Typein 2022
- Figure 54: Western Europe Asia Pacific Travel Insurance Market Attractiveness Analysis by Coverage Type, 2016-2032
- Figure 55: Western Europe Asia Pacific Travel Insurance Market Revenue (US$ Mn) Market Share by Distribution Channelin 2022
- Figure 56: Western Europe Asia Pacific Travel Insurance Market Attractiveness Analysis by Distribution Channel, 2016-2032
- Figure 57: Western Europe Asia Pacific Travel Insurance Market Revenue (US$ Mn) Market Share by End Userin 2022
- Figure 58: Western Europe Asia Pacific Travel Insurance Market Attractiveness Analysis by End User, 2016-2032
- Figure 59: Western Europe Asia Pacific Travel Insurance Market Revenue (US$ Mn) Market Share by Insurance Coverin 2022
- Figure 60: Western Europe Asia Pacific Travel Insurance Market Attractiveness Analysis by Insurance Cover, 2016-2032
- Figure 61: Western Europe Asia Pacific Travel Insurance Market Revenue (US$ Mn) Market Share by Country in 2022
- Figure 62: Western Europe Asia Pacific Travel Insurance Market Attractiveness Analysis by Country, 2016-2032
- Figure 63: Western Europe Asia Pacific Travel Insurance Market Revenue (US$ Mn) (2016-2032)
- Figure 64: Western Europe Asia Pacific Travel Insurance Market Revenue (US$ Mn) Comparison by Country (2016-2032)
- Figure 65: Western Europe Asia Pacific Travel Insurance Market Revenue (US$ Mn) Comparison by Coverage Type (2016-2032)
- Figure 66: Western Europe Asia Pacific Travel Insurance Market Revenue (US$ Mn) Comparison by Distribution Channel (2016-2032)
- Figure 67: Western Europe Asia Pacific Travel Insurance Market Revenue (US$ Mn) Comparison by End User (2016-2032)
- Figure 68: Western Europe Asia Pacific Travel Insurance Market Revenue (US$ Mn) Comparison by Insurance Cover (2016-2032)
- Figure 69: Western Europe Asia Pacific Travel Insurance Market Y-o-Y Growth Rate Comparison by Country (2016-2032)
- Figure 70: Western Europe Asia Pacific Travel Insurance Market Y-o-Y Growth Rate Comparison by Coverage Type (2016-2032)
- Figure 71: Western Europe Asia Pacific Travel Insurance Market Y-o-Y Growth Rate Comparison by Distribution Channel (2016-2032)
- Figure 72: Western Europe Asia Pacific Travel Insurance Market Y-o-Y Growth Rate Comparison by End User (2016-2032)
- Figure 73: Western Europe Asia Pacific Travel Insurance Market Y-o-Y Growth Rate Comparison by Insurance Cover (2016-2032)
- Figure 74: Western Europe Asia Pacific Travel Insurance Market Share Comparison by Country (2016-2032)
- Figure 75: Western Europe Asia Pacific Travel Insurance Market Share Comparison by Coverage Type (2016-2032)
- Figure 76: Western Europe Asia Pacific Travel Insurance Market Share Comparison by Distribution Channel (2016-2032)
- Figure 77: Western Europe Asia Pacific Travel Insurance Market Share Comparison by End User (2016-2032)
- Figure 78: Western Europe Asia Pacific Travel Insurance Market Share Comparison by Insurance Cover (2016-2032)
- Figure 79: Eastern Europe Asia Pacific Travel Insurance Market Revenue (US$ Mn) Market Share by Coverage Typein 2022
- Figure 80: Eastern Europe Asia Pacific Travel Insurance Market Attractiveness Analysis by Coverage Type, 2016-2032
- Figure 81: Eastern Europe Asia Pacific Travel Insurance Market Revenue (US$ Mn) Market Share by Distribution Channelin 2022
- Figure 82: Eastern Europe Asia Pacific Travel Insurance Market Attractiveness Analysis by Distribution Channel, 2016-2032
- Figure 83: Eastern Europe Asia Pacific Travel Insurance Market Revenue (US$ Mn) Market Share by End Userin 2022
- Figure 84: Eastern Europe Asia Pacific Travel Insurance Market Attractiveness Analysis by End User, 2016-2032
- Figure 85: Eastern Europe Asia Pacific Travel Insurance Market Revenue (US$ Mn) Market Share by Insurance Coverin 2022
- Figure 86: Eastern Europe Asia Pacific Travel Insurance Market Attractiveness Analysis by Insurance Cover, 2016-2032
- Figure 87: Eastern Europe Asia Pacific Travel Insurance Market Revenue (US$ Mn) Market Share by Country in 2022
- Figure 88: Eastern Europe Asia Pacific Travel Insurance Market Attractiveness Analysis by Country, 2016-2032
- Figure 89: Eastern Europe Asia Pacific Travel Insurance Market Revenue (US$ Mn) (2016-2032)
- Figure 90: Eastern Europe Asia Pacific Travel Insurance Market Revenue (US$ Mn) Comparison by Country (2016-2032)
- Figure 91: Eastern Europe Asia Pacific Travel Insurance Market Revenue (US$ Mn) Comparison by Coverage Type (2016-2032)
- Figure 92: Eastern Europe Asia Pacific Travel Insurance Market Revenue (US$ Mn) Comparison by Distribution Channel (2016-2032)
- Figure 93: Eastern Europe Asia Pacific Travel Insurance Market Revenue (US$ Mn) Comparison by End User (2016-2032)
- Figure 94: Eastern Europe Asia Pacific Travel Insurance Market Revenue (US$ Mn) Comparison by Insurance Cover (2016-2032)
- Figure 95: Eastern Europe Asia Pacific Travel Insurance Market Y-o-Y Growth Rate Comparison by Country (2016-2032)
- Figure 96: Eastern Europe Asia Pacific Travel Insurance Market Y-o-Y Growth Rate Comparison by Coverage Type (2016-2032)
- Figure 97: Eastern Europe Asia Pacific Travel Insurance Market Y-o-Y Growth Rate Comparison by Distribution Channel (2016-2032)
- Figure 98: Eastern Europe Asia Pacific Travel Insurance Market Y-o-Y Growth Rate Comparison by End User (2016-2032)
- Figure 99: Eastern Europe Asia Pacific Travel Insurance Market Y-o-Y Growth Rate Comparison by Insurance Cover (2016-2032)
- Figure 100: Eastern Europe Asia Pacific Travel Insurance Market Share Comparison by Country (2016-2032)
- Figure 101: Eastern Europe Asia Pacific Travel Insurance Market Share Comparison by Coverage Type (2016-2032)
- Figure 102: Eastern Europe Asia Pacific Travel Insurance Market Share Comparison by Distribution Channel (2016-2032)
- Figure 103: Eastern Europe Asia Pacific Travel Insurance Market Share Comparison by End User (2016-2032)
- Figure 104: Eastern Europe Asia Pacific Travel Insurance Market Share Comparison by Insurance Cover (2016-2032)
- Figure 105: Asia Pacific Travel Insurance Market Revenue (US$ Mn) Market Share by Coverage Typein 2022
- Figure 106: Asia Pacific Travel Insurance Market Attractiveness Analysis by Coverage Type, 2016-2032
- Figure 107: Asia Pacific Travel Insurance Market Revenue (US$ Mn) Market Share by Distribution Channelin 2022
- Figure 108: Asia Pacific Travel Insurance Market Attractiveness Analysis by Distribution Channel, 2016-2032
- Figure 109: Asia Pacific Travel Insurance Market Revenue (US$ Mn) Market Share by End Userin 2022
- Figure 110: Asia Pacific Travel Insurance Market Attractiveness Analysis by End User, 2016-2032
- Figure 111: Asia Pacific Travel Insurance Market Revenue (US$ Mn) Market Share by Insurance Coverin 2022
- Figure 112: Asia Pacific Travel Insurance Market Attractiveness Analysis by Insurance Cover, 2016-2032
- Figure 113: Asia Pacific Travel Insurance Market Revenue (US$ Mn) Market Share by Country in 2022
- Figure 114: Asia Pacific Travel Insurance Market Attractiveness Analysis by Country, 2016-2032
- Figure 115: Asia Pacific Travel Insurance Market Revenue (US$ Mn) (2016-2032)
- Figure 116: Asia Pacific Travel Insurance Market Revenue (US$ Mn) Comparison by Country (2016-2032)
- Figure 117: Asia Pacific Travel Insurance Market Revenue (US$ Mn) Comparison by Coverage Type (2016-2032)
- Figure 118: Asia Pacific Travel Insurance Market Revenue (US$ Mn) Comparison by Distribution Channel (2016-2032)
- Figure 119: Asia Pacific Travel Insurance Market Revenue (US$ Mn) Comparison by End User (2016-2032)
- Figure 120: Asia Pacific Travel Insurance Market Revenue (US$ Mn) Comparison by Insurance Cover (2016-2032)
- Figure 121: Asia Pacific Travel Insurance Market Y-o-Y Growth Rate Comparison by Country (2016-2032)
- Figure 122: Asia Pacific Travel Insurance Market Y-o-Y Growth Rate Comparison by Coverage Type (2016-2032)
- Figure 123: Asia Pacific Travel Insurance Market Y-o-Y Growth Rate Comparison by Distribution Channel (2016-2032)
- Figure 124: Asia Pacific Travel Insurance Market Y-o-Y Growth Rate Comparison by End User (2016-2032)
- Figure 125: Asia Pacific Travel Insurance Market Y-o-Y Growth Rate Comparison by Insurance Cover (2016-2032)
- Figure 126: Asia Pacific Travel Insurance Market Share Comparison by Country (2016-2032)
- Figure 127: Asia Pacific Travel Insurance Market Share Comparison by Coverage Type (2016-2032)
- Figure 128: Asia Pacific Travel Insurance Market Share Comparison by Distribution Channel (2016-2032)
- Figure 129: Asia Pacific Travel Insurance Market Share Comparison by End User (2016-2032)
- Figure 130: Asia Pacific Travel Insurance Market Share Comparison by Insurance Cover (2016-2032)
- Figure 131: Latin America Asia Pacific Travel Insurance Market Revenue (US$ Mn) Market Share by Coverage Typein 2022
- Figure 132: Latin America Asia Pacific Travel Insurance Market Attractiveness Analysis by Coverage Type, 2016-2032
- Figure 133: Latin America Asia Pacific Travel Insurance Market Revenue (US$ Mn) Market Share by Distribution Channelin 2022
- Figure 134: Latin America Asia Pacific Travel Insurance Market Attractiveness Analysis by Distribution Channel, 2016-2032
- Figure 135: Latin America Asia Pacific Travel Insurance Market Revenue (US$ Mn) Market Share by End Userin 2022
- Figure 136: Latin America Asia Pacific Travel Insurance Market Attractiveness Analysis by End User, 2016-2032
- Figure 137: Latin America Asia Pacific Travel Insurance Market Revenue (US$ Mn) Market Share by Insurance Coverin 2022
- Figure 138: Latin America Asia Pacific Travel Insurance Market Attractiveness Analysis by Insurance Cover, 2016-2032
- Figure 139: Latin America Asia Pacific Travel Insurance Market Revenue (US$ Mn) Market Share by Country in 2022
- Figure 140: Latin America Asia Pacific Travel Insurance Market Attractiveness Analysis by Country, 2016-2032
- Figure 141: Latin America Asia Pacific Travel Insurance Market Revenue (US$ Mn) (2016-2032)
- Figure 142: Latin America Asia Pacific Travel Insurance Market Revenue (US$ Mn) Comparison by Country (2016-2032)
- Figure 143: Latin America Asia Pacific Travel Insurance Market Revenue (US$ Mn) Comparison by Coverage Type (2016-2032)
- Figure 144: Latin America Asia Pacific Travel Insurance Market Revenue (US$ Mn) Comparison by Distribution Channel (2016-2032)
- Figure 145: Latin America Asia Pacific Travel Insurance Market Revenue (US$ Mn) Comparison by End User (2016-2032)
- Figure 146: Latin America Asia Pacific Travel Insurance Market Revenue (US$ Mn) Comparison by Insurance Cover (2016-2032)
- Figure 147: Latin America Asia Pacific Travel Insurance Market Y-o-Y Growth Rate Comparison by Country (2016-2032)
- Figure 148: Latin America Asia Pacific Travel Insurance Market Y-o-Y Growth Rate Comparison by Coverage Type (2016-2032)
- Figure 149: Latin America Asia Pacific Travel Insurance Market Y-o-Y Growth Rate Comparison by Distribution Channel (2016-2032)
- Figure 150: Latin America Asia Pacific Travel Insurance Market Y-o-Y Growth Rate Comparison by End User (2016-2032)
- Figure 151: Latin America Asia Pacific Travel Insurance Market Y-o-Y Growth Rate Comparison by Insurance Cover (2016-2032)
- Figure 152: Latin America Asia Pacific Travel Insurance Market Share Comparison by Country (2016-2032)
- Figure 153: Latin America Asia Pacific Travel Insurance Market Share Comparison by Coverage Type (2016-2032)
- Figure 154: Latin America Asia Pacific Travel Insurance Market Share Comparison by Distribution Channel (2016-2032)
- Figure 155: Latin America Asia Pacific Travel Insurance Market Share Comparison by End User (2016-2032)
- Figure 156: Latin America Asia Pacific Travel Insurance Market Share Comparison by Insurance Cover (2016-2032)
- Figure 157: Middle East & Africa Asia Pacific Travel Insurance Market Revenue (US$ Mn) Market Share by Coverage Typein 2022
- Figure 158: Middle East & Africa Asia Pacific Travel Insurance Market Attractiveness Analysis by Coverage Type, 2016-2032
- Figure 159: Middle East & Africa Asia Pacific Travel Insurance Market Revenue (US$ Mn) Market Share by Distribution Channelin 2022
- Figure 160: Middle East & Africa Asia Pacific Travel Insurance Market Attractiveness Analysis by Distribution Channel, 2016-2032
- Figure 161: Middle East & Africa Asia Pacific Travel Insurance Market Revenue (US$ Mn) Market Share by End Userin 2022
- Figure 162: Middle East & Africa Asia Pacific Travel Insurance Market Attractiveness Analysis by End User, 2016-2032
- Figure 163: Middle East & Africa Asia Pacific Travel Insurance Market Revenue (US$ Mn) Market Share by Insurance Coverin 2022
- Figure 164: Middle East & Africa Asia Pacific Travel Insurance Market Attractiveness Analysis by Insurance Cover, 2016-2032
- Figure 165: Middle East & Africa Asia Pacific Travel Insurance Market Revenue (US$ Mn) Market Share by Country in 2022
- Figure 166: Middle East & Africa Asia Pacific Travel Insurance Market Attractiveness Analysis by Country, 2016-2032
- Figure 167: Middle East & Africa Asia Pacific Travel Insurance Market Revenue (US$ Mn) (2016-2032)
- Figure 168: Middle East & Africa Asia Pacific Travel Insurance Market Revenue (US$ Mn) Comparison by Country (2016-2032)
- Figure 169: Middle East & Africa Asia Pacific Travel Insurance Market Revenue (US$ Mn) Comparison by Coverage Type (2016-2032)
- Figure 170: Middle East & Africa Asia Pacific Travel Insurance Market Revenue (US$ Mn) Comparison by Distribution Channel (2016-2032)
- Figure 171: Middle East & Africa Asia Pacific Travel Insurance Market Revenue (US$ Mn) Comparison by End User (2016-2032)
- Figure 172: Middle East & Africa Asia Pacific Travel Insurance Market Revenue (US$ Mn) Comparison by Insurance Cover (2016-2032)
- Figure 173: Middle East & Africa Asia Pacific Travel Insurance Market Y-o-Y Growth Rate Comparison by Country (2016-2032)
- Figure 174: Middle East & Africa Asia Pacific Travel Insurance Market Y-o-Y Growth Rate Comparison by Coverage Type (2016-2032)
- Figure 175: Middle East & Africa Asia Pacific Travel Insurance Market Y-o-Y Growth Rate Comparison by Distribution Channel (2016-2032)
- Figure 176: Middle East & Africa Asia Pacific Travel Insurance Market Y-o-Y Growth Rate Comparison by End User (2016-2032)
- Figure 177: Middle East & Africa Asia Pacific Travel Insurance Market Y-o-Y Growth Rate Comparison by Insurance Cover (2016-2032)
- Figure 178: Middle East & Africa Asia Pacific Travel Insurance Market Share Comparison by Country (2016-2032)
- Figure 179: Middle East & Africa Asia Pacific Travel Insurance Market Share Comparison by Coverage Type (2016-2032)
- Figure 180: Middle East & Africa Asia Pacific Travel Insurance Market Share Comparison by Distribution Channel (2016-2032)
- Figure 181: Middle East & Africa Asia Pacific Travel Insurance Market Share Comparison by End User (2016-2032)
- Figure 182: Middle East & Africa Asia Pacific Travel Insurance Market Share Comparison by Insurance Cover (2016-2032)
- List of Tables
- Table 1: Asia Pacific Travel Insurance Market Comparison by Coverage Type (2016-2032)
- Table 2: Asia Pacific Travel Insurance Market Comparison by Distribution Channel (2016-2032)
- Table 3: Asia Pacific Travel Insurance Market Comparison by End User (2016-2032)
- Table 4: Asia Pacific Travel Insurance Market Comparison by Insurance Cover (2016-2032)
- Table 5: Asia Pacific Travel Insurance Market Revenue (US$ Mn) Comparison by Region (2016-2032)
- Table 6: Asia Pacific Travel Insurance Market Revenue (US$ Mn) (2016-2032)
- Table 7: Asia Pacific Travel Insurance Market Revenue (US$ Mn) Comparison by Region (2016-2032)
- Table 8: Asia Pacific Travel Insurance Market Revenue (US$ Mn) Comparison by Coverage Type (2016-2032)
- Table 9: Asia Pacific Travel Insurance Market Revenue (US$ Mn) Comparison by Distribution Channel (2016-2032)
- Table 10: Asia Pacific Travel Insurance Market Revenue (US$ Mn) Comparison by End User (2016-2032)
- Table 11: Asia Pacific Travel Insurance Market Revenue (US$ Mn) Comparison by Insurance Cover (2016-2032)
- Table 12: Asia Pacific Travel Insurance Market Y-o-Y Growth Rate Comparison by Region (2016-2032)
- Table 13: Asia Pacific Travel Insurance Market Y-o-Y Growth Rate Comparison by Coverage Type (2016-2032)
- Table 14: Asia Pacific Travel Insurance Market Y-o-Y Growth Rate Comparison by Distribution Channel (2016-2032)
- Table 15: Asia Pacific Travel Insurance Market Y-o-Y Growth Rate Comparison by End User (2016-2032)
- Table 16: Asia Pacific Travel Insurance Market Y-o-Y Growth Rate Comparison by Insurance Cover (2016-2032)
- Table 17: Asia Pacific Travel Insurance Market Share Comparison by Region (2016-2032)
- Table 18: Asia Pacific Travel Insurance Market Share Comparison by Coverage Type (2016-2032)
- Table 19: Asia Pacific Travel Insurance Market Share Comparison by Distribution Channel (2016-2032)
- Table 20: Asia Pacific Travel Insurance Market Share Comparison by End User (2016-2032)
- Table 21: Asia Pacific Travel Insurance Market Share Comparison by Insurance Cover (2016-2032)
- Table 22: North America Asia Pacific Travel Insurance Market Comparison by Distribution Channel (2016-2032)
- Table 23: North America Asia Pacific Travel Insurance Market Comparison by End User (2016-2032)
- Table 24: North America Asia Pacific Travel Insurance Market Comparison by Insurance Cover (2016-2032)
- Table 25: North America Asia Pacific Travel Insurance Market Revenue (US$ Mn) Comparison by Country (2016-2032)
- Table 26: North America Asia Pacific Travel Insurance Market Revenue (US$ Mn) (2016-2032)
- Table 27: North America Asia Pacific Travel Insurance Market Revenue (US$ Mn) Comparison by Country (2016-2032)
- Table 28: North America Asia Pacific Travel Insurance Market Revenue (US$ Mn) Comparison by Coverage Type (2016-2032)
- Table 29: North America Asia Pacific Travel Insurance Market Revenue (US$ Mn) Comparison by Distribution Channel (2016-2032)
- Table 30: North America Asia Pacific Travel Insurance Market Revenue (US$ Mn) Comparison by End User (2016-2032)
- Table 31: North America Asia Pacific Travel Insurance Market Revenue (US$ Mn) Comparison by Insurance Cover (2016-2032)
- Table 32: North America Asia Pacific Travel Insurance Market Y-o-Y Growth Rate Comparison by Country (2016-2032)
- Table 33: North America Asia Pacific Travel Insurance Market Y-o-Y Growth Rate Comparison by Coverage Type (2016-2032)
- Table 34: North America Asia Pacific Travel Insurance Market Y-o-Y Growth Rate Comparison by Distribution Channel (2016-2032)
- Table 35: North America Asia Pacific Travel Insurance Market Y-o-Y Growth Rate Comparison by End User (2016-2032)
- Table 36: North America Asia Pacific Travel Insurance Market Y-o-Y Growth Rate Comparison by Insurance Cover (2016-2032)
- Table 37: North America Asia Pacific Travel Insurance Market Share Comparison by Country (2016-2032)
- Table 38: North America Asia Pacific Travel Insurance Market Share Comparison by Coverage Type (2016-2032)
- Table 39: North America Asia Pacific Travel Insurance Market Share Comparison by Distribution Channel (2016-2032)
- Table 40: North America Asia Pacific Travel Insurance Market Share Comparison by End User (2016-2032)
- Table 41: North America Asia Pacific Travel Insurance Market Share Comparison by Insurance Cover (2016-2032)
- Table 42: Western Europe Asia Pacific Travel Insurance Market Comparison by Coverage Type (2016-2032)
- Table 43: Western Europe Asia Pacific Travel Insurance Market Comparison by Distribution Channel (2016-2032)
- Table 44: Western Europe Asia Pacific Travel Insurance Market Comparison by End User (2016-2032)
- Table 45: Western Europe Asia Pacific Travel Insurance Market Comparison by Insurance Cover (2016-2032)
- Table 46: Western Europe Asia Pacific Travel Insurance Market Revenue (US$ Mn) Comparison by Country (2016-2032)
- Table 47: Western Europe Asia Pacific Travel Insurance Market Revenue (US$ Mn) (2016-2032)
- Table 48: Western Europe Asia Pacific Travel Insurance Market Revenue (US$ Mn) Comparison by Country (2016-2032)
- Table 49: Western Europe Asia Pacific Travel Insurance Market Revenue (US$ Mn) Comparison by Coverage Type (2016-2032)
- Table 50: Western Europe Asia Pacific Travel Insurance Market Revenue (US$ Mn) Comparison by Distribution Channel (2016-2032)
- Table 51: Western Europe Asia Pacific Travel Insurance Market Revenue (US$ Mn) Comparison by End User (2016-2032)
- Table 52: Western Europe Asia Pacific Travel Insurance Market Revenue (US$ Mn) Comparison by Insurance Cover (2016-2032)
- Table 53: Western Europe Asia Pacific Travel Insurance Market Y-o-Y Growth Rate Comparison by Country (2016-2032)
- Table 54: Western Europe Asia Pacific Travel Insurance Market Y-o-Y Growth Rate Comparison by Coverage Type (2016-2032)
- Table 55: Western Europe Asia Pacific Travel Insurance Market Y-o-Y Growth Rate Comparison by Distribution Channel (2016-2032)
- Table 56: Western Europe Asia Pacific Travel Insurance Market Y-o-Y Growth Rate Comparison by End User (2016-2032)
- Table 57: Western Europe Asia Pacific Travel Insurance Market Y-o-Y Growth Rate Comparison by Insurance Cover (2016-2032)
- Table 58: Western Europe Asia Pacific Travel Insurance Market Share Comparison by Country (2016-2032)
- Table 59: Western Europe Asia Pacific Travel Insurance Market Share Comparison by Coverage Type (2016-2032)
- Table 60: Western Europe Asia Pacific Travel Insurance Market Share Comparison by Distribution Channel (2016-2032)
- Table 61: Western Europe Asia Pacific Travel Insurance Market Share Comparison by End User (2016-2032)
- Table 62: Western Europe Asia Pacific Travel Insurance Market Share Comparison by Insurance Cover (2016-2032)
- Table 63: Eastern Europe Asia Pacific Travel Insurance Market Comparison by Coverage Type (2016-2032)
- Table 64: Eastern Europe Asia Pacific Travel Insurance Market Comparison by Distribution Channel (2016-2032)
- Table 65: Eastern Europe Asia Pacific Travel Insurance Market Comparison by End User (2016-2032)
- Table 66: Eastern Europe Asia Pacific Travel Insurance Market Comparison by Insurance Cover (2016-2032)
- Table 67: Eastern Europe Asia Pacific Travel Insurance Market Revenue (US$ Mn) Comparison by Country (2016-2032)
- Table 68: Eastern Europe Asia Pacific Travel Insurance Market Revenue (US$ Mn) (2016-2032)
- Table 69: Eastern Europe Asia Pacific Travel Insurance Market Revenue (US$ Mn) Comparison by Country (2016-2032)
- Table 70: Eastern Europe Asia Pacific Travel Insurance Market Revenue (US$ Mn) Comparison by Coverage Type (2016-2032)
- Table 71: Eastern Europe Asia Pacific Travel Insurance Market Revenue (US$ Mn) Comparison by Distribution Channel (2016-2032)
- Table 72: Eastern Europe Asia Pacific Travel Insurance Market Revenue (US$ Mn) Comparison by End User (2016-2032)
- Table 73: Eastern Europe Asia Pacific Travel Insurance Market Revenue (US$ Mn) Comparison by Insurance Cover (2016-2032)
- Table 74: Eastern Europe Asia Pacific Travel Insurance Market Y-o-Y Growth Rate Comparison by Country (2016-2032)
- Table 75: Eastern Europe Asia Pacific Travel Insurance Market Y-o-Y Growth Rate Comparison by Coverage Type (2016-2032)
- Table 76: Eastern Europe Asia Pacific Travel Insurance Market Y-o-Y Growth Rate Comparison by Distribution Channel (2016-2032)
- Table 77: Eastern Europe Asia Pacific Travel Insurance Market Y-o-Y Growth Rate Comparison by End User (2016-2032)
- Table 78: Eastern Europe Asia Pacific Travel Insurance Market Y-o-Y Growth Rate Comparison by Insurance Cover (2016-2032)
- Table 79: Eastern Europe Asia Pacific Travel Insurance Market Share Comparison by Country (2016-2032)
- Table 80: Eastern Europe Asia Pacific Travel Insurance Market Share Comparison by Coverage Type (2016-2032)
- Table 81: Eastern Europe Asia Pacific Travel Insurance Market Share Comparison by Distribution Channel (2016-2032)
- Table 82: Eastern Europe Asia Pacific Travel Insurance Market Share Comparison by End User (2016-2032)
- Table 83: Eastern Europe Asia Pacific Travel Insurance Market Share Comparison by Insurance Cover (2016-2032)
- Table 84: Asia Pacific Travel Insurance Market Comparison by Coverage Type (2016-2032)
- Table 85: Asia Pacific Travel Insurance Market Comparison by Distribution Channel (2016-2032)
- Table 86: Asia Pacific Travel Insurance Market Comparison by End User (2016-2032)
- Table 87: Asia Pacific Travel Insurance Market Comparison by Insurance Cover (2016-2032)
- Table 88: Asia Pacific Travel Insurance Market Revenue (US$ Mn) Comparison by Country (2016-2032)
- Table 89: Asia Pacific Travel Insurance Market Revenue (US$ Mn) (2016-2032)
- Table 90: Asia Pacific Travel Insurance Market Revenue (US$ Mn) Comparison by Country (2016-2032)
- Table 91: Asia Pacific Travel Insurance Market Revenue (US$ Mn) Comparison by Coverage Type (2016-2032)
- Table 92: Asia Pacific Travel Insurance Market Revenue (US$ Mn) Comparison by Distribution Channel (2016-2032)
- Table 93: Asia Pacific Travel Insurance Market Revenue (US$ Mn) Comparison by End User (2016-2032)
- Table 94: Asia Pacific Travel Insurance Market Revenue (US$ Mn) Comparison by Insurance Cover (2016-2032)
- Table 95: Asia Pacific Travel Insurance Market Y-o-Y Growth Rate Comparison by Country (2016-2032)
- Table 96: Asia Pacific Travel Insurance Market Y-o-Y Growth Rate Comparison by Coverage Type (2016-2032)
- Table 97: Asia Pacific Travel Insurance Market Y-o-Y Growth Rate Comparison by Distribution Channel (2016-2032)
- Table 98: Asia Pacific Travel Insurance Market Y-o-Y Growth Rate Comparison by End User (2016-2032)
- Table 99: Asia Pacific Travel Insurance Market Y-o-Y Growth Rate Comparison by Insurance Cover (2016-2032)
- Table 100: Asia Pacific Travel Insurance Market Share Comparison by Country (2016-2032)
- Table 101: Asia Pacific Travel Insurance Market Share Comparison by Coverage Type (2016-2032)
- Table 102: Asia Pacific Travel Insurance Market Share Comparison by Distribution Channel (2016-2032)
- Table 103: Asia Pacific Travel Insurance Market Share Comparison by End User (2016-2032)
- Table 104: Asia Pacific Travel Insurance Market Share Comparison by Insurance Cover (2016-2032)
- Table 105: Latin America Asia Pacific Travel Insurance Market Comparison by Coverage Type (2016-2032)
- Table 106: Latin America Asia Pacific Travel Insurance Market Comparison by Distribution Channel (2016-2032)
- Table 107: Latin America Asia Pacific Travel Insurance Market Comparison by End User (2016-2032)
- Table 108: Latin America Asia Pacific Travel Insurance Market Comparison by Insurance Cover (2016-2032)
- Table 109: Latin America Asia Pacific Travel Insurance Market Revenue (US$ Mn) Comparison by Country (2016-2032)
- Table 110: Latin America Asia Pacific Travel Insurance Market Revenue (US$ Mn) (2016-2032)
- Table 111: Latin America Asia Pacific Travel Insurance Market Revenue (US$ Mn) Comparison by Country (2016-2032)
- Table 112: Latin America Asia Pacific Travel Insurance Market Revenue (US$ Mn) Comparison by Coverage Type (2016-2032)
- Table 113: Latin America Asia Pacific Travel Insurance Market Revenue (US$ Mn) Comparison by Distribution Channel (2016-2032)
- Table 114: Latin America Asia Pacific Travel Insurance Market Revenue (US$ Mn) Comparison by End User (2016-2032)
- Table 115: Latin America Asia Pacific Travel Insurance Market Revenue (US$ Mn) Comparison by Insurance Cover (2016-2032)
- Table 116: Latin America Asia Pacific Travel Insurance Market Y-o-Y Growth Rate Comparison by Country (2016-2032)
- Table 117: Latin America Asia Pacific Travel Insurance Market Y-o-Y Growth Rate Comparison by Coverage Type (2016-2032)
- Table 118: Latin America Asia Pacific Travel Insurance Market Y-o-Y Growth Rate Comparison by Distribution Channel (2016-2032)
- Table 119: Latin America Asia Pacific Travel Insurance Market Y-o-Y Growth Rate Comparison by End User (2016-2032)
- Table 120: Latin America Asia Pacific Travel Insurance Market Y-o-Y Growth Rate Comparison by Insurance Cover (2016-2032)
- Table 121: Latin America Asia Pacific Travel Insurance Market Share Comparison by Country (2016-2032)
- Table 122: Latin America Asia Pacific Travel Insurance Market Share Comparison by Coverage Type (2016-2032)
- Table 123: Latin America Asia Pacific Travel Insurance Market Share Comparison by Distribution Channel (2016-2032)
- Table 124: Latin America Asia Pacific Travel Insurance Market Share Comparison by End User (2016-2032)
- Table 125: Latin America Asia Pacific Travel Insurance Market Share Comparison by Insurance Cover (2016-2032)
- Table 126: Middle East & Africa Asia Pacific Travel Insurance Market Comparison by Coverage Type (2016-2032)
- Table 127: Middle East & Africa Asia Pacific Travel Insurance Market Comparison by Distribution Channel (2016-2032)
- Table 128: Middle East & Africa Asia Pacific Travel Insurance Market Comparison by End User (2016-2032)
- Table 129: Middle East & Africa Asia Pacific Travel Insurance Market Comparison by Insurance Cover (2016-2032)
- Table 130: Middle East & Africa Asia Pacific Travel Insurance Market Revenue (US$ Mn) Comparison by Country (2016-2032)
- Table 131: Middle East & Africa Asia Pacific Travel Insurance Market Revenue (US$ Mn) (2016-2032)
- Table 132: Middle East & Africa Asia Pacific Travel Insurance Market Revenue (US$ Mn) Comparison by Country (2016-2032)
- Table 133: Middle East & Africa Asia Pacific Travel Insurance Market Revenue (US$ Mn) Comparison by Coverage Type (2016-2032)
- Table 134: Middle East & Africa Asia Pacific Travel Insurance Market Revenue (US$ Mn) Comparison by Distribution Channel (2016-2032)
- Table 135: Middle East & Africa Asia Pacific Travel Insurance Market Revenue (US$ Mn) Comparison by End User (2016-2032)
- Table 136: Middle East & Africa Asia Pacific Travel Insurance Market Revenue (US$ Mn) Comparison by Insurance Cover (2016-2032)
- Table 137: Middle East & Africa Asia Pacific Travel Insurance Market Y-o-Y Growth Rate Comparison by Country (2016-2032)
- Table 138: Middle East & Africa Asia Pacific Travel Insurance Market Y-o-Y Growth Rate Comparison by Coverage Type (2016-2032)
- Table 139: Middle East & Africa Asia Pacific Travel Insurance Market Y-o-Y Growth Rate Comparison by Distribution Channel (2016-2032)
- Table 140: Middle East & Africa Asia Pacific Travel Insurance Market Y-o-Y Growth Rate Comparison by End User (2016-2032)
- Table 141: Middle East & Africa Asia Pacific Travel Insurance Market Y-o-Y Growth Rate Comparison by Insurance Cover (2016-2032)
- Table 142: Middle East & Africa Asia Pacific Travel Insurance Market Share Comparison by Country (2016-2032)
- Table 143: Middle East & Africa Asia Pacific Travel Insurance Market Share Comparison by Coverage Type (2016-2032)
- Table 144: Middle East & Africa Asia Pacific Travel Insurance Market Share Comparison by Distribution Channel (2016-2032)
- Table 145: Middle East & Africa Asia Pacific Travel Insurance Market Share Comparison by End User (2016-2032)
- Table 146: Middle East & Africa Asia Pacific Travel Insurance Market Share Comparison by Insurance Cover (2016-2032)
- 1. Executive Summary
-
- American International Group Inc.
- Allianz Group
- ACE
- Munich Re
- Tokio Marine Holdings
- China Pacific Insurance Company
- Bajaj Finserv
- Ping An Insurance Company of China
- Dongbu Group
- MS&AD Insurance Group
- Sompo Japan
- Nipponkoa
- CPIC
Our Clients


View Our Licence Options
