Global Armored Vehicle Market By Product(Combat Vehicles, Combat Support), By Type(Electric Armored Vehicles, Conventional Armored Vehicles), By Mobility(Wheeled, Tracked), By Mode of Operation(Manned Armored Vehicles, Unmanned Armored Vehicles), By Point of Sale(OEM, Retrofit), By System(Engines, Drive Systems, Ballistic Armor, Fire Control Systems (FCS), Navigation Systems), By Region And Companies - Industry Segment Outlook, Market Assessment, Competition Scenario, Trends, And Forecast 2024-2033
-
47965
-
June 2024
-
300
-


-
This report was compiled by Research Team Research team of over 50 passionate professionals leverages advanced research methodologies and analytical expertise to deliver insightful, data-driven market intelligence that empowers businesses across diverse industries to make strategic, well-informed Correspondence Research Team Linkedin | Detailed Market research Methodology Our methodology involves a mix of primary research, including interviews with leading mental health experts, and secondary research from reputable medical journals and databases. View Detailed Methodology Page
-
Quick Navigation
- Report Overview
- Key Takeaways
- Driving factors
- Restraining Factors
- By Product Analysis
- By Type Analysis
- By Mobility Analysis
- By Mode of Operation Analysis
- By Point of Sale Analysis
- By System Analysis
- Key Market Segments
- Growth Opportunity
- Latest Trends
- Regional Analysis
- Key Players Analysis
- Recent Development
- Report Scope
Report Overview
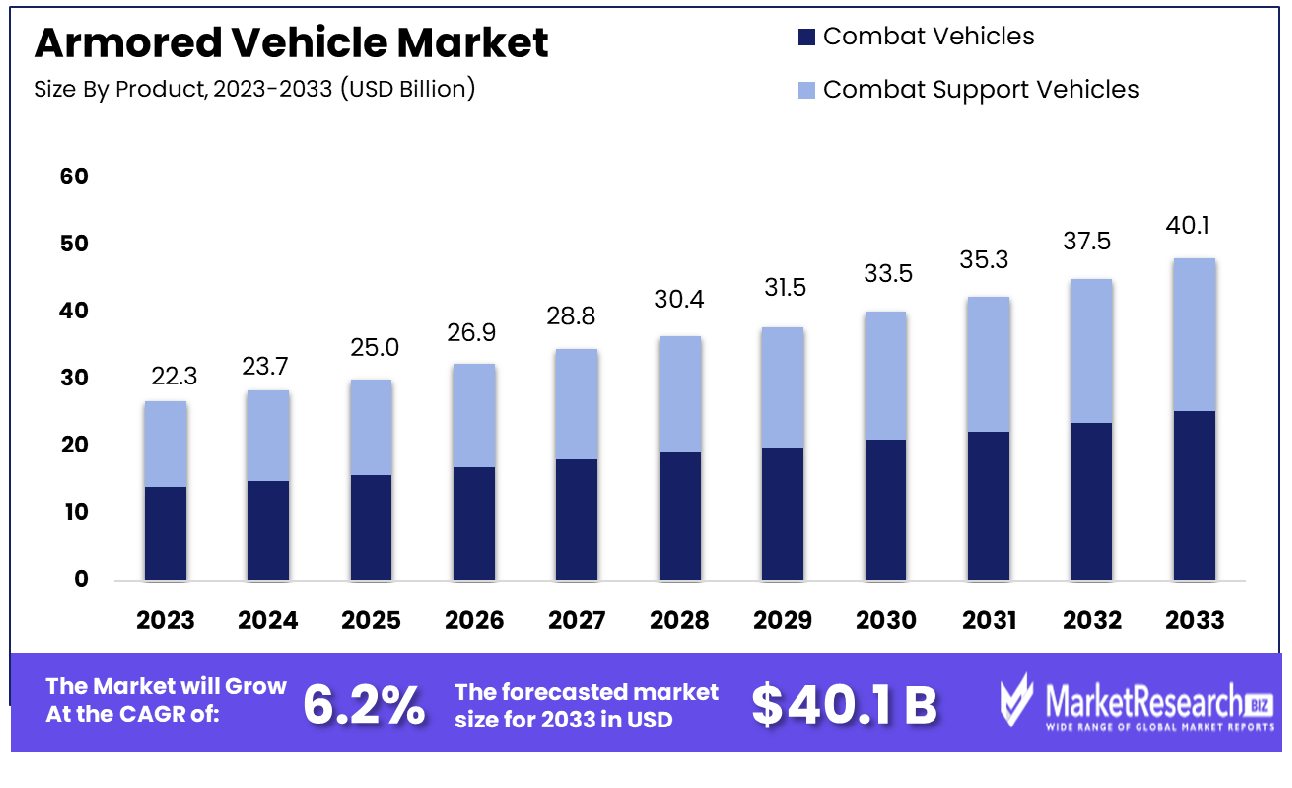
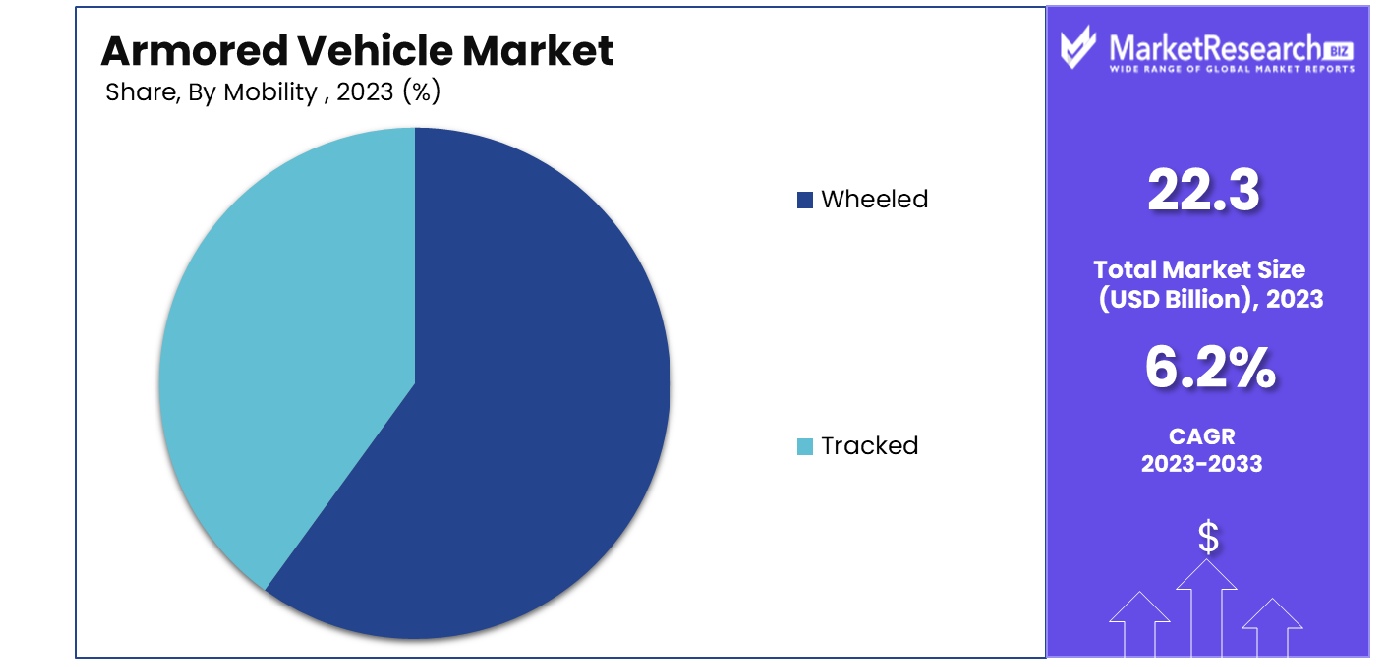
The Global Armored Vehicle Market was valued at USD 22.3 billion in 2023. It is expected to reach USD 40.1 billion by 2033, with a CAGR of 6.2% during the forecast period from 2024 to 2033.
The armored vehicle market encompasses the production and sale of vehicles specifically designed to provide enhanced defense against ballistic threats and explosive devices. These vehicles are integral to military operations, law enforcement missions, and the safeguarding of VIPs. The market includes a range of products such as tanks, armored personnel carriers, and armored cars, tailored to the needs of governmental and private entities.
The growth of this market can be attributed to increasing global security threats and the necessity for advanced protective solutions in conflict zones. Key drivers include technological advancements, rising defense budgets, and heightened demand for security in regions experiencing political instability.
The armored vehicle market is witnessing significant growth, driven by escalating global security concerns and technological advancements in defense capabilities. This market sector encompasses a broad array of vehicles designed for ballistic protection and enhanced safety in conflict zones, including battle tanks, armored personnel carriers, and customized protective vehicles for VIPs and law enforcement use.
A notable driver of this expansion is the marked increase in arms imports by Middle Eastern countries, which have surged by 103% from 2008 to 2012, and by an identical margin from 2013 to 2017. This surge is largely a response to persistent regional conflicts and heightened security necessities, necessitating substantial investments in armored vehicles.
Additionally, the Asia Pacific region is also showing robust growth in defense expenditure, with projections indicating a compound annual growth rate (CAGR) of 5% from $13 billion in 2023 to $15.8 billion by 2027. This increase in defense budgets is likely to catalyze further development and procurement in the armored vehicle sector, as nations invest heavily in modernizing their military and security fleets to address both domestic and cross-border threats.
The combined impact of these factors is fostering a conducive environment for the growth of the armored vehicle market. Manufacturers and defense contractors are therefore expected to experience a surge in demand, prompting them to innovate and expand their offerings to meet the sophisticated requirements of today's military and security forces. This market's trajectory suggests a sustained period of growth, underpinned by continuous technological enhancements and geopolitical factors driving defense spending worldwide.
Key Takeaways
- Market Growth: The Global Armored Vehicle Market was valued at USD 22.3 billion in 2023. It is expected to reach USD 40.1 billion by 2033, with a CAGR of 6.2% during the forecast period from 2024 to 2033.
- By Product: Combat vehicles dominated the product segment with a 65% market share.
- By Type: Conventional armored vehicles led the type category, capturing 97% dominance.
- By Mobility: Wheeled vehicles prevailed in mobility, commanding a 71% market majority.
- By Mode of Operation: Manned armored vehicles dominated operation modes with a 77% market share.
- By Point of Sale: Original Equipment Manufacturers (OEM) led sales, holding a 79% dominance.
- By System: Fire Control Systems led systems with a 32% market share.
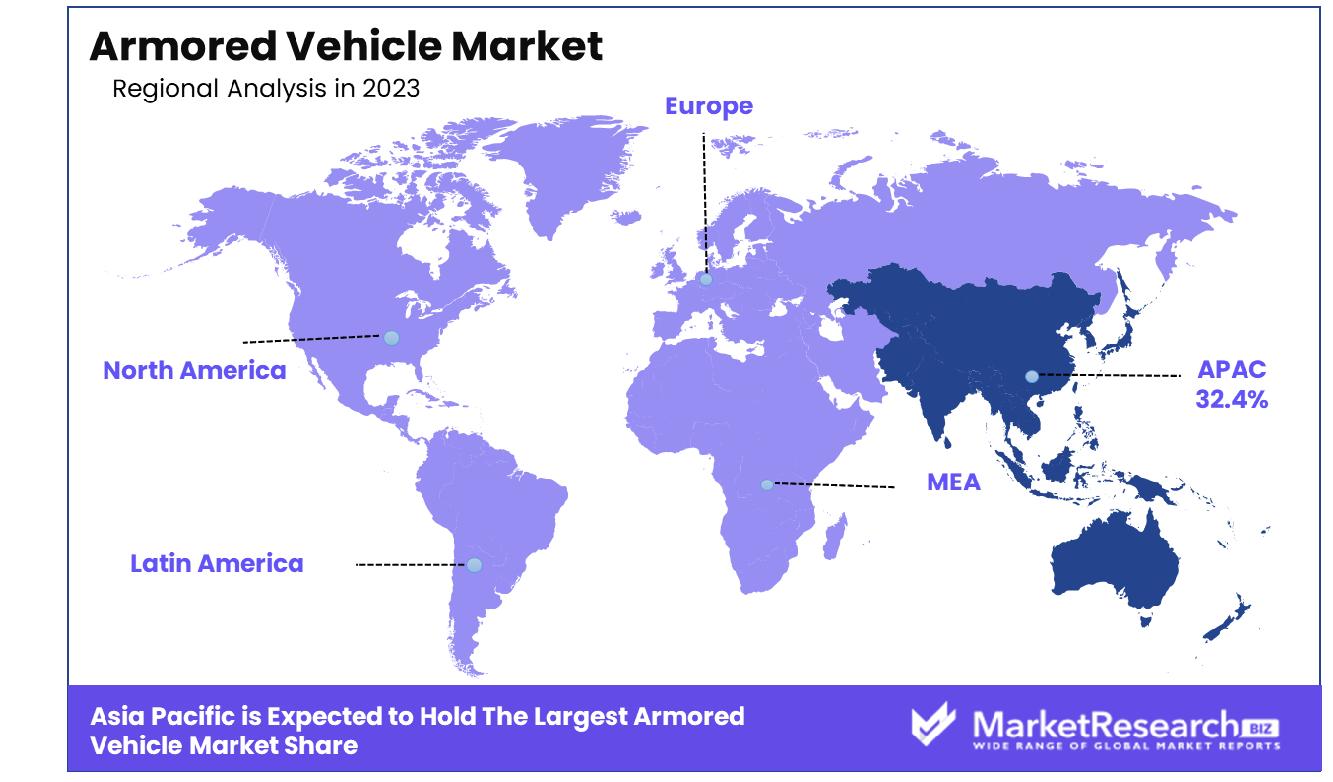
- Regional Dominance: Asia Pacific holds 32.4% of the global armored vehicle market.
- Growth Opportunity: In 2023, the global armored vehicle market is set to grow, driven by increased counter-terrorism operations and demand from commercial security services for enhanced protective transportation.
Driving factors
Rising Defense Spending in Combat Vehicles
The acceleration of global defense budgets, specifically allocated to combat vehicles, is a critical driver for the armored vehicle market. This trend is spurred by the intensifying geopolitical tensions and the need for modernized military equipment across nations. As defense spending increases, there is a direct correlation to the expansion of the armored vehicle sector.
For instance, countries like the United States and China have significantly upped their defense budgets to enhance their military capabilities, including the procurement of advanced armored vehicles. This financial influx not only supports the demand for new units but also the upgrade of existing fleets, thereby propelling market growth.
Increasing Demand for Armored Vehicles to Tackle Cross-border Conflicts
The persistent threat of cross-border conflicts has necessitated the deployment of robust defense mechanisms, notably through the acquisition of armored vehicles. These vehicles play a pivotal role in safeguarding borders and ensuring national security.
The demand is particularly pronounced in regions experiencing active conflicts or geopolitical instabilities, such as Eastern Europe and the Asia-Pacific. The armored vehicles equipped for these scenarios are often customized with reinforced protection and enhanced offensive capabilities, driving their demand and subsequent market growth.
Integration of Advanced Sensors, Communication Systems, and AI-driven Analytics
The integration of cutting-edge technologies such as advanced sensors, sophisticated communication systems, and AI-driven analytics into armored vehicles represents a transformative trend in the market. These technologies enhance the operational efficiency, survivability, and connectivity of armored vehicles, making them more effective in modern warfare scenarios.
For example, AI-driven analytics can predict maintenance needs and optimize routes to avoid threats, while advanced sensors provide critical situational awareness. This technological evolution not only extends the operational capabilities of these vehicles but also increases their market attractiveness, leading to broader adoption and growth in the sector.
Restraining Factors
Threat of Medium-density Fiberboard (MDF) as a Substitute
The emergence of Medium-density Fiberboard (MDF) as a substitute material in certain applications traditionally served by armored vehicles poses a unique challenge to the market's expansion. MDF, known for its cost-effectiveness and versatility in manufacturing, is increasingly considered for military infrastructure and less critical vehicle components, where heavy armor might not be necessary.
This shift could potentially reduce the demand for traditionally manufactured armored vehicles, as defense budgets may favor more cost-effective solutions for non-combat purposes. However, the actual impact on the armored vehicle market is limited by MDF's unsuitability for frontline combat roles, where the protection and durability of traditional armored vehicles remain paramount.
Higher Production Costs
The production of armored vehicles involves high costs due to the sophisticated materials and technologies required to meet modern warfare standards. The incorporation of advanced armor materials, enhanced weaponry systems, and state-of-the-art communication tools significantly drives up manufacturing expenses.
Additionally, the ongoing innovation in vehicle defense systems necessitates continuous investment in research and development, further escalating costs. These high production costs can limit market growth by increasing the final product prices, potentially restraining purchase volumes, especially among nations with more constrained defense budgets.
By Product Analysis
In the product category, combat vehicles command a significant 65% share of the market sector.
In 2023, Combat Vehicles held a dominant market position in the "By Product" segment of the Armored Vehicle Market, capturing more than a 65% share. This category includes diverse sub-segments such as Armored Personnel Carriers (APCs), Infantry Fighting Vehicles (IFVs), Light Protected Vehicles (LPVs), Main Battle Tanks (MBTs), Mine-resistant Ambush Protected vehicles (MRAPs), Tactical Vehicles, and others. Among these, Main Battle Tanks and Infantry Fighting Vehicles are noteworthy for their substantial contribution to market growth, driven by heightened global military expenditures and escalating geopolitical tensions.
Armored Personnel Carriers have also seen a surge in demand, particularly for models offering enhanced mobility and advanced protective features. This reflects an ongoing strategic shift by defense forces worldwide to upgrade their transport capabilities and ensure troop safety in conflict zones.
The segment of Combat Support Vehicles, which encompasses Armored Supply Trucks, Armored Command & Control Vehicles, Repair & Recovery Vehicles, and Unmanned Armored Ground Vehicles, also plays a crucial role. Although it holds a smaller market share compared to Combat Vehicles, the demand for these units is propelled by the increasing complexity of military operations which require robust logistics support and command efficiency.
Technological advancements are significantly influencing the armored vehicle market. Innovations such as unmanned systems, enhanced armor materials, and networked communication tools are becoming key differentiators. Moreover, the integration of hybrid drivetrains and the emphasis on reduced operational costs are emerging trends that are expected to shape future market dynamics.
By Type Analysis
Conventional armored vehicles hold a dominant position in type, accounting for 97% of the market presence.
In 2023, Conventional Armored Vehicles held a dominant market position in the "By Type" segment of the Armored Vehicle Market, capturing more than a 97% share. This segment primarily encompasses vehicles powered by traditional combustion engines, which continue to be preferred due to their reliability, long-range capabilities, and established supply chains. Conventional Armored Vehicles include a broad range of mobility solutions from heavily armored battle tanks to lighter, more agile reconnaissance vehicles, which are critical in various military operations.
Despite the growing interest in sustainable and innovative technologies, the penetration of Electric Armored Vehicles remains relatively low, accounting for a small portion of the market. Electric Armored Vehicles face several challenges that restrict their widespread adoption, including limitations in battery technology, concerns over operational range, and higher initial investment costs. However, they represent a forward-thinking approach with potential benefits such as reduced noise levels, lower thermal signatures, and decreased long-term operational costs, aligning with future strategic defense goals focused on sustainability and technological integration.
The dominance of Conventional Armored Vehicles is supported by ongoing global military modernization programs, where nations are investing heavily in upgrading their fleets with enhanced protective features, firepower, and mobility. This trend is driven by escalating security concerns and the need to maintain a technological edge in armored warfare.
As the market evolves, the segment for Electric Armored Vehicles is expected to grow, driven by advancements in electric drivetrain technologies and increasing environmental regulations. However, for the foreseeable future, Conventional Armored Vehicles are likely to maintain their lead, underscored by their proven performance and strategic utility in global defense scenarios.
By Mobility Analysis
Wheeled vehicles lead the mobility segment, comprising 71% of the total market distribution.
In 2023, Wheeled vehicles held a dominant market position in the "By Mobility" segment of the Armored Vehicle Market, capturing more than a 71% share. This segment encompasses vehicles that are designed for versatility and rapid deployment across varied terrains. Wheeled armored vehicles, including armored personnel carriers, reconnaissance vehicles, and infantry fighting vehicles, are favored for their high mobility, speed, and reduced maintenance costs compared to their tracked counterparts.
Tracked vehicles, while essential for certain operations requiring heavy armor and all-terrain capabilities, represent a smaller portion of the market. These vehicles are typically deployed in environments where wheeled vehicles might struggle, such as rugged terrain or areas with severe infrastructural limitations. Tracked armored vehicles are pivotal in operations that demand durability and high performance under extreme conditions.
The predominance of wheeled vehicles is attributed to their adaptability in most conflict scenarios, where roads and prepared surfaces are available. They are quicker to deploy and easier to maintain, which significantly reduces operational costs and enhances logistical efficiency. This mobility type aligns well with the modern military strategy that often requires rapid response and high-speed maneuvers.
As defense forces globally continue to emphasize strategic mobility and logistical efficiency, the demand for wheeled armored vehicles is expected to remain strong. Innovations in wheel technology and vehicle design are enhancing their operational range and protective capabilities, ensuring that they meet the evolving requirements of modern warfare while maintaining a substantial market share.
By Mode of Operation Analysis
Manned armored vehicles predominate in the mode of operation segment, representing 77% of the sector.
In 2023, Manned Armored Vehicles held a dominant market position in the "By Mode of Operation" segment of the Armored Vehicle Market, capturing more than a 77% share. This category includes vehicles that require human operators for their functioning, spanning a wide range from main battle tanks to light armored vehicles. These vehicles are integral to conventional military operations, offering direct human oversight, which is crucial for complex combat scenarios where human judgment and adaptability are paramount.
Unmanned Armored Vehicles, although they represent a smaller fraction of the market, are an emerging segment demonstrating significant growth potential. These vehicles are designed to operate autonomously or be remotely controlled, reducing the risk to human life and expanding the capabilities of armed forces in hazardous environments. They are increasingly used for surveillance, reconnaissance, and combat roles where manned vehicle deployment is either risky or impractical.
The dominance of Manned Armored Vehicles can be attributed to their proven effectiveness in a wide range of military operations and the existing infrastructure and training protocols that support their deployment. However, advancements in technology and increasing investments in artificial intelligence are likely to boost the growth of the Unmanned Armored Vehicles segment. The trend towards automation and the integration of advanced sensors and communication systems in armored vehicles are expected to enhance their operational capabilities, making them an indispensable part of future combat scenarios.
By Point of Sale Analysis
Original Equipment Manufacturers (OEMs) predominantly control the point of sale category with a 79% market share.
In 2023, Original Equipment Manufacturers (OEMs) held a dominant market position in the "By Point of Sale" segment of the Armored Vehicle Market, capturing more than a 79% share. This segment includes vehicles that are sold directly from manufacturers to military and law enforcement agencies, equipped with the latest technology and specifications tailored for modern combat and security operations. OEMs deliver vehicles that meet the specific demands of armed forces, incorporating advanced armor protection, firepower, and mobility right from the production line.
The Retrofit segment, while smaller, is significant and caters to updating older vehicles with modern systems and protections. Retrofits allow for the extension of service life and enhancement of older fleet capabilities, aligning them with current operational requirements without the need for entirely new vehicles. This segment is particularly appealing in budget-constrained environments or where legacy platforms have a strategic value that can be preserved through upgrades.
The predominance of the OEM segment is driven by continuous innovations in armored vehicle technology, including hybrid drivetrains, improved ballistic protection, and integrated command and control systems. These advancements make new OEM vehicles more attractive for defense procurers looking for ready-to-deploy solutions that conform to the latest safety and efficiency standards.
Looking ahead, the growth in the OEM sector is expected to continue robustly, fueled by increasing global security challenges and the continuous evolution of military tactics that require state-of-the-art armored vehicles. However, the retrofit market is also poised to expand as nations seek cost-effective methods to maintain and enhance their existing vehicular assets amid growing fiscal pressures.
By System Analysis
In the system category, Fire Control Systems (FCS) secure a leading share of 32%, highlighting diverse system preferences.
In 2023, Fire Control Systems (FCS) held a dominant market position in the "By System" segment of the Armored Vehicle Market, capturing more than a 32% share. Fire Control Systems are critical components that enhance the accuracy and efficiency of weapons deployed on armored vehicles. These systems integrate a range of sensors, targeting mechanisms, and onboard computing power to ensure that armament systems can effectively engage targets with high precision.
Other critical systems within the armored vehicle market include Engines, Drive Systems, Ballistic Armor, and Navigation Systems. Engines and Drive Systems form the backbone of vehicle mobility and are essential for ensuring that armored vehicles can operate in diverse and challenging terrains. Ballistic Armor is fundamental for protecting vehicle occupants from threats and enhancing survivability in hostile environments. Navigation Systems, incorporating advanced GPS and other location-tracking technologies, are crucial for the strategic maneuvering of these vehicles during missions.
The prominence of Fire Protection Systems can be attributed to the increasing sophistication of modern warfare, which demands greater precision and efficiency in combat scenarios. The integration of advanced optics, thermal imaging, and laser range-finding technology within FCS has significantly improved the combat capabilities of armored vehicles, making them more lethal and effective on the battlefield.
As military engagements become more technologically driven, the demand for sophisticated Fire Control Systems is expected to grow, reflecting ongoing advancements in military technology and the critical need for precision in armament systems. This trend underscores the importance of continuous innovation in the development of FCS to maintain operational superiority in complex combat situations.
Key Market Segments
By Product
- Combat Vehicles
- Armored Personnel Carrier (APC)
- Infantry Fighting Vehicles (IFV)
- Light Protected Vehicles (LPV)
- Main Battle Tanks (MBT)
- Mine-resistant Ambush Protected (MRAP)
- Tactical Vehicle
- Others- Combat Support Vehicles
- Armored Supply Trucks
- Armored Command & Control Vehicles
- Repair & Recovery Vehicles
- Unmanned Armored Ground VehiclesBy Type
- Electric Armored Vehicles
- Conventional Armored Vehicles
By Mobility
- Wheeled
- Tracked
By Mode of Operation
- Manned Armored Vehicles
- Unmanned Armored Vehicles
By Point of Sale
- OEM
- Retrofit
By System
- Engines
- Drive Systems
- Ballistic Armor
- Fire Control Systems (FCS)
- Navigation Systems
Growth Opportunity
Opportunities in the Global Armored Vehicle Market for Counter-Terrorism Operations
In 2023, the global armored vehicle market is poised to experience significant growth, primarily driven by escalating counter-terrorism operations. The increasing frequency and complexity of terrorist attacks globally necessitate advanced, robust armored vehicles capable of withstanding severe threats.
Governments are intensifying investments in defense and security, with a marked preference for vehicles that offer enhanced protection, agility, and advanced technological integrations such as improved surveillance systems and unmanned operational capabilities. This trend is expected to catalyze substantial market expansion, as nations strive to fortify their counter-terrorism units and safeguard national security.
Commercial Security Services and the Armored Vehicle Market
The realm of commercial security services presents a burgeoning opportunity for the armored vehicle market in 2023. With the rise in threats to personal and corporate security, there is a growing demand for armored vehicles that provide a high level of protection for executives, high-net-worth individuals, and sensitive cargo. The evolution of urban security concerns, including the need for vehicles capable of navigating complex city landscapes while ensuring safety, drives this demand.
Additionally, the adoption of armored vehicles by private security firms is expected to accelerate, supported by advancements in vehicle technology that offer both security and comfort without compromising on performance. This dual requirement fuels innovation and customization in the sector, creating a thriving market environment.
Latest Trends
Multi-Layered Defense Strategies in the Global Armored Vehicle Market
The global armored vehicle market in 2023 is increasingly characterized by the implementation of multi-layered defense strategies. This approach integrates various defensive technologies to enhance the survivability of armored vehicles in hostile environments. Key elements include advanced armor composites, active protection systems, and sophisticated electronic warfare capabilities that collectively enhance threat detection, avoidance, and neutralization.
The trend toward modular designs in armor allows for rapid adaptation to different threat levels, significantly enhancing the operational flexibility and effectiveness of these vehicles in various combat scenarios. This strategic depth in defense is crucial for modern warfare and peacekeeping missions, driving the evolution of armored vehicles to new standards of security and resilience.
Adoption of Lightweight and Ultra-High-Strength Materials
In 2023, the armored vehicle market is witnessing a transformative shift towards the use of lightweight and ultra-high-strength materials. This trend is driven by the dual demands of enhanced mobility and superior ballistic protection. Materials such as advanced high-strength steel, aluminum alloys, ceramics, and composite materials are being increasingly employed to reduce the overall weight of vehicles while maintaining, or even enhancing their protective capabilities.
The reduction in weight not only improves fuel efficiency and speed but also increases the vehicles' range and maneuverability, crucial for both combat and urban deployment. This shift not only reflects the ongoing technological advancements but also aligns with the broader defense objectives of modernizing and streamlining military assets for rapid and efficient response capabilities.
Regional Analysis
The Asia Pacific armored vehicle market commands a substantial 32.4% share, driven by escalating regional tensions.
The global armored vehicle market exhibits significant regional segmentation, reflecting varied geopolitical dynamics, defense spending, and security needs. In 2023, Asia Pacific emerged as the dominating region, holding a substantial market share of 32.4%. This dominance is attributed to heightened border tensions and internal security challenges in several countries, driving robust demand for armored vehicles. Increasing defense budgets in nations such as China and India further fuel this demand, supporting both domestic production and imports of advanced armored vehicle technologies.
North America also represents a key segment in the armored vehicle market, driven by consistent investments in military and defense infrastructures, particularly in the United States, which has a longstanding history of deploying armored vehicles in international peacekeeping and military operations. Europe's market is bolstered by rising security concerns amid geopolitical tensions, leading to renewed investments in defense sectors across NATO countries.
In contrast, the Middle East & Africa region shows a dynamic growth trajectory, propelled by ongoing regional conflicts and the need for mobile-protected firepower. Countries like Saudi Arabia and the UAE are ramping up their defense arsenals with modern armored vehicles as part of their military modernization programs.
Latin America, though smaller in comparison, is experiencing incremental growth due to increasing political instability and security concerns, which necessitate enhanced protective measures for law enforcement and security personnel.
Key Regions and Countries
North America
- The US
- Canada
- Rest of North America
Europe
- Germany
- France
- The UK
- Spain
- Netherlands
- Russia
- Italy
- Rest of Europe
Asia-Pacific
- China
- Japan
- Singapore
- Thailand
- South Korea
- Vietnam
- India
- New Zealand
- Rest of Asia Pacific
Latin America
- Mexico
- Brazil
- Rest of Latin America
Middle East & Africa
- Saudi Arabia
- South Africa
- UAE
- Rest of Middle East & Africa
Key Players Analysis
In 2023, the global armored vehicle market will be significantly influenced by strategic activities and technological advancements from leading companies. Among these, BAE Systems (U.K.) and General Dynamics Corporation (U.S.) are notable for their comprehensive portfolios and persistent innovation in armored vehicle technologies.
BAE Systems, with its expertise in combat vehicles, continues to expand its global footprint through new contracts and updates to existing vehicle platforms. Similarly, General Dynamics Corporation remains a key player due to its strong focus on incorporating advanced defense technologies and securing substantial contracts from the U.S. government and other nations.
Rheinmetall AG (Germany) and Krauss-Maffei Wegmann GmbH (Germany) are pivotal in driving the European market, primarily through their cutting-edge designs and modular approaches to armored vehicles, catering effectively to both local and international demands. Their focus on integrating digital technologies and active protection systems sets them apart in the European sector.
In emerging markets, companies like Denel SOC Ltd (South Africa) and NORINCOGROUP.com Inc. (China) play crucial roles. Denel continues to innovate in mine-resistant vehicles, while NORINCO expands its influence in Asia with cost-effective solutions that appeal to a broad range of clients in developing nations.
Additionally, IVECO DEFENCE VEHICLES (Italy) and Otokar (Turkey) underscore their regional dominance by focusing on customization and flexibility, adapting to varied terrain and operational requirements. Oshkosh Defense, LLC (U.S.), known for its tactical vehicles like the JLTV, and Textron Systems (U.S.), with its focus on drones and networked battlefield operations, both enhance the market through diversified offerings and advanced warfare technologies.
Market Key Players
- BAE Systems (U.K.)
- General Dynamics Corporation (U.S.)
- Rheinmetall AG (Germany)
- Krauss-Maffei Wegmann GmbH (Germany)
- Denel SOC Ltd (South Africa)
- IVECO DEFENCE VEHICLES (Italy)
- NORINCOGROUP.com Inc. (China)
- Oshkosh Defense, LLC An Oshkosh Corporation Company (U.S.)
- Otokar, a KOC Group Company (Turkey)
- Textron Systems (U.S.)
Recent Development
- In April 2024, GM Defense, in collaboration with the Defense Innovation Unit (DIU), is advancing hybrid electric military vehicle technologies. Rick Kewley, VP of Product Development, discusses their latest R&D efforts on the Aerospace & Defense Technology podcast.
- In September 2023, The SRB Project Consortium nears completion of the design phase for an innovative rotary hydropneumatic shock absorber for armored vehicles. Piedrafita Systems, Repack-S, and IB Fischer CFD + Engineering GmbH collaborate on this revolutionary technology.
Report Scope
Report Features Description Market Value (2023) USD 22.3 Billion Forecast Revenue (2033) USD 40.1 Billion CAGR (2024-2032) 6.2% Base Year for Estimation 2023 Historic Period 2016-2023 Forecast Period 2024-2033 Report Coverage Revenue Forecast, Market Dynamics, COVID-19 Impact, Competitive Landscape, Recent Developments Segments Covered By Product(Combat Vehicles(Armored Personnel Carrier (APC), Infantry Fighting Vehicles (IFV), Light Protected Vehicles (LPV), Main Battle Tanks (MBT), Mine-resistant Ambush Protected (MRAP), Tactical Vehicle, Others), Combat Support Vehicles(Armored Supply Trucks, Armored Command & Control Vehicles, Repair & Recovery Vehicles, Unmanned Armored Ground Vehicles)), By Type(Electric Armored Vehicles, Conventional Armored Vehicles), By Mobility(Wheeled, Tracked), By Mode of Operation(Manned Armored Vehicles, Unmanned Armored Vehicles), By Point of Sale(OEM, Retrofit), By System(Engines, Drive Systems, Ballistic Armor, Fire Control Systems (FCS), Navigation Systems) Regional Analysis North America - The US, Canada, Rest of North America, Europe - Germany, France, The UK, Spain, Italy, Russia, Netherlands, Rest of Europe, Asia-Pacific - China, Japan, South Korea, India, New Zealand, Singapore, Thailand, Vietnam, Rest of Asia Pacific, Latin America - Brazil, Mexico, Rest of Latin America, Middle East & Africa - South Africa, Saudi Arabia, UAE, Rest of Middle East & Africa Competitive Landscape BAE Systems (U.K.), General Dynamics Corporation (U.S.), Rheinmetall AG (Germany), Krauss-Maffei Wegmann GmbH (Germany), Denel SOC ltd (South Africa), IVECO DEFENCE VEHICLES (Italy), NORINCOGROUP.com Inc. (China), Oshkosh Defense, LLC An Oshkosh Corporation Company (U.S.), Otokar, a KOC Group Company (Turkey), Textron Systems (U.S.) Customization Scope Customization for segments, region/country-level will be provided. Moreover, additional customization can be done based on the requirements. Purchase Options We have three licenses to opt for Single User License, Multi-User License (Up to 5 Users), Corporate Use License (Unlimited User and Printable PDF) -
- 1. Executive Summary
- 1.1. Definition
- 1.2. Taxonomy
- 1.3. Research Scope
- 1.4. Key Analysis
- 1.5. Key Findings by Major Segments
- 1.6. Top strategies by Major Players
- 2. Global Armored Vehicle Market Overview
- 2.1. Armored Vehicle Market Dynamics
- 2.1.1. Drivers
- 2.1.2. Opportunities
- 2.1.3. Restraints
- 2.1.4. Challenges
- 2.2. Macro-economic Factors
- 2.3. Regulatory Framework
- 2.4. Market Investment Feasibility Index
- 2.5. PEST Analysis
- 2.6. PORTER’S Five Force Analysis
- 2.7. Drivers & Restraints Impact Analysis
- 2.8. Industry Chain Analysis
- 2.9. Cost Structure Analysis
- 2.10. Marketing Strategy
- 2.11. Russia-Ukraine War Impact Analysis
- 2.12. Opportunity Map Analysis
- 2.13. Market Competition Scenario Analysis
- 2.14. Product Life Cycle Analysis
- 2.15. Opportunity Orbits
- 2.16. Manufacturer Intensity Map
- 2.17. Major Companies sales by Value & Volume
- 2.1. Armored Vehicle Market Dynamics
- 3. Global Armored Vehicle Market Analysis, Opportunity and Forecast, 2016-2032
- 3.1. Global Armored Vehicle Market Analysis, 2016-2021
- 3.2. Global Armored Vehicle Market Opportunity and Forecast, 2023-2032
- 3.3. Global Armored Vehicle Market Analysis, Opportunity and Forecast, By By Product, 2016-2032
- 3.3.1. Global Armored Vehicle Market Analysis by By Product: Introduction
- 3.3.2. Market Size Absolute $ Opportunity Analysis and Forecast, By By Product, 2016-2032
- 3.3.3. Combat Vehicles
- 3.3.3.1. Armored Personnel Carrier (APC)
- 3.3.3.2. Infantry Fighting Vehicles (IFV)
- 3.3.3.3. Light Protected Vehicles (LPV)
- 3.3.3.4. Main Battle Tanks (MBT)
- 3.3.3.5. Mine-resistant Ambush Protected (MRAP), Tactical Vehicle
- 3.3.4. Combat Support Vehicles
- 3.3.4.1. Armored Supply Trucks
- 3.3.4.2. Armored Command & Control Vehicles
- 3.3.4.3. Repair & Recovery Vehicles
- 3.3.4.4. Unmanned Armored Ground Vehicles
- 3.4. Global Armored Vehicle Market Analysis, Opportunity and Forecast, By By Type, 2016-2032
- 3.4.1. Global Armored Vehicle Market Analysis by By Type: Introduction
- 3.4.2. Market Size Absolute $ Opportunity Analysis and Forecast, By By Type, 2016-2032
- 3.4.3. Electric Armored Vehicles
- 3.4.4. Conventional Armored Vehicles
- 3.5. Global Armored Vehicle Market Analysis, Opportunity and Forecast, By By Mobility , 2016-2032
- 3.5.1. Global Armored Vehicle Market Analysis by By Mobility : Introduction
- 3.5.2. Market Size Absolute $ Opportunity Analysis and Forecast, By By Mobility , 2016-2032
- 3.5.3. Wheeled
- 3.5.4. Tracked
- 3.6. Global Armored Vehicle Market Analysis, Opportunity and Forecast, By By Mode of Operation , 2016-2032
- 3.6.1. Global Armored Vehicle Market Analysis by By Mode of Operation : Introduction
- 3.6.2. Market Size Absolute $ Opportunity Analysis and Forecast, By By Mode of Operation , 2016-2032
- 3.6.3. Manned Armored Vehicles
- 3.6.4. Unmanned Armored Vehicles
- 3.7. Global Armored Vehicle Market Analysis, Opportunity and Forecast, By By Point of Sale , 2016-2032
- 3.7.1. Global Armored Vehicle Market Analysis by By Point of Sale : Introduction
- 3.7.2. Market Size Absolute $ Opportunity Analysis and Forecast, By By Point of Sale , 2016-2032
- 3.7.3. OEM
- 3.7.4. Retrofit
- 3.8. Global Armored Vehicle Market Analysis, Opportunity and Forecast, By By System , 2016-2032
- 3.8.1. Global Armored Vehicle Market Analysis by By System : Introduction
- 3.8.2. Market Size Absolute $ Opportunity Analysis and Forecast, By By System , 2016-2032
- 3.8.3. Engines
- 3.8.4. Drive Systems
- 3.8.5. Ballistic Armor
- 3.8.6. Fire Control Systems (FCS)
- 3.8.7. Navigation Systems
- 4. North America Armored Vehicle Market Analysis, Opportunity and Forecast, 2016-2032
- 4.1. North America Armored Vehicle Market Analysis, 2016-2021
- 4.2. North America Armored Vehicle Market Opportunity and Forecast, 2023-2032
- 4.3. North America Armored Vehicle Market Analysis, Opportunity and Forecast, By By Product, 2016-2032
- 4.3.1. North America Armored Vehicle Market Analysis by By Product: Introduction
- 4.3.2. Market Size Absolute $ Opportunity Analysis and Forecast, By By Product, 2016-2032
- 4.3.3. Combat Vehicles
- 4.3.3.1. Armored Personnel Carrier (APC)
- 4.3.3.2. Infantry Fighting Vehicles (IFV)
- 4.3.3.3. Light Protected Vehicles (LPV)
- 4.3.3.4. Main Battle Tanks (MBT)
- 4.3.3.5. Mine-resistant Ambush Protected (MRAP), Tactical Vehicle
- 4.3.4. Combat Support Vehicles
- 4.3.4.1. Armored Supply Trucks
- 4.3.4.2. Armored Command & Control Vehicles
- 4.3.4.3. Repair & Recovery Vehicles
- 4.3.4.4. Unmanned Armored Ground Vehicles
- 4.4. North America Armored Vehicle Market Analysis, Opportunity and Forecast, By By Type, 2016-2032
- 4.4.1. North America Armored Vehicle Market Analysis by By Type: Introduction
- 4.4.2. Market Size Absolute $ Opportunity Analysis and Forecast, By By Type, 2016-2032
- 4.4.3. Electric Armored Vehicles
- 4.4.4. Conventional Armored Vehicles
- 4.5. North America Armored Vehicle Market Analysis, Opportunity and Forecast, By By Mobility , 2016-2032
- 4.5.1. North America Armored Vehicle Market Analysis by By Mobility : Introduction
- 4.5.2. Market Size Absolute $ Opportunity Analysis and Forecast, By By Mobility , 2016-2032
- 4.5.3. Wheeled
- 4.5.4. Tracked
- 4.6. North America Armored Vehicle Market Analysis, Opportunity and Forecast, By By Mode of Operation , 2016-2032
- 4.6.1. North America Armored Vehicle Market Analysis by By Mode of Operation : Introduction
- 4.6.2. Market Size Absolute $ Opportunity Analysis and Forecast, By By Mode of Operation , 2016-2032
- 4.6.3. Manned Armored Vehicles
- 4.6.4. Unmanned Armored Vehicles
- 4.7. North America Armored Vehicle Market Analysis, Opportunity and Forecast, By By Point of Sale , 2016-2032
- 4.7.1. North America Armored Vehicle Market Analysis by By Point of Sale : Introduction
- 4.7.2. Market Size Absolute $ Opportunity Analysis and Forecast, By By Point of Sale , 2016-2032
- 4.7.3. OEM
- 4.7.4. Retrofit
- 4.8. North America Armored Vehicle Market Analysis, Opportunity and Forecast, By By System , 2016-2032
- 4.8.1. North America Armored Vehicle Market Analysis by By System : Introduction
- 4.8.2. Market Size Absolute $ Opportunity Analysis and Forecast, By By System , 2016-2032
- 4.8.3. Engines
- 4.8.4. Drive Systems
- 4.8.5. Ballistic Armor
- 4.8.6. Fire Control Systems (FCS)
- 4.8.7. Navigation Systems
- 4.9. North America Armored Vehicle Market Analysis, Opportunity and Forecast, By Country , 2016-2032
- 4.9.1. North America Armored Vehicle Market Analysis by Country : Introduction
- 4.9.2. Market Size Absolute $ Opportunity Analysis and Forecast, Country , 2016-2032
- 4.9.2.1. The US
- 4.9.2.2. Canada
- 4.9.2.3. Mexico
- 5. Western Europe Armored Vehicle Market Analysis, Opportunity and Forecast, 2016-2032
- 5.1. Western Europe Armored Vehicle Market Analysis, 2016-2021
- 5.2. Western Europe Armored Vehicle Market Opportunity and Forecast, 2023-2032
- 5.3. Western Europe Armored Vehicle Market Analysis, Opportunity and Forecast, By By Product, 2016-2032
- 5.3.1. Western Europe Armored Vehicle Market Analysis by By Product: Introduction
- 5.3.2. Market Size Absolute $ Opportunity Analysis and Forecast, By By Product, 2016-2032
- 5.3.3. Combat Vehicles
- 5.3.3.1. Armored Personnel Carrier (APC)
- 5.3.3.2. Infantry Fighting Vehicles (IFV)
- 5.3.3.3. Light Protected Vehicles (LPV)
- 5.3.3.4. Main Battle Tanks (MBT)
- 5.3.3.5. Mine-resistant Ambush Protected (MRAP), Tactical Vehicle
- 5.3.4. Combat Support Vehicles
- 5.3.4.1. Armored Supply Trucks
- 5.3.4.2. Armored Command & Control Vehicles
- 5.3.4.3. Repair & Recovery Vehicles
- 5.3.4.4. Unmanned Armored Ground Vehicles
- 5.4. Western Europe Armored Vehicle Market Analysis, Opportunity and Forecast, By By Type, 2016-2032
- 5.4.1. Western Europe Armored Vehicle Market Analysis by By Type: Introduction
- 5.4.2. Market Size Absolute $ Opportunity Analysis and Forecast, By By Type, 2016-2032
- 5.4.3. Electric Armored Vehicles
- 5.4.4. Conventional Armored Vehicles
- 5.5. Western Europe Armored Vehicle Market Analysis, Opportunity and Forecast, By By Mobility , 2016-2032
- 5.5.1. Western Europe Armored Vehicle Market Analysis by By Mobility : Introduction
- 5.5.2. Market Size Absolute $ Opportunity Analysis and Forecast, By By Mobility , 2016-2032
- 5.5.3. Wheeled
- 5.5.4. Tracked
- 5.6. Western Europe Armored Vehicle Market Analysis, Opportunity and Forecast, By By Mode of Operation , 2016-2032
- 5.6.1. Western Europe Armored Vehicle Market Analysis by By Mode of Operation : Introduction
- 5.6.2. Market Size Absolute $ Opportunity Analysis and Forecast, By By Mode of Operation , 2016-2032
- 5.6.3. Manned Armored Vehicles
- 5.6.4. Unmanned Armored Vehicles
- 5.7. Western Europe Armored Vehicle Market Analysis, Opportunity and Forecast, By By Point of Sale , 2016-2032
- 5.7.1. Western Europe Armored Vehicle Market Analysis by By Point of Sale : Introduction
- 5.7.2. Market Size Absolute $ Opportunity Analysis and Forecast, By By Point of Sale , 2016-2032
- 5.7.3. OEM
- 5.7.4. Retrofit
- 5.8. Western Europe Armored Vehicle Market Analysis, Opportunity and Forecast, By By System , 2016-2032
- 5.8.1. Western Europe Armored Vehicle Market Analysis by By System : Introduction
- 5.8.2. Market Size Absolute $ Opportunity Analysis and Forecast, By By System , 2016-2032
- 5.8.3. Engines
- 5.8.4. Drive Systems
- 5.8.5. Ballistic Armor
- 5.8.6. Fire Control Systems (FCS)
- 5.8.7. Navigation Systems
- 5.9. Western Europe Armored Vehicle Market Analysis, Opportunity and Forecast, By Country , 2016-2032
- 5.9.1. Western Europe Armored Vehicle Market Analysis by Country : Introduction
- 5.9.2. Market Size Absolute $ Opportunity Analysis and Forecast, Country , 2016-2032
- 5.9.2.1. Germany
- 5.9.2.2. France
- 5.9.2.3. The UK
- 5.9.2.4. Spain
- 5.9.2.5. Italy
- 5.9.2.6. Portugal
- 5.9.2.7. Ireland
- 5.9.2.8. Austria
- 5.9.2.9. Switzerland
- 5.9.2.10. Benelux
- 5.9.2.11. Nordic
- 5.9.2.12. Rest of Western Europe
- 6. Eastern Europe Armored Vehicle Market Analysis, Opportunity and Forecast, 2016-2032
- 6.1. Eastern Europe Armored Vehicle Market Analysis, 2016-2021
- 6.2. Eastern Europe Armored Vehicle Market Opportunity and Forecast, 2023-2032
- 6.3. Eastern Europe Armored Vehicle Market Analysis, Opportunity and Forecast, By By Product, 2016-2032
- 6.3.1. Eastern Europe Armored Vehicle Market Analysis by By Product: Introduction
- 6.3.2. Market Size Absolute $ Opportunity Analysis and Forecast, By By Product, 2016-2032
- 6.3.3. Combat Vehicles
- 6.3.3.1. Armored Personnel Carrier (APC)
- 6.3.3.2. Infantry Fighting Vehicles (IFV)
- 6.3.3.3. Light Protected Vehicles (LPV)
- 6.3.3.4. Main Battle Tanks (MBT)
- 6.3.3.5. Mine-resistant Ambush Protected (MRAP), Tactical Vehicle
- 6.3.4. Combat Support Vehicles
- 6.3.4.1. Armored Supply Trucks
- 6.3.4.2. Armored Command & Control Vehicles
- 6.3.4.3. Repair & Recovery Vehicles
- 6.3.4.4. Unmanned Armored Ground Vehicles
- 6.4. Eastern Europe Armored Vehicle Market Analysis, Opportunity and Forecast, By By Type, 2016-2032
- 6.4.1. Eastern Europe Armored Vehicle Market Analysis by By Type: Introduction
- 6.4.2. Market Size Absolute $ Opportunity Analysis and Forecast, By By Type, 2016-2032
- 6.4.3. Electric Armored Vehicles
- 6.4.4. Conventional Armored Vehicles
- 6.5. Eastern Europe Armored Vehicle Market Analysis, Opportunity and Forecast, By By Mobility , 2016-2032
- 6.5.1. Eastern Europe Armored Vehicle Market Analysis by By Mobility : Introduction
- 6.5.2. Market Size Absolute $ Opportunity Analysis and Forecast, By By Mobility , 2016-2032
- 6.5.3. Wheeled
- 6.5.4. Tracked
- 6.6. Eastern Europe Armored Vehicle Market Analysis, Opportunity and Forecast, By By Mode of Operation , 2016-2032
- 6.6.1. Eastern Europe Armored Vehicle Market Analysis by By Mode of Operation : Introduction
- 6.6.2. Market Size Absolute $ Opportunity Analysis and Forecast, By By Mode of Operation , 2016-2032
- 6.6.3. Manned Armored Vehicles
- 6.6.4. Unmanned Armored Vehicles
- 6.7. Eastern Europe Armored Vehicle Market Analysis, Opportunity and Forecast, By By Point of Sale , 2016-2032
- 6.7.1. Eastern Europe Armored Vehicle Market Analysis by By Point of Sale : Introduction
- 6.7.2. Market Size Absolute $ Opportunity Analysis and Forecast, By By Point of Sale , 2016-2032
- 6.7.3. OEM
- 6.7.4. Retrofit
- 6.8. Eastern Europe Armored Vehicle Market Analysis, Opportunity and Forecast, By By System , 2016-2032
- 6.8.1. Eastern Europe Armored Vehicle Market Analysis by By System : Introduction
- 6.8.2. Market Size Absolute $ Opportunity Analysis and Forecast, By By System , 2016-2032
- 6.8.3. Engines
- 6.8.4. Drive Systems
- 6.8.5. Ballistic Armor
- 6.8.6. Fire Control Systems (FCS)
- 6.8.7. Navigation Systems
- 6.9. Eastern Europe Armored Vehicle Market Analysis, Opportunity and Forecast, By Country , 2016-2032
- 6.9.1. Eastern Europe Armored Vehicle Market Analysis by Country : Introduction
- 6.9.2. Market Size Absolute $ Opportunity Analysis and Forecast, Country , 2016-2032
- 6.9.2.1. Russia
- 6.9.2.2. Poland
- 6.9.2.3. The Czech Republic
- 6.9.2.4. Greece
- 6.9.2.5. Rest of Eastern Europe
- 7. APAC Armored Vehicle Market Analysis, Opportunity and Forecast, 2016-2032
- 7.1. APAC Armored Vehicle Market Analysis, 2016-2021
- 7.2. APAC Armored Vehicle Market Opportunity and Forecast, 2023-2032
- 7.3. APAC Armored Vehicle Market Analysis, Opportunity and Forecast, By By Product, 2016-2032
- 7.3.1. APAC Armored Vehicle Market Analysis by By Product: Introduction
- 7.3.2. Market Size Absolute $ Opportunity Analysis and Forecast, By By Product, 2016-2032
- 7.3.3. Combat Vehicles
- 7.3.3.1. Armored Personnel Carrier (APC)
- 7.3.3.2. Infantry Fighting Vehicles (IFV)
- 7.3.3.3. Light Protected Vehicles (LPV)
- 7.3.3.4. Main Battle Tanks (MBT)
- 7.3.3.5. Mine-resistant Ambush Protected (MRAP), Tactical Vehicle
- 7.3.4. Combat Support Vehicles
- 7.3.4.1. Armored Supply Trucks
- 7.3.4.2. Armored Command & Control Vehicles
- 7.3.4.3. Repair & Recovery Vehicles
- 7.3.4.4. Unmanned Armored Ground Vehicles
- 7.4. APAC Armored Vehicle Market Analysis, Opportunity and Forecast, By By Type, 2016-2032
- 7.4.1. APAC Armored Vehicle Market Analysis by By Type: Introduction
- 7.4.2. Market Size Absolute $ Opportunity Analysis and Forecast, By By Type, 2016-2032
- 7.4.3. Electric Armored Vehicles
- 7.4.4. Conventional Armored Vehicles
- 7.5. APAC Armored Vehicle Market Analysis, Opportunity and Forecast, By By Mobility , 2016-2032
- 7.5.1. APAC Armored Vehicle Market Analysis by By Mobility : Introduction
- 7.5.2. Market Size Absolute $ Opportunity Analysis and Forecast, By By Mobility , 2016-2032
- 7.5.3. Wheeled
- 7.5.4. Tracked
- 7.6. APAC Armored Vehicle Market Analysis, Opportunity and Forecast, By By Mode of Operation , 2016-2032
- 7.6.1. APAC Armored Vehicle Market Analysis by By Mode of Operation : Introduction
- 7.6.2. Market Size Absolute $ Opportunity Analysis and Forecast, By By Mode of Operation , 2016-2032
- 7.6.3. Manned Armored Vehicles
- 7.6.4. Unmanned Armored Vehicles
- 7.7. APAC Armored Vehicle Market Analysis, Opportunity and Forecast, By By Point of Sale , 2016-2032
- 7.7.1. APAC Armored Vehicle Market Analysis by By Point of Sale : Introduction
- 7.7.2. Market Size Absolute $ Opportunity Analysis and Forecast, By By Point of Sale , 2016-2032
- 7.7.3. OEM
- 7.7.4. Retrofit
- 7.8. APAC Armored Vehicle Market Analysis, Opportunity and Forecast, By By System , 2016-2032
- 7.8.1. APAC Armored Vehicle Market Analysis by By System : Introduction
- 7.8.2. Market Size Absolute $ Opportunity Analysis and Forecast, By By System , 2016-2032
- 7.8.3. Engines
- 7.8.4. Drive Systems
- 7.8.5. Ballistic Armor
- 7.8.6. Fire Control Systems (FCS)
- 7.8.7. Navigation Systems
- 7.9. APAC Armored Vehicle Market Analysis, Opportunity and Forecast, By Country , 2016-2032
- 7.9.1. APAC Armored Vehicle Market Analysis by Country : Introduction
- 7.9.2. Market Size Absolute $ Opportunity Analysis and Forecast, Country , 2016-2032
- 7.9.2.1. China
- 7.9.2.2. Japan
- 7.9.2.3. South Korea
- 7.9.2.4. India
- 7.9.2.5. Australia & New Zeland
- 7.9.2.6. Indonesia
- 7.9.2.7. Malaysia
- 7.9.2.8. Philippines
- 7.9.2.9. Singapore
- 7.9.2.10. Thailand
- 7.9.2.11. Vietnam
- 7.9.2.12. Rest of APAC
- 8. Latin America Armored Vehicle Market Analysis, Opportunity and Forecast, 2016-2032
- 8.1. Latin America Armored Vehicle Market Analysis, 2016-2021
- 8.2. Latin America Armored Vehicle Market Opportunity and Forecast, 2023-2032
- 8.3. Latin America Armored Vehicle Market Analysis, Opportunity and Forecast, By By Product, 2016-2032
- 8.3.1. Latin America Armored Vehicle Market Analysis by By Product: Introduction
- 8.3.2. Market Size Absolute $ Opportunity Analysis and Forecast, By By Product, 2016-2032
- 8.3.3. Combat Vehicles
- 8.3.3.1. Armored Personnel Carrier (APC)
- 8.3.3.2. Infantry Fighting Vehicles (IFV)
- 8.3.3.3. Light Protected Vehicles (LPV)
- 8.3.3.4. Main Battle Tanks (MBT)
- 8.3.3.5. Mine-resistant Ambush Protected (MRAP), Tactical Vehicle
- 8.3.4. Combat Support Vehicles
- 8.3.4.1. Armored Supply Trucks
- 8.3.4.2. Armored Command & Control Vehicles
- 8.3.4.3. Repair & Recovery Vehicles
- 8.3.4.4. Unmanned Armored Ground Vehicles
- 8.4. Latin America Armored Vehicle Market Analysis, Opportunity and Forecast, By By Type, 2016-2032
- 8.4.1. Latin America Armored Vehicle Market Analysis by By Type: Introduction
- 8.4.2. Market Size Absolute $ Opportunity Analysis and Forecast, By By Type, 2016-2032
- 8.4.3. Electric Armored Vehicles
- 8.4.4. Conventional Armored Vehicles
- 8.5. Latin America Armored Vehicle Market Analysis, Opportunity and Forecast, By By Mobility , 2016-2032
- 8.5.1. Latin America Armored Vehicle Market Analysis by By Mobility : Introduction
- 8.5.2. Market Size Absolute $ Opportunity Analysis and Forecast, By By Mobility , 2016-2032
- 8.5.3. Wheeled
- 8.5.4. Tracked
- 8.6. Latin America Armored Vehicle Market Analysis, Opportunity and Forecast, By By Mode of Operation , 2016-2032
- 8.6.1. Latin America Armored Vehicle Market Analysis by By Mode of Operation : Introduction
- 8.6.2. Market Size Absolute $ Opportunity Analysis and Forecast, By By Mode of Operation , 2016-2032
- 8.6.3. Manned Armored Vehicles
- 8.6.4. Unmanned Armored Vehicles
- 8.7. Latin America Armored Vehicle Market Analysis, Opportunity and Forecast, By By Point of Sale , 2016-2032
- 8.7.1. Latin America Armored Vehicle Market Analysis by By Point of Sale : Introduction
- 8.7.2. Market Size Absolute $ Opportunity Analysis and Forecast, By By Point of Sale , 2016-2032
- 8.7.3. OEM
- 8.7.4. Retrofit
- 8.8. Latin America Armored Vehicle Market Analysis, Opportunity and Forecast, By By System , 2016-2032
- 8.8.1. Latin America Armored Vehicle Market Analysis by By System : Introduction
- 8.8.2. Market Size Absolute $ Opportunity Analysis and Forecast, By By System , 2016-2032
- 8.8.3. Engines
- 8.8.4. Drive Systems
- 8.8.5. Ballistic Armor
- 8.8.6. Fire Control Systems (FCS)
- 8.8.7. Navigation Systems
- 8.9. Latin America Armored Vehicle Market Analysis, Opportunity and Forecast, By Country , 2016-2032
- 8.9.1. Latin America Armored Vehicle Market Analysis by Country : Introduction
- 8.9.2. Market Size Absolute $ Opportunity Analysis and Forecast, Country , 2016-2032
- 8.9.2.1. Brazil
- 8.9.2.2. Colombia
- 8.9.2.3. Chile
- 8.9.2.4. Argentina
- 8.9.2.5. Costa Rica
- 8.9.2.6. Rest of Latin America
- 9. Middle East & Africa Armored Vehicle Market Analysis, Opportunity and Forecast, 2016-2032
- 9.1. Middle East & Africa Armored Vehicle Market Analysis, 2016-2021
- 9.2. Middle East & Africa Armored Vehicle Market Opportunity and Forecast, 2023-2032
- 9.3. Middle East & Africa Armored Vehicle Market Analysis, Opportunity and Forecast, By By Product, 2016-2032
- 9.3.1. Middle East & Africa Armored Vehicle Market Analysis by By Product: Introduction
- 9.3.2. Market Size Absolute $ Opportunity Analysis and Forecast, By By Product, 2016-2032
- 9.3.3. Combat Vehicles
- 9.3.3.1. Armored Personnel Carrier (APC)
- 9.3.3.2. Infantry Fighting Vehicles (IFV)
- 9.3.3.3. Light Protected Vehicles (LPV)
- 9.3.3.4. Main Battle Tanks (MBT)
- 9.3.3.5. Mine-resistant Ambush Protected (MRAP), Tactical Vehicle
- 9.3.4. Combat Support Vehicles
- 9.3.4.1. Armored Supply Trucks
- 9.3.4.2. Armored Command & Control Vehicles
- 9.3.4.3. Repair & Recovery Vehicles
- 9.3.4.4. Unmanned Armored Ground Vehicles
- 9.4. Middle East & Africa Armored Vehicle Market Analysis, Opportunity and Forecast, By By Type, 2016-2032
- 9.4.1. Middle East & Africa Armored Vehicle Market Analysis by By Type: Introduction
- 9.4.2. Market Size Absolute $ Opportunity Analysis and Forecast, By By Type, 2016-2032
- 9.4.3. Electric Armored Vehicles
- 9.4.4. Conventional Armored Vehicles
- 9.5. Middle East & Africa Armored Vehicle Market Analysis, Opportunity and Forecast, By By Mobility , 2016-2032
- 9.5.1. Middle East & Africa Armored Vehicle Market Analysis by By Mobility : Introduction
- 9.5.2. Market Size Absolute $ Opportunity Analysis and Forecast, By By Mobility , 2016-2032
- 9.5.3. Wheeled
- 9.5.4. Tracked
- 9.6. Middle East & Africa Armored Vehicle Market Analysis, Opportunity and Forecast, By By Mode of Operation , 2016-2032
- 9.6.1. Middle East & Africa Armored Vehicle Market Analysis by By Mode of Operation : Introduction
- 9.6.2. Market Size Absolute $ Opportunity Analysis and Forecast, By By Mode of Operation , 2016-2032
- 9.6.3. Manned Armored Vehicles
- 9.6.4. Unmanned Armored Vehicles
- 9.7. Middle East & Africa Armored Vehicle Market Analysis, Opportunity and Forecast, By By Point of Sale , 2016-2032
- 9.7.1. Middle East & Africa Armored Vehicle Market Analysis by By Point of Sale : Introduction
- 9.7.2. Market Size Absolute $ Opportunity Analysis and Forecast, By By Point of Sale , 2016-2032
- 9.7.3. OEM
- 9.7.4. Retrofit
- 9.8. Middle East & Africa Armored Vehicle Market Analysis, Opportunity and Forecast, By By System , 2016-2032
- 9.8.1. Middle East & Africa Armored Vehicle Market Analysis by By System : Introduction
- 9.8.2. Market Size Absolute $ Opportunity Analysis and Forecast, By By System , 2016-2032
- 9.8.3. Engines
- 9.8.4. Drive Systems
- 9.8.5. Ballistic Armor
- 9.8.6. Fire Control Systems (FCS)
- 9.8.7. Navigation Systems
- 9.9. Middle East & Africa Armored Vehicle Market Analysis, Opportunity and Forecast, By Country , 2016-2032
- 9.9.1. Middle East & Africa Armored Vehicle Market Analysis by Country : Introduction
- 9.9.2. Market Size Absolute $ Opportunity Analysis and Forecast, Country , 2016-2032
- 9.9.2.1. Algeria
- 9.9.2.2. Egypt
- 9.9.2.3. Israel
- 9.9.2.4. Kuwait
- 9.9.2.5. Nigeria
- 9.9.2.6. Saudi Arabia
- 9.9.2.7. South Africa
- 9.9.2.8. Turkey
- 9.9.2.9. The UAE
- 9.9.2.10. Rest of MEA
- 10. Global Armored Vehicle Market Analysis, Opportunity and Forecast, By Region , 2016-2032
- 10.1. Global Armored Vehicle Market Analysis by Region : Introduction
- 10.2. Market Size Absolute $ Opportunity Analysis and Forecast, By Region , 2016-2032
- 10.2.1. North America
- 10.2.2. Western Europe
- 10.2.3. Eastern Europe
- 10.2.4. APAC
- 10.2.5. Latin America
- 10.2.6. Middle East & Africa
- 11. Global Armored Vehicle Market Competitive Landscape, Market Share Analysis, and Company Profiles
- 11.1. Market Share Analysis
- 11.2. Company Profiles
- 11.3. BAE Systems (U.K.)
- 11.3.1. Company Overview
- 11.3.2. Financial Highlights
- 11.3.3. Product Portfolio
- 11.3.4. SWOT Analysis
- 11.3.5. Key Strategies and Developments
- 11.4. General Dynamics Corporation (U.S.)
- 11.4.1. Company Overview
- 11.4.2. Financial Highlights
- 11.4.3. Product Portfolio
- 11.4.4. SWOT Analysis
- 11.4.5. Key Strategies and Developments
- 11.5. Rheinmetall AG (Germany)
- 11.5.1. Company Overview
- 11.5.2. Financial Highlights
- 11.5.3. Product Portfolio
- 11.5.4. SWOT Analysis
- 11.5.5. Key Strategies and Developments
- 11.6. Krauss-Maffei Wegmann GmbH (Germany)
- 11.6.1. Company Overview
- 11.6.2. Financial Highlights
- 11.6.3. Product Portfolio
- 11.6.4. SWOT Analysis
- 11.6.5. Key Strategies and Developments
- 11.7. Denel SOC ltd (South Africa)
- 11.7.1. Company Overview
- 11.7.2. Financial Highlights
- 11.7.3. Product Portfolio
- 11.7.4. SWOT Analysis
- 11.7.5. Key Strategies and Developments
- 11.8. IVECO DEFENCE VEHICLES (Italy)
- 11.8.1. Company Overview
- 11.8.2. Financial Highlights
- 11.8.3. Product Portfolio
- 11.8.4. SWOT Analysis
- 11.8.5. Key Strategies and Developments
- 11.9. NORINCOGROUP.com Inc. (China)
- 11.9.1. Company Overview
- 11.9.2. Financial Highlights
- 11.9.3. Product Portfolio
- 11.9.4. SWOT Analysis
- 11.9.5. Key Strategies and Developments
- 11.10. Oshkosh Defense, LLC An Oshkosh Corporation Company (U.S.)
- 11.10.1. Company Overview
- 11.10.2. Financial Highlights
- 11.10.3. Product Portfolio
- 11.10.4. SWOT Analysis
- 11.10.5. Key Strategies and Developments
- 11.11. Otokar, a KOC Group Company (Turkey)
- 11.11.1. Company Overview
- 11.11.2. Financial Highlights
- 11.11.3. Product Portfolio
- 11.11.4. SWOT Analysis
- 11.11.5. Key Strategies and Developments
- 11.12. Textron Systems (U.S.)
- 11.12.1. Company Overview
- 11.12.2. Financial Highlights
- 11.12.3. Product Portfolio
- 11.12.4. SWOT Analysis
- 11.12.5. Key Strategies and Developments
- 11.13.1. Company Overview
- 11.13.2. Financial Highlights
- 11.13.3. Product Portfolio
- 11.13.4. SWOT Analysis
- 11.13.5. Key Strategies and Developments
- 12. Assumptions and Acronyms
- 13. Research Methodology
- 14. Contact
"
- List of Figures
- "
- Figure 1: Global Armored Vehicle Market Revenue (US$ Mn) Market Share by By Product in 2022
- Figure 2: Global Armored Vehicle Market Market Attractiveness Analysis by By Product, 2016-2032
- Figure 3: Global Armored Vehicle Market Revenue (US$ Mn) Market Share by By Typein 2022
- Figure 4: Global Armored Vehicle Market Market Attractiveness Analysis by By Type, 2016-2032
- Figure 5: Global Armored Vehicle Market Revenue (US$ Mn) Market Share by By Mobility in 2022
- Figure 6: Global Armored Vehicle Market Market Attractiveness Analysis by By Mobility , 2016-2032
- Figure 7: Global Armored Vehicle Market Revenue (US$ Mn) Market Share by By Mode of Operation in 2022
- Figure 8: Global Armored Vehicle Market Market Attractiveness Analysis by By Mode of Operation , 2016-2032
- Figure 9: Global Armored Vehicle Market Revenue (US$ Mn) Market Share by By Point of Sale in 2022
- Figure 10: Global Armored Vehicle Market Market Attractiveness Analysis by By Point of Sale , 2016-2032
- Figure 11: Global Armored Vehicle Market Revenue (US$ Mn) Market Share by By System in 2022
- Figure 12: Global Armored Vehicle Market Market Attractiveness Analysis by By System , 2016-2032
- Figure 13: Global Armored Vehicle Market Revenue (US$ Mn) Market Share by Region in 2022
- Figure 14: Global Armored Vehicle Market Market Attractiveness Analysis by Region, 2016-2032
- Figure 15: Global Armored Vehicle Market Market Revenue (US$ Mn) (2016-2032)
- Figure 16: Global Armored Vehicle Market Market Revenue (US$ Mn) Comparison by Region (2016-2032)
- Figure 17: Global Armored Vehicle Market Market Revenue (US$ Mn) Comparison by By Product (2016-2032)
- Figure 18: Global Armored Vehicle Market Market Revenue (US$ Mn) Comparison by By Type (2016-2032)
- Figure 19: Global Armored Vehicle Market Market Revenue (US$ Mn) Comparison by By Mobility (2016-2032)
- Figure 20: Global Armored Vehicle Market Market Revenue (US$ Mn) Comparison by By Mode of Operation (2016-2032)
- Figure 21: Global Armored Vehicle Market Market Revenue (US$ Mn) Comparison by By Point of Sale (2016-2032)
- Figure 22: Global Armored Vehicle Market Market Revenue (US$ Mn) Comparison by By System (2016-2032)
- Figure 23: Global Armored Vehicle Market Market Y-o-Y Growth Rate Comparison by Region (2016-2032)
- Figure 24: Global Armored Vehicle Market Market Y-o-Y Growth Rate Comparison by By Product (2016-2032)
- Figure 25: Global Armored Vehicle Market Market Y-o-Y Growth Rate Comparison by By Type (2016-2032)
- Figure 26: Global Armored Vehicle Market Market Y-o-Y Growth Rate Comparison by By Mobility (2016-2032)
- Figure 27: Global Armored Vehicle Market Market Y-o-Y Growth Rate Comparison by By Mode of Operation (2016-2032)
- Figure 28: Global Armored Vehicle Market Market Y-o-Y Growth Rate Comparison by By Point of Sale (2016-2032)
- Figure 29: Global Armored Vehicle Market Market Y-o-Y Growth Rate Comparison by By System (2016-2032)
- Figure 30: Global Armored Vehicle Market Market Share Comparison by Region (2016-2032)
- Figure 31: Global Armored Vehicle Market Market Share Comparison by By Product (2016-2032)
- Figure 32: Global Armored Vehicle Market Market Share Comparison by By Type (2016-2032)
- Figure 33: Global Armored Vehicle Market Market Share Comparison by By Mobility (2016-2032)
- Figure 34: Global Armored Vehicle Market Market Share Comparison by By Mode of Operation (2016-2032)
- Figure 35: Global Armored Vehicle Market Market Share Comparison by By Point of Sale (2016-2032)
- Figure 36: Global Armored Vehicle Market Market Share Comparison by By System (2016-2032)
- Figure 37: North America Armored Vehicle Market Revenue (US$ Mn) Market Share by By Productin 2022
- Figure 38: North America Armored Vehicle Market Market Attractiveness Analysis by By Product, 2016-2032
- Figure 39: North America Armored Vehicle Market Revenue (US$ Mn) Market Share by By Typein 2022
- Figure 40: North America Armored Vehicle Market Market Attractiveness Analysis by By Type, 2016-2032
- Figure 41: North America Armored Vehicle Market Revenue (US$ Mn) Market Share by By Mobility in 2022
- Figure 42: North America Armored Vehicle Market Market Attractiveness Analysis by By Mobility , 2016-2032
- Figure 43: North America Armored Vehicle Market Revenue (US$ Mn) Market Share by By Mode of Operation in 2022
- Figure 44: North America Armored Vehicle Market Market Attractiveness Analysis by By Mode of Operation , 2016-2032
- Figure 45: North America Armored Vehicle Market Revenue (US$ Mn) Market Share by By Point of Sale in 2022
- Figure 46: North America Armored Vehicle Market Market Attractiveness Analysis by By Point of Sale , 2016-2032
- Figure 47: North America Armored Vehicle Market Revenue (US$ Mn) Market Share by By System in 2022
- Figure 48: North America Armored Vehicle Market Market Attractiveness Analysis by By System , 2016-2032
- Figure 49: North America Armored Vehicle Market Revenue (US$ Mn) Market Share by Country in 2022
- Figure 50: North America Armored Vehicle Market Market Attractiveness Analysis by Country, 2016-2032
- Figure 51: North America Armored Vehicle Market Market Revenue (US$ Mn) (2016-2032)
- Figure 52: North America Armored Vehicle Market Market Revenue (US$ Mn) Comparison by Country (2016-2032)
- Figure 53: North America Armored Vehicle Market Market Revenue (US$ Mn) Comparison by By Product (2016-2032)
- Figure 54: North America Armored Vehicle Market Market Revenue (US$ Mn) Comparison by By Type (2016-2032)
- Figure 55: North America Armored Vehicle Market Market Revenue (US$ Mn) Comparison by By Mobility (2016-2032)
- Figure 56: North America Armored Vehicle Market Market Revenue (US$ Mn) Comparison by By Mode of Operation (2016-2032)
- Figure 57: North America Armored Vehicle Market Market Revenue (US$ Mn) Comparison by By Point of Sale (2016-2032)
- Figure 58: North America Armored Vehicle Market Market Revenue (US$ Mn) Comparison by By System (2016-2032)
- Figure 59: North America Armored Vehicle Market Market Y-o-Y Growth Rate Comparison by Country (2016-2032)
- Figure 60: North America Armored Vehicle Market Market Y-o-Y Growth Rate Comparison by By Product (2016-2032)
- Figure 61: North America Armored Vehicle Market Market Y-o-Y Growth Rate Comparison by By Type (2016-2032)
- Figure 62: North America Armored Vehicle Market Market Y-o-Y Growth Rate Comparison by By Mobility (2016-2032)
- Figure 63: North America Armored Vehicle Market Market Y-o-Y Growth Rate Comparison by By Mode of Operation (2016-2032)
- Figure 64: North America Armored Vehicle Market Market Y-o-Y Growth Rate Comparison by By Point of Sale (2016-2032)
- Figure 65: North America Armored Vehicle Market Market Y-o-Y Growth Rate Comparison by By System (2016-2032)
- Figure 66: North America Armored Vehicle Market Market Share Comparison by Country (2016-2032)
- Figure 67: North America Armored Vehicle Market Market Share Comparison by By Product (2016-2032)
- Figure 68: North America Armored Vehicle Market Market Share Comparison by By Type (2016-2032)
- Figure 69: North America Armored Vehicle Market Market Share Comparison by By Mobility (2016-2032)
- Figure 70: North America Armored Vehicle Market Market Share Comparison by By Mode of Operation (2016-2032)
- Figure 71: North America Armored Vehicle Market Market Share Comparison by By Point of Sale (2016-2032)
- Figure 72: North America Armored Vehicle Market Market Share Comparison by By System (2016-2032)
- Figure 73: Western Europe Armored Vehicle Market Revenue (US$ Mn) Market Share by By Productin 2022
- Figure 74: Western Europe Armored Vehicle Market Market Attractiveness Analysis by By Product, 2016-2032
- Figure 75: Western Europe Armored Vehicle Market Revenue (US$ Mn) Market Share by By Typein 2022
- Figure 76: Western Europe Armored Vehicle Market Market Attractiveness Analysis by By Type, 2016-2032
- Figure 77: Western Europe Armored Vehicle Market Revenue (US$ Mn) Market Share by By Mobility in 2022
- Figure 78: Western Europe Armored Vehicle Market Market Attractiveness Analysis by By Mobility , 2016-2032
- Figure 79: Western Europe Armored Vehicle Market Revenue (US$ Mn) Market Share by By Mode of Operation in 2022
- Figure 80: Western Europe Armored Vehicle Market Market Attractiveness Analysis by By Mode of Operation , 2016-2032
- Figure 81: Western Europe Armored Vehicle Market Revenue (US$ Mn) Market Share by By Point of Sale in 2022
- Figure 82: Western Europe Armored Vehicle Market Market Attractiveness Analysis by By Point of Sale , 2016-2032
- Figure 83: Western Europe Armored Vehicle Market Revenue (US$ Mn) Market Share by By System in 2022
- Figure 84: Western Europe Armored Vehicle Market Market Attractiveness Analysis by By System , 2016-2032
- Figure 85: Western Europe Armored Vehicle Market Revenue (US$ Mn) Market Share by Country in 2022
- Figure 86: Western Europe Armored Vehicle Market Market Attractiveness Analysis by Country, 2016-2032
- Figure 87: Western Europe Armored Vehicle Market Market Revenue (US$ Mn) (2016-2032)
- Figure 88: Western Europe Armored Vehicle Market Market Revenue (US$ Mn) Comparison by Country (2016-2032)
- Figure 89: Western Europe Armored Vehicle Market Market Revenue (US$ Mn) Comparison by By Product (2016-2032)
- Figure 90: Western Europe Armored Vehicle Market Market Revenue (US$ Mn) Comparison by By Type (2016-2032)
- Figure 91: Western Europe Armored Vehicle Market Market Revenue (US$ Mn) Comparison by By Mobility (2016-2032)
- Figure 92: Western Europe Armored Vehicle Market Market Revenue (US$ Mn) Comparison by By Mode of Operation (2016-2032)
- Figure 93: Western Europe Armored Vehicle Market Market Revenue (US$ Mn) Comparison by By Point of Sale (2016-2032)
- Figure 94: Western Europe Armored Vehicle Market Market Revenue (US$ Mn) Comparison by By System (2016-2032)
- Figure 95: Western Europe Armored Vehicle Market Market Y-o-Y Growth Rate Comparison by Country (2016-2032)
- Figure 96: Western Europe Armored Vehicle Market Market Y-o-Y Growth Rate Comparison by By Product (2016-2032)
- Figure 97: Western Europe Armored Vehicle Market Market Y-o-Y Growth Rate Comparison by By Type (2016-2032)
- Figure 98: Western Europe Armored Vehicle Market Market Y-o-Y Growth Rate Comparison by By Mobility (2016-2032)
- Figure 99: Western Europe Armored Vehicle Market Market Y-o-Y Growth Rate Comparison by By Mode of Operation (2016-2032)
- Figure 100: Western Europe Armored Vehicle Market Market Y-o-Y Growth Rate Comparison by By Point of Sale (2016-2032)
- Figure 101: Western Europe Armored Vehicle Market Market Y-o-Y Growth Rate Comparison by By System (2016-2032)
- Figure 102: Western Europe Armored Vehicle Market Market Share Comparison by Country (2016-2032)
- Figure 103: Western Europe Armored Vehicle Market Market Share Comparison by By Product (2016-2032)
- Figure 104: Western Europe Armored Vehicle Market Market Share Comparison by By Type (2016-2032)
- Figure 105: Western Europe Armored Vehicle Market Market Share Comparison by By Mobility (2016-2032)
- Figure 106: Western Europe Armored Vehicle Market Market Share Comparison by By Mode of Operation (2016-2032)
- Figure 107: Western Europe Armored Vehicle Market Market Share Comparison by By Point of Sale (2016-2032)
- Figure 108: Western Europe Armored Vehicle Market Market Share Comparison by By System (2016-2032)
- Figure 109: Eastern Europe Armored Vehicle Market Revenue (US$ Mn) Market Share by By Productin 2022
- Figure 110: Eastern Europe Armored Vehicle Market Market Attractiveness Analysis by By Product, 2016-2032
- Figure 111: Eastern Europe Armored Vehicle Market Revenue (US$ Mn) Market Share by By Typein 2022
- Figure 112: Eastern Europe Armored Vehicle Market Market Attractiveness Analysis by By Type, 2016-2032
- Figure 113: Eastern Europe Armored Vehicle Market Revenue (US$ Mn) Market Share by By Mobility in 2022
- Figure 114: Eastern Europe Armored Vehicle Market Market Attractiveness Analysis by By Mobility , 2016-2032
- Figure 115: Eastern Europe Armored Vehicle Market Revenue (US$ Mn) Market Share by By Mode of Operation in 2022
- Figure 116: Eastern Europe Armored Vehicle Market Market Attractiveness Analysis by By Mode of Operation , 2016-2032
- Figure 117: Eastern Europe Armored Vehicle Market Revenue (US$ Mn) Market Share by By Point of Sale in 2022
- Figure 118: Eastern Europe Armored Vehicle Market Market Attractiveness Analysis by By Point of Sale , 2016-2032
- Figure 119: Eastern Europe Armored Vehicle Market Revenue (US$ Mn) Market Share by By System in 2022
- Figure 120: Eastern Europe Armored Vehicle Market Market Attractiveness Analysis by By System , 2016-2032
- Figure 121: Eastern Europe Armored Vehicle Market Revenue (US$ Mn) Market Share by Country in 2022
- Figure 122: Eastern Europe Armored Vehicle Market Market Attractiveness Analysis by Country, 2016-2032
- Figure 123: Eastern Europe Armored Vehicle Market Market Revenue (US$ Mn) (2016-2032)
- Figure 124: Eastern Europe Armored Vehicle Market Market Revenue (US$ Mn) Comparison by Country (2016-2032)
- Figure 125: Eastern Europe Armored Vehicle Market Market Revenue (US$ Mn) Comparison by By Product (2016-2032)
- Figure 126: Eastern Europe Armored Vehicle Market Market Revenue (US$ Mn) Comparison by By Type (2016-2032)
- Figure 127: Eastern Europe Armored Vehicle Market Market Revenue (US$ Mn) Comparison by By Mobility (2016-2032)
- Figure 128: Eastern Europe Armored Vehicle Market Market Revenue (US$ Mn) Comparison by By Mode of Operation (2016-2032)
- Figure 129: Eastern Europe Armored Vehicle Market Market Revenue (US$ Mn) Comparison by By Point of Sale (2016-2032)
- Figure 130: Eastern Europe Armored Vehicle Market Market Revenue (US$ Mn) Comparison by By System (2016-2032)
- Figure 131: Eastern Europe Armored Vehicle Market Market Y-o-Y Growth Rate Comparison by Country (2016-2032)
- Figure 132: Eastern Europe Armored Vehicle Market Market Y-o-Y Growth Rate Comparison by By Product (2016-2032)
- Figure 133: Eastern Europe Armored Vehicle Market Market Y-o-Y Growth Rate Comparison by By Type (2016-2032)
- Figure 134: Eastern Europe Armored Vehicle Market Market Y-o-Y Growth Rate Comparison by By Mobility (2016-2032)
- Figure 135: Eastern Europe Armored Vehicle Market Market Y-o-Y Growth Rate Comparison by By Mode of Operation (2016-2032)
- Figure 136: Eastern Europe Armored Vehicle Market Market Y-o-Y Growth Rate Comparison by By Point of Sale (2016-2032)
- Figure 137: Eastern Europe Armored Vehicle Market Market Y-o-Y Growth Rate Comparison by By System (2016-2032)
- Figure 138: Eastern Europe Armored Vehicle Market Market Share Comparison by Country (2016-2032)
- Figure 139: Eastern Europe Armored Vehicle Market Market Share Comparison by By Product (2016-2032)
- Figure 140: Eastern Europe Armored Vehicle Market Market Share Comparison by By Type (2016-2032)
- Figure 141: Eastern Europe Armored Vehicle Market Market Share Comparison by By Mobility (2016-2032)
- Figure 142: Eastern Europe Armored Vehicle Market Market Share Comparison by By Mode of Operation (2016-2032)
- Figure 143: Eastern Europe Armored Vehicle Market Market Share Comparison by By Point of Sale (2016-2032)
- Figure 144: Eastern Europe Armored Vehicle Market Market Share Comparison by By System (2016-2032)
- Figure 145: APAC Armored Vehicle Market Revenue (US$ Mn) Market Share by By Productin 2022
- Figure 146: APAC Armored Vehicle Market Market Attractiveness Analysis by By Product, 2016-2032
- Figure 147: APAC Armored Vehicle Market Revenue (US$ Mn) Market Share by By Typein 2022
- Figure 148: APAC Armored Vehicle Market Market Attractiveness Analysis by By Type, 2016-2032
- Figure 149: APAC Armored Vehicle Market Revenue (US$ Mn) Market Share by By Mobility in 2022
- Figure 150: APAC Armored Vehicle Market Market Attractiveness Analysis by By Mobility , 2016-2032
- Figure 151: APAC Armored Vehicle Market Revenue (US$ Mn) Market Share by By Mode of Operation in 2022
- Figure 152: APAC Armored Vehicle Market Market Attractiveness Analysis by By Mode of Operation , 2016-2032
- Figure 153: APAC Armored Vehicle Market Revenue (US$ Mn) Market Share by By Point of Sale in 2022
- Figure 154: APAC Armored Vehicle Market Market Attractiveness Analysis by By Point of Sale , 2016-2032
- Figure 155: APAC Armored Vehicle Market Revenue (US$ Mn) Market Share by By System in 2022
- Figure 156: APAC Armored Vehicle Market Market Attractiveness Analysis by By System , 2016-2032
- Figure 157: APAC Armored Vehicle Market Revenue (US$ Mn) Market Share by Country in 2022
- Figure 158: APAC Armored Vehicle Market Market Attractiveness Analysis by Country, 2016-2032
- Figure 159: APAC Armored Vehicle Market Market Revenue (US$ Mn) (2016-2032)
- Figure 160: APAC Armored Vehicle Market Market Revenue (US$ Mn) Comparison by Country (2016-2032)
- Figure 161: APAC Armored Vehicle Market Market Revenue (US$ Mn) Comparison by By Product (2016-2032)
- Figure 162: APAC Armored Vehicle Market Market Revenue (US$ Mn) Comparison by By Type (2016-2032)
- Figure 163: APAC Armored Vehicle Market Market Revenue (US$ Mn) Comparison by By Mobility (2016-2032)
- Figure 164: APAC Armored Vehicle Market Market Revenue (US$ Mn) Comparison by By Mode of Operation (2016-2032)
- Figure 165: APAC Armored Vehicle Market Market Revenue (US$ Mn) Comparison by By Point of Sale (2016-2032)
- Figure 166: APAC Armored Vehicle Market Market Revenue (US$ Mn) Comparison by By System (2016-2032)
- Figure 167: APAC Armored Vehicle Market Market Y-o-Y Growth Rate Comparison by Country (2016-2032)
- Figure 168: APAC Armored Vehicle Market Market Y-o-Y Growth Rate Comparison by By Product (2016-2032)
- Figure 169: APAC Armored Vehicle Market Market Y-o-Y Growth Rate Comparison by By Type (2016-2032)
- Figure 170: APAC Armored Vehicle Market Market Y-o-Y Growth Rate Comparison by By Mobility (2016-2032)
- Figure 171: APAC Armored Vehicle Market Market Y-o-Y Growth Rate Comparison by By Mode of Operation (2016-2032)
- Figure 172: APAC Armored Vehicle Market Market Y-o-Y Growth Rate Comparison by By Point of Sale (2016-2032)
- Figure 173: APAC Armored Vehicle Market Market Y-o-Y Growth Rate Comparison by By System (2016-2032)
- Figure 174: APAC Armored Vehicle Market Market Share Comparison by Country (2016-2032)
- Figure 175: APAC Armored Vehicle Market Market Share Comparison by By Product (2016-2032)
- Figure 176: APAC Armored Vehicle Market Market Share Comparison by By Type (2016-2032)
- Figure 177: APAC Armored Vehicle Market Market Share Comparison by By Mobility (2016-2032)
- Figure 178: APAC Armored Vehicle Market Market Share Comparison by By Mode of Operation (2016-2032)
- Figure 179: APAC Armored Vehicle Market Market Share Comparison by By Point of Sale (2016-2032)
- Figure 180: APAC Armored Vehicle Market Market Share Comparison by By System (2016-2032)
- Figure 181: Latin America Armored Vehicle Market Revenue (US$ Mn) Market Share by By Productin 2022
- Figure 182: Latin America Armored Vehicle Market Market Attractiveness Analysis by By Product, 2016-2032
- Figure 183: Latin America Armored Vehicle Market Revenue (US$ Mn) Market Share by By Typein 2022
- Figure 184: Latin America Armored Vehicle Market Market Attractiveness Analysis by By Type, 2016-2032
- Figure 185: Latin America Armored Vehicle Market Revenue (US$ Mn) Market Share by By Mobility in 2022
- Figure 186: Latin America Armored Vehicle Market Market Attractiveness Analysis by By Mobility , 2016-2032
- Figure 187: Latin America Armored Vehicle Market Revenue (US$ Mn) Market Share by By Mode of Operation in 2022
- Figure 188: Latin America Armored Vehicle Market Market Attractiveness Analysis by By Mode of Operation , 2016-2032
- Figure 189: Latin America Armored Vehicle Market Revenue (US$ Mn) Market Share by By Point of Sale in 2022
- Figure 190: Latin America Armored Vehicle Market Market Attractiveness Analysis by By Point of Sale , 2016-2032
- Figure 191: Latin America Armored Vehicle Market Revenue (US$ Mn) Market Share by By System in 2022
- Figure 192: Latin America Armored Vehicle Market Market Attractiveness Analysis by By System , 2016-2032
- Figure 193: Latin America Armored Vehicle Market Revenue (US$ Mn) Market Share by Country in 2022
- Figure 194: Latin America Armored Vehicle Market Market Attractiveness Analysis by Country, 2016-2032
- Figure 195: Latin America Armored Vehicle Market Market Revenue (US$ Mn) (2016-2032)
- Figure 196: Latin America Armored Vehicle Market Market Revenue (US$ Mn) Comparison by Country (2016-2032)
- Figure 197: Latin America Armored Vehicle Market Market Revenue (US$ Mn) Comparison by By Product (2016-2032)
- Figure 198: Latin America Armored Vehicle Market Market Revenue (US$ Mn) Comparison by By Type (2016-2032)
- Figure 199: Latin America Armored Vehicle Market Market Revenue (US$ Mn) Comparison by By Mobility (2016-2032)
- Figure 200: Latin America Armored Vehicle Market Market Revenue (US$ Mn) Comparison by By Mode of Operation (2016-2032)
- Figure 201: Latin America Armored Vehicle Market Market Revenue (US$ Mn) Comparison by By Point of Sale (2016-2032)
- Figure 202: Latin America Armored Vehicle Market Market Revenue (US$ Mn) Comparison by By System (2016-2032)
- Figure 203: Latin America Armored Vehicle Market Market Y-o-Y Growth Rate Comparison by Country (2016-2032)
- Figure 204: Latin America Armored Vehicle Market Market Y-o-Y Growth Rate Comparison by By Product (2016-2032)
- Figure 205: Latin America Armored Vehicle Market Market Y-o-Y Growth Rate Comparison by By Type (2016-2032)
- Figure 206: Latin America Armored Vehicle Market Market Y-o-Y Growth Rate Comparison by By Mobility (2016-2032)
- Figure 207: Latin America Armored Vehicle Market Market Y-o-Y Growth Rate Comparison by By Mode of Operation (2016-2032)
- Figure 208: Latin America Armored Vehicle Market Market Y-o-Y Growth Rate Comparison by By Point of Sale (2016-2032)
- Figure 209: Latin America Armored Vehicle Market Market Y-o-Y Growth Rate Comparison by By System (2016-2032)
- Figure 210: Latin America Armored Vehicle Market Market Share Comparison by Country (2016-2032)
- Figure 211: Latin America Armored Vehicle Market Market Share Comparison by By Product (2016-2032)
- Figure 212: Latin America Armored Vehicle Market Market Share Comparison by By Type (2016-2032)
- Figure 213: Latin America Armored Vehicle Market Market Share Comparison by By Mobility (2016-2032)
- Figure 214: Latin America Armored Vehicle Market Market Share Comparison by By Mode of Operation (2016-2032)
- Figure 215: Latin America Armored Vehicle Market Market Share Comparison by By Point of Sale (2016-2032)
- Figure 216: Latin America Armored Vehicle Market Market Share Comparison by By System (2016-2032)
- Figure 217: Middle East & Africa Armored Vehicle Market Revenue (US$ Mn) Market Share by By Productin 2022
- Figure 218: Middle East & Africa Armored Vehicle Market Market Attractiveness Analysis by By Product, 2016-2032
- Figure 219: Middle East & Africa Armored Vehicle Market Revenue (US$ Mn) Market Share by By Typein 2022
- Figure 220: Middle East & Africa Armored Vehicle Market Market Attractiveness Analysis by By Type, 2016-2032
- Figure 221: Middle East & Africa Armored Vehicle Market Revenue (US$ Mn) Market Share by By Mobility in 2022
- Figure 222: Middle East & Africa Armored Vehicle Market Market Attractiveness Analysis by By Mobility , 2016-2032
- Figure 223: Middle East & Africa Armored Vehicle Market Revenue (US$ Mn) Market Share by By Mode of Operation in 2022
- Figure 224: Middle East & Africa Armored Vehicle Market Market Attractiveness Analysis by By Mode of Operation , 2016-2032
- Figure 225: Middle East & Africa Armored Vehicle Market Revenue (US$ Mn) Market Share by By Point of Sale in 2022
- Figure 226: Middle East & Africa Armored Vehicle Market Market Attractiveness Analysis by By Point of Sale , 2016-2032
- Figure 227: Middle East & Africa Armored Vehicle Market Revenue (US$ Mn) Market Share by By System in 2022
- Figure 228: Middle East & Africa Armored Vehicle Market Market Attractiveness Analysis by By System , 2016-2032
- Figure 229: Middle East & Africa Armored Vehicle Market Revenue (US$ Mn) Market Share by Country in 2022
- Figure 230: Middle East & Africa Armored Vehicle Market Market Attractiveness Analysis by Country, 2016-2032
- Figure 231: Middle East & Africa Armored Vehicle Market Market Revenue (US$ Mn) (2016-2032)
- Figure 232: Middle East & Africa Armored Vehicle Market Market Revenue (US$ Mn) Comparison by Country (2016-2032)
- Figure 233: Middle East & Africa Armored Vehicle Market Market Revenue (US$ Mn) Comparison by By Product (2016-2032)
- Figure 234: Middle East & Africa Armored Vehicle Market Market Revenue (US$ Mn) Comparison by By Type (2016-2032)
- Figure 235: Middle East & Africa Armored Vehicle Market Market Revenue (US$ Mn) Comparison by By Mobility (2016-2032)
- Figure 236: Middle East & Africa Armored Vehicle Market Market Revenue (US$ Mn) Comparison by By Mode of Operation (2016-2032)
- Figure 237: Middle East & Africa Armored Vehicle Market Market Revenue (US$ Mn) Comparison by By Point of Sale (2016-2032)
- Figure 238: Middle East & Africa Armored Vehicle Market Market Revenue (US$ Mn) Comparison by By System (2016-2032)
- Figure 239: Middle East & Africa Armored Vehicle Market Market Y-o-Y Growth Rate Comparison by Country (2016-2032)
- Figure 240: Middle East & Africa Armored Vehicle Market Market Y-o-Y Growth Rate Comparison by By Product (2016-2032)
- Figure 241: Middle East & Africa Armored Vehicle Market Market Y-o-Y Growth Rate Comparison by By Type (2016-2032)
- Figure 242: Middle East & Africa Armored Vehicle Market Market Y-o-Y Growth Rate Comparison by By Mobility (2016-2032)
- Figure 243: Middle East & Africa Armored Vehicle Market Market Y-o-Y Growth Rate Comparison by By Mode of Operation (2016-2032)
- Figure 244: Middle East & Africa Armored Vehicle Market Market Y-o-Y Growth Rate Comparison by By Point of Sale (2016-2032)
- Figure 245: Middle East & Africa Armored Vehicle Market Market Y-o-Y Growth Rate Comparison by By System (2016-2032)
- Figure 246: Middle East & Africa Armored Vehicle Market Market Share Comparison by Country (2016-2032)
- Figure 247: Middle East & Africa Armored Vehicle Market Market Share Comparison by By Product (2016-2032)
- Figure 248: Middle East & Africa Armored Vehicle Market Market Share Comparison by By Type (2016-2032)
- Figure 249: Middle East & Africa Armored Vehicle Market Market Share Comparison by By Mobility (2016-2032)
- Figure 250: Middle East & Africa Armored Vehicle Market Market Share Comparison by By Mode of Operation (2016-2032)
- Figure 251: Middle East & Africa Armored Vehicle Market Market Share Comparison by By Point of Sale (2016-2032)
- Figure 252: Middle East & Africa Armored Vehicle Market Market Share Comparison by By System (2016-2032)
"
- List of Tables
- "
- Table 1: Global Armored Vehicle Market Market Comparison by By Product (2016-2032)
- Table 2: Global Armored Vehicle Market Market Comparison by By Type (2016-2032)
- Table 3: Global Armored Vehicle Market Market Comparison by By Mobility (2016-2032)
- Table 4: Global Armored Vehicle Market Market Comparison by By Mode of Operation (2016-2032)
- Table 5: Global Armored Vehicle Market Market Comparison by By Point of Sale (2016-2032)
- Table 6: Global Armored Vehicle Market Market Comparison by By System (2016-2032)
- Table 7: Global Armored Vehicle Market Revenue (US$ Mn) Comparison by Region (2016-2032)
- Table 8: Global Armored Vehicle Market Market Revenue (US$ Mn) (2016-2032)
- Table 9: Global Armored Vehicle Market Market Revenue (US$ Mn) Comparison by Region (2016-2032)
- Table 10: Global Armored Vehicle Market Market Revenue (US$ Mn) Comparison by By Product (2016-2032)
- Table 11: Global Armored Vehicle Market Market Revenue (US$ Mn) Comparison by By Type (2016-2032)
- Table 12: Global Armored Vehicle Market Market Revenue (US$ Mn) Comparison by By Mobility (2016-2032)
- Table 13: Global Armored Vehicle Market Market Revenue (US$ Mn) Comparison by By Mode of Operation (2016-2032)
- Table 14: Global Armored Vehicle Market Market Revenue (US$ Mn) Comparison by By Point of Sale (2016-2032)
- Table 15: Global Armored Vehicle Market Market Revenue (US$ Mn) Comparison by By System (2016-2032)
- Table 16: Global Armored Vehicle Market Market Y-o-Y Growth Rate Comparison by Region (2016-2032)
- Table 17: Global Armored Vehicle Market Market Y-o-Y Growth Rate Comparison by By Product (2016-2032)
- Table 18: Global Armored Vehicle Market Market Y-o-Y Growth Rate Comparison by By Type (2016-2032)
- Table 19: Global Armored Vehicle Market Market Y-o-Y Growth Rate Comparison by By Mobility (2016-2032)
- Table 20: Global Armored Vehicle Market Market Y-o-Y Growth Rate Comparison by By Mode of Operation (2016-2032)
- Table 21: Global Armored Vehicle Market Market Y-o-Y Growth Rate Comparison by By Point of Sale (2016-2032)
- Table 22: Global Armored Vehicle Market Market Y-o-Y Growth Rate Comparison by By System (2016-2032)
- Table 23: Global Armored Vehicle Market Market Share Comparison by Region (2016-2032)
- Table 24: Global Armored Vehicle Market Market Share Comparison by By Product (2016-2032)
- Table 25: Global Armored Vehicle Market Market Share Comparison by By Type (2016-2032)
- Table 26: Global Armored Vehicle Market Market Share Comparison by By Mobility (2016-2032)
- Table 27: Global Armored Vehicle Market Market Share Comparison by By Mode of Operation (2016-2032)
- Table 28: Global Armored Vehicle Market Market Share Comparison by By Point of Sale (2016-2032)
- Table 29: Global Armored Vehicle Market Market Share Comparison by By System (2016-2032)
- Table 30: North America Armored Vehicle Market Market Comparison by By Type (2016-2032)
- Table 31: North America Armored Vehicle Market Market Comparison by By Mobility (2016-2032)
- Table 32: North America Armored Vehicle Market Market Comparison by By Mode of Operation (2016-2032)
- Table 33: North America Armored Vehicle Market Market Comparison by By Point of Sale (2016-2032)
- Table 34: North America Armored Vehicle Market Market Comparison by By System (2016-2032)
- Table 35: North America Armored Vehicle Market Revenue (US$ Mn) Comparison by Country (2016-2032)
- Table 36: North America Armored Vehicle Market Market Revenue (US$ Mn) (2016-2032)
- Table 37: North America Armored Vehicle Market Market Revenue (US$ Mn) Comparison by Country (2016-2032)
- Table 38: North America Armored Vehicle Market Market Revenue (US$ Mn) Comparison by By Product (2016-2032)
- Table 39: North America Armored Vehicle Market Market Revenue (US$ Mn) Comparison by By Type (2016-2032)
- Table 40: North America Armored Vehicle Market Market Revenue (US$ Mn) Comparison by By Mobility (2016-2032)
- Table 41: North America Armored Vehicle Market Market Revenue (US$ Mn) Comparison by By Mode of Operation (2016-2032)
- Table 42: North America Armored Vehicle Market Market Revenue (US$ Mn) Comparison by By Point of Sale (2016-2032)
- Table 43: North America Armored Vehicle Market Market Revenue (US$ Mn) Comparison by By System (2016-2032)
- Table 44: North America Armored Vehicle Market Market Y-o-Y Growth Rate Comparison by Country (2016-2032)
- Table 45: North America Armored Vehicle Market Market Y-o-Y Growth Rate Comparison by By Product (2016-2032)
- Table 46: North America Armored Vehicle Market Market Y-o-Y Growth Rate Comparison by By Type (2016-2032)
- Table 47: North America Armored Vehicle Market Market Y-o-Y Growth Rate Comparison by By Mobility (2016-2032)
- Table 48: North America Armored Vehicle Market Market Y-o-Y Growth Rate Comparison by By Mode of Operation (2016-2032)
- Table 49: North America Armored Vehicle Market Market Y-o-Y Growth Rate Comparison by By Point of Sale (2016-2032)
- Table 50: North America Armored Vehicle Market Market Y-o-Y Growth Rate Comparison by By System (2016-2032)
- Table 51: North America Armored Vehicle Market Market Share Comparison by Country (2016-2032)
- Table 52: North America Armored Vehicle Market Market Share Comparison by By Product (2016-2032)
- Table 53: North America Armored Vehicle Market Market Share Comparison by By Type (2016-2032)
- Table 54: North America Armored Vehicle Market Market Share Comparison by By Mobility (2016-2032)
- Table 55: North America Armored Vehicle Market Market Share Comparison by By Mode of Operation (2016-2032)
- Table 56: North America Armored Vehicle Market Market Share Comparison by By Point of Sale (2016-2032)
- Table 57: North America Armored Vehicle Market Market Share Comparison by By System (2016-2032)
- Table 58: Western Europe Armored Vehicle Market Market Comparison by By Product (2016-2032)
- Table 59: Western Europe Armored Vehicle Market Market Comparison by By Type (2016-2032)
- Table 60: Western Europe Armored Vehicle Market Market Comparison by By Mobility (2016-2032)
- Table 61: Western Europe Armored Vehicle Market Market Comparison by By Mode of Operation (2016-2032)
- Table 62: Western Europe Armored Vehicle Market Market Comparison by By Point of Sale (2016-2032)
- Table 63: Western Europe Armored Vehicle Market Market Comparison by By System (2016-2032)
- Table 64: Western Europe Armored Vehicle Market Revenue (US$ Mn) Comparison by Country (2016-2032)
- Table 65: Western Europe Armored Vehicle Market Market Revenue (US$ Mn) (2016-2032)
- Table 66: Western Europe Armored Vehicle Market Market Revenue (US$ Mn) Comparison by Country (2016-2032)
- Table 67: Western Europe Armored Vehicle Market Market Revenue (US$ Mn) Comparison by By Product (2016-2032)
- Table 68: Western Europe Armored Vehicle Market Market Revenue (US$ Mn) Comparison by By Type (2016-2032)
- Table 69: Western Europe Armored Vehicle Market Market Revenue (US$ Mn) Comparison by By Mobility (2016-2032)
- Table 70: Western Europe Armored Vehicle Market Market Revenue (US$ Mn) Comparison by By Mode of Operation (2016-2032)
- Table 71: Western Europe Armored Vehicle Market Market Revenue (US$ Mn) Comparison by By Point of Sale (2016-2032)
- Table 72: Western Europe Armored Vehicle Market Market Revenue (US$ Mn) Comparison by By System (2016-2032)
- Table 73: Western Europe Armored Vehicle Market Market Y-o-Y Growth Rate Comparison by Country (2016-2032)
- Table 74: Western Europe Armored Vehicle Market Market Y-o-Y Growth Rate Comparison by By Product (2016-2032)
- Table 75: Western Europe Armored Vehicle Market Market Y-o-Y Growth Rate Comparison by By Type (2016-2032)
- Table 76: Western Europe Armored Vehicle Market Market Y-o-Y Growth Rate Comparison by By Mobility (2016-2032)
- Table 77: Western Europe Armored Vehicle Market Market Y-o-Y Growth Rate Comparison by By Mode of Operation (2016-2032)
- Table 78: Western Europe Armored Vehicle Market Market Y-o-Y Growth Rate Comparison by By Point of Sale (2016-2032)
- Table 79: Western Europe Armored Vehicle Market Market Y-o-Y Growth Rate Comparison by By System (2016-2032)
- Table 80: Western Europe Armored Vehicle Market Market Share Comparison by Country (2016-2032)
- Table 81: Western Europe Armored Vehicle Market Market Share Comparison by By Product (2016-2032)
- Table 82: Western Europe Armored Vehicle Market Market Share Comparison by By Type (2016-2032)
- Table 83: Western Europe Armored Vehicle Market Market Share Comparison by By Mobility (2016-2032)
- Table 84: Western Europe Armored Vehicle Market Market Share Comparison by By Mode of Operation (2016-2032)
- Table 85: Western Europe Armored Vehicle Market Market Share Comparison by By Point of Sale (2016-2032)
- Table 86: Western Europe Armored Vehicle Market Market Share Comparison by By System (2016-2032)
- Table 87: Eastern Europe Armored Vehicle Market Market Comparison by By Product (2016-2032)
- Table 88: Eastern Europe Armored Vehicle Market Market Comparison by By Type (2016-2032)
- Table 89: Eastern Europe Armored Vehicle Market Market Comparison by By Mobility (2016-2032)
- Table 90: Eastern Europe Armored Vehicle Market Market Comparison by By Mode of Operation (2016-2032)
- Table 91: Eastern Europe Armored Vehicle Market Market Comparison by By Point of Sale (2016-2032)
- Table 92: Eastern Europe Armored Vehicle Market Market Comparison by By System (2016-2032)
- Table 93: Eastern Europe Armored Vehicle Market Revenue (US$ Mn) Comparison by Country (2016-2032)
- Table 94: Eastern Europe Armored Vehicle Market Market Revenue (US$ Mn) (2016-2032)
- Table 95: Eastern Europe Armored Vehicle Market Market Revenue (US$ Mn) Comparison by Country (2016-2032)
- Table 96: Eastern Europe Armored Vehicle Market Market Revenue (US$ Mn) Comparison by By Product (2016-2032)
- Table 97: Eastern Europe Armored Vehicle Market Market Revenue (US$ Mn) Comparison by By Type (2016-2032)
- Table 98: Eastern Europe Armored Vehicle Market Market Revenue (US$ Mn) Comparison by By Mobility (2016-2032)
- Table 99: Eastern Europe Armored Vehicle Market Market Revenue (US$ Mn) Comparison by By Mode of Operation (2016-2032)
- Table 100: Eastern Europe Armored Vehicle Market Market Revenue (US$ Mn) Comparison by By Point of Sale (2016-2032)
- Table 101: Eastern Europe Armored Vehicle Market Market Revenue (US$ Mn) Comparison by By System (2016-2032)
- Table 102: Eastern Europe Armored Vehicle Market Market Y-o-Y Growth Rate Comparison by Country (2016-2032)
- Table 103: Eastern Europe Armored Vehicle Market Market Y-o-Y Growth Rate Comparison by By Product (2016-2032)
- Table 104: Eastern Europe Armored Vehicle Market Market Y-o-Y Growth Rate Comparison by By Type (2016-2032)
- Table 105: Eastern Europe Armored Vehicle Market Market Y-o-Y Growth Rate Comparison by By Mobility (2016-2032)
- Table 106: Eastern Europe Armored Vehicle Market Market Y-o-Y Growth Rate Comparison by By Mode of Operation (2016-2032)
- Table 107: Eastern Europe Armored Vehicle Market Market Y-o-Y Growth Rate Comparison by By Point of Sale (2016-2032)
- Table 108: Eastern Europe Armored Vehicle Market Market Y-o-Y Growth Rate Comparison by By System (2016-2032)
- Table 109: Eastern Europe Armored Vehicle Market Market Share Comparison by Country (2016-2032)
- Table 110: Eastern Europe Armored Vehicle Market Market Share Comparison by By Product (2016-2032)
- Table 111: Eastern Europe Armored Vehicle Market Market Share Comparison by By Type (2016-2032)
- Table 112: Eastern Europe Armored Vehicle Market Market Share Comparison by By Mobility (2016-2032)
- Table 113: Eastern Europe Armored Vehicle Market Market Share Comparison by By Mode of Operation (2016-2032)
- Table 114: Eastern Europe Armored Vehicle Market Market Share Comparison by By Point of Sale (2016-2032)
- Table 115: Eastern Europe Armored Vehicle Market Market Share Comparison by By System (2016-2032)
- Table 116: APAC Armored Vehicle Market Market Comparison by By Product (2016-2032)
- Table 117: APAC Armored Vehicle Market Market Comparison by By Type (2016-2032)
- Table 118: APAC Armored Vehicle Market Market Comparison by By Mobility (2016-2032)
- Table 119: APAC Armored Vehicle Market Market Comparison by By Mode of Operation (2016-2032)
- Table 120: APAC Armored Vehicle Market Market Comparison by By Point of Sale (2016-2032)
- Table 121: APAC Armored Vehicle Market Market Comparison by By System (2016-2032)
- Table 122: APAC Armored Vehicle Market Revenue (US$ Mn) Comparison by Country (2016-2032)
- Table 123: APAC Armored Vehicle Market Market Revenue (US$ Mn) (2016-2032)
- Table 124: APAC Armored Vehicle Market Market Revenue (US$ Mn) Comparison by Country (2016-2032)
- Table 125: APAC Armored Vehicle Market Market Revenue (US$ Mn) Comparison by By Product (2016-2032)
- Table 126: APAC Armored Vehicle Market Market Revenue (US$ Mn) Comparison by By Type (2016-2032)
- Table 127: APAC Armored Vehicle Market Market Revenue (US$ Mn) Comparison by By Mobility (2016-2032)
- Table 128: APAC Armored Vehicle Market Market Revenue (US$ Mn) Comparison by By Mode of Operation (2016-2032)
- Table 129: APAC Armored Vehicle Market Market Revenue (US$ Mn) Comparison by By Point of Sale (2016-2032)
- Table 130: APAC Armored Vehicle Market Market Revenue (US$ Mn) Comparison by By System (2016-2032)
- Table 131: APAC Armored Vehicle Market Market Y-o-Y Growth Rate Comparison by Country (2016-2032)
- Table 132: APAC Armored Vehicle Market Market Y-o-Y Growth Rate Comparison by By Product (2016-2032)
- Table 133: APAC Armored Vehicle Market Market Y-o-Y Growth Rate Comparison by By Type (2016-2032)
- Table 134: APAC Armored Vehicle Market Market Y-o-Y Growth Rate Comparison by By Mobility (2016-2032)
- Table 135: APAC Armored Vehicle Market Market Y-o-Y Growth Rate Comparison by By Mode of Operation (2016-2032)
- Table 136: APAC Armored Vehicle Market Market Y-o-Y Growth Rate Comparison by By Point of Sale (2016-2032)
- Table 137: APAC Armored Vehicle Market Market Y-o-Y Growth Rate Comparison by By System (2016-2032)
- Table 138: APAC Armored Vehicle Market Market Share Comparison by Country (2016-2032)
- Table 139: APAC Armored Vehicle Market Market Share Comparison by By Product (2016-2032)
- Table 140: APAC Armored Vehicle Market Market Share Comparison by By Type (2016-2032)
- Table 141: APAC Armored Vehicle Market Market Share Comparison by By Mobility (2016-2032)
- Table 142: APAC Armored Vehicle Market Market Share Comparison by By Mode of Operation (2016-2032)
- Table 143: APAC Armored Vehicle Market Market Share Comparison by By Point of Sale (2016-2032)
- Table 144: APAC Armored Vehicle Market Market Share Comparison by By System (2016-2032)
- Table 145: Latin America Armored Vehicle Market Market Comparison by By Product (2016-2032)
- Table 146: Latin America Armored Vehicle Market Market Comparison by By Type (2016-2032)
- Table 147: Latin America Armored Vehicle Market Market Comparison by By Mobility (2016-2032)
- Table 148: Latin America Armored Vehicle Market Market Comparison by By Mode of Operation (2016-2032)
- Table 149: Latin America Armored Vehicle Market Market Comparison by By Point of Sale (2016-2032)
- Table 150: Latin America Armored Vehicle Market Market Comparison by By System (2016-2032)
- Table 151: Latin America Armored Vehicle Market Revenue (US$ Mn) Comparison by Country (2016-2032)
- Table 152: Latin America Armored Vehicle Market Market Revenue (US$ Mn) (2016-2032)
- Table 153: Latin America Armored Vehicle Market Market Revenue (US$ Mn) Comparison by Country (2016-2032)
- Table 154: Latin America Armored Vehicle Market Market Revenue (US$ Mn) Comparison by By Product (2016-2032)
- Table 155: Latin America Armored Vehicle Market Market Revenue (US$ Mn) Comparison by By Type (2016-2032)
- Table 156: Latin America Armored Vehicle Market Market Revenue (US$ Mn) Comparison by By Mobility (2016-2032)
- Table 157: Latin America Armored Vehicle Market Market Revenue (US$ Mn) Comparison by By Mode of Operation (2016-2032)
- Table 158: Latin America Armored Vehicle Market Market Revenue (US$ Mn) Comparison by By Point of Sale (2016-2032)
- Table 159: Latin America Armored Vehicle Market Market Revenue (US$ Mn) Comparison by By System (2016-2032)
- Table 160: Latin America Armored Vehicle Market Market Y-o-Y Growth Rate Comparison by Country (2016-2032)
- Table 161: Latin America Armored Vehicle Market Market Y-o-Y Growth Rate Comparison by By Product (2016-2032)
- Table 162: Latin America Armored Vehicle Market Market Y-o-Y Growth Rate Comparison by By Type (2016-2032)
- Table 163: Latin America Armored Vehicle Market Market Y-o-Y Growth Rate Comparison by By Mobility (2016-2032)
- Table 164: Latin America Armored Vehicle Market Market Y-o-Y Growth Rate Comparison by By Mode of Operation (2016-2032)
- Table 165: Latin America Armored Vehicle Market Market Y-o-Y Growth Rate Comparison by By Point of Sale (2016-2032)
- Table 166: Latin America Armored Vehicle Market Market Y-o-Y Growth Rate Comparison by By System (2016-2032)
- Table 167: Latin America Armored Vehicle Market Market Share Comparison by Country (2016-2032)
- Table 168: Latin America Armored Vehicle Market Market Share Comparison by By Product (2016-2032)
- Table 169: Latin America Armored Vehicle Market Market Share Comparison by By Type (2016-2032)
- Table 170: Latin America Armored Vehicle Market Market Share Comparison by By Mobility (2016-2032)
- Table 171: Latin America Armored Vehicle Market Market Share Comparison by By Mode of Operation (2016-2032)
- Table 172: Latin America Armored Vehicle Market Market Share Comparison by By Point of Sale (2016-2032)
- Table 173: Latin America Armored Vehicle Market Market Share Comparison by By System (2016-2032)
- Table 174: Middle East & Africa Armored Vehicle Market Market Comparison by By Product (2016-2032)
- Table 175: Middle East & Africa Armored Vehicle Market Market Comparison by By Type (2016-2032)
- Table 176: Middle East & Africa Armored Vehicle Market Market Comparison by By Mobility (2016-2032)
- Table 177: Middle East & Africa Armored Vehicle Market Market Comparison by By Mode of Operation (2016-2032)
- Table 178: Middle East & Africa Armored Vehicle Market Market Comparison by By Point of Sale (2016-2032)
- Table 179: Middle East & Africa Armored Vehicle Market Market Comparison by By System (2016-2032)
- Table 180: Middle East & Africa Armored Vehicle Market Revenue (US$ Mn) Comparison by Country (2016-2032)
- Table 181: Middle East & Africa Armored Vehicle Market Market Revenue (US$ Mn) (2016-2032)
- Table 182: Middle East & Africa Armored Vehicle Market Market Revenue (US$ Mn) Comparison by Country (2016-2032)
- Table 183: Middle East & Africa Armored Vehicle Market Market Revenue (US$ Mn) Comparison by By Product (2016-2032)
- Table 184: Middle East & Africa Armored Vehicle Market Market Revenue (US$ Mn) Comparison by By Type (2016-2032)
- Table 185: Middle East & Africa Armored Vehicle Market Market Revenue (US$ Mn) Comparison by By Mobility (2016-2032)
- Table 186: Middle East & Africa Armored Vehicle Market Market Revenue (US$ Mn) Comparison by By Mode of Operation (2016-2032)
- Table 187: Middle East & Africa Armored Vehicle Market Market Revenue (US$ Mn) Comparison by By Point of Sale (2016-2032)
- Table 188: Middle East & Africa Armored Vehicle Market Market Revenue (US$ Mn) Comparison by By System (2016-2032)
- Table 189: Middle East & Africa Armored Vehicle Market Market Y-o-Y Growth Rate Comparison by Country (2016-2032)
- Table 190: Middle East & Africa Armored Vehicle Market Market Y-o-Y Growth Rate Comparison by By Product (2016-2032)
- Table 191: Middle East & Africa Armored Vehicle Market Market Y-o-Y Growth Rate Comparison by By Type (2016-2032)
- Table 192: Middle East & Africa Armored Vehicle Market Market Y-o-Y Growth Rate Comparison by By Mobility (2016-2032)
- Table 193: Middle East & Africa Armored Vehicle Market Market Y-o-Y Growth Rate Comparison by By Mode of Operation (2016-2032)
- Table 194: Middle East & Africa Armored Vehicle Market Market Y-o-Y Growth Rate Comparison by By Point of Sale (2016-2032)
- Table 195: Middle East & Africa Armored Vehicle Market Market Y-o-Y Growth Rate Comparison by By System (2016-2032)
- Table 196: Middle East & Africa Armored Vehicle Market Market Share Comparison by Country (2016-2032)
- Table 197: Middle East & Africa Armored Vehicle Market Market Share Comparison by By Product (2016-2032)
- Table 198: Middle East & Africa Armored Vehicle Market Market Share Comparison by By Type (2016-2032)
- Table 199: Middle East & Africa Armored Vehicle Market Market Share Comparison by By Mobility (2016-2032)
- Table 200: Middle East & Africa Armored Vehicle Market Market Share Comparison by By Mode of Operation (2016-2032)
- Table 201: Middle East & Africa Armored Vehicle Market Market Share Comparison by By Point of Sale (2016-2032)
- Table 202: Middle East & Africa Armored Vehicle Market Market Share Comparison by By System (2016-2032)
- 1. Executive Summary
-
- BAE Systems (U.K.)
- General Dynamics Corporation (U.S.)
- Rheinmetall AG (Germany)
- Krauss-Maffei Wegmann GmbH (Germany)
- Denel SOC Ltd (South Africa)
- IVECO DEFENCE VEHICLES (Italy)
- NORINCOGROUP.com Inc. (China)
- Oshkosh Defense, LLC An Oshkosh Corporation Company (U.S.)
- Otokar, a KOC Group Company (Turkey)
- Textron Systems (U.S.)
Our Clients


View Our Licence Options
