Aptamers Market By Type (Nucleic Acid and Peptide), By Application (Diagnostics, Therapeutics, Research & Development, and Other), By End User, By Region and Companies - Industry Segment Outlook, Market Assessment, Competition Scenario, Trends, and Forecast 2023-2032
-
3100
-
May 2023
-
190
-


-
This report was compiled by Trishita Deb Trishita Deb is an experienced market research and consulting professional with over 7 years of expertise across healthcare, consumer goods, and materials, contributing to over 400 healthcare-related reports. Correspondence Team Lead- Healthcare Linkedin | Detailed Market research Methodology Our methodology involves a mix of primary research, including interviews with leading mental health experts, and secondary research from reputable medical journals and databases. View Detailed Methodology Page
-
Quick Navigation
Report Overview
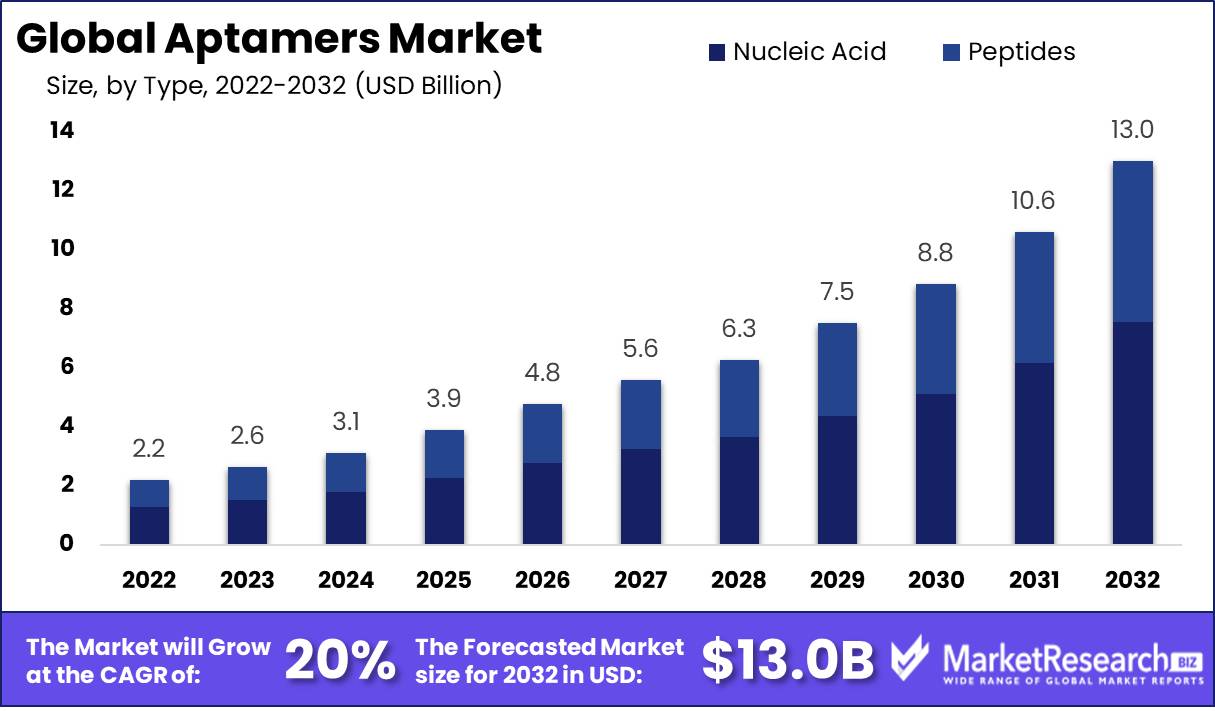
Aptamers Market size is expected to be worth around USD 13.0 Bn by 2032 from USD 2.2 Bn in 2022, growing at a CAGR of 20% during the forecast period from 2023 to 2032.
Aptamers are thermostable and can maintain their structure after repeated denaturation and renaturation cycles. The introduction of the chemical modification system, which will increase nuclease resistance and therapeutic properties, is expected to boost market growth. Global aptamers market Report offers a detailed analysis of the market. This report gives a comprehensive analysis of key market segments. Aptamers are single-stranded DNA molecules or RNA molecules that bind only to one target.
Aptamers are able to take many forms because they can form single-stranded loops or helices. Aptamers are easy to create and can be used to inhibit and identify proteins. Aptamers can be used for biotechnological and therapeutic purposes. They also have analytical applications like food safety and environmental monitoring. They are used for research, diagnostics, biosensing, and as tools for drug development or biomarker creation worldwide.
Driving factors
Rising awareness of the Advantages of Aptamers Over Antibodies
Aptamers are better at targeting small molecules than antibodies, although they have limitations. They are able to bind to small molecules and colors and can be used in standard diagnostic kits. It will result in a greater aptamers market value and acceptance of aptamers for diagnostic and therapeutic purposes.
Aptamers are also capable of binding to large molecules. Research Antibodies can be created by using recombinant DNA technology and animal models to generate antibodies. Chemical methods that are cheaper than traditional ones can be used to synthesize aptamers. Aptamers are, therefore, more attractive for developing and testing diagnostic tools and therapeutic drugs. For antibodies-based treatments for neurodegenerative disorders such as Alzheimer's, the blood-brain barrier is a more difficult problem.
Although technological advancement has helped bridge the gap, antibodies against this disorder's effectiveness and safety remain intact. Aptamer has many advantages, including a lower production cost, ease of design and synthesis, as well as high efficiency. Peptides drive innovation in the Aptamers Market, revolutionizing targeted therapies and diagnostic applications.
Restraining Factors
Low Market Acceptance as Compared to Antibodies
Aptamer market growth is impeded by the limitations of Aptamers. Aptamers have a long history of being used as therapeutic agents. They are comparable to monoclonal antibody therapeutics -like antibodies in that they are specific and highly affinity for their target. Aptamers have many advantages over antibodies, but they also have limitations that limit their widespread clinical application as therapeutic Agents.
The limitations involve serum stability, renal filtration, endocytic escape, and lack of diversity within the nuclease susceptibility, Aptamer Library, and claims of aptamer specialty. Many aptamers are susceptible to rapid degradation in biological media because of interactions with biomolecules.
Type Analysis
Nucleic Acid and Peptides are Main Products in Global Aptamers Segment
Based On type aptamers market segment is divided into nucleic acid and Peptide. Nucleic Acid holds the market's largest share with 58%. It also holds the highest revenue share. This segment is expected to see the most growth over the forecast period. Numerous companies are now investing in the nucleic acid-aptamer mechanism of action for the treatment of many disorders, including age-related macular degeneration. Due to its wide application base, the peptide-aptamer market segment will see a significant increase in revenue over the forecast period.
This testing is done using next-generation biochips that are based on molecular recognition and peptide aptamer markers system. Researchers have created peptide aptamers by using data from the data bank. The introduction of such products may increase the use of peptide-aptamers. This is due to the lower production costs and greater stability compared to the wide availability of DNA aptamers than other nucleic acids-based aptamers.
By Application Analysis
Growing Research Activities, Rising Prevalence of Cancer, and Occurrence of Malnutrition Cases During Cancer Treatment Helping the Market Grow.
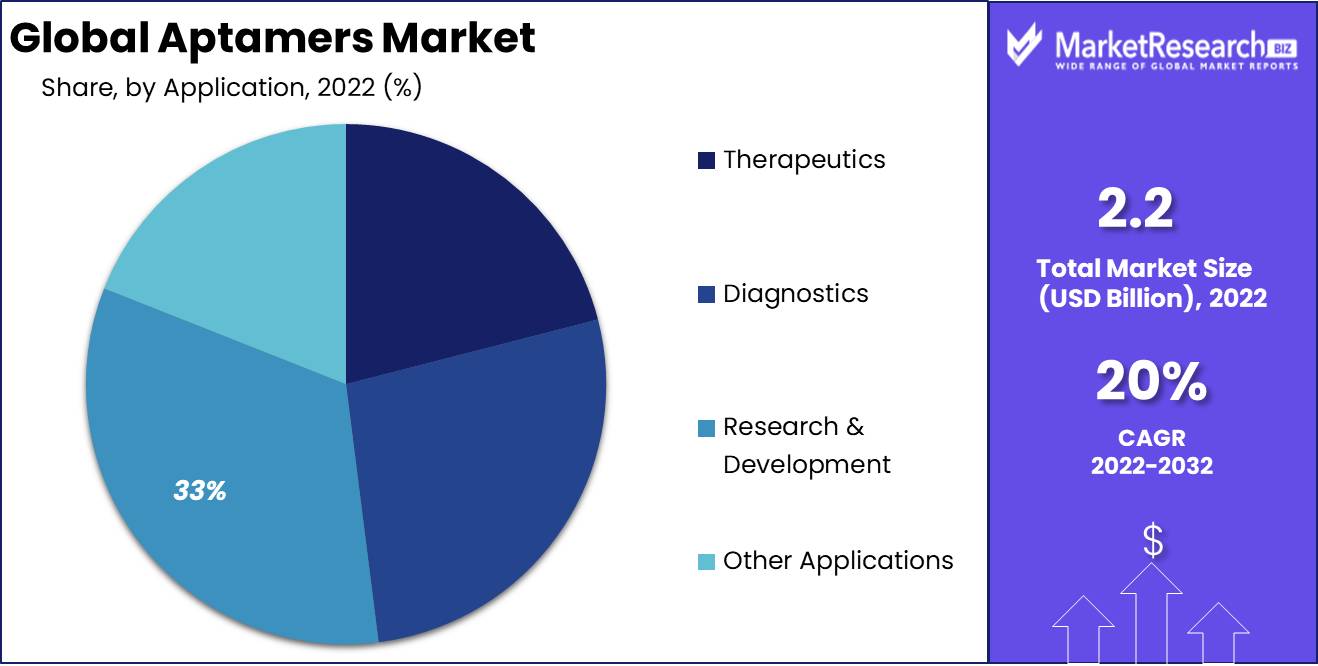
Based on application, the aptamers market segment includes therapeutics, diagnostics, research & development, and other applications. The research & development segment dominated the market in 2022 with a 33% share due to its increasing demand and growing research activities. The therapeutic development segment is the fastest-growing segment in the global aptamers market.
This segment has seen a significant increase in demand for aptamers and an increase in research in this area because of the growing number of clinical trials that evaluate aptamers for new therapies and collaborative partnerships between aptamer firms and top pharmaceutical and biopharmaceutical companies. The diagnostic segment is expected to grow at the fastest rate of CAGR due to the increasing prevalence of chronic diseases.
End-User Analysis
Pharmaceutical and Biotechnological Companies are the Largest end Users of the Aptamer Market
Based on the end-user, the aptamers market is segmented into pharmaceutical companies and biotechnological companies, contract research organizations, academic & government research organizations, and other end-users. Biotechnological and pharmaceutical companies dominate the aptamers market. This is due to the increase in key players offering custom aptamers for therapeutic development and increasing R&D spending. Due to the development of diagnostic tools for infectious diseases and cancer, the diagnostic segment will see the highest CAGR over the forecast period.
Key Market Segments
Based By Type
- Nucleic Acid
- Peptides
By Application
- Therapeutics
- Diagnostics
- Research & Development
- Other Applications
By End-User
- Pharmaceutical & Biotechnological Companies
- Contract Research Organisations
- Academic & Government Research Organisations
- Other End-Users
Growth Opportunity
Growing Healthcare Infrastructure Across the Emerging Market
Due to the growth of healthcare industries in emerging countries such as South Africa, India, and China, the aptamers market is booming. These nations need to advance their healthcare market due to the rapidly increasing geriatric population, high patient numbers, increasing per capita incomes, and increased awareness. Several aptamer development corporations recognize the potential of aptamers for diagnostic and therapeutic applications.
These aptamers market have improved their investment in healthcare infrastructure and facilities. Due to the high effectiveness of sleep apnea, machines only work in a small percentage of cases due to their dependence on consistent use and medical supervision. Due to the increase in number of applications of Aptamers in healthcare sectors, the increasing investment in this market is expected to offer growth opportunities in the market.
Latest Trends
Diagnostics Segment is Expected to Witness a Healthy Growth Rate Over the Forecast Period
The most important factor in the treatment of any disease, especially viral, is proper diagnosis. Aptamer technology has seen a dramatic rise in demand and use over the last few years. Aptamers are being used for a variety of diagnostic and therapeutic purposes. Many strategies against viruses are being investigated in a definitive and conclusive way by using aptamers.
Regional Analysis
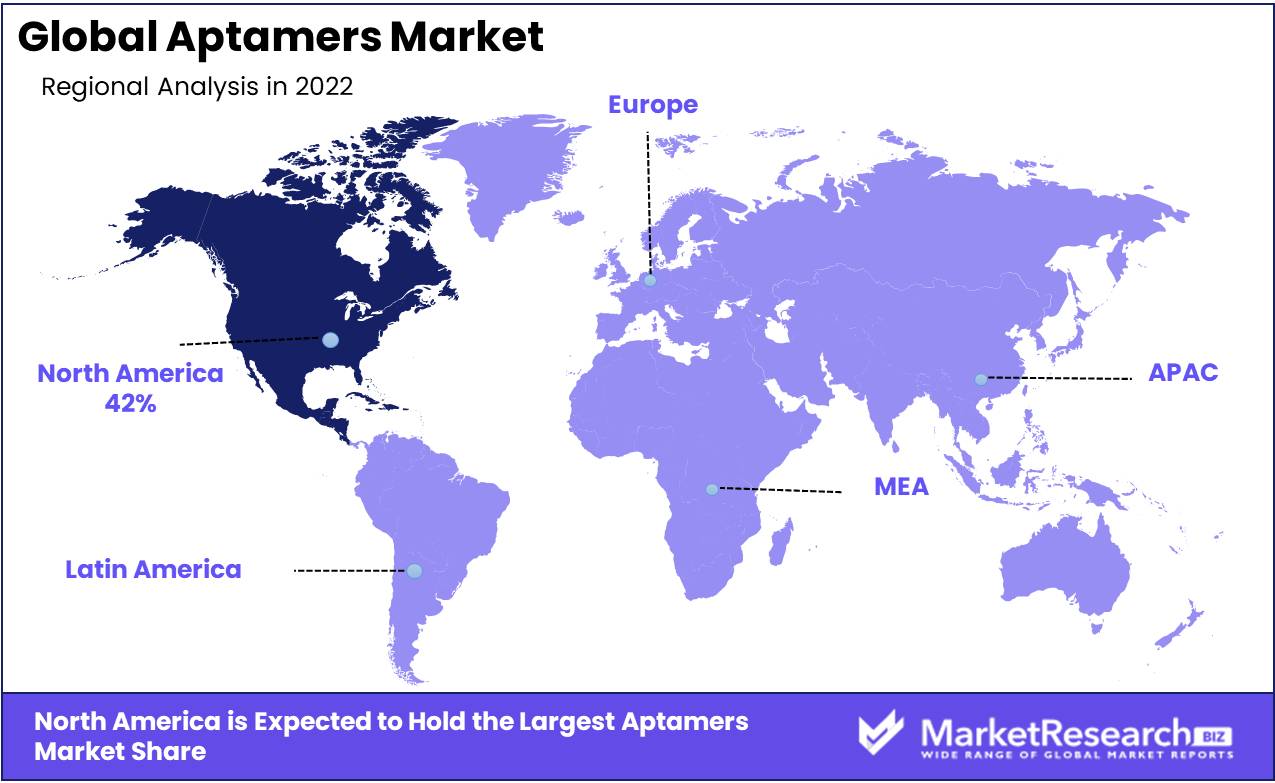
North America Dominates the Market and is Expected to Do the Same in the Forecast Period
North America was the dominant aptamers market and held the largest revenue share of 42%. Strong healthcare infrastructure, rising interest in research laboratories, and rising prevalence of chronic illnesses are major reasons for North America's dominance in the aptamers market. The Asia Pacific market will be the fastest growing during the forecast period. Approval of new aptamer products in the region has contributed to the region's growth. Research and development is the most crucial area for aptamers in North America.
Research applications account for a significant portion of the market's demand. This is also responsible for generating revenue in the aptamers market. The acceptance of personalized medicine also drives the market's growth. In the past ten years, aptamers have rapidly evolved and now target a wide range of molecules involved in tumor progression or metastasis.
Key Regions and Countries
North America
- US
- Canada
- Mexico
Western Europe
- Germany
- France
- The UK
- Spain
- Italy
- Portugal
- Ireland
- Austria
- Switzerland
- Benelux
- Nordic
- Rest of Western Europe
Eastern Europe
- Russia
- Poland
- The Czech Republic
- Greece
- Rest of Eastern Europe
APAC
- China
- Japan
- South Korea
- India
- Australia & New Zealand
- Indonesia
- Malaysia
- Philippines
- Singapore
- Thailand
- Vietnam
- Rest of APAC
Latin America
- Brazil
- Colombia
- Chile
- Argentina
- Costa Rica
- Rest of Latin America
Middle East & Africa
- Algeria
- Egypt
- Israel
- Kuwait
- Nigeria
- Saudi Arabia
- South Africa
- Turkey
- United Arab Emirates
- Rest of MEA
Key Players Analysis
Emerging key players are focused on a variety of strategic policies to develop their respective businesses in foreign markets. Several enteral feeding devices market companies are concentrating on expanding their existing operations and R&D facilities. Furthermore, businesses in the enteral feeding device market are developing new products and portfolio expansion strategies through investments and mergers, and acquisitions. In addition, several key players are now focusing on different marketing strategies, such as spreading awareness about natural ingredients, which is boosting the target products' growth.
With many local and regional players' presence, the enteral feeding device market is fragmented. Market players are subject to intense competition from top aptamers market players, particularly those with strong brand recognition and high distribution networks. Companies have gained various expansion strategies, such as partnerships and product launches, to stay on top of the market.
Top Key Players in Aptamers Market
- SomaLogic Inc.
- Vivonics Inc.
- IBA GmbH
- Aptus Biotech S.L.
- Vivonics Inc.
- Base Pair Biotechnologies Inc.
- Baush Health Companies Inc.
- KANEKA CORPORATION
- TriLink BioTechnologies
- Other Key Players
Recent Development
In August 2021: Aptamer Group collaborated with ProAxsis Limited. The agreement states that Aptamer Group produced validated Optimer ligands for ProAxsis' diagnostics.
In July 2021: Aptamer Sciences announced the selection of candidate material to a 'Corona-19 viral neutralizing aptamer’ as a non-clinical program to support the COVID-19 treatment group and vaccine new drug design group projects.
Report Scope:
Report Features Description Market Value (2022) USD 2.2 Bn Forecast Revenue (2032) USD 13.0 Bn CAGR (2023-2032) 20% Base Year for Estimation 2022 Historic Period 2016-2022 Forecast Period 2023-2032 Report Coverage Revenue Forecast, Market Dynamics, COVID-19 Impact, Competitive Landscape, Recent Developments Segments Covered By Type: Nucleic Acid and Peptides; By Application: Diagnostics, Therapeutics, Research & Development, and Other Applications; By End-User: Pharmaceutical & Biotechnological Companies, Contract Research Organisations, Academic & Government Research Organisations, and Other End-Users Regional Analysis North America – The US, Canada, & Mexico; Western Europe – Germany, France, The UK, Spain, Italy, Portugal, Ireland, Austria, Switzerland, Benelux, Nordic, & Rest of Western Europe; Eastern Europe – Russia, Poland, The Czech Republic, Greece, & Rest of Eastern Europe; APAC – China, Japan, South Korea, India, Australia & New Zealand, Indonesia, Malaysia, Philippines, Singapore, Thailand, Vietnam, & Rest of APAC; Latin America – Brazil, Colombia, Chile, Argentina, Costa Rica, & Rest of Latin America; Middle East & Africa – Algeria, Egypt, Israel, Kuwait, Nigeria, Saudi Arabia, South Africa, Turkey, United Arab Emirates, & Rest of MEA Competitive Landscape SomaLogic Inc., Vivonics Inc., IBA GmbH, Aptus Biotech S.L., Vivonics Inc., Base Pair Biotechnologies Inc., Baush Health Companies Inc., KANEKA CORPORATION, TriLink BioTechnologies, Other Key Players Customization Scope Customization for segments, region/country-level will be provided. Moreover, additional customization can be done based on the requirements. Purchase Options We have three licenses to opt for: Single User License, Multi-User License (Up to 5 Users), Corporate Use License (Unlimited User and Printable PDF) -
- 1. Executive Summary
- 1.1. Definition
- 1.2. Taxonomy
- 1.3. Research Scope
- 1.4. Key Analysis
- 1.5. Key Findings by Major Segments
- 1.6. Top strategies by Major Players
- 2. Global Aptamers Market Overview
- 2.1. Aptamers Market Dynamics
- 2.1.1. Drivers
- 2.1.2. Opportunities
- 2.1.3. Restraints
- 2.1.4. Challenges
- 2.2. Macro-economic Factors
- 2.3. Regulatory Framework
- 2.4. Market Investment Feasibility Index
- 2.5. PEST Analysis
- 2.6. PORTER’S Five Force Analysis
- 2.7. Drivers & Restraints Impact Analysis
- 2.8. Industry Chain Analysis
- 2.9. Cost Structure Analysis
- 2.10. Marketing Strategy
- 2.11. Russia-Ukraine War Impact Analysis
- 2.12. Opportunity Map Analysis
- 2.13. Market Competition Scenario Analysis
- 2.14. Product Life Cycle Analysis
- 2.15. Opportunity Orbits
- 2.16. Manufacturer Intensity Map
- 2.17. Major Companies sales by Value & Volume
- 2.1. Aptamers Market Dynamics
- 3. Global Aptamers Market Analysis, Opportunity and Forecast, 2016-2032
- 3.1. Global Aptamers Market Analysis, 2016-2021
- 3.2. Global Aptamers Market Opportunity and Forecast, 2023-2032
- 3.3. Global Aptamers Market Analysis, Opportunity and Forecast, By Type, 2016-2032
- 3.3.1. Global Aptamers Market Analysis by Type: Introduction
- 3.3.2. Market Size Absolute $ Opportunity Analysis and Forecast, By Type, 2016-2032
- 3.3.3. Nucleic Acid
- 3.3.4. Peptides
- 3.4. Global Aptamers Market Analysis, Opportunity and Forecast, By Application, 2016-2032
- 3.4.1. Global Aptamers Market Analysis by Application: Introduction
- 3.4.2. Market Size Absolute $ Opportunity Analysis and Forecast, By Application, 2016-2032
- 3.4.3. Diagnostics
- 3.4.4. Therapeutics
- 3.4.5. Research & Development
- 3.4.6. Other Applications
- 3.5. Global Aptamers Market Analysis, Opportunity and Forecast, By End User, 2016-2032
- 3.5.1. Global Aptamers Market Analysis by End User: Introduction
- 3.5.2. Market Size Absolute $ Opportunity Analysis and Forecast, By End User, 2016-2032
- 3.5.3. Pharmaceutical & Biotechnological Companies
- 3.5.4. Contract Research Organisations
- 3.5.5. Academic & Government Research Organisations
- 3.5.6. Other End-Users
- 4. North America Aptamers Market Analysis, Opportunity and Forecast, 2016-2032
- 4.1. North America Aptamers Market Analysis, 2016-2021
- 4.2. North America Aptamers Market Opportunity and Forecast, 2023-2032
- 4.3. North America Aptamers Market Analysis, Opportunity and Forecast, By Type, 2016-2032
- 4.3.1. North America Aptamers Market Analysis by Type: Introduction
- 4.3.2. Market Size Absolute $ Opportunity Analysis and Forecast, By Type, 2016-2032
- 4.3.3. Nucleic Acid
- 4.3.4. Peptides
- 4.4. North America Aptamers Market Analysis, Opportunity and Forecast, By Application, 2016-2032
- 4.4.1. North America Aptamers Market Analysis by Application: Introduction
- 4.4.2. Market Size Absolute $ Opportunity Analysis and Forecast, By Application, 2016-2032
- 4.4.3. Diagnostics
- 4.4.4. Therapeutics
- 4.4.5. Research & Development
- 4.4.6. Other Applications
- 4.5. North America Aptamers Market Analysis, Opportunity and Forecast, By End User, 2016-2032
- 4.5.1. North America Aptamers Market Analysis by End User: Introduction
- 4.5.2. Market Size Absolute $ Opportunity Analysis and Forecast, By End User, 2016-2032
- 4.5.3. Pharmaceutical & Biotechnological Companies
- 4.5.4. Contract Research Organisations
- 4.5.5. Academic & Government Research Organisations
- 4.5.6. Other End-Users
- 4.6. North America Aptamers Market Analysis, Opportunity and Forecast, By Country , 2016-2032
- 4.6.1. North America Aptamers Market Analysis by Country : Introduction
- 4.6.2. Market Size Absolute $ Opportunity Analysis and Forecast, Country , 2016-2032
- 4.6.2.1. The US
- 4.6.2.2. Canada
- 4.6.2.3. Mexico
- 5. Western Europe Aptamers Market Analysis, Opportunity and Forecast, 2016-2032
- 5.1. Western Europe Aptamers Market Analysis, 2016-2021
- 5.2. Western Europe Aptamers Market Opportunity and Forecast, 2023-2032
- 5.3. Western Europe Aptamers Market Analysis, Opportunity and Forecast, By Type, 2016-2032
- 5.3.1. Western Europe Aptamers Market Analysis by Type: Introduction
- 5.3.2. Market Size Absolute $ Opportunity Analysis and Forecast, By Type, 2016-2032
- 5.3.3. Nucleic Acid
- 5.3.4. Peptides
- 5.4. Western Europe Aptamers Market Analysis, Opportunity and Forecast, By Application, 2016-2032
- 5.4.1. Western Europe Aptamers Market Analysis by Application: Introduction
- 5.4.2. Market Size Absolute $ Opportunity Analysis and Forecast, By Application, 2016-2032
- 5.4.3. Diagnostics
- 5.4.4. Therapeutics
- 5.4.5. Research & Development
- 5.4.6. Other Applications
- 5.5. Western Europe Aptamers Market Analysis, Opportunity and Forecast, By End User, 2016-2032
- 5.5.1. Western Europe Aptamers Market Analysis by End User: Introduction
- 5.5.2. Market Size Absolute $ Opportunity Analysis and Forecast, By End User, 2016-2032
- 5.5.3. Pharmaceutical & Biotechnological Companies
- 5.5.4. Contract Research Organisations
- 5.5.5. Academic & Government Research Organisations
- 5.5.6. Other End-Users
- 5.6. Western Europe Aptamers Market Analysis, Opportunity and Forecast, By Country , 2016-2032
- 5.6.1. Western Europe Aptamers Market Analysis by Country : Introduction
- 5.6.2. Market Size Absolute $ Opportunity Analysis and Forecast, Country , 2016-2032
- 5.6.2.1. Germany
- 5.6.2.2. France
- 5.6.2.3. The UK
- 5.6.2.4. Spain
- 5.6.2.5. Italy
- 5.6.2.6. Portugal
- 5.6.2.7. Ireland
- 5.6.2.8. Austria
- 5.6.2.9. Switzerland
- 5.6.2.10. Benelux
- 5.6.2.11. Nordic
- 5.6.2.12. Rest of Western Europe
- 6. Eastern Europe Aptamers Market Analysis, Opportunity and Forecast, 2016-2032
- 6.1. Eastern Europe Aptamers Market Analysis, 2016-2021
- 6.2. Eastern Europe Aptamers Market Opportunity and Forecast, 2023-2032
- 6.3. Eastern Europe Aptamers Market Analysis, Opportunity and Forecast, By Type, 2016-2032
- 6.3.1. Eastern Europe Aptamers Market Analysis by Type: Introduction
- 6.3.2. Market Size Absolute $ Opportunity Analysis and Forecast, By Type, 2016-2032
- 6.3.3. Nucleic Acid
- 6.3.4. Peptides
- 6.4. Eastern Europe Aptamers Market Analysis, Opportunity and Forecast, By Application, 2016-2032
- 6.4.1. Eastern Europe Aptamers Market Analysis by Application: Introduction
- 6.4.2. Market Size Absolute $ Opportunity Analysis and Forecast, By Application, 2016-2032
- 6.4.3. Diagnostics
- 6.4.4. Therapeutics
- 6.4.5. Research & Development
- 6.4.6. Other Applications
- 6.5. Eastern Europe Aptamers Market Analysis, Opportunity and Forecast, By End User, 2016-2032
- 6.5.1. Eastern Europe Aptamers Market Analysis by End User: Introduction
- 6.5.2. Market Size Absolute $ Opportunity Analysis and Forecast, By End User, 2016-2032
- 6.5.3. Pharmaceutical & Biotechnological Companies
- 6.5.4. Contract Research Organisations
- 6.5.5. Academic & Government Research Organisations
- 6.5.6. Other End-Users
- 6.6. Eastern Europe Aptamers Market Analysis, Opportunity and Forecast, By Country , 2016-2032
- 6.6.1. Eastern Europe Aptamers Market Analysis by Country : Introduction
- 6.6.2. Market Size Absolute $ Opportunity Analysis and Forecast, Country , 2016-2032
- 6.6.2.1. Russia
- 6.6.2.2. Poland
- 6.6.2.3. The Czech Republic
- 6.6.2.4. Greece
- 6.6.2.5. Rest of Eastern Europe
- 7. APAC Aptamers Market Analysis, Opportunity and Forecast, 2016-2032
- 7.1. APAC Aptamers Market Analysis, 2016-2021
- 7.2. APAC Aptamers Market Opportunity and Forecast, 2023-2032
- 7.3. APAC Aptamers Market Analysis, Opportunity and Forecast, By Type, 2016-2032
- 7.3.1. APAC Aptamers Market Analysis by Type: Introduction
- 7.3.2. Market Size Absolute $ Opportunity Analysis and Forecast, By Type, 2016-2032
- 7.3.3. Nucleic Acid
- 7.3.4. Peptides
- 7.4. APAC Aptamers Market Analysis, Opportunity and Forecast, By Application, 2016-2032
- 7.4.1. APAC Aptamers Market Analysis by Application: Introduction
- 7.4.2. Market Size Absolute $ Opportunity Analysis and Forecast, By Application, 2016-2032
- 7.4.3. Diagnostics
- 7.4.4. Therapeutics
- 7.4.5. Research & Development
- 7.4.6. Other Applications
- 7.5. APAC Aptamers Market Analysis, Opportunity and Forecast, By End User, 2016-2032
- 7.5.1. APAC Aptamers Market Analysis by End User: Introduction
- 7.5.2. Market Size Absolute $ Opportunity Analysis and Forecast, By End User, 2016-2032
- 7.5.3. Pharmaceutical & Biotechnological Companies
- 7.5.4. Contract Research Organisations
- 7.5.5. Academic & Government Research Organisations
- 7.5.6. Other End-Users
- 7.6. APAC Aptamers Market Analysis, Opportunity and Forecast, By Country , 2016-2032
- 7.6.1. APAC Aptamers Market Analysis by Country : Introduction
- 7.6.2. Market Size Absolute $ Opportunity Analysis and Forecast, Country , 2016-2032
- 7.6.2.1. China
- 7.6.2.2. Japan
- 7.6.2.3. South Korea
- 7.6.2.4. India
- 7.6.2.5. Australia & New Zeland
- 7.6.2.6. Indonesia
- 7.6.2.7. Malaysia
- 7.6.2.8. Philippines
- 7.6.2.9. Singapore
- 7.6.2.10. Thailand
- 7.6.2.11. Vietnam
- 7.6.2.12. Rest of APAC
- 8. Latin America Aptamers Market Analysis, Opportunity and Forecast, 2016-2032
- 8.1. Latin America Aptamers Market Analysis, 2016-2021
- 8.2. Latin America Aptamers Market Opportunity and Forecast, 2023-2032
- 8.3. Latin America Aptamers Market Analysis, Opportunity and Forecast, By Type, 2016-2032
- 8.3.1. Latin America Aptamers Market Analysis by Type: Introduction
- 8.3.2. Market Size Absolute $ Opportunity Analysis and Forecast, By Type, 2016-2032
- 8.3.3. Nucleic Acid
- 8.3.4. Peptides
- 8.4. Latin America Aptamers Market Analysis, Opportunity and Forecast, By Application, 2016-2032
- 8.4.1. Latin America Aptamers Market Analysis by Application: Introduction
- 8.4.2. Market Size Absolute $ Opportunity Analysis and Forecast, By Application, 2016-2032
- 8.4.3. Diagnostics
- 8.4.4. Therapeutics
- 8.4.5. Research & Development
- 8.4.6. Other Applications
- 8.5. Latin America Aptamers Market Analysis, Opportunity and Forecast, By End User, 2016-2032
- 8.5.1. Latin America Aptamers Market Analysis by End User: Introduction
- 8.5.2. Market Size Absolute $ Opportunity Analysis and Forecast, By End User, 2016-2032
- 8.5.3. Pharmaceutical & Biotechnological Companies
- 8.5.4. Contract Research Organisations
- 8.5.5. Academic & Government Research Organisations
- 8.5.6. Other End-Users
- 8.6. Latin America Aptamers Market Analysis, Opportunity and Forecast, By Country , 2016-2032
- 8.6.1. Latin America Aptamers Market Analysis by Country : Introduction
- 8.6.2. Market Size Absolute $ Opportunity Analysis and Forecast, Country , 2016-2032
- 8.6.2.1. Brazil
- 8.6.2.2. Colombia
- 8.6.2.3. Chile
- 8.6.2.4. Argentina
- 8.6.2.5. Costa Rica
- 8.6.2.6. Rest of Latin America
- 9. Middle East & Africa Aptamers Market Analysis, Opportunity and Forecast, 2016-2032
- 9.1. Middle East & Africa Aptamers Market Analysis, 2016-2021
- 9.2. Middle East & Africa Aptamers Market Opportunity and Forecast, 2023-2032
- 9.3. Middle East & Africa Aptamers Market Analysis, Opportunity and Forecast, By Type, 2016-2032
- 9.3.1. Middle East & Africa Aptamers Market Analysis by Type: Introduction
- 9.3.2. Market Size Absolute $ Opportunity Analysis and Forecast, By Type, 2016-2032
- 9.3.3. Nucleic Acid
- 9.3.4. Peptides
- 9.4. Middle East & Africa Aptamers Market Analysis, Opportunity and Forecast, By Application, 2016-2032
- 9.4.1. Middle East & Africa Aptamers Market Analysis by Application: Introduction
- 9.4.2. Market Size Absolute $ Opportunity Analysis and Forecast, By Application, 2016-2032
- 9.4.3. Diagnostics
- 9.4.4. Therapeutics
- 9.4.5. Research & Development
- 9.4.6. Other Applications
- 9.5. Middle East & Africa Aptamers Market Analysis, Opportunity and Forecast, By End User, 2016-2032
- 9.5.1. Middle East & Africa Aptamers Market Analysis by End User: Introduction
- 9.5.2. Market Size Absolute $ Opportunity Analysis and Forecast, By End User, 2016-2032
- 9.5.3. Pharmaceutical & Biotechnological Companies
- 9.5.4. Contract Research Organisations
- 9.5.5. Academic & Government Research Organisations
- 9.5.6. Other End-Users
- 9.6. Middle East & Africa Aptamers Market Analysis, Opportunity and Forecast, By Country , 2016-2032
- 9.6.1. Middle East & Africa Aptamers Market Analysis by Country : Introduction
- 9.6.2. Market Size Absolute $ Opportunity Analysis and Forecast, Country , 2016-2032
- 9.6.2.1. Algeria
- 9.6.2.2. Egypt
- 9.6.2.3. Israel
- 9.6.2.4. Kuwait
- 9.6.2.5. Nigeria
- 9.6.2.6. Saudi Arabia
- 9.6.2.7. South Africa
- 9.6.2.8. Turkey
- 9.6.2.9. The UAE
- 9.6.2.10. Rest of MEA
- 10. Global Aptamers Market Analysis, Opportunity and Forecast, By Region , 2016-2032
- 10.1. Global Aptamers Market Analysis by Region : Introduction
- 10.2. Market Size Absolute $ Opportunity Analysis and Forecast, By Region , 2016-2032
- 10.2.1. North America
- 10.2.2. Western Europe
- 10.2.3. Eastern Europe
- 10.2.4. APAC
- 10.2.5. Latin America
- 10.2.6. Middle East & Africa
- 11. Global Aptamers Market Competitive Landscape, Market Share Analysis, and Company Profiles
- 11.1. Market Share Analysis
- 11.2. Company Profiles
- 11.3. SomaLogic Inc.
- 11.3.1. Company Overview
- 11.3.2. Financial Highlights
- 11.3.3. Product Portfolio
- 11.3.4. SWOT Analysis
- 11.3.5. Key Strategies and Developments
- 11.4. Vivonics Inc.
- 11.4.1. Company Overview
- 11.4.2. Financial Highlights
- 11.4.3. Product Portfolio
- 11.4.4. SWOT Analysis
- 11.4.5. Key Strategies and Developments
- 11.5. IBA GmbH
- 11.5.1. Company Overview
- 11.5.2. Financial Highlights
- 11.5.3. Product Portfolio
- 11.5.4. SWOT Analysis
- 11.5.5. Key Strategies and Developments
- 11.6. Aptus Biotech S.L.
- 11.6.1. Company Overview
- 11.6.2. Financial Highlights
- 11.6.3. Product Portfolio
- 11.6.4. SWOT Analysis
- 11.6.5. Key Strategies and Developments
- 11.7. Vivonics Inc.
- 11.7.1. Company Overview
- 11.7.2. Financial Highlights
- 11.7.3. Product Portfolio
- 11.7.4. SWOT Analysis
- 11.7.5. Key Strategies and Developments
- 11.8. Base Pair Technologies Inc.
- 11.8.1. Company Overview
- 11.8.2. Financial Highlights
- 11.8.3. Product Portfolio
- 11.8.4. SWOT Analysis
- 11.8.5. Key Strategies and Developments
- 11.9. Baush Health Companies Inc.
- 11.9.1. Company Overview
- 11.9.2. Financial Highlights
- 11.9.3. Product Portfolio
- 11.9.4. SWOT Analysis
- 11.9.5. Key Strategies and Developments
- 11.10. KANEKA CORPORATION
- 11.10.1. Company Overview
- 11.10.2. Financial Highlights
- 11.10.3. Product Portfolio
- 11.10.4. SWOT Analysis
- 11.10.5. Key Strategies and Developments
- 11.11. Other Key Players
- 11.11.1. Company Overview
- 11.11.2. Financial Highlights
- 11.11.3. Product Portfolio
- 11.11.4. SWOT Analysis
- 11.11.5. Key Strategies and Developments
- 12. Assumptions and Acronyms
- 13. Research Methodology
- 14. Contact
- List of Figures
- Figure 1: Global Aptamers Market Revenue (US$ Mn) Market Share by Type in 2022
- Figure 2: Global Aptamers Market Attractiveness Analysis by Type, 2016-2032
- Figure 3: Global Aptamers Market Revenue (US$ Mn) Market Share by Applicationin 2022
- Figure 4: Global Aptamers Market Attractiveness Analysis by Application, 2016-2032
- Figure 5: Global Aptamers Market Revenue (US$ Mn) Market Share by End Userin 2022
- Figure 6: Global Aptamers Market Attractiveness Analysis by End User, 2016-2032
- Figure 7: Global Aptamers Market Revenue (US$ Mn) Market Share by Region in 2022
- Figure 8: Global Aptamers Market Attractiveness Analysis by Region, 2016-2032
- Figure 9: Global Aptamers Market Revenue (US$ Mn) (2016-2032)
- Figure 10: Global Aptamers Market Revenue (US$ Mn) Comparison by Region (2016-2032)
- Figure 11: Global Aptamers Market Revenue (US$ Mn) Comparison by Type (2016-2032)
- Figure 12: Global Aptamers Market Revenue (US$ Mn) Comparison by Application (2016-2032)
- Figure 13: Global Aptamers Market Revenue (US$ Mn) Comparison by End User (2016-2032)
- Figure 14: Global Aptamers Market Y-o-Y Growth Rate Comparison by Region (2016-2032)
- Figure 15: Global Aptamers Market Y-o-Y Growth Rate Comparison by Type (2016-2032)
- Figure 16: Global Aptamers Market Y-o-Y Growth Rate Comparison by Application (2016-2032)
- Figure 17: Global Aptamers Market Y-o-Y Growth Rate Comparison by End User (2016-2032)
- Figure 18: Global Aptamers Market Share Comparison by Region (2016-2032)
- Figure 19: Global Aptamers Market Share Comparison by Type (2016-2032)
- Figure 20: Global Aptamers Market Share Comparison by Application (2016-2032)
- Figure 21: Global Aptamers Market Share Comparison by End User (2016-2032)
- Figure 22: North America Aptamers Market Revenue (US$ Mn) Market Share by Typein 2022
- Figure 23: North America Aptamers Market Attractiveness Analysis by Type, 2016-2032
- Figure 24: North America Aptamers Market Revenue (US$ Mn) Market Share by Applicationin 2022
- Figure 25: North America Aptamers Market Attractiveness Analysis by Application, 2016-2032
- Figure 26: North America Aptamers Market Revenue (US$ Mn) Market Share by End Userin 2022
- Figure 27: North America Aptamers Market Attractiveness Analysis by End User, 2016-2032
- Figure 28: North America Aptamers Market Revenue (US$ Mn) Market Share by Country in 2022
- Figure 29: North America Aptamers Market Attractiveness Analysis by Country, 2016-2032
- Figure 30: North America Aptamers Market Revenue (US$ Mn) (2016-2032)
- Figure 31: North America Aptamers Market Revenue (US$ Mn) Comparison by Country (2016-2032)
- Figure 32: North America Aptamers Market Revenue (US$ Mn) Comparison by Type (2016-2032)
- Figure 33: North America Aptamers Market Revenue (US$ Mn) Comparison by Application (2016-2032)
- Figure 34: North America Aptamers Market Revenue (US$ Mn) Comparison by End User (2016-2032)
- Figure 35: North America Aptamers Market Y-o-Y Growth Rate Comparison by Country (2016-2032)
- Figure 36: North America Aptamers Market Y-o-Y Growth Rate Comparison by Type (2016-2032)
- Figure 37: North America Aptamers Market Y-o-Y Growth Rate Comparison by Application (2016-2032)
- Figure 38: North America Aptamers Market Y-o-Y Growth Rate Comparison by End User (2016-2032)
- Figure 39: North America Aptamers Market Share Comparison by Country (2016-2032)
- Figure 40: North America Aptamers Market Share Comparison by Type (2016-2032)
- Figure 41: North America Aptamers Market Share Comparison by Application (2016-2032)
- Figure 42: North America Aptamers Market Share Comparison by End User (2016-2032)
- Figure 43: Western Europe Aptamers Market Revenue (US$ Mn) Market Share by Typein 2022
- Figure 44: Western Europe Aptamers Market Attractiveness Analysis by Type, 2016-2032
- Figure 45: Western Europe Aptamers Market Revenue (US$ Mn) Market Share by Applicationin 2022
- Figure 46: Western Europe Aptamers Market Attractiveness Analysis by Application, 2016-2032
- Figure 47: Western Europe Aptamers Market Revenue (US$ Mn) Market Share by End Userin 2022
- Figure 48: Western Europe Aptamers Market Attractiveness Analysis by End User, 2016-2032
- Figure 49: Western Europe Aptamers Market Revenue (US$ Mn) Market Share by Country in 2022
- Figure 50: Western Europe Aptamers Market Attractiveness Analysis by Country, 2016-2032
- Figure 51: Western Europe Aptamers Market Revenue (US$ Mn) (2016-2032)
- Figure 52: Western Europe Aptamers Market Revenue (US$ Mn) Comparison by Country (2016-2032)
- Figure 53: Western Europe Aptamers Market Revenue (US$ Mn) Comparison by Type (2016-2032)
- Figure 54: Western Europe Aptamers Market Revenue (US$ Mn) Comparison by Application (2016-2032)
- Figure 55: Western Europe Aptamers Market Revenue (US$ Mn) Comparison by End User (2016-2032)
- Figure 56: Western Europe Aptamers Market Y-o-Y Growth Rate Comparison by Country (2016-2032)
- Figure 57: Western Europe Aptamers Market Y-o-Y Growth Rate Comparison by Type (2016-2032)
- Figure 58: Western Europe Aptamers Market Y-o-Y Growth Rate Comparison by Application (2016-2032)
- Figure 59: Western Europe Aptamers Market Y-o-Y Growth Rate Comparison by End User (2016-2032)
- Figure 60: Western Europe Aptamers Market Share Comparison by Country (2016-2032)
- Figure 61: Western Europe Aptamers Market Share Comparison by Type (2016-2032)
- Figure 62: Western Europe Aptamers Market Share Comparison by Application (2016-2032)
- Figure 63: Western Europe Aptamers Market Share Comparison by End User (2016-2032)
- Figure 64: Eastern Europe Aptamers Market Revenue (US$ Mn) Market Share by Typein 2022
- Figure 65: Eastern Europe Aptamers Market Attractiveness Analysis by Type, 2016-2032
- Figure 66: Eastern Europe Aptamers Market Revenue (US$ Mn) Market Share by Applicationin 2022
- Figure 67: Eastern Europe Aptamers Market Attractiveness Analysis by Application, 2016-2032
- Figure 68: Eastern Europe Aptamers Market Revenue (US$ Mn) Market Share by End Userin 2022
- Figure 69: Eastern Europe Aptamers Market Attractiveness Analysis by End User, 2016-2032
- Figure 70: Eastern Europe Aptamers Market Revenue (US$ Mn) Market Share by Country in 2022
- Figure 71: Eastern Europe Aptamers Market Attractiveness Analysis by Country, 2016-2032
- Figure 72: Eastern Europe Aptamers Market Revenue (US$ Mn) (2016-2032)
- Figure 73: Eastern Europe Aptamers Market Revenue (US$ Mn) Comparison by Country (2016-2032)
- Figure 74: Eastern Europe Aptamers Market Revenue (US$ Mn) Comparison by Type (2016-2032)
- Figure 75: Eastern Europe Aptamers Market Revenue (US$ Mn) Comparison by Application (2016-2032)
- Figure 76: Eastern Europe Aptamers Market Revenue (US$ Mn) Comparison by End User (2016-2032)
- Figure 77: Eastern Europe Aptamers Market Y-o-Y Growth Rate Comparison by Country (2016-2032)
- Figure 78: Eastern Europe Aptamers Market Y-o-Y Growth Rate Comparison by Type (2016-2032)
- Figure 79: Eastern Europe Aptamers Market Y-o-Y Growth Rate Comparison by Application (2016-2032)
- Figure 80: Eastern Europe Aptamers Market Y-o-Y Growth Rate Comparison by End User (2016-2032)
- Figure 81: Eastern Europe Aptamers Market Share Comparison by Country (2016-2032)
- Figure 82: Eastern Europe Aptamers Market Share Comparison by Type (2016-2032)
- Figure 83: Eastern Europe Aptamers Market Share Comparison by Application (2016-2032)
- Figure 84: Eastern Europe Aptamers Market Share Comparison by End User (2016-2032)
- Figure 85: APAC Aptamers Market Revenue (US$ Mn) Market Share by Typein 2022
- Figure 86: APAC Aptamers Market Attractiveness Analysis by Type, 2016-2032
- Figure 87: APAC Aptamers Market Revenue (US$ Mn) Market Share by Applicationin 2022
- Figure 88: APAC Aptamers Market Attractiveness Analysis by Application, 2016-2032
- Figure 89: APAC Aptamers Market Revenue (US$ Mn) Market Share by End Userin 2022
- Figure 90: APAC Aptamers Market Attractiveness Analysis by End User, 2016-2032
- Figure 91: APAC Aptamers Market Revenue (US$ Mn) Market Share by Country in 2022
- Figure 92: APAC Aptamers Market Attractiveness Analysis by Country, 2016-2032
- Figure 93: APAC Aptamers Market Revenue (US$ Mn) (2016-2032)
- Figure 94: APAC Aptamers Market Revenue (US$ Mn) Comparison by Country (2016-2032)
- Figure 95: APAC Aptamers Market Revenue (US$ Mn) Comparison by Type (2016-2032)
- Figure 96: APAC Aptamers Market Revenue (US$ Mn) Comparison by Application (2016-2032)
- Figure 97: APAC Aptamers Market Revenue (US$ Mn) Comparison by End User (2016-2032)
- Figure 98: APAC Aptamers Market Y-o-Y Growth Rate Comparison by Country (2016-2032)
- Figure 99: APAC Aptamers Market Y-o-Y Growth Rate Comparison by Type (2016-2032)
- Figure 100: APAC Aptamers Market Y-o-Y Growth Rate Comparison by Application (2016-2032)
- Figure 101: APAC Aptamers Market Y-o-Y Growth Rate Comparison by End User (2016-2032)
- Figure 102: APAC Aptamers Market Share Comparison by Country (2016-2032)
- Figure 103: APAC Aptamers Market Share Comparison by Type (2016-2032)
- Figure 104: APAC Aptamers Market Share Comparison by Application (2016-2032)
- Figure 105: APAC Aptamers Market Share Comparison by End User (2016-2032)
- Figure 106: Latin America Aptamers Market Revenue (US$ Mn) Market Share by Typein 2022
- Figure 107: Latin America Aptamers Market Attractiveness Analysis by Type, 2016-2032
- Figure 108: Latin America Aptamers Market Revenue (US$ Mn) Market Share by Applicationin 2022
- Figure 109: Latin America Aptamers Market Attractiveness Analysis by Application, 2016-2032
- Figure 110: Latin America Aptamers Market Revenue (US$ Mn) Market Share by End Userin 2022
- Figure 111: Latin America Aptamers Market Attractiveness Analysis by End User, 2016-2032
- Figure 112: Latin America Aptamers Market Revenue (US$ Mn) Market Share by Country in 2022
- Figure 113: Latin America Aptamers Market Attractiveness Analysis by Country, 2016-2032
- Figure 114: Latin America Aptamers Market Revenue (US$ Mn) (2016-2032)
- Figure 115: Latin America Aptamers Market Revenue (US$ Mn) Comparison by Country (2016-2032)
- Figure 116: Latin America Aptamers Market Revenue (US$ Mn) Comparison by Type (2016-2032)
- Figure 117: Latin America Aptamers Market Revenue (US$ Mn) Comparison by Application (2016-2032)
- Figure 118: Latin America Aptamers Market Revenue (US$ Mn) Comparison by End User (2016-2032)
- Figure 119: Latin America Aptamers Market Y-o-Y Growth Rate Comparison by Country (2016-2032)
- Figure 120: Latin America Aptamers Market Y-o-Y Growth Rate Comparison by Type (2016-2032)
- Figure 121: Latin America Aptamers Market Y-o-Y Growth Rate Comparison by Application (2016-2032)
- Figure 122: Latin America Aptamers Market Y-o-Y Growth Rate Comparison by End User (2016-2032)
- Figure 123: Latin America Aptamers Market Share Comparison by Country (2016-2032)
- Figure 124: Latin America Aptamers Market Share Comparison by Type (2016-2032)
- Figure 125: Latin America Aptamers Market Share Comparison by Application (2016-2032)
- Figure 126: Latin America Aptamers Market Share Comparison by End User (2016-2032)
- Figure 127: Middle East & Africa Aptamers Market Revenue (US$ Mn) Market Share by Typein 2022
- Figure 128: Middle East & Africa Aptamers Market Attractiveness Analysis by Type, 2016-2032
- Figure 129: Middle East & Africa Aptamers Market Revenue (US$ Mn) Market Share by Applicationin 2022
- Figure 130: Middle East & Africa Aptamers Market Attractiveness Analysis by Application, 2016-2032
- Figure 131: Middle East & Africa Aptamers Market Revenue (US$ Mn) Market Share by End Userin 2022
- Figure 132: Middle East & Africa Aptamers Market Attractiveness Analysis by End User, 2016-2032
- Figure 133: Middle East & Africa Aptamers Market Revenue (US$ Mn) Market Share by Country in 2022
- Figure 134: Middle East & Africa Aptamers Market Attractiveness Analysis by Country, 2016-2032
- Figure 135: Middle East & Africa Aptamers Market Revenue (US$ Mn) (2016-2032)
- Figure 136: Middle East & Africa Aptamers Market Revenue (US$ Mn) Comparison by Country (2016-2032)
- Figure 137: Middle East & Africa Aptamers Market Revenue (US$ Mn) Comparison by Type (2016-2032)
- Figure 138: Middle East & Africa Aptamers Market Revenue (US$ Mn) Comparison by Application (2016-2032)
- Figure 139: Middle East & Africa Aptamers Market Revenue (US$ Mn) Comparison by End User (2016-2032)
- Figure 140: Middle East & Africa Aptamers Market Y-o-Y Growth Rate Comparison by Country (2016-2032)
- Figure 141: Middle East & Africa Aptamers Market Y-o-Y Growth Rate Comparison by Type (2016-2032)
- Figure 142: Middle East & Africa Aptamers Market Y-o-Y Growth Rate Comparison by Application (2016-2032)
- Figure 143: Middle East & Africa Aptamers Market Y-o-Y Growth Rate Comparison by End User (2016-2032)
- Figure 144: Middle East & Africa Aptamers Market Share Comparison by Country (2016-2032)
- Figure 145: Middle East & Africa Aptamers Market Share Comparison by Type (2016-2032)
- Figure 146: Middle East & Africa Aptamers Market Share Comparison by Application (2016-2032)
- Figure 147: Middle East & Africa Aptamers Market Share Comparison by End User (2016-2032)
- List of Tables
- Table 1: Global Aptamers Market Comparison by Type (2016-2032)
- Table 2: Global Aptamers Market Comparison by Application (2016-2032)
- Table 3: Global Aptamers Market Comparison by End User (2016-2032)
- Table 4: Global Aptamers Market Revenue (US$ Mn) Comparison by Region (2016-2032)
- Table 5: Global Aptamers Market Revenue (US$ Mn) (2016-2032)
- Table 6: Global Aptamers Market Revenue (US$ Mn) Comparison by Region (2016-2032)
- Table 7: Global Aptamers Market Revenue (US$ Mn) Comparison by Type (2016-2032)
- Table 8: Global Aptamers Market Revenue (US$ Mn) Comparison by Application (2016-2032)
- Table 9: Global Aptamers Market Revenue (US$ Mn) Comparison by End User (2016-2032)
- Table 10: Global Aptamers Market Y-o-Y Growth Rate Comparison by Region (2016-2032)
- Table 11: Global Aptamers Market Y-o-Y Growth Rate Comparison by Type (2016-2032)
- Table 12: Global Aptamers Market Y-o-Y Growth Rate Comparison by Application (2016-2032)
- Table 13: Global Aptamers Market Y-o-Y Growth Rate Comparison by End User (2016-2032)
- Table 14: Global Aptamers Market Share Comparison by Region (2016-2032)
- Table 15: Global Aptamers Market Share Comparison by Type (2016-2032)
- Table 16: Global Aptamers Market Share Comparison by Application (2016-2032)
- Table 17: Global Aptamers Market Share Comparison by End User (2016-2032)
- Table 18: North America Aptamers Market Comparison by Application (2016-2032)
- Table 19: North America Aptamers Market Comparison by End User (2016-2032)
- Table 20: North America Aptamers Market Revenue (US$ Mn) Comparison by Country (2016-2032)
- Table 21: North America Aptamers Market Revenue (US$ Mn) (2016-2032)
- Table 22: North America Aptamers Market Revenue (US$ Mn) Comparison by Country (2016-2032)
- Table 23: North America Aptamers Market Revenue (US$ Mn) Comparison by Type (2016-2032)
- Table 24: North America Aptamers Market Revenue (US$ Mn) Comparison by Application (2016-2032)
- Table 25: North America Aptamers Market Revenue (US$ Mn) Comparison by End User (2016-2032)
- Table 26: North America Aptamers Market Y-o-Y Growth Rate Comparison by Country (2016-2032)
- Table 27: North America Aptamers Market Y-o-Y Growth Rate Comparison by Type (2016-2032)
- Table 28: North America Aptamers Market Y-o-Y Growth Rate Comparison by Application (2016-2032)
- Table 29: North America Aptamers Market Y-o-Y Growth Rate Comparison by End User (2016-2032)
- Table 30: North America Aptamers Market Share Comparison by Country (2016-2032)
- Table 31: North America Aptamers Market Share Comparison by Type (2016-2032)
- Table 32: North America Aptamers Market Share Comparison by Application (2016-2032)
- Table 33: North America Aptamers Market Share Comparison by End User (2016-2032)
- Table 34: Western Europe Aptamers Market Comparison by Type (2016-2032)
- Table 35: Western Europe Aptamers Market Comparison by Application (2016-2032)
- Table 36: Western Europe Aptamers Market Comparison by End User (2016-2032)
- Table 37: Western Europe Aptamers Market Revenue (US$ Mn) Comparison by Country (2016-2032)
- Table 38: Western Europe Aptamers Market Revenue (US$ Mn) (2016-2032)
- Table 39: Western Europe Aptamers Market Revenue (US$ Mn) Comparison by Country (2016-2032)
- Table 40: Western Europe Aptamers Market Revenue (US$ Mn) Comparison by Type (2016-2032)
- Table 41: Western Europe Aptamers Market Revenue (US$ Mn) Comparison by Application (2016-2032)
- Table 42: Western Europe Aptamers Market Revenue (US$ Mn) Comparison by End User (2016-2032)
- Table 43: Western Europe Aptamers Market Y-o-Y Growth Rate Comparison by Country (2016-2032)
- Table 44: Western Europe Aptamers Market Y-o-Y Growth Rate Comparison by Type (2016-2032)
- Table 45: Western Europe Aptamers Market Y-o-Y Growth Rate Comparison by Application (2016-2032)
- Table 46: Western Europe Aptamers Market Y-o-Y Growth Rate Comparison by End User (2016-2032)
- Table 47: Western Europe Aptamers Market Share Comparison by Country (2016-2032)
- Table 48: Western Europe Aptamers Market Share Comparison by Type (2016-2032)
- Table 49: Western Europe Aptamers Market Share Comparison by Application (2016-2032)
- Table 50: Western Europe Aptamers Market Share Comparison by End User (2016-2032)
- Table 51: Eastern Europe Aptamers Market Comparison by Type (2016-2032)
- Table 52: Eastern Europe Aptamers Market Comparison by Application (2016-2032)
- Table 53: Eastern Europe Aptamers Market Comparison by End User (2016-2032)
- Table 54: Eastern Europe Aptamers Market Revenue (US$ Mn) Comparison by Country (2016-2032)
- Table 55: Eastern Europe Aptamers Market Revenue (US$ Mn) (2016-2032)
- Table 56: Eastern Europe Aptamers Market Revenue (US$ Mn) Comparison by Country (2016-2032)
- Table 57: Eastern Europe Aptamers Market Revenue (US$ Mn) Comparison by Type (2016-2032)
- Table 58: Eastern Europe Aptamers Market Revenue (US$ Mn) Comparison by Application (2016-2032)
- Table 59: Eastern Europe Aptamers Market Revenue (US$ Mn) Comparison by End User (2016-2032)
- Table 60: Eastern Europe Aptamers Market Y-o-Y Growth Rate Comparison by Country (2016-2032)
- Table 61: Eastern Europe Aptamers Market Y-o-Y Growth Rate Comparison by Type (2016-2032)
- Table 62: Eastern Europe Aptamers Market Y-o-Y Growth Rate Comparison by Application (2016-2032)
- Table 63: Eastern Europe Aptamers Market Y-o-Y Growth Rate Comparison by End User (2016-2032)
- Table 64: Eastern Europe Aptamers Market Share Comparison by Country (2016-2032)
- Table 65: Eastern Europe Aptamers Market Share Comparison by Type (2016-2032)
- Table 66: Eastern Europe Aptamers Market Share Comparison by Application (2016-2032)
- Table 67: Eastern Europe Aptamers Market Share Comparison by End User (2016-2032)
- Table 68: APAC Aptamers Market Comparison by Type (2016-2032)
- Table 69: APAC Aptamers Market Comparison by Application (2016-2032)
- Table 70: APAC Aptamers Market Comparison by End User (2016-2032)
- Table 71: APAC Aptamers Market Revenue (US$ Mn) Comparison by Country (2016-2032)
- Table 72: APAC Aptamers Market Revenue (US$ Mn) (2016-2032)
- Table 73: APAC Aptamers Market Revenue (US$ Mn) Comparison by Country (2016-2032)
- Table 74: APAC Aptamers Market Revenue (US$ Mn) Comparison by Type (2016-2032)
- Table 75: APAC Aptamers Market Revenue (US$ Mn) Comparison by Application (2016-2032)
- Table 76: APAC Aptamers Market Revenue (US$ Mn) Comparison by End User (2016-2032)
- Table 77: APAC Aptamers Market Y-o-Y Growth Rate Comparison by Country (2016-2032)
- Table 78: APAC Aptamers Market Y-o-Y Growth Rate Comparison by Type (2016-2032)
- Table 79: APAC Aptamers Market Y-o-Y Growth Rate Comparison by Application (2016-2032)
- Table 80: APAC Aptamers Market Y-o-Y Growth Rate Comparison by End User (2016-2032)
- Table 81: APAC Aptamers Market Share Comparison by Country (2016-2032)
- Table 82: APAC Aptamers Market Share Comparison by Type (2016-2032)
- Table 83: APAC Aptamers Market Share Comparison by Application (2016-2032)
- Table 84: APAC Aptamers Market Share Comparison by End User (2016-2032)
- Table 85: Latin America Aptamers Market Comparison by Type (2016-2032)
- Table 86: Latin America Aptamers Market Comparison by Application (2016-2032)
- Table 87: Latin America Aptamers Market Comparison by End User (2016-2032)
- Table 88: Latin America Aptamers Market Revenue (US$ Mn) Comparison by Country (2016-2032)
- Table 89: Latin America Aptamers Market Revenue (US$ Mn) (2016-2032)
- Table 90: Latin America Aptamers Market Revenue (US$ Mn) Comparison by Country (2016-2032)
- Table 91: Latin America Aptamers Market Revenue (US$ Mn) Comparison by Type (2016-2032)
- Table 92: Latin America Aptamers Market Revenue (US$ Mn) Comparison by Application (2016-2032)
- Table 93: Latin America Aptamers Market Revenue (US$ Mn) Comparison by End User (2016-2032)
- Table 94: Latin America Aptamers Market Y-o-Y Growth Rate Comparison by Country (2016-2032)
- Table 95: Latin America Aptamers Market Y-o-Y Growth Rate Comparison by Type (2016-2032)
- Table 96: Latin America Aptamers Market Y-o-Y Growth Rate Comparison by Application (2016-2032)
- Table 97: Latin America Aptamers Market Y-o-Y Growth Rate Comparison by End User (2016-2032)
- Table 98: Latin America Aptamers Market Share Comparison by Country (2016-2032)
- Table 99: Latin America Aptamers Market Share Comparison by Type (2016-2032)
- Table 100: Latin America Aptamers Market Share Comparison by Application (2016-2032)
- Table 101: Latin America Aptamers Market Share Comparison by End User (2016-2032)
- Table 102: Middle East & Africa Aptamers Market Comparison by Type (2016-2032)
- Table 103: Middle East & Africa Aptamers Market Comparison by Application (2016-2032)
- Table 104: Middle East & Africa Aptamers Market Comparison by End User (2016-2032)
- Table 105: Middle East & Africa Aptamers Market Revenue (US$ Mn) Comparison by Country (2016-2032)
- Table 106: Middle East & Africa Aptamers Market Revenue (US$ Mn) (2016-2032)
- Table 107: Middle East & Africa Aptamers Market Revenue (US$ Mn) Comparison by Country (2016-2032)
- Table 108: Middle East & Africa Aptamers Market Revenue (US$ Mn) Comparison by Type (2016-2032)
- Table 109: Middle East & Africa Aptamers Market Revenue (US$ Mn) Comparison by Application (2016-2032)
- Table 110: Middle East & Africa Aptamers Market Revenue (US$ Mn) Comparison by End User (2016-2032)
- Table 111: Middle East & Africa Aptamers Market Y-o-Y Growth Rate Comparison by Country (2016-2032)
- Table 112: Middle East & Africa Aptamers Market Y-o-Y Growth Rate Comparison by Type (2016-2032)
- Table 113: Middle East & Africa Aptamers Market Y-o-Y Growth Rate Comparison by Application (2016-2032)
- Table 114: Middle East & Africa Aptamers Market Y-o-Y Growth Rate Comparison by End User (2016-2032)
- Table 115: Middle East & Africa Aptamers Market Share Comparison by Country (2016-2032)
- Table 116: Middle East & Africa Aptamers Market Share Comparison by Type (2016-2032)
- Table 117: Middle East & Africa Aptamers Market Share Comparison by Application (2016-2032)
- Table 118: Middle East & Africa Aptamers Market Share Comparison by End User (2016-2032)
- 1. Executive Summary
-
- SomaLogic Inc.
- Vivonics Inc.
- IBA GmbH
- Aptus Biotech S.L.
- Vivonics Inc.
- Base Pair Biotechnologies Inc.
- Baush Health Companies Inc.
- KANEKA CORPORATION
- TriLink BioTechnologies
- Other Key Players
Our Clients


View Our Licence Options
