
Anti Cancer Drug Market Report By Drug Type (Chemotherapy Drugs, Targeted Therapy Drugs, Immunotherapy Drugs, Hormonal Therapy Drugs, Other Therapy Drugs), By Mode of Action (Cytotoxic Agents, Signal Transduction Inhibitors, Immune Checkpoint Inhibitors, Hormone Receptor Modulators, Angiogenesis Inhibitors, Apoptosis Inducers, Others), By Cancer Type, By End Users, By Region and Companies - Industry Segment Outlook, Market Assessment, Competition Scenario, Trends and Forecast 2024-2033
-
45559
-
May 2024
-
291
-


-
This report was compiled by Trishita Deb Trishita Deb is an experienced market research and consulting professional with over 7 years of expertise across healthcare, consumer goods, and materials, contributing to over 400 healthcare-related reports. Correspondence Team Lead- Healthcare Linkedin | Detailed Market research Methodology Our methodology involves a mix of primary research, including interviews with leading mental health experts, and secondary research from reputable medical journals and databases. View Detailed Methodology Page
-
Quick Navigation
Report Overview
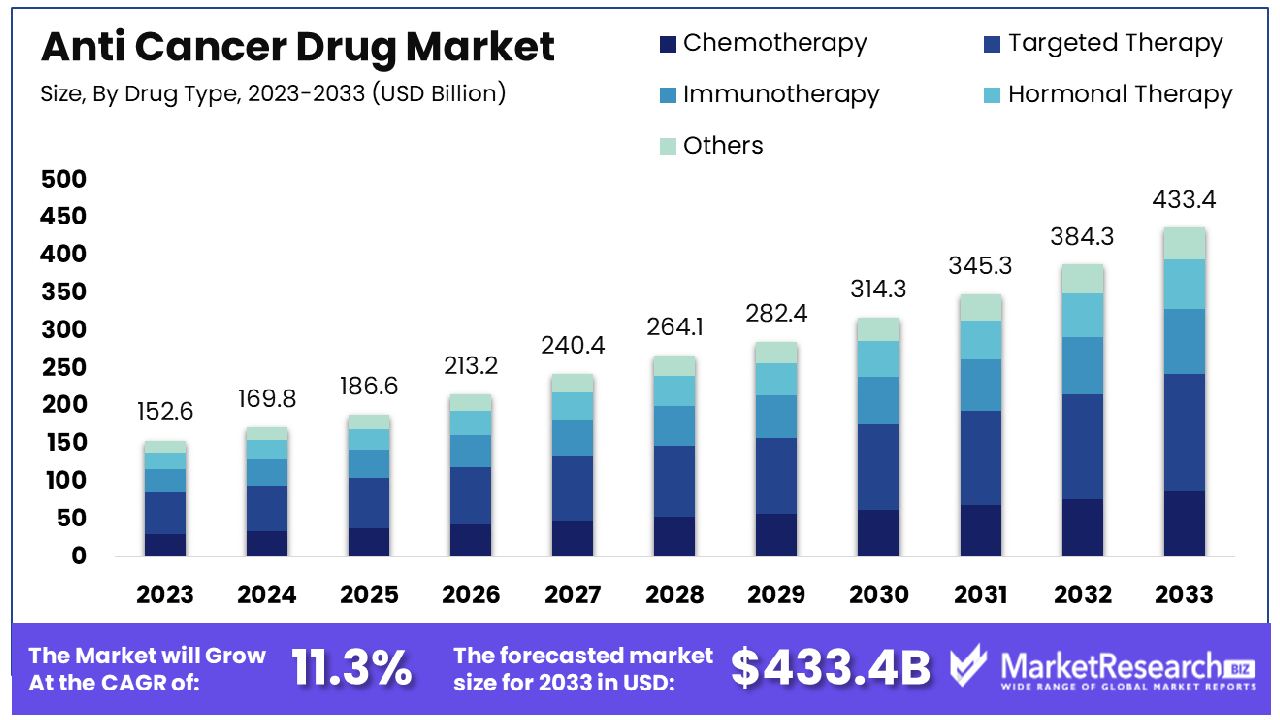
The Global Anti Cancer Drug Market size is expected to be worth around USD 433.4 Billion by 2033, from USD 152.6 Billion in 2023, growing at a CAGR of 11.30% during the forecast period from 2024 to 2033.
The Anti-Cancer Drug Market encompasses pharmaceuticals specifically formulated to combat various types of cancer. This sector is driven by advancements in medical research, increasing global cancer prevalence, and significant investments in healthcare innovation. Anti-cancer drugs include chemotherapies, targeted therapies, and immunotherapies, each designed to halt or reduce cancer cell growth.
Key market players focus on developing more effective and less toxic treatments, aiming to improve patient outcomes. As this market evolves, it offers substantial opportunities for healthcare companies to innovate and expand. Understanding these dynamics is crucial for decision-makers in the pharmaceutical industry.
In the Anti-Cancer Drug Market, ongoing research and clinical advancements are pivotal in addressing the rising incidence of cancer cases. In 2023, the United States is projected to see 1,958,310 new cancer diagnoses, underscoring a significant demand for effective anti-cancer treatments. This sector also faces the critical challenge of reducing the cancer mortality rate, which remains high with 609,820 expected deaths in 2023.
Despite these daunting figures, there is a positive trend in survival rates, attributable to improvements in drug therapies and early detection. The overall cancer death rate has declined steadily since the 1990s, largely due to advancements in treating key cancer types such as breast, colorectal, lung, and prostate cancers. From 1991 to 2020, these advancements have prevented over 3.8 million cancer deaths in the U.S. alone.
Moreover, the growing number of cancer survivors, which exceeded 18 million as of January 1, 2022, highlights the evolving need for not only initial treatment but also long-term management solutions. This demographic shift is expanding the market for anti-cancer drugs, as survivors may require ongoing therapy to prevent recurrence or manage chronic conditions.
Given these dynamics, the Anti-Cancer Drug Market is poised for significant growth. Pharmaceutical companies and healthcare providers are increasingly focused on developing more precise, less toxic treatment options that can offer better efficacy and fewer side effects. The emphasis on personalized medicine, particularly drugs that target specific cancer biomarkers, is set to redefine therapeutic approaches in oncology.
For industry leaders and stakeholders, understanding these trends is crucial for strategic planning and investment in research and development, aiming to meet the complex needs of the next generation of cancer therapy.
Key Takeaways
- Market Value: The Global Anti Cancer Drug Market is forecasted to reach USD 433.4 billion by 2033, experiencing significant growth from USD 152.6 billion in 2023, with a notable CAGR of 11.30% during the forecast period from 2024 to 2033.
- Drug Type Analysis: Targeted therapy drugs dominate with a significant market share due to their high efficacy and specificity in treating specific cancer markers.
- Mode of Action Analysis: Signal transduction inhibitors lead the segment with a robust market share due to their effectiveness in blocking pathways crucial for cancer cell growth.
- Cancer Type Analysis: Breast cancer dominates the market due to its high prevalence and increasing development of tailored therapies.
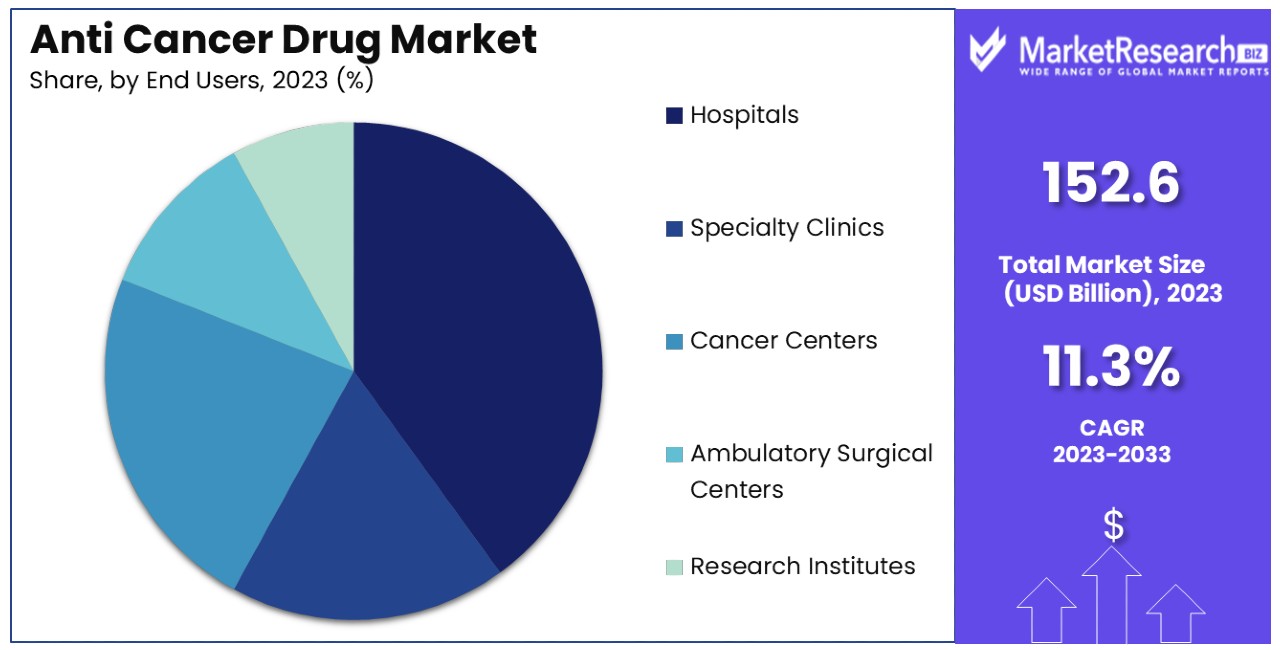
- End Users Analysis: Hospitals are the dominant end-users due to their critical role in providing comprehensive cancer treatment and access to advanced therapies.
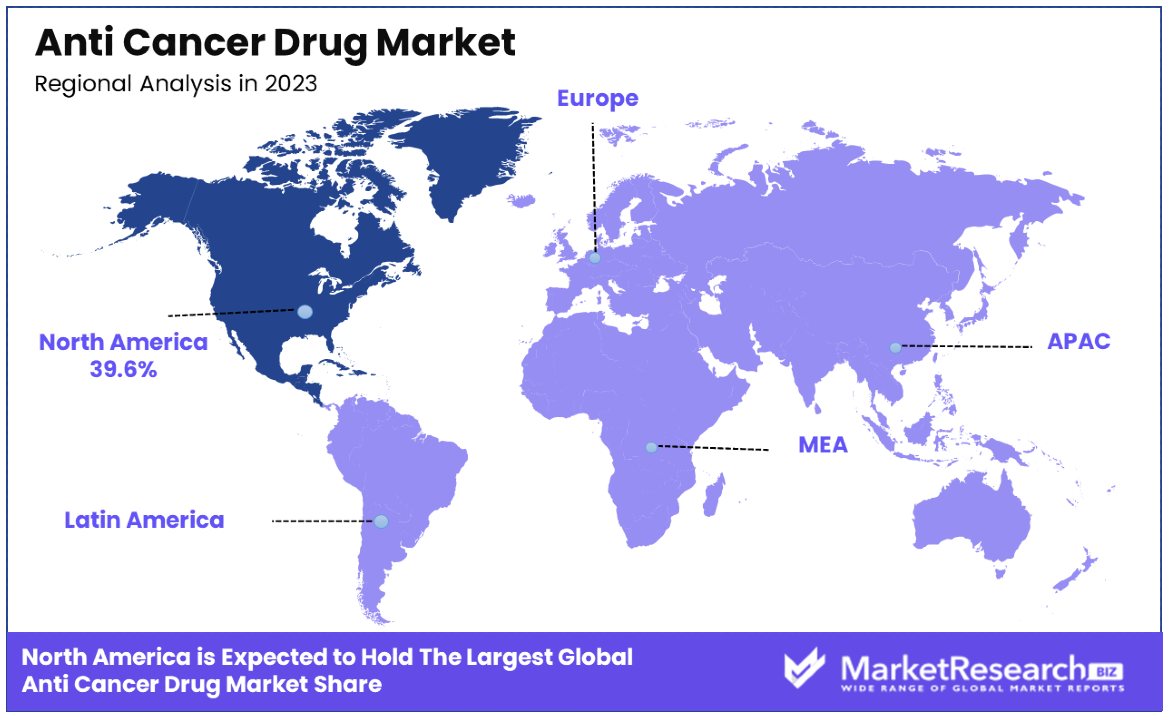
- North America: Dominates the market with a 39.6% market share, driven by advanced healthcare systems and substantial government funding in healthcare research.
- Europe: Holds approximately 23.4% of the market, benefiting from strong healthcare systems, rigorous regulatory standards, and substantial government funding in healthcare research.
- Analyst Viewpoint: Analysts anticipate continued growth in the Anti Cancer Drug Market, driven by increasing prevalence of cancer, advancements in personalized medicine, and ongoing research and development efforts.
- Growth Opportunities: Growth opportunities lie in the development of targeted therapies, immunotherapies, and precision medicine approaches tailored to individual patients, as well as expanding market presence in emerging economies and strategic partnerships for drug development and distribution.
Driving Factors
Increasing Cancer Prevalence Drives Market Growth
The escalating incidence of cancer worldwide is a crucial driver for the expansion of the Anti-Cancer Drug Market. As cancer remains the second leading cause of death globally, with nearly 10 million deaths in 2020, the need for effective treatments is more pressing than ever. This rise in cancer cases is largely attributed to an aging global population and lifestyle factors that increase cancer risk.
The demand for new and improved treatment options, such as targeted therapies and immunotherapies, is growing. These treatments offer more personalized and effective approaches to cancer care, aligning with the increasing patient numbers and the variety of cancer types being treated. This trend not only fuels the market’s growth by broadening the scope of therapeutic applications but also by encouraging continuous research and development efforts to meet diverse medical needs.
Advances in Cancer Research and Drug Development Propel Market Growth
Recent breakthroughs in cancer research and drug development significantly propel the Anti-Cancer Drug Market. Innovations in genomics and precision medicine have opened new avenues for targeting specific cancer mechanisms, leading to the approval of groundbreaking treatments like checkpoint inhibitors and CAR-T cell therapies.
These advances have drastically improved treatment efficacy and personalized patient care. The development of these novel therapies is stimulated by an increased understanding of cancer biology, encouraging pharmaceutical companies to invest heavily in R&D. This investment enhances the market’s capacity to offer effective solutions to a broadening patient base, ensuring sustained growth through the continuous introduction of innovative drugs.
Increasing Healthcare Expenditure and Access to Treatment Boosts Market Growth
Enhanced healthcare spending and improved access to treatment are pivotal in driving the growth of the Anti-Cancer Drug Market. Rising disposable incomes worldwide and the development of healthcare infrastructure, especially in emerging economies, have made advanced cancer treatments more accessible.
Government initiatives like India’s Ayushman Bharat scheme, which provides affordable healthcare to the underserved, play a crucial role in facilitating access to high-cost anti-cancer drugs. This increase in healthcare expenditure by both public and private sectors ensures that a larger population can afford these life-saving treatments, thereby expanding the market. The growth in healthcare infrastructure not only supports the distribution and adoption of existing cancer therapies but also encourages the introduction of new drugs into the market, ensuring a dynamic and continuously evolving landscape.
Restraining Factors
High Costs and Pricing Pressures Restrain Market Growth
The substantial cost of developing and purchasing anti-cancer drugs, especially targeted therapies and immunotherapies, significantly constrains the Anti-Cancer Drug Market. These advanced treatments often entail hefty price tags, with annual costs for some targeted therapies exceeding $100,000. Such high expenses create barriers to access for patients lacking comprehensive insurance or government backing.
Additionally, these costs result in pricing pressures from healthcare payers and governments striving to manage their healthcare budgets, leading to stringent reimbursement criteria. This dynamic restricts the patient's ability to access these life-saving drugs and may inhibit market growth as drug manufacturers face challenges in making treatments economically viable for broad patient populations.
Stringent Regulatory Requirements and Clinical Trial Challenges Restrain Market Growth
The rigorous and demanding regulatory landscape for the approval of anti-cancer drugs poses significant hurdles. These drugs must meet high safety and efficacy standards, necessitating extensive and costly clinical trials. For novel therapies, such as PD-1 inhibitors, the complexity of cancer immunology introduces further challenges, complicating patient enrollment and extending trial durations.
This not only escalates the costs but also delays the market entry of innovative therapies. The stringent regulations and the intricate process of demonstrating drug effectiveness can thus impede the timely development and release of new cancer treatments, slowing down the overall market growth and limiting the availability of cutting-edge therapies to patients.
Drug Type Analysis
Targeted therapy drugs dominate with significant market share due to their high efficacy and specificity in treating specific cancer markers.
The drug type segment of the Anti Cancer Drug Market is notably diverse, comprising chemotherapy drugs, targeted therapy drugs, immunotherapy drugs, hormonal therapy drugs, and other therapy drugs. Among these, targeted therapy drugs hold a predominant position. This sub-segment benefits from its ability to specifically target and interact with unique cancer cell markers, minimizing damage to healthy cells and improving patient outcomes. This specificity not only enhances effectiveness in combating cancer but also reduces side effects compared to traditional chemotherapy. Targeted therapies have gained traction due to their role in personalized medicine, a growing trend in oncology that tailors treatments to individual genetic profiles.
Chemotherapy remains a foundational treatment option but is often associated with high toxicity, which limits its desirability and usage in certain patient groups. Immunotherapy drugs, which boost the body's immune system to fight cancer, are rapidly gaining market share due to breakthroughs in treatments like CAR-T cell therapies and checkpoint inhibitors. Hormonal therapy drugs continue to be critical for cancers that are sensitive to hormone levels, such as breast and prostate cancer, while other therapy drugs encompass a variety of emerging modalities that are still in early stages of adoption.
Mode of Action Analysis
Signal transduction inhibitors dominate with a robust market share due to their effectiveness in blocking the pathways that cancer cells use to grow.
In the mode of action segment, the Anti Cancer Drug Market is segmented into cytotoxic agents, signal transduction inhibitors, immune checkpoint inhibitors, hormone receptor modulators, angiogenesis inhibitors, apoptosis inducers, and others. Signal transduction inhibitors stand out as the dominant sub-segment. These drugs work by interfering with the signaling pathways that promote cancer cell growth and survival, an approach that has proven effective across various cancer types. Their ability to disrupt critical molecular pathways in cancer cells makes them valuable in treating malignancies that are resistant to other forms of treatment.
Cytotoxic agents, while traditional, are increasingly being overshadowed by therapies with more targeted mechanisms and fewer side effects. Immune checkpoint inhibitors have revolutionized cancer treatment by enabling the immune system to recognize and combat cancer cells more effectively. Hormone receptor modulators are essential in treating cancers that are driven by hormonal changes, such as breast and prostate cancers. Angiogenesis inhibitors and apoptosis inducers are also important, targeting the blood vessels of tumors and inducing cancer cell death, respectively. The other category includes emerging therapies that are being developed to expand the arsenal against cancer.
Cancer Type Analysis
Breast cancer dominates the market due to its high prevalence and the increasing number of tailored therapies being developed.
Within the cancer type segment, the market is categorized into treatments for breast cancer, lung cancer, colorectal cancer, prostate cancer, leukemia, lymphoma, melanoma, and other cancer types. Breast cancer commands a leading position due to its high incidence and the significant research funding that drives the development of new therapies specifically targeting this type. The rise in breast cancer cases globally has prompted ongoing advancements in personalized medicine, particularly in targeted and hormonal therapies that are proving effective in treating this disease.
While breast cancer remains a focal area, lung cancer and colorectal cancer are also major areas of concern, with substantial efforts directed towards improving outcomes for these conditions. Prostate cancer, leukemia, lymphoma, and melanoma are other critical areas, each benefiting from specific research and development efforts that focus on the unique characteristics of these cancers. The continued expansion of treatment options across these types remains vital for the overall growth of the market.
End Users Analysis
Hospitals dominate the end-user segment due to their critical role in providing comprehensive cancer treatment and access to advanced therapies.
The end-user segment of the Anti Cancer Drug Market includes hospitals, specialty clinics, cancer centers, ambulatory surgical centers, and research institutes. Hospitals are the dominant end-users, primarily because they are the hub for administering complex and high-cost treatments like chemotherapies and immunotherapies. They are equipped with the necessary infrastructure to handle the sophisticated requirements of cancer treatment protocols and manage the side effects associated with these therapies.
Specialty clinics play a supportive role, often focusing on specific types of cancer or treatments. Cancer centers are pivotal in advancing cancer treatment through research and the development of novel therapies. Ambulatory surgical centers contribute by providing surgical care for cancer patients, whereas research institutes are crucial for ongoing cancer research and drug development efforts that fuel the market's growth. Collectively, these end users create a comprehensive network that supports the widespread deployment and continuous advancement of anti-cancer drugs.
Key Market Segments
By Drug Type
- Chemotherapy Drugs
- Targeted Therapy Drugs
- Immunotherapy Drugs
- Hormonal Therapy Drugs
- Other Therapy Drugs
By Mode of Action
- Cytotoxic Agents
- Signal Transduction Inhibitors
- Immune Checkpoint Inhibitors
- Hormone Receptor Modulators
- Angiogenesis Inhibitors
- Apoptosis Inducers
- Others
By Cancer Type
- Breast Cancer
- Lung Cancer
- Colorectal Cancer
- Prostate Cancer
- Leukemia
- Lymphoma
- Melanoma
- Other Cancer Types
By End Users
- Hospitals
- Specialty Clinics
- Cancer Centers
- Ambulatory Surgical Centers
- Research Institutes
Growth Opportunities
Personalized Medicine and Targeted Therapies Offer Growth Opportunity
The rise of personalized medicine and targeted therapies marks a transformative period in the Anti Cancer Drug Market. By integrating genomic and molecular profiling, pharmaceutical companies can tailor treatments to the genetic profiles of individual patients, enhancing the precision and effectiveness of cancer therapies. This approach not only improves patient outcomes but also minimizes adverse side effects, making treatments more tolerable and thereby increasing patient adherence.
Targeted therapies such as trastuzumab (Herceptin) for HER2-positive breast cancer and imatinib (Gleevec) for chronic myeloid leukemia have set benchmarks in oncology by significantly improving survival rates. The success of these drugs demonstrates the substantial market potential and encourages ongoing investment in the research and development of similar targeted agents, promising a robust pipeline of innovative treatments that can drive future market growth.
Immuno-Oncology and Cancer Immunotherapies Offer Growth Opportunity
Immuno-oncology, utilizing the body's immune system to combat cancer, offers expansive growth opportunities within the Anti Cancer Drug Market. Immunotherapies, including checkpoint inhibitors, CAR-T cell therapies, and cancer vaccines, provide a paradigm shift in cancer treatment. These therapies have shown remarkable efficacy in producing long-lasting responses and are generally associated with fewer side effects compared to traditional treatments.
The approval of drugs like pembrolizumab (Keytruda) and nivolumab (Opdivo), which target immune checkpoints to enhance the immune response against cancer cells, has not only improved survival rates but also broadened the therapeutic landscape. The success of these treatments underscores the potential for immuno-oncology to become a cornerstone in cancer therapy, driving sustained market growth as more therapies are developed and approved for use in a wider range of cancer types.
Trending Factors
Artificial Intelligence and Machine Learning Are Trending Factors
The integration of artificial intelligence (AI) and machine learning (ML) in drug discovery represents a significant trend within the Anti Cancer Drug Market. These technologies are revolutionizing the pharmaceutical industry by enhancing the speed and efficiency of discovering new drug candidates.
AI and ML algorithms excel in analyzing large datasets to uncover potential drug targets and predict interactions, which can significantly decrease both the time and costs involved in drug development. For instance, companies like BenevolentAI and Insilico Medicine utilize these technologies to streamline the drug discovery process, leading to faster introduction of effective anti-cancer treatments. This trend not only accelerates innovation but also offers the promise of more personalized and precise cancer therapies, making it a pivotal factor in the market’s expansion.
Precision Oncology and Molecular Diagnostics Are Trending Factors
Precision oncology, supported by advancements in molecular diagnostics, is shaping trends in the Anti Cancer Drug Market. This approach relies on detailed understanding of the genetic makeup of individual tumors to tailor treatments effectively, utilizing technologies like next-generation sequencing (NGS) and liquid biopsies.
These diagnostic tools facilitate the detection of specific genetic mutations and biomarkers that inform targeted therapy decisions. The use of NGS, for instance, has enabled the deployment of targeted drugs such as osimertinib (Tagrisso) and alectinib (Alecensa) for non-small cell lung cancer, markedly improving patient survival rates. This trend towards more personalized medicine is driving growth in the market by improving treatment outcomes and reducing the incidence of adverse effects, underscoring the importance of precision oncology as a key factor in the market's trajectory.
Regional Analysis
North America Dominates with 39.6% Market Share
North America's prominent position in the Anti Cancer Drug Market is driven by its advanced healthcare infrastructure, strong emphasis on research and development, and high healthcare expenditure. The region hosts numerous leading pharmaceutical companies and research institutions that are at the forefront of developing innovative cancer therapies. Furthermore, the high prevalence of cancer and the aggressive adoption of new treatments contribute significantly to market growth.
The market dynamics in North America are influenced by a combination of robust regulatory frameworks that support quick drug approvals and substantial investment in biotechnology. Additionally, there is a high awareness of cancer and its treatment options, along with comprehensive cancer screening programs which increase the diagnosis and treatment rates, further fueling the demand for anti-cancer drugs.
Looking ahead, North America is expected to maintain its dominance in the Anti Cancer Drug Market due to ongoing innovations in cancer treatment, including personalized medicine and immuno-oncology. Continued investments in healthcare and research are likely to keep driving the market forward, with North America leading in both market growth and technological advancements.
Regional Market Shares and Dynamics:
- Europe: Holding approximately 23.4% of the market, Europe benefits from its strong healthcare systems and substantial government funding in healthcare research. The region's rigorous regulatory standards and the active participation of the population in health services bolster the market for anti-cancer drugs.
- Asia Pacific: With about 22.1% of the market share, Asia Pacific is witnessing rapid growth due to increasing healthcare expenditure, growing patient awareness, and improvements in healthcare infrastructure. The region's large population base and increasing incidence of cancer are key drivers that are expected to boost its market share in the future.
- Middle East & Africa: This region accounts for a smaller share of around 9.5% due to varying levels of healthcare access and infrastructure. However, increasing investments in healthcare and a rising focus on regulatory reforms are projected to enhance growth opportunities in this market.
- Latin America: Latin America holds roughly 5.4% of the market. The region faces challenges such as uneven access to treatment and economic disparity. Nonetheless, gradual improvements in healthcare infrastructure and growing government focus on healthcare are likely to propel market growth over the coming years.
Key Regions and Countries
- North America
- The US
- Canada
- Mexico
- Western Europe
- Germany
- France
- The UK
- Spain
- Italy
- Portugal
- Ireland
- Austria
- Switzerland
- Benelux
- Nordic
- Rest of Western Europe
- Eastern Europe
- Russia
- Poland
- The Czech Republic
- Greece
- Rest of Eastern Europe
- APAC
- China
- Japan
- South Korea
- India
- Australia & New Zealand
- Indonesia
- Malaysia
- Philippines
- Singapore
- Thailand
- Vietnam
- Rest of APAC
- Latin America
- Brazil
- Colombia
- Chile
- Argentina
- Costa Rica
- Rest of Latin America
- Middle East & Africa
- Algeria
- Egypt
- Israel
- Kuwait
- Nigeria
- Saudi Arabia
- South Africa
- Turkey
- United Arab Emirates
- Rest of MEA
Key Players Analysis
In the Anti Cancer Drug Market, key players include a robust lineup of multinational pharmaceutical companies known for their extensive research and development efforts, strategic alliances, and influential market positions. Among these, Eli Lilly and Company, Pfizer Inc., and Novartis AG are prominent for their innovative drug portfolios and significant global reach. Bristol-Myers Squibb Company and AbbVie Inc. stand out due to their focus on immunooncology and targeted therapies, which are cornerstones in modern cancer treatment paradigms.
Further, companies like CELGENE Corporation and Genentech, Inc. are recognized for their pioneering biotechnological approaches and substantial contributions to the oncology sector. Astellas Pharma Inc. and Amgen Inc. bring to the market a blend of oncology expertise and novel therapeutic options, enhancing the treatment landscape. Merck & Co. Inc. and Johnson & Johnson, with their extensive resources and diversified health solutions, reinforce the market's capacity for innovation and improved patient outcomes.
Collectively, these companies drive forward the anti-cancer drug market through competitive positioning, continuous innovation, and by addressing the urgent needs of a growing patient population globally. Their strategic initiatives not only expand the therapeutic options available but also significantly impact healthcare outcomes in oncology.
Market Key Players
- Eli Lilly and Company
- Pfizer Inc.
- Novartis AG
- Bristol-Myers Squibb Company
- AbbVie Inc.
- CELGENE Corporation
- Genentech, Inc.
- Astellas Pharma Inc.
- Amgen Inc.
- Merck & Co. Inc.
- Johnson & Johnson
Recent Developments
- On April 2024, AstraZeneca Egypt collaborated with the Ministry of Health and Population to launch a campaign focusing on early detection and treatment of hepatocellular carcinoma (HCC), a common type of primary liver cancer in Egypt. This initiative aims to raise public awareness about the importance of early liver cancer detection, utilizing advanced AI technologies and state-of-the-art treatment methods to enhance recovery rates.
- President Droupadi Murmu unveiled India's first CAR T-cell therapy for cancer treatment on April 4, 2024, at the Indian Institute of Technology (IIT) Bombay. Developed by IIT Bombay and the Tata Memorial Centre, this gene-based therapy, named CAR T-cell therapy, is a significant breakthrough in the fight against cancer, providing accessible and affordable treatment options. The therapy is designed to cure various types of cancer and is a testament to India's 'Make in India' initiative.
- On March 20, 2024, BioNTech expressed hopes for its cancer drug launches following an earnings plunge. The company is pinning its expectations on the launch of cancer drugs to recover from financial setbacks.
Report Scope
Report Features Description Market Value (2023) USD 152.6 Billion Forecast Revenue (2033) USD 433.4 Billion CAGR (2024-2033) 11.30% Base Year for Estimation 2023 Historic Period 2018-2023 Forecast Period 2024-2033 Report Coverage Revenue Forecast, Market Dynamics, Competitive Landscape, Recent Developments Segments Covered By Drug Type (Chemotherapy Drugs, Targeted Therapy Drugs, Immunotherapy Drugs, Hormonal Therapy Drugs, Other Therapy Drugs), By Mode of Action (Cytotoxic Agents, Signal Transduction Inhibitors, Immune Checkpoint Inhibitors, Hormone Receptor Modulators, Angiogenesis Inhibitors, Apoptosis Inducers, Others), By Cancer Type (Breast Cancer, Lung Cancer, Colorectal Cancer, Prostate Cancer, Leukemia, Lymphoma, Melanoma, Other Cancer Types), By End Users (Hospitals, Specialty Clinics, Cancer Centers, Ambulatory Surgical Centers, Research Institutes) Regional Analysis North America - The US, Canada, & Mexico; Western Europe - Germany, France, The UK, Spain, Italy, Portugal, Ireland, Austria, Switzerland, Benelux, Nordic, & Rest of Western Europe; Eastern Europe - Russia, Poland, The Czech Republic, Greece, & Rest of Eastern Europe; APAC - China, Japan, South Korea, India, Australia & New Zealand, Indonesia, Malaysia, Philippines, Singapore, Thailand, Vietnam, & Rest of APAC; Latin America - Brazil, Colombia, Chile, Argentina, Costa Rica, & Rest of Latin America; Middle East & Africa - Algeria, Egypt, Israel, Kuwait, Nigeria, Saudi Arabia, South Africa, Turkey, United Arab Emirates, & Rest of MEA Competitive Landscape Eli Lilly and Company, Pfizer Inc., Novartis AG, Bristol-Myers Squibb Company, AbbVie Inc., CELGENE Corporation, Genentech, Inc., Astellas Pharma Inc., Amgen Inc., Merck & Co. Inc., Johnson & Johnson Customization Scope Customization for segments, region/country-level will be provided. Moreover, additional customization can be done based on the requirements. Purchase Options We have three licenses to opt for: Single User License, Multi-User License (Up to 5 Users), Corporate Use License (Unlimited User and Printable PDF) -
- 1. Executive Summary
- 1.1. Definition
- 1.2. Taxonomy
- 1.3. Research Scope
- 1.4. Key Analysis
- 1.5. Key Findings by Major Segments
- 1.6. Top strategies by Major Players
- 2. Global Anti Cancer Drug Market Overview
- 2.1. Anti Cancer Drug Market Dynamics
- 2.1.1. Drivers
- 2.1.2. Opportunities
- 2.1.3. Restraints
- 2.1.4. Challenges
- 2.2. Macro-economic Factors
- 2.3. Regulatory Framework
- 2.4. Market Investment Feasibility Index
- 2.5. PEST Analysis
- 2.6. PORTER’S Five Force Analysis
- 2.7. Drivers & Restraints Impact Analysis
- 2.8. Industry Chain Analysis
- 2.9. Cost Structure Analysis
- 2.10. Marketing Strategy
- 2.11. Russia-Ukraine War Impact Analysis
- 2.12. Opportunity Map Analysis
- 2.13. Market Competition Scenario Analysis
- 2.14. Product Life Cycle Analysis
- 2.15. Opportunity Orbits
- 2.16. Manufacturer Intensity Map
- 2.17. Major Companies sales by Value & Volume
- 2.1. Anti Cancer Drug Market Dynamics
- 3. Global Anti Cancer Drug Market Analysis, Opportunity and Forecast, 2016-2032
- 3.1. Global Anti Cancer Drug Market Analysis, 2016-2021
- 3.2. Global Anti Cancer Drug Market Opportunity and Forecast, 2023-2032
- 3.3. Global Anti Cancer Drug Market Analysis, Opportunity and Forecast, By Drug Type, 2016-2032
- 3.3.1. Global Anti Cancer Drug Market Analysis by Drug Type: Introduction
- 3.3.2. Market Size Absolute $ Opportunity Analysis and Forecast, By Drug Type, 2016-2032
- 3.3.3. Chemotherapy Drugs
- 3.3.4. Targeted Therapy Drugs
- 3.3.5. Immunotherapy Drugs
- 3.3.6. Hormonal Therapy Drugs
- 3.3.7. Other Therapy Drugs
- 3.4. Global Anti Cancer Drug Market Analysis, Opportunity and Forecast, By Mode of Action, 2016-2032
- 3.4.1. Global Anti Cancer Drug Market Analysis by Mode of Action: Introduction
- 3.4.2. Market Size Absolute $ Opportunity Analysis and Forecast, By Mode of Action, 2016-2032
- 3.4.3. Cytotoxic Agents
- 3.4.4. Signal Transduction Inhibitors
- 3.4.5. Immune Checkpoint Inhibitors
- 3.4.6. Hormone Receptor Modulators
- 3.4.7. Angiogenesis Inhibitors
- 3.4.8. Apoptosis Inducers
- 3.4.9. Others
- 3.5. Global Anti Cancer Drug Market Analysis, Opportunity and Forecast, By Cancer Type, 2016-2032
- 3.5.1. Global Anti Cancer Drug Market Analysis by Cancer Type: Introduction
- 3.5.2. Market Size Absolute $ Opportunity Analysis and Forecast, By Cancer Type, 2016-2032
- 3.5.3. Breast Cancer
- 3.5.4. Lung Cancer
- 3.5.5. Colorectal Cancer
- 3.5.6. Prostate Cancer
- 3.5.7. Leukemia
- 3.5.8. Lymphoma
- 3.5.9. Melanoma
- 3.5.10. Other Cancer Types
- 3.6. Global Anti Cancer Drug Market Analysis, Opportunity and Forecast, By End Users, 2016-2032
- 3.6.1. Global Anti Cancer Drug Market Analysis by End Users: Introduction
- 3.6.2. Market Size Absolute $ Opportunity Analysis and Forecast, By End Users, 2016-2032
- 3.6.3. Hospitals
- 3.6.4. Specialty Clinics
- 3.6.5. Cancer Centers
- 3.6.6. Ambulatory Surgical Centers
- 3.6.7. Research Institutes
- 4. North America Anti Cancer Drug Market Analysis, Opportunity and Forecast, 2016-2032
- 4.1. North America Anti Cancer Drug Market Analysis, 2016-2021
- 4.2. North America Anti Cancer Drug Market Opportunity and Forecast, 2023-2032
- 4.3. North America Anti Cancer Drug Market Analysis, Opportunity and Forecast, By Drug Type, 2016-2032
- 4.3.1. North America Anti Cancer Drug Market Analysis by Drug Type: Introduction
- 4.3.2. Market Size Absolute $ Opportunity Analysis and Forecast, By Drug Type, 2016-2032
- 4.3.3. Chemotherapy Drugs
- 4.3.4. Targeted Therapy Drugs
- 4.3.5. Immunotherapy Drugs
- 4.3.6. Hormonal Therapy Drugs
- 4.3.7. Other Therapy Drugs
- 4.4. North America Anti Cancer Drug Market Analysis, Opportunity and Forecast, By Mode of Action, 2016-2032
- 4.4.1. North America Anti Cancer Drug Market Analysis by Mode of Action: Introduction
- 4.4.2. Market Size Absolute $ Opportunity Analysis and Forecast, By Mode of Action, 2016-2032
- 4.4.3. Cytotoxic Agents
- 4.4.4. Signal Transduction Inhibitors
- 4.4.5. Immune Checkpoint Inhibitors
- 4.4.6. Hormone Receptor Modulators
- 4.4.7. Angiogenesis Inhibitors
- 4.4.8. Apoptosis Inducers
- 4.4.9. Others
- 4.5. North America Anti Cancer Drug Market Analysis, Opportunity and Forecast, By Cancer Type, 2016-2032
- 4.5.1. North America Anti Cancer Drug Market Analysis by Cancer Type: Introduction
- 4.5.2. Market Size Absolute $ Opportunity Analysis and Forecast, By Cancer Type, 2016-2032
- 4.5.3. Breast Cancer
- 4.5.4. Lung Cancer
- 4.5.5. Colorectal Cancer
- 4.5.6. Prostate Cancer
- 4.5.7. Leukemia
- 4.5.8. Lymphoma
- 4.5.9. Melanoma
- 4.5.10. Other Cancer Types
- 4.6. North America Anti Cancer Drug Market Analysis, Opportunity and Forecast, By End Users, 2016-2032
- 4.6.1. North America Anti Cancer Drug Market Analysis by End Users: Introduction
- 4.6.2. Market Size Absolute $ Opportunity Analysis and Forecast, By End Users, 2016-2032
- 4.6.3. Hospitals
- 4.6.4. Specialty Clinics
- 4.6.5. Cancer Centers
- 4.6.6. Ambulatory Surgical Centers
- 4.6.7. Research Institutes
- 4.7. North America Anti Cancer Drug Market Analysis, Opportunity and Forecast, By Country , 2016-2032
- 4.7.1. North America Anti Cancer Drug Market Analysis by Country : Introduction
- 4.7.2. Market Size Absolute $ Opportunity Analysis and Forecast, Country , 2016-2032
- 4.7.2.1. The US
- 4.7.2.2. Canada
- 4.7.2.3. Mexico
- 5. Western Europe Anti Cancer Drug Market Analysis, Opportunity and Forecast, 2016-2032
- 5.1. Western Europe Anti Cancer Drug Market Analysis, 2016-2021
- 5.2. Western Europe Anti Cancer Drug Market Opportunity and Forecast, 2023-2032
- 5.3. Western Europe Anti Cancer Drug Market Analysis, Opportunity and Forecast, By Drug Type, 2016-2032
- 5.3.1. Western Europe Anti Cancer Drug Market Analysis by Drug Type: Introduction
- 5.3.2. Market Size Absolute $ Opportunity Analysis and Forecast, By Drug Type, 2016-2032
- 5.3.3. Chemotherapy Drugs
- 5.3.4. Targeted Therapy Drugs
- 5.3.5. Immunotherapy Drugs
- 5.3.6. Hormonal Therapy Drugs
- 5.3.7. Other Therapy Drugs
- 5.4. Western Europe Anti Cancer Drug Market Analysis, Opportunity and Forecast, By Mode of Action, 2016-2032
- 5.4.1. Western Europe Anti Cancer Drug Market Analysis by Mode of Action: Introduction
- 5.4.2. Market Size Absolute $ Opportunity Analysis and Forecast, By Mode of Action, 2016-2032
- 5.4.3. Cytotoxic Agents
- 5.4.4. Signal Transduction Inhibitors
- 5.4.5. Immune Checkpoint Inhibitors
- 5.4.6. Hormone Receptor Modulators
- 5.4.7. Angiogenesis Inhibitors
- 5.4.8. Apoptosis Inducers
- 5.4.9. Others
- 5.5. Western Europe Anti Cancer Drug Market Analysis, Opportunity and Forecast, By Cancer Type, 2016-2032
- 5.5.1. Western Europe Anti Cancer Drug Market Analysis by Cancer Type: Introduction
- 5.5.2. Market Size Absolute $ Opportunity Analysis and Forecast, By Cancer Type, 2016-2032
- 5.5.3. Breast Cancer
- 5.5.4. Lung Cancer
- 5.5.5. Colorectal Cancer
- 5.5.6. Prostate Cancer
- 5.5.7. Leukemia
- 5.5.8. Lymphoma
- 5.5.9. Melanoma
- 5.5.10. Other Cancer Types
- 5.6. Western Europe Anti Cancer Drug Market Analysis, Opportunity and Forecast, By End Users, 2016-2032
- 5.6.1. Western Europe Anti Cancer Drug Market Analysis by End Users: Introduction
- 5.6.2. Market Size Absolute $ Opportunity Analysis and Forecast, By End Users, 2016-2032
- 5.6.3. Hospitals
- 5.6.4. Specialty Clinics
- 5.6.5. Cancer Centers
- 5.6.6. Ambulatory Surgical Centers
- 5.6.7. Research Institutes
- 5.7. Western Europe Anti Cancer Drug Market Analysis, Opportunity and Forecast, By Country , 2016-2032
- 5.7.1. Western Europe Anti Cancer Drug Market Analysis by Country : Introduction
- 5.7.2. Market Size Absolute $ Opportunity Analysis and Forecast, Country , 2016-2032
- 5.7.2.1. Germany
- 5.7.2.2. France
- 5.7.2.3. The UK
- 5.7.2.4. Spain
- 5.7.2.5. Italy
- 5.7.2.6. Portugal
- 5.7.2.7. Ireland
- 5.7.2.8. Austria
- 5.7.2.9. Switzerland
- 5.7.2.10. Benelux
- 5.7.2.11. Nordic
- 5.7.2.12. Rest of Western Europe
- 6. Eastern Europe Anti Cancer Drug Market Analysis, Opportunity and Forecast, 2016-2032
- 6.1. Eastern Europe Anti Cancer Drug Market Analysis, 2016-2021
- 6.2. Eastern Europe Anti Cancer Drug Market Opportunity and Forecast, 2023-2032
- 6.3. Eastern Europe Anti Cancer Drug Market Analysis, Opportunity and Forecast, By Drug Type, 2016-2032
- 6.3.1. Eastern Europe Anti Cancer Drug Market Analysis by Drug Type: Introduction
- 6.3.2. Market Size Absolute $ Opportunity Analysis and Forecast, By Drug Type, 2016-2032
- 6.3.3. Chemotherapy Drugs
- 6.3.4. Targeted Therapy Drugs
- 6.3.5. Immunotherapy Drugs
- 6.3.6. Hormonal Therapy Drugs
- 6.3.7. Other Therapy Drugs
- 6.4. Eastern Europe Anti Cancer Drug Market Analysis, Opportunity and Forecast, By Mode of Action, 2016-2032
- 6.4.1. Eastern Europe Anti Cancer Drug Market Analysis by Mode of Action: Introduction
- 6.4.2. Market Size Absolute $ Opportunity Analysis and Forecast, By Mode of Action, 2016-2032
- 6.4.3. Cytotoxic Agents
- 6.4.4. Signal Transduction Inhibitors
- 6.4.5. Immune Checkpoint Inhibitors
- 6.4.6. Hormone Receptor Modulators
- 6.4.7. Angiogenesis Inhibitors
- 6.4.8. Apoptosis Inducers
- 6.4.9. Others
- 6.5. Eastern Europe Anti Cancer Drug Market Analysis, Opportunity and Forecast, By Cancer Type, 2016-2032
- 6.5.1. Eastern Europe Anti Cancer Drug Market Analysis by Cancer Type: Introduction
- 6.5.2. Market Size Absolute $ Opportunity Analysis and Forecast, By Cancer Type, 2016-2032
- 6.5.3. Breast Cancer
- 6.5.4. Lung Cancer
- 6.5.5. Colorectal Cancer
- 6.5.6. Prostate Cancer
- 6.5.7. Leukemia
- 6.5.8. Lymphoma
- 6.5.9. Melanoma
- 6.5.10. Other Cancer Types
- 6.6. Eastern Europe Anti Cancer Drug Market Analysis, Opportunity and Forecast, By End Users, 2016-2032
- 6.6.1. Eastern Europe Anti Cancer Drug Market Analysis by End Users: Introduction
- 6.6.2. Market Size Absolute $ Opportunity Analysis and Forecast, By End Users, 2016-2032
- 6.6.3. Hospitals
- 6.6.4. Specialty Clinics
- 6.6.5. Cancer Centers
- 6.6.6. Ambulatory Surgical Centers
- 6.6.7. Research Institutes
- 6.7. Eastern Europe Anti Cancer Drug Market Analysis, Opportunity and Forecast, By Country , 2016-2032
- 6.7.1. Eastern Europe Anti Cancer Drug Market Analysis by Country : Introduction
- 6.7.2. Market Size Absolute $ Opportunity Analysis and Forecast, Country , 2016-2032
- 6.7.2.1. Russia
- 6.7.2.2. Poland
- 6.7.2.3. The Czech Republic
- 6.7.2.4. Greece
- 6.7.2.5. Rest of Eastern Europe
- 7. APAC Anti Cancer Drug Market Analysis, Opportunity and Forecast, 2016-2032
- 7.1. APAC Anti Cancer Drug Market Analysis, 2016-2021
- 7.2. APAC Anti Cancer Drug Market Opportunity and Forecast, 2023-2032
- 7.3. APAC Anti Cancer Drug Market Analysis, Opportunity and Forecast, By Drug Type, 2016-2032
- 7.3.1. APAC Anti Cancer Drug Market Analysis by Drug Type: Introduction
- 7.3.2. Market Size Absolute $ Opportunity Analysis and Forecast, By Drug Type, 2016-2032
- 7.3.3. Chemotherapy Drugs
- 7.3.4. Targeted Therapy Drugs
- 7.3.5. Immunotherapy Drugs
- 7.3.6. Hormonal Therapy Drugs
- 7.3.7. Other Therapy Drugs
- 7.4. APAC Anti Cancer Drug Market Analysis, Opportunity and Forecast, By Mode of Action, 2016-2032
- 7.4.1. APAC Anti Cancer Drug Market Analysis by Mode of Action: Introduction
- 7.4.2. Market Size Absolute $ Opportunity Analysis and Forecast, By Mode of Action, 2016-2032
- 7.4.3. Cytotoxic Agents
- 7.4.4. Signal Transduction Inhibitors
- 7.4.5. Immune Checkpoint Inhibitors
- 7.4.6. Hormone Receptor Modulators
- 7.4.7. Angiogenesis Inhibitors
- 7.4.8. Apoptosis Inducers
- 7.4.9. Others
- 7.5. APAC Anti Cancer Drug Market Analysis, Opportunity and Forecast, By Cancer Type, 2016-2032
- 7.5.1. APAC Anti Cancer Drug Market Analysis by Cancer Type: Introduction
- 7.5.2. Market Size Absolute $ Opportunity Analysis and Forecast, By Cancer Type, 2016-2032
- 7.5.3. Breast Cancer
- 7.5.4. Lung Cancer
- 7.5.5. Colorectal Cancer
- 7.5.6. Prostate Cancer
- 7.5.7. Leukemia
- 7.5.8. Lymphoma
- 7.5.9. Melanoma
- 7.5.10. Other Cancer Types
- 7.6. APAC Anti Cancer Drug Market Analysis, Opportunity and Forecast, By End Users, 2016-2032
- 7.6.1. APAC Anti Cancer Drug Market Analysis by End Users: Introduction
- 7.6.2. Market Size Absolute $ Opportunity Analysis and Forecast, By End Users, 2016-2032
- 7.6.3. Hospitals
- 7.6.4. Specialty Clinics
- 7.6.5. Cancer Centers
- 7.6.6. Ambulatory Surgical Centers
- 7.6.7. Research Institutes
- 7.7. APAC Anti Cancer Drug Market Analysis, Opportunity and Forecast, By Country , 2016-2032
- 7.7.1. APAC Anti Cancer Drug Market Analysis by Country : Introduction
- 7.7.2. Market Size Absolute $ Opportunity Analysis and Forecast, Country , 2016-2032
- 7.7.2.1. China
- 7.7.2.2. Japan
- 7.7.2.3. South Korea
- 7.7.2.4. India
- 7.7.2.5. Australia & New Zeland
- 7.7.2.6. Indonesia
- 7.7.2.7. Malaysia
- 7.7.2.8. Philippines
- 7.7.2.9. Singapore
- 7.7.2.10. Thailand
- 7.7.2.11. Vietnam
- 7.7.2.12. Rest of APAC
- 8. Latin America Anti Cancer Drug Market Analysis, Opportunity and Forecast, 2016-2032
- 8.1. Latin America Anti Cancer Drug Market Analysis, 2016-2021
- 8.2. Latin America Anti Cancer Drug Market Opportunity and Forecast, 2023-2032
- 8.3. Latin America Anti Cancer Drug Market Analysis, Opportunity and Forecast, By Drug Type, 2016-2032
- 8.3.1. Latin America Anti Cancer Drug Market Analysis by Drug Type: Introduction
- 8.3.2. Market Size Absolute $ Opportunity Analysis and Forecast, By Drug Type, 2016-2032
- 8.3.3. Chemotherapy Drugs
- 8.3.4. Targeted Therapy Drugs
- 8.3.5. Immunotherapy Drugs
- 8.3.6. Hormonal Therapy Drugs
- 8.3.7. Other Therapy Drugs
- 8.4. Latin America Anti Cancer Drug Market Analysis, Opportunity and Forecast, By Mode of Action, 2016-2032
- 8.4.1. Latin America Anti Cancer Drug Market Analysis by Mode of Action: Introduction
- 8.4.2. Market Size Absolute $ Opportunity Analysis and Forecast, By Mode of Action, 2016-2032
- 8.4.3. Cytotoxic Agents
- 8.4.4. Signal Transduction Inhibitors
- 8.4.5. Immune Checkpoint Inhibitors
- 8.4.6. Hormone Receptor Modulators
- 8.4.7. Angiogenesis Inhibitors
- 8.4.8. Apoptosis Inducers
- 8.4.9. Others
- 8.5. Latin America Anti Cancer Drug Market Analysis, Opportunity and Forecast, By Cancer Type, 2016-2032
- 8.5.1. Latin America Anti Cancer Drug Market Analysis by Cancer Type: Introduction
- 8.5.2. Market Size Absolute $ Opportunity Analysis and Forecast, By Cancer Type, 2016-2032
- 8.5.3. Breast Cancer
- 8.5.4. Lung Cancer
- 8.5.5. Colorectal Cancer
- 8.5.6. Prostate Cancer
- 8.5.7. Leukemia
- 8.5.8. Lymphoma
- 8.5.9. Melanoma
- 8.5.10. Other Cancer Types
- 8.6. Latin America Anti Cancer Drug Market Analysis, Opportunity and Forecast, By End Users, 2016-2032
- 8.6.1. Latin America Anti Cancer Drug Market Analysis by End Users: Introduction
- 8.6.2. Market Size Absolute $ Opportunity Analysis and Forecast, By End Users, 2016-2032
- 8.6.3. Hospitals
- 8.6.4. Specialty Clinics
- 8.6.5. Cancer Centers
- 8.6.6. Ambulatory Surgical Centers
- 8.6.7. Research Institutes
- 8.7. Latin America Anti Cancer Drug Market Analysis, Opportunity and Forecast, By Country , 2016-2032
- 8.7.1. Latin America Anti Cancer Drug Market Analysis by Country : Introduction
- 8.7.2. Market Size Absolute $ Opportunity Analysis and Forecast, Country , 2016-2032
- 8.7.2.1. Brazil
- 8.7.2.2. Colombia
- 8.7.2.3. Chile
- 8.7.2.4. Argentina
- 8.7.2.5. Costa Rica
- 8.7.2.6. Rest of Latin America
- 9. Middle East & Africa Anti Cancer Drug Market Analysis, Opportunity and Forecast, 2016-2032
- 9.1. Middle East & Africa Anti Cancer Drug Market Analysis, 2016-2021
- 9.2. Middle East & Africa Anti Cancer Drug Market Opportunity and Forecast, 2023-2032
- 9.3. Middle East & Africa Anti Cancer Drug Market Analysis, Opportunity and Forecast, By Drug Type, 2016-2032
- 9.3.1. Middle East & Africa Anti Cancer Drug Market Analysis by Drug Type: Introduction
- 9.3.2. Market Size Absolute $ Opportunity Analysis and Forecast, By Drug Type, 2016-2032
- 9.3.3. Chemotherapy Drugs
- 9.3.4. Targeted Therapy Drugs
- 9.3.5. Immunotherapy Drugs
- 9.3.6. Hormonal Therapy Drugs
- 9.3.7. Other Therapy Drugs
- 9.4. Middle East & Africa Anti Cancer Drug Market Analysis, Opportunity and Forecast, By Mode of Action, 2016-2032
- 9.4.1. Middle East & Africa Anti Cancer Drug Market Analysis by Mode of Action: Introduction
- 9.4.2. Market Size Absolute $ Opportunity Analysis and Forecast, By Mode of Action, 2016-2032
- 9.4.3. Cytotoxic Agents
- 9.4.4. Signal Transduction Inhibitors
- 9.4.5. Immune Checkpoint Inhibitors
- 9.4.6. Hormone Receptor Modulators
- 9.4.7. Angiogenesis Inhibitors
- 9.4.8. Apoptosis Inducers
- 9.4.9. Others
- 9.5. Middle East & Africa Anti Cancer Drug Market Analysis, Opportunity and Forecast, By Cancer Type, 2016-2032
- 9.5.1. Middle East & Africa Anti Cancer Drug Market Analysis by Cancer Type: Introduction
- 9.5.2. Market Size Absolute $ Opportunity Analysis and Forecast, By Cancer Type, 2016-2032
- 9.5.3. Breast Cancer
- 9.5.4. Lung Cancer
- 9.5.5. Colorectal Cancer
- 9.5.6. Prostate Cancer
- 9.5.7. Leukemia
- 9.5.8. Lymphoma
- 9.5.9. Melanoma
- 9.5.10. Other Cancer Types
- 9.6. Middle East & Africa Anti Cancer Drug Market Analysis, Opportunity and Forecast, By End Users, 2016-2032
- 9.6.1. Middle East & Africa Anti Cancer Drug Market Analysis by End Users: Introduction
- 9.6.2. Market Size Absolute $ Opportunity Analysis and Forecast, By End Users, 2016-2032
- 9.6.3. Hospitals
- 9.6.4. Specialty Clinics
- 9.6.5. Cancer Centers
- 9.6.6. Ambulatory Surgical Centers
- 9.6.7. Research Institutes
- 9.7. Middle East & Africa Anti Cancer Drug Market Analysis, Opportunity and Forecast, By Country , 2016-2032
- 9.7.1. Middle East & Africa Anti Cancer Drug Market Analysis by Country : Introduction
- 9.7.2. Market Size Absolute $ Opportunity Analysis and Forecast, Country , 2016-2032
- 9.7.2.1. Algeria
- 9.7.2.2. Egypt
- 9.7.2.3. Israel
- 9.7.2.4. Kuwait
- 9.7.2.5. Nigeria
- 9.7.2.6. Saudi Arabia
- 9.7.2.7. South Africa
- 9.7.2.8. Turkey
- 9.7.2.9. The UAE
- 9.7.2.10. Rest of MEA
- 10. Global Anti Cancer Drug Market Analysis, Opportunity and Forecast, By Region , 2016-2032
- 10.1. Global Anti Cancer Drug Market Analysis by Region : Introduction
- 10.2. Market Size Absolute $ Opportunity Analysis and Forecast, By Region , 2016-2032
- 10.2.1. North America
- 10.2.2. Western Europe
- 10.2.3. Eastern Europe
- 10.2.4. APAC
- 10.2.5. Latin America
- 10.2.6. Middle East & Africa
- 11. Global Anti Cancer Drug Market Competitive Landscape, Market Share Analysis, and Company Profiles
- 11.1. Market Share Analysis
- 11.2. Company Profiles
- 11.3. Eli Lilly and Company
- 11.3.1. Company Overview
- 11.3.2. Financial Highlights
- 11.3.3. Product Portfolio
- 11.3.4. SWOT Analysis
- 11.3.5. Key Strategies and Developments
- 11.4. Pfizer Inc.
- 11.4.1. Company Overview
- 11.4.2. Financial Highlights
- 11.4.3. Product Portfolio
- 11.4.4. SWOT Analysis
- 11.4.5. Key Strategies and Developments
- 11.5. Novartis AG
- 11.5.1. Company Overview
- 11.5.2. Financial Highlights
- 11.5.3. Product Portfolio
- 11.5.4. SWOT Analysis
- 11.5.5. Key Strategies and Developments
- 11.6. Bristol-Myers Squibb Company
- 11.6.1. Company Overview
- 11.6.2. Financial Highlights
- 11.6.3. Product Portfolio
- 11.6.4. SWOT Analysis
- 11.6.5. Key Strategies and Developments
- 11.7. AbbVie Inc.
- 11.7.1. Company Overview
- 11.7.2. Financial Highlights
- 11.7.3. Product Portfolio
- 11.7.4. SWOT Analysis
- 11.7.5. Key Strategies and Developments
- 11.8. CELGENE Corporation
- 11.8.1. Company Overview
- 11.8.2. Financial Highlights
- 11.8.3. Product Portfolio
- 11.8.4. SWOT Analysis
- 11.8.5. Key Strategies and Developments
- 11.9. Genentech, Inc.
- 11.9.1. Company Overview
- 11.9.2. Financial Highlights
- 11.9.3. Product Portfolio
- 11.9.4. SWOT Analysis
- 11.9.5. Key Strategies and Developments
- 11.10. Astellas Pharma Inc.
- 11.10.1. Company Overview
- 11.10.2. Financial Highlights
- 11.10.3. Product Portfolio
- 11.10.4. SWOT Analysis
- 11.10.5. Key Strategies and Developments
- 11.11. Amgen Inc.
- 11.11.1. Company Overview
- 11.11.2. Financial Highlights
- 11.11.3. Product Portfolio
- 11.11.4. SWOT Analysis
- 11.11.5. Key Strategies and Developments
- 11.12. Merck & Co. Inc.
- 11.12.1. Company Overview
- 11.12.2. Financial Highlights
- 11.12.3. Product Portfolio
- 11.12.4. SWOT Analysis
- 11.12.5. Key Strategies and Developments
- 11.13.1. Company Overview
- 11.13.2. Financial Highlights
- 11.13.3. Product Portfolio
- 11.13.4. SWOT Analysis
- 11.13.5. Key Strategies and Developments
- 11.14. Johnson & Johnson
- 11.14.1. Company Overview
- 11.14.2. Financial Highlights
- 11.14.3. Product Portfolio
- 11.14.4. SWOT Analysis
- 11.14.5. Key Strategies and Developments
- 12. Assumptions and Acronyms
- 13. Research Methodology
- 14. Contact
- List of Figures
- Figure 1: Global Anti Cancer Drug Market Revenue (US$ Mn) Market Share by Drug Type in 2022
- Figure 2: Global Anti Cancer Drug Market Attractiveness Analysis by Drug Type, 2016-2032
- Figure 3: Global Anti Cancer Drug Market Revenue (US$ Mn) Market Share by Mode of Actionin 2022
- Figure 4: Global Anti Cancer Drug Market Attractiveness Analysis by Mode of Action, 2016-2032
- Figure 5: Global Anti Cancer Drug Market Revenue (US$ Mn) Market Share by Cancer Typein 2022
- Figure 6: Global Anti Cancer Drug Market Attractiveness Analysis by Cancer Type, 2016-2032
- Figure 7: Global Anti Cancer Drug Market Revenue (US$ Mn) Market Share by End Usersin 2022
- Figure 8: Global Anti Cancer Drug Market Attractiveness Analysis by End Users, 2016-2032
- Figure 9: Global Anti Cancer Drug Market Revenue (US$ Mn) Market Share by Region in 2022
- Figure 10: Global Anti Cancer Drug Market Attractiveness Analysis by Region, 2016-2032
- Figure 11: Global Anti Cancer Drug Market Revenue (US$ Mn) (2016-2032)
- Figure 12: Global Anti Cancer Drug Market Revenue (US$ Mn) Comparison by Region (2016-2032)
- Figure 13: Global Anti Cancer Drug Market Revenue (US$ Mn) Comparison by Drug Type (2016-2032)
- Figure 14: Global Anti Cancer Drug Market Revenue (US$ Mn) Comparison by Mode of Action (2016-2032)
- Figure 15: Global Anti Cancer Drug Market Revenue (US$ Mn) Comparison by Cancer Type (2016-2032)
- Figure 16: Global Anti Cancer Drug Market Revenue (US$ Mn) Comparison by End Users (2016-2032)
- Figure 17: Global Anti Cancer Drug Market Y-o-Y Growth Rate Comparison by Region (2016-2032)
- Figure 18: Global Anti Cancer Drug Market Y-o-Y Growth Rate Comparison by Drug Type (2016-2032)
- Figure 19: Global Anti Cancer Drug Market Y-o-Y Growth Rate Comparison by Mode of Action (2016-2032)
- Figure 20: Global Anti Cancer Drug Market Y-o-Y Growth Rate Comparison by Cancer Type (2016-2032)
- Figure 21: Global Anti Cancer Drug Market Y-o-Y Growth Rate Comparison by End Users (2016-2032)
- Figure 22: Global Anti Cancer Drug Market Share Comparison by Region (2016-2032)
- Figure 23: Global Anti Cancer Drug Market Share Comparison by Drug Type (2016-2032)
- Figure 24: Global Anti Cancer Drug Market Share Comparison by Mode of Action (2016-2032)
- Figure 25: Global Anti Cancer Drug Market Share Comparison by Cancer Type (2016-2032)
- Figure 26: Global Anti Cancer Drug Market Share Comparison by End Users (2016-2032)
- Figure 27: North America Anti Cancer Drug Market Revenue (US$ Mn) Market Share by Drug Typein 2022
- Figure 28: North America Anti Cancer Drug Market Attractiveness Analysis by Drug Type, 2016-2032
- Figure 29: North America Anti Cancer Drug Market Revenue (US$ Mn) Market Share by Mode of Actionin 2022
- Figure 30: North America Anti Cancer Drug Market Attractiveness Analysis by Mode of Action, 2016-2032
- Figure 31: North America Anti Cancer Drug Market Revenue (US$ Mn) Market Share by Cancer Typein 2022
- Figure 32: North America Anti Cancer Drug Market Attractiveness Analysis by Cancer Type, 2016-2032
- Figure 33: North America Anti Cancer Drug Market Revenue (US$ Mn) Market Share by End Usersin 2022
- Figure 34: North America Anti Cancer Drug Market Attractiveness Analysis by End Users, 2016-2032
- Figure 35: North America Anti Cancer Drug Market Revenue (US$ Mn) Market Share by Country in 2022
- Figure 36: North America Anti Cancer Drug Market Attractiveness Analysis by Country, 2016-2032
- Figure 37: North America Anti Cancer Drug Market Revenue (US$ Mn) (2016-2032)
- Figure 38: North America Anti Cancer Drug Market Revenue (US$ Mn) Comparison by Country (2016-2032)
- Figure 39: North America Anti Cancer Drug Market Revenue (US$ Mn) Comparison by Drug Type (2016-2032)
- Figure 40: North America Anti Cancer Drug Market Revenue (US$ Mn) Comparison by Mode of Action (2016-2032)
- Figure 41: North America Anti Cancer Drug Market Revenue (US$ Mn) Comparison by Cancer Type (2016-2032)
- Figure 42: North America Anti Cancer Drug Market Revenue (US$ Mn) Comparison by End Users (2016-2032)
- Figure 43: North America Anti Cancer Drug Market Y-o-Y Growth Rate Comparison by Country (2016-2032)
- Figure 44: North America Anti Cancer Drug Market Y-o-Y Growth Rate Comparison by Drug Type (2016-2032)
- Figure 45: North America Anti Cancer Drug Market Y-o-Y Growth Rate Comparison by Mode of Action (2016-2032)
- Figure 46: North America Anti Cancer Drug Market Y-o-Y Growth Rate Comparison by Cancer Type (2016-2032)
- Figure 47: North America Anti Cancer Drug Market Y-o-Y Growth Rate Comparison by End Users (2016-2032)
- Figure 48: North America Anti Cancer Drug Market Share Comparison by Country (2016-2032)
- Figure 49: North America Anti Cancer Drug Market Share Comparison by Drug Type (2016-2032)
- Figure 50: North America Anti Cancer Drug Market Share Comparison by Mode of Action (2016-2032)
- Figure 51: North America Anti Cancer Drug Market Share Comparison by Cancer Type (2016-2032)
- Figure 52: North America Anti Cancer Drug Market Share Comparison by End Users (2016-2032)
- Figure 53: Western Europe Anti Cancer Drug Market Revenue (US$ Mn) Market Share by Drug Typein 2022
- Figure 54: Western Europe Anti Cancer Drug Market Attractiveness Analysis by Drug Type, 2016-2032
- Figure 55: Western Europe Anti Cancer Drug Market Revenue (US$ Mn) Market Share by Mode of Actionin 2022
- Figure 56: Western Europe Anti Cancer Drug Market Attractiveness Analysis by Mode of Action, 2016-2032
- Figure 57: Western Europe Anti Cancer Drug Market Revenue (US$ Mn) Market Share by Cancer Typein 2022
- Figure 58: Western Europe Anti Cancer Drug Market Attractiveness Analysis by Cancer Type, 2016-2032
- Figure 59: Western Europe Anti Cancer Drug Market Revenue (US$ Mn) Market Share by End Usersin 2022
- Figure 60: Western Europe Anti Cancer Drug Market Attractiveness Analysis by End Users, 2016-2032
- Figure 61: Western Europe Anti Cancer Drug Market Revenue (US$ Mn) Market Share by Country in 2022
- Figure 62: Western Europe Anti Cancer Drug Market Attractiveness Analysis by Country, 2016-2032
- Figure 63: Western Europe Anti Cancer Drug Market Revenue (US$ Mn) (2016-2032)
- Figure 64: Western Europe Anti Cancer Drug Market Revenue (US$ Mn) Comparison by Country (2016-2032)
- Figure 65: Western Europe Anti Cancer Drug Market Revenue (US$ Mn) Comparison by Drug Type (2016-2032)
- Figure 66: Western Europe Anti Cancer Drug Market Revenue (US$ Mn) Comparison by Mode of Action (2016-2032)
- Figure 67: Western Europe Anti Cancer Drug Market Revenue (US$ Mn) Comparison by Cancer Type (2016-2032)
- Figure 68: Western Europe Anti Cancer Drug Market Revenue (US$ Mn) Comparison by End Users (2016-2032)
- Figure 69: Western Europe Anti Cancer Drug Market Y-o-Y Growth Rate Comparison by Country (2016-2032)
- Figure 70: Western Europe Anti Cancer Drug Market Y-o-Y Growth Rate Comparison by Drug Type (2016-2032)
- Figure 71: Western Europe Anti Cancer Drug Market Y-o-Y Growth Rate Comparison by Mode of Action (2016-2032)
- Figure 72: Western Europe Anti Cancer Drug Market Y-o-Y Growth Rate Comparison by Cancer Type (2016-2032)
- Figure 73: Western Europe Anti Cancer Drug Market Y-o-Y Growth Rate Comparison by End Users (2016-2032)
- Figure 74: Western Europe Anti Cancer Drug Market Share Comparison by Country (2016-2032)
- Figure 75: Western Europe Anti Cancer Drug Market Share Comparison by Drug Type (2016-2032)
- Figure 76: Western Europe Anti Cancer Drug Market Share Comparison by Mode of Action (2016-2032)
- Figure 77: Western Europe Anti Cancer Drug Market Share Comparison by Cancer Type (2016-2032)
- Figure 78: Western Europe Anti Cancer Drug Market Share Comparison by End Users (2016-2032)
- Figure 79: Eastern Europe Anti Cancer Drug Market Revenue (US$ Mn) Market Share by Drug Typein 2022
- Figure 80: Eastern Europe Anti Cancer Drug Market Attractiveness Analysis by Drug Type, 2016-2032
- Figure 81: Eastern Europe Anti Cancer Drug Market Revenue (US$ Mn) Market Share by Mode of Actionin 2022
- Figure 82: Eastern Europe Anti Cancer Drug Market Attractiveness Analysis by Mode of Action, 2016-2032
- Figure 83: Eastern Europe Anti Cancer Drug Market Revenue (US$ Mn) Market Share by Cancer Typein 2022
- Figure 84: Eastern Europe Anti Cancer Drug Market Attractiveness Analysis by Cancer Type, 2016-2032
- Figure 85: Eastern Europe Anti Cancer Drug Market Revenue (US$ Mn) Market Share by End Usersin 2022
- Figure 86: Eastern Europe Anti Cancer Drug Market Attractiveness Analysis by End Users, 2016-2032
- Figure 87: Eastern Europe Anti Cancer Drug Market Revenue (US$ Mn) Market Share by Country in 2022
- Figure 88: Eastern Europe Anti Cancer Drug Market Attractiveness Analysis by Country, 2016-2032
- Figure 89: Eastern Europe Anti Cancer Drug Market Revenue (US$ Mn) (2016-2032)
- Figure 90: Eastern Europe Anti Cancer Drug Market Revenue (US$ Mn) Comparison by Country (2016-2032)
- Figure 91: Eastern Europe Anti Cancer Drug Market Revenue (US$ Mn) Comparison by Drug Type (2016-2032)
- Figure 92: Eastern Europe Anti Cancer Drug Market Revenue (US$ Mn) Comparison by Mode of Action (2016-2032)
- Figure 93: Eastern Europe Anti Cancer Drug Market Revenue (US$ Mn) Comparison by Cancer Type (2016-2032)
- Figure 94: Eastern Europe Anti Cancer Drug Market Revenue (US$ Mn) Comparison by End Users (2016-2032)
- Figure 95: Eastern Europe Anti Cancer Drug Market Y-o-Y Growth Rate Comparison by Country (2016-2032)
- Figure 96: Eastern Europe Anti Cancer Drug Market Y-o-Y Growth Rate Comparison by Drug Type (2016-2032)
- Figure 97: Eastern Europe Anti Cancer Drug Market Y-o-Y Growth Rate Comparison by Mode of Action (2016-2032)
- Figure 98: Eastern Europe Anti Cancer Drug Market Y-o-Y Growth Rate Comparison by Cancer Type (2016-2032)
- Figure 99: Eastern Europe Anti Cancer Drug Market Y-o-Y Growth Rate Comparison by End Users (2016-2032)
- Figure 100: Eastern Europe Anti Cancer Drug Market Share Comparison by Country (2016-2032)
- Figure 101: Eastern Europe Anti Cancer Drug Market Share Comparison by Drug Type (2016-2032)
- Figure 102: Eastern Europe Anti Cancer Drug Market Share Comparison by Mode of Action (2016-2032)
- Figure 103: Eastern Europe Anti Cancer Drug Market Share Comparison by Cancer Type (2016-2032)
- Figure 104: Eastern Europe Anti Cancer Drug Market Share Comparison by End Users (2016-2032)
- Figure 105: APAC Anti Cancer Drug Market Revenue (US$ Mn) Market Share by Drug Typein 2022
- Figure 106: APAC Anti Cancer Drug Market Attractiveness Analysis by Drug Type, 2016-2032
- Figure 107: APAC Anti Cancer Drug Market Revenue (US$ Mn) Market Share by Mode of Actionin 2022
- Figure 108: APAC Anti Cancer Drug Market Attractiveness Analysis by Mode of Action, 2016-2032
- Figure 109: APAC Anti Cancer Drug Market Revenue (US$ Mn) Market Share by Cancer Typein 2022
- Figure 110: APAC Anti Cancer Drug Market Attractiveness Analysis by Cancer Type, 2016-2032
- Figure 111: APAC Anti Cancer Drug Market Revenue (US$ Mn) Market Share by End Usersin 2022
- Figure 112: APAC Anti Cancer Drug Market Attractiveness Analysis by End Users, 2016-2032
- Figure 113: APAC Anti Cancer Drug Market Revenue (US$ Mn) Market Share by Country in 2022
- Figure 114: APAC Anti Cancer Drug Market Attractiveness Analysis by Country, 2016-2032
- Figure 115: APAC Anti Cancer Drug Market Revenue (US$ Mn) (2016-2032)
- Figure 116: APAC Anti Cancer Drug Market Revenue (US$ Mn) Comparison by Country (2016-2032)
- Figure 117: APAC Anti Cancer Drug Market Revenue (US$ Mn) Comparison by Drug Type (2016-2032)
- Figure 118: APAC Anti Cancer Drug Market Revenue (US$ Mn) Comparison by Mode of Action (2016-2032)
- Figure 119: APAC Anti Cancer Drug Market Revenue (US$ Mn) Comparison by Cancer Type (2016-2032)
- Figure 120: APAC Anti Cancer Drug Market Revenue (US$ Mn) Comparison by End Users (2016-2032)
- Figure 121: APAC Anti Cancer Drug Market Y-o-Y Growth Rate Comparison by Country (2016-2032)
- Figure 122: APAC Anti Cancer Drug Market Y-o-Y Growth Rate Comparison by Drug Type (2016-2032)
- Figure 123: APAC Anti Cancer Drug Market Y-o-Y Growth Rate Comparison by Mode of Action (2016-2032)
- Figure 124: APAC Anti Cancer Drug Market Y-o-Y Growth Rate Comparison by Cancer Type (2016-2032)
- Figure 125: APAC Anti Cancer Drug Market Y-o-Y Growth Rate Comparison by End Users (2016-2032)
- Figure 126: APAC Anti Cancer Drug Market Share Comparison by Country (2016-2032)
- Figure 127: APAC Anti Cancer Drug Market Share Comparison by Drug Type (2016-2032)
- Figure 128: APAC Anti Cancer Drug Market Share Comparison by Mode of Action (2016-2032)
- Figure 129: APAC Anti Cancer Drug Market Share Comparison by Cancer Type (2016-2032)
- Figure 130: APAC Anti Cancer Drug Market Share Comparison by End Users (2016-2032)
- Figure 131: Latin America Anti Cancer Drug Market Revenue (US$ Mn) Market Share by Drug Typein 2022
- Figure 132: Latin America Anti Cancer Drug Market Attractiveness Analysis by Drug Type, 2016-2032
- Figure 133: Latin America Anti Cancer Drug Market Revenue (US$ Mn) Market Share by Mode of Actionin 2022
- Figure 134: Latin America Anti Cancer Drug Market Attractiveness Analysis by Mode of Action, 2016-2032
- Figure 135: Latin America Anti Cancer Drug Market Revenue (US$ Mn) Market Share by Cancer Typein 2022
- Figure 136: Latin America Anti Cancer Drug Market Attractiveness Analysis by Cancer Type, 2016-2032
- Figure 137: Latin America Anti Cancer Drug Market Revenue (US$ Mn) Market Share by End Usersin 2022
- Figure 138: Latin America Anti Cancer Drug Market Attractiveness Analysis by End Users, 2016-2032
- Figure 139: Latin America Anti Cancer Drug Market Revenue (US$ Mn) Market Share by Country in 2022
- Figure 140: Latin America Anti Cancer Drug Market Attractiveness Analysis by Country, 2016-2032
- Figure 141: Latin America Anti Cancer Drug Market Revenue (US$ Mn) (2016-2032)
- Figure 142: Latin America Anti Cancer Drug Market Revenue (US$ Mn) Comparison by Country (2016-2032)
- Figure 143: Latin America Anti Cancer Drug Market Revenue (US$ Mn) Comparison by Drug Type (2016-2032)
- Figure 144: Latin America Anti Cancer Drug Market Revenue (US$ Mn) Comparison by Mode of Action (2016-2032)
- Figure 145: Latin America Anti Cancer Drug Market Revenue (US$ Mn) Comparison by Cancer Type (2016-2032)
- Figure 146: Latin America Anti Cancer Drug Market Revenue (US$ Mn) Comparison by End Users (2016-2032)
- Figure 147: Latin America Anti Cancer Drug Market Y-o-Y Growth Rate Comparison by Country (2016-2032)
- Figure 148: Latin America Anti Cancer Drug Market Y-o-Y Growth Rate Comparison by Drug Type (2016-2032)
- Figure 149: Latin America Anti Cancer Drug Market Y-o-Y Growth Rate Comparison by Mode of Action (2016-2032)
- Figure 150: Latin America Anti Cancer Drug Market Y-o-Y Growth Rate Comparison by Cancer Type (2016-2032)
- Figure 151: Latin America Anti Cancer Drug Market Y-o-Y Growth Rate Comparison by End Users (2016-2032)
- Figure 152: Latin America Anti Cancer Drug Market Share Comparison by Country (2016-2032)
- Figure 153: Latin America Anti Cancer Drug Market Share Comparison by Drug Type (2016-2032)
- Figure 154: Latin America Anti Cancer Drug Market Share Comparison by Mode of Action (2016-2032)
- Figure 155: Latin America Anti Cancer Drug Market Share Comparison by Cancer Type (2016-2032)
- Figure 156: Latin America Anti Cancer Drug Market Share Comparison by End Users (2016-2032)
- Figure 157: Middle East & Africa Anti Cancer Drug Market Revenue (US$ Mn) Market Share by Drug Typein 2022
- Figure 158: Middle East & Africa Anti Cancer Drug Market Attractiveness Analysis by Drug Type, 2016-2032
- Figure 159: Middle East & Africa Anti Cancer Drug Market Revenue (US$ Mn) Market Share by Mode of Actionin 2022
- Figure 160: Middle East & Africa Anti Cancer Drug Market Attractiveness Analysis by Mode of Action, 2016-2032
- Figure 161: Middle East & Africa Anti Cancer Drug Market Revenue (US$ Mn) Market Share by Cancer Typein 2022
- Figure 162: Middle East & Africa Anti Cancer Drug Market Attractiveness Analysis by Cancer Type, 2016-2032
- Figure 163: Middle East & Africa Anti Cancer Drug Market Revenue (US$ Mn) Market Share by End Usersin 2022
- Figure 164: Middle East & Africa Anti Cancer Drug Market Attractiveness Analysis by End Users, 2016-2032
- Figure 165: Middle East & Africa Anti Cancer Drug Market Revenue (US$ Mn) Market Share by Country in 2022
- Figure 166: Middle East & Africa Anti Cancer Drug Market Attractiveness Analysis by Country, 2016-2032
- Figure 167: Middle East & Africa Anti Cancer Drug Market Revenue (US$ Mn) (2016-2032)
- Figure 168: Middle East & Africa Anti Cancer Drug Market Revenue (US$ Mn) Comparison by Country (2016-2032)
- Figure 169: Middle East & Africa Anti Cancer Drug Market Revenue (US$ Mn) Comparison by Drug Type (2016-2032)
- Figure 170: Middle East & Africa Anti Cancer Drug Market Revenue (US$ Mn) Comparison by Mode of Action (2016-2032)
- Figure 171: Middle East & Africa Anti Cancer Drug Market Revenue (US$ Mn) Comparison by Cancer Type (2016-2032)
- Figure 172: Middle East & Africa Anti Cancer Drug Market Revenue (US$ Mn) Comparison by End Users (2016-2032)
- Figure 173: Middle East & Africa Anti Cancer Drug Market Y-o-Y Growth Rate Comparison by Country (2016-2032)
- Figure 174: Middle East & Africa Anti Cancer Drug Market Y-o-Y Growth Rate Comparison by Drug Type (2016-2032)
- Figure 175: Middle East & Africa Anti Cancer Drug Market Y-o-Y Growth Rate Comparison by Mode of Action (2016-2032)
- Figure 176: Middle East & Africa Anti Cancer Drug Market Y-o-Y Growth Rate Comparison by Cancer Type (2016-2032)
- Figure 177: Middle East & Africa Anti Cancer Drug Market Y-o-Y Growth Rate Comparison by End Users (2016-2032)
- Figure 178: Middle East & Africa Anti Cancer Drug Market Share Comparison by Country (2016-2032)
- Figure 179: Middle East & Africa Anti Cancer Drug Market Share Comparison by Drug Type (2016-2032)
- Figure 180: Middle East & Africa Anti Cancer Drug Market Share Comparison by Mode of Action (2016-2032)
- Figure 181: Middle East & Africa Anti Cancer Drug Market Share Comparison by Cancer Type (2016-2032)
- Figure 182: Middle East & Africa Anti Cancer Drug Market Share Comparison by End Users (2016-2032)
- List of Tables
- Table 1: Global Anti Cancer Drug Market Comparison by Drug Type (2016-2032)
- Table 2: Global Anti Cancer Drug Market Comparison by Mode of Action (2016-2032)
- Table 3: Global Anti Cancer Drug Market Comparison by Cancer Type (2016-2032)
- Table 4: Global Anti Cancer Drug Market Comparison by End Users (2016-2032)
- Table 5: Global Anti Cancer Drug Market Revenue (US$ Mn) Comparison by Region (2016-2032)
- Table 6: Global Anti Cancer Drug Market Revenue (US$ Mn) (2016-2032)
- Table 7: Global Anti Cancer Drug Market Revenue (US$ Mn) Comparison by Region (2016-2032)
- Table 8: Global Anti Cancer Drug Market Revenue (US$ Mn) Comparison by Drug Type (2016-2032)
- Table 9: Global Anti Cancer Drug Market Revenue (US$ Mn) Comparison by Mode of Action (2016-2032)
- Table 10: Global Anti Cancer Drug Market Revenue (US$ Mn) Comparison by Cancer Type (2016-2032)
- Table 11: Global Anti Cancer Drug Market Revenue (US$ Mn) Comparison by End Users (2016-2032)
- Table 12: Global Anti Cancer Drug Market Y-o-Y Growth Rate Comparison by Region (2016-2032)
- Table 13: Global Anti Cancer Drug Market Y-o-Y Growth Rate Comparison by Drug Type (2016-2032)
- Table 14: Global Anti Cancer Drug Market Y-o-Y Growth Rate Comparison by Mode of Action (2016-2032)
- Table 15: Global Anti Cancer Drug Market Y-o-Y Growth Rate Comparison by Cancer Type (2016-2032)
- Table 16: Global Anti Cancer Drug Market Y-o-Y Growth Rate Comparison by End Users (2016-2032)
- Table 17: Global Anti Cancer Drug Market Share Comparison by Region (2016-2032)
- Table 18: Global Anti Cancer Drug Market Share Comparison by Drug Type (2016-2032)
- Table 19: Global Anti Cancer Drug Market Share Comparison by Mode of Action (2016-2032)
- Table 20: Global Anti Cancer Drug Market Share Comparison by Cancer Type (2016-2032)
- Table 21: Global Anti Cancer Drug Market Share Comparison by End Users (2016-2032)
- Table 22: North America Anti Cancer Drug Market Comparison by Mode of Action (2016-2032)
- Table 23: North America Anti Cancer Drug Market Comparison by Cancer Type (2016-2032)
- Table 24: North America Anti Cancer Drug Market Comparison by End Users (2016-2032)
- Table 25: North America Anti Cancer Drug Market Revenue (US$ Mn) Comparison by Country (2016-2032)
- Table 26: North America Anti Cancer Drug Market Revenue (US$ Mn) (2016-2032)
- Table 27: North America Anti Cancer Drug Market Revenue (US$ Mn) Comparison by Country (2016-2032)
- Table 28: North America Anti Cancer Drug Market Revenue (US$ Mn) Comparison by Drug Type (2016-2032)
- Table 29: North America Anti Cancer Drug Market Revenue (US$ Mn) Comparison by Mode of Action (2016-2032)
- Table 30: North America Anti Cancer Drug Market Revenue (US$ Mn) Comparison by Cancer Type (2016-2032)
- Table 31: North America Anti Cancer Drug Market Revenue (US$ Mn) Comparison by End Users (2016-2032)
- Table 32: North America Anti Cancer Drug Market Y-o-Y Growth Rate Comparison by Country (2016-2032)
- Table 33: North America Anti Cancer Drug Market Y-o-Y Growth Rate Comparison by Drug Type (2016-2032)
- Table 34: North America Anti Cancer Drug Market Y-o-Y Growth Rate Comparison by Mode of Action (2016-2032)
- Table 35: North America Anti Cancer Drug Market Y-o-Y Growth Rate Comparison by Cancer Type (2016-2032)
- Table 36: North America Anti Cancer Drug Market Y-o-Y Growth Rate Comparison by End Users (2016-2032)
- Table 37: North America Anti Cancer Drug Market Share Comparison by Country (2016-2032)
- Table 38: North America Anti Cancer Drug Market Share Comparison by Drug Type (2016-2032)
- Table 39: North America Anti Cancer Drug Market Share Comparison by Mode of Action (2016-2032)
- Table 40: North America Anti Cancer Drug Market Share Comparison by Cancer Type (2016-2032)
- Table 41: North America Anti Cancer Drug Market Share Comparison by End Users (2016-2032)
- Table 42: Western Europe Anti Cancer Drug Market Comparison by Drug Type (2016-2032)
- Table 43: Western Europe Anti Cancer Drug Market Comparison by Mode of Action (2016-2032)
- Table 44: Western Europe Anti Cancer Drug Market Comparison by Cancer Type (2016-2032)
- Table 45: Western Europe Anti Cancer Drug Market Comparison by End Users (2016-2032)
- Table 46: Western Europe Anti Cancer Drug Market Revenue (US$ Mn) Comparison by Country (2016-2032)
- Table 47: Western Europe Anti Cancer Drug Market Revenue (US$ Mn) (2016-2032)
- Table 48: Western Europe Anti Cancer Drug Market Revenue (US$ Mn) Comparison by Country (2016-2032)
- Table 49: Western Europe Anti Cancer Drug Market Revenue (US$ Mn) Comparison by Drug Type (2016-2032)
- Table 50: Western Europe Anti Cancer Drug Market Revenue (US$ Mn) Comparison by Mode of Action (2016-2032)
- Table 51: Western Europe Anti Cancer Drug Market Revenue (US$ Mn) Comparison by Cancer Type (2016-2032)
- Table 52: Western Europe Anti Cancer Drug Market Revenue (US$ Mn) Comparison by End Users (2016-2032)
- Table 53: Western Europe Anti Cancer Drug Market Y-o-Y Growth Rate Comparison by Country (2016-2032)
- Table 54: Western Europe Anti Cancer Drug Market Y-o-Y Growth Rate Comparison by Drug Type (2016-2032)
- Table 55: Western Europe Anti Cancer Drug Market Y-o-Y Growth Rate Comparison by Mode of Action (2016-2032)
- Table 56: Western Europe Anti Cancer Drug Market Y-o-Y Growth Rate Comparison by Cancer Type (2016-2032)
- Table 57: Western Europe Anti Cancer Drug Market Y-o-Y Growth Rate Comparison by End Users (2016-2032)
- Table 58: Western Europe Anti Cancer Drug Market Share Comparison by Country (2016-2032)
- Table 59: Western Europe Anti Cancer Drug Market Share Comparison by Drug Type (2016-2032)
- Table 60: Western Europe Anti Cancer Drug Market Share Comparison by Mode of Action (2016-2032)
- Table 61: Western Europe Anti Cancer Drug Market Share Comparison by Cancer Type (2016-2032)
- Table 62: Western Europe Anti Cancer Drug Market Share Comparison by End Users (2016-2032)
- Table 63: Eastern Europe Anti Cancer Drug Market Comparison by Drug Type (2016-2032)
- Table 64: Eastern Europe Anti Cancer Drug Market Comparison by Mode of Action (2016-2032)
- Table 65: Eastern Europe Anti Cancer Drug Market Comparison by Cancer Type (2016-2032)
- Table 66: Eastern Europe Anti Cancer Drug Market Comparison by End Users (2016-2032)
- Table 67: Eastern Europe Anti Cancer Drug Market Revenue (US$ Mn) Comparison by Country (2016-2032)
- Table 68: Eastern Europe Anti Cancer Drug Market Revenue (US$ Mn) (2016-2032)
- Table 69: Eastern Europe Anti Cancer Drug Market Revenue (US$ Mn) Comparison by Country (2016-2032)
- Table 70: Eastern Europe Anti Cancer Drug Market Revenue (US$ Mn) Comparison by Drug Type (2016-2032)
- Table 71: Eastern Europe Anti Cancer Drug Market Revenue (US$ Mn) Comparison by Mode of Action (2016-2032)
- Table 72: Eastern Europe Anti Cancer Drug Market Revenue (US$ Mn) Comparison by Cancer Type (2016-2032)
- Table 73: Eastern Europe Anti Cancer Drug Market Revenue (US$ Mn) Comparison by End Users (2016-2032)
- Table 74: Eastern Europe Anti Cancer Drug Market Y-o-Y Growth Rate Comparison by Country (2016-2032)
- Table 75: Eastern Europe Anti Cancer Drug Market Y-o-Y Growth Rate Comparison by Drug Type (2016-2032)
- Table 76: Eastern Europe Anti Cancer Drug Market Y-o-Y Growth Rate Comparison by Mode of Action (2016-2032)
- Table 77: Eastern Europe Anti Cancer Drug Market Y-o-Y Growth Rate Comparison by Cancer Type (2016-2032)
- Table 78: Eastern Europe Anti Cancer Drug Market Y-o-Y Growth Rate Comparison by End Users (2016-2032)
- Table 79: Eastern Europe Anti Cancer Drug Market Share Comparison by Country (2016-2032)
- Table 80: Eastern Europe Anti Cancer Drug Market Share Comparison by Drug Type (2016-2032)
- Table 81: Eastern Europe Anti Cancer Drug Market Share Comparison by Mode of Action (2016-2032)
- Table 82: Eastern Europe Anti Cancer Drug Market Share Comparison by Cancer Type (2016-2032)
- Table 83: Eastern Europe Anti Cancer Drug Market Share Comparison by End Users (2016-2032)
- Table 84: APAC Anti Cancer Drug Market Comparison by Drug Type (2016-2032)
- Table 85: APAC Anti Cancer Drug Market Comparison by Mode of Action (2016-2032)
- Table 86: APAC Anti Cancer Drug Market Comparison by Cancer Type (2016-2032)
- Table 87: APAC Anti Cancer Drug Market Comparison by End Users (2016-2032)
- Table 88: APAC Anti Cancer Drug Market Revenue (US$ Mn) Comparison by Country (2016-2032)
- Table 89: APAC Anti Cancer Drug Market Revenue (US$ Mn) (2016-2032)
- Table 90: APAC Anti Cancer Drug Market Revenue (US$ Mn) Comparison by Country (2016-2032)
- Table 91: APAC Anti Cancer Drug Market Revenue (US$ Mn) Comparison by Drug Type (2016-2032)
- Table 92: APAC Anti Cancer Drug Market Revenue (US$ Mn) Comparison by Mode of Action (2016-2032)
- Table 93: APAC Anti Cancer Drug Market Revenue (US$ Mn) Comparison by Cancer Type (2016-2032)
- Table 94: APAC Anti Cancer Drug Market Revenue (US$ Mn) Comparison by End Users (2016-2032)
- Table 95: APAC Anti Cancer Drug Market Y-o-Y Growth Rate Comparison by Country (2016-2032)
- Table 96: APAC Anti Cancer Drug Market Y-o-Y Growth Rate Comparison by Drug Type (2016-2032)
- Table 97: APAC Anti Cancer Drug Market Y-o-Y Growth Rate Comparison by Mode of Action (2016-2032)
- Table 98: APAC Anti Cancer Drug Market Y-o-Y Growth Rate Comparison by Cancer Type (2016-2032)
- Table 99: APAC Anti Cancer Drug Market Y-o-Y Growth Rate Comparison by End Users (2016-2032)
- Table 100: APAC Anti Cancer Drug Market Share Comparison by Country (2016-2032)
- Table 101: APAC Anti Cancer Drug Market Share Comparison by Drug Type (2016-2032)
- Table 102: APAC Anti Cancer Drug Market Share Comparison by Mode of Action (2016-2032)
- Table 103: APAC Anti Cancer Drug Market Share Comparison by Cancer Type (2016-2032)
- Table 104: APAC Anti Cancer Drug Market Share Comparison by End Users (2016-2032)
- Table 105: Latin America Anti Cancer Drug Market Comparison by Drug Type (2016-2032)
- Table 106: Latin America Anti Cancer Drug Market Comparison by Mode of Action (2016-2032)
- Table 107: Latin America Anti Cancer Drug Market Comparison by Cancer Type (2016-2032)
- Table 108: Latin America Anti Cancer Drug Market Comparison by End Users (2016-2032)
- Table 109: Latin America Anti Cancer Drug Market Revenue (US$ Mn) Comparison by Country (2016-2032)
- Table 110: Latin America Anti Cancer Drug Market Revenue (US$ Mn) (2016-2032)
- Table 111: Latin America Anti Cancer Drug Market Revenue (US$ Mn) Comparison by Country (2016-2032)
- Table 112: Latin America Anti Cancer Drug Market Revenue (US$ Mn) Comparison by Drug Type (2016-2032)
- Table 113: Latin America Anti Cancer Drug Market Revenue (US$ Mn) Comparison by Mode of Action (2016-2032)
- Table 114: Latin America Anti Cancer Drug Market Revenue (US$ Mn) Comparison by Cancer Type (2016-2032)
- Table 115: Latin America Anti Cancer Drug Market Revenue (US$ Mn) Comparison by End Users (2016-2032)
- Table 116: Latin America Anti Cancer Drug Market Y-o-Y Growth Rate Comparison by Country (2016-2032)
- Table 117: Latin America Anti Cancer Drug Market Y-o-Y Growth Rate Comparison by Drug Type (2016-2032)
- Table 118: Latin America Anti Cancer Drug Market Y-o-Y Growth Rate Comparison by Mode of Action (2016-2032)
- Table 119: Latin America Anti Cancer Drug Market Y-o-Y Growth Rate Comparison by Cancer Type (2016-2032)
- Table 120: Latin America Anti Cancer Drug Market Y-o-Y Growth Rate Comparison by End Users (2016-2032)
- Table 121: Latin America Anti Cancer Drug Market Share Comparison by Country (2016-2032)
- Table 122: Latin America Anti Cancer Drug Market Share Comparison by Drug Type (2016-2032)
- Table 123: Latin America Anti Cancer Drug Market Share Comparison by Mode of Action (2016-2032)
- Table 124: Latin America Anti Cancer Drug Market Share Comparison by Cancer Type (2016-2032)
- Table 125: Latin America Anti Cancer Drug Market Share Comparison by End Users (2016-2032)
- Table 126: Middle East & Africa Anti Cancer Drug Market Comparison by Drug Type (2016-2032)
- Table 127: Middle East & Africa Anti Cancer Drug Market Comparison by Mode of Action (2016-2032)
- Table 128: Middle East & Africa Anti Cancer Drug Market Comparison by Cancer Type (2016-2032)
- Table 129: Middle East & Africa Anti Cancer Drug Market Comparison by End Users (2016-2032)
- Table 130: Middle East & Africa Anti Cancer Drug Market Revenue (US$ Mn) Comparison by Country (2016-2032)
- Table 131: Middle East & Africa Anti Cancer Drug Market Revenue (US$ Mn) (2016-2032)
- Table 132: Middle East & Africa Anti Cancer Drug Market Revenue (US$ Mn) Comparison by Country (2016-2032)
- Table 133: Middle East & Africa Anti Cancer Drug Market Revenue (US$ Mn) Comparison by Drug Type (2016-2032)
- Table 134: Middle East & Africa Anti Cancer Drug Market Revenue (US$ Mn) Comparison by Mode of Action (2016-2032)
- Table 135: Middle East & Africa Anti Cancer Drug Market Revenue (US$ Mn) Comparison by Cancer Type (2016-2032)
- Table 136: Middle East & Africa Anti Cancer Drug Market Revenue (US$ Mn) Comparison by End Users (2016-2032)
- Table 137: Middle East & Africa Anti Cancer Drug Market Y-o-Y Growth Rate Comparison by Country (2016-2032)
- Table 138: Middle East & Africa Anti Cancer Drug Market Y-o-Y Growth Rate Comparison by Drug Type (2016-2032)
- Table 139: Middle East & Africa Anti Cancer Drug Market Y-o-Y Growth Rate Comparison by Mode of Action (2016-2032)
- Table 140: Middle East & Africa Anti Cancer Drug Market Y-o-Y Growth Rate Comparison by Cancer Type (2016-2032)
- Table 141: Middle East & Africa Anti Cancer Drug Market Y-o-Y Growth Rate Comparison by End Users (2016-2032)
- Table 142: Middle East & Africa Anti Cancer Drug Market Share Comparison by Country (2016-2032)
- Table 143: Middle East & Africa Anti Cancer Drug Market Share Comparison by Drug Type (2016-2032)
- Table 144: Middle East & Africa Anti Cancer Drug Market Share Comparison by Mode of Action (2016-2032)
- Table 145: Middle East & Africa Anti Cancer Drug Market Share Comparison by Cancer Type (2016-2032)
- Table 146: Middle East & Africa Anti Cancer Drug Market Share Comparison by End Users (2016-2032)
- 1. Executive Summary
-
- Eli Lilly and Company
- Pfizer Inc.
- Novartis AG
- Bristol-Myers Squibb Company
- AbbVie Inc.
- CELGENE Corporation
- Genentech, Inc.
- Astellas Pharma Inc.
- Amgen Inc.
- Merck & Co. Inc.
- Johnson & Johnson
Our Clients


View Our Licence Options
