Global Ammonia Market By Product Form(Liquid, Gas, Powder), By Application(Agriculture & Fertilizers , Textile, Refrigerants, Pharmaceuticals, Textile, Others) , By Region And Companies - Industry Segment Outlook, Market Assessment, Competition Scenario, Trends, And Forecast 2024-2033
-
4449
-
May 2023
-
172
-


-
This report was compiled by Shreyas Rokade Shreyas Rokade is a seasoned Research Analyst with CMFE, bringing extensive expertise in market research and consulting, with a strong background in Chemical Engineering. Correspondence Team Lead-CMFE Linkedin | Detailed Market research Methodology Our methodology involves a mix of primary research, including interviews with leading mental health experts, and secondary research from reputable medical journals and databases. View Detailed Methodology Page
-
Quick Navigation
- Ammonia Market Size, Share, Trends Analysis
- Driving Factors
- Restraining Factors
- Ammonia Market Segmentation Analysis
- Ammonia Industry Segments
- Growth Opportunities
- Ammonia Market Regional Analysis
- Ammonia Industry By Region
- Ammonia Market Key Player Analysis
- Ammonia Industry Key Players
- Ammonia Market Recent Development
- Report Scope
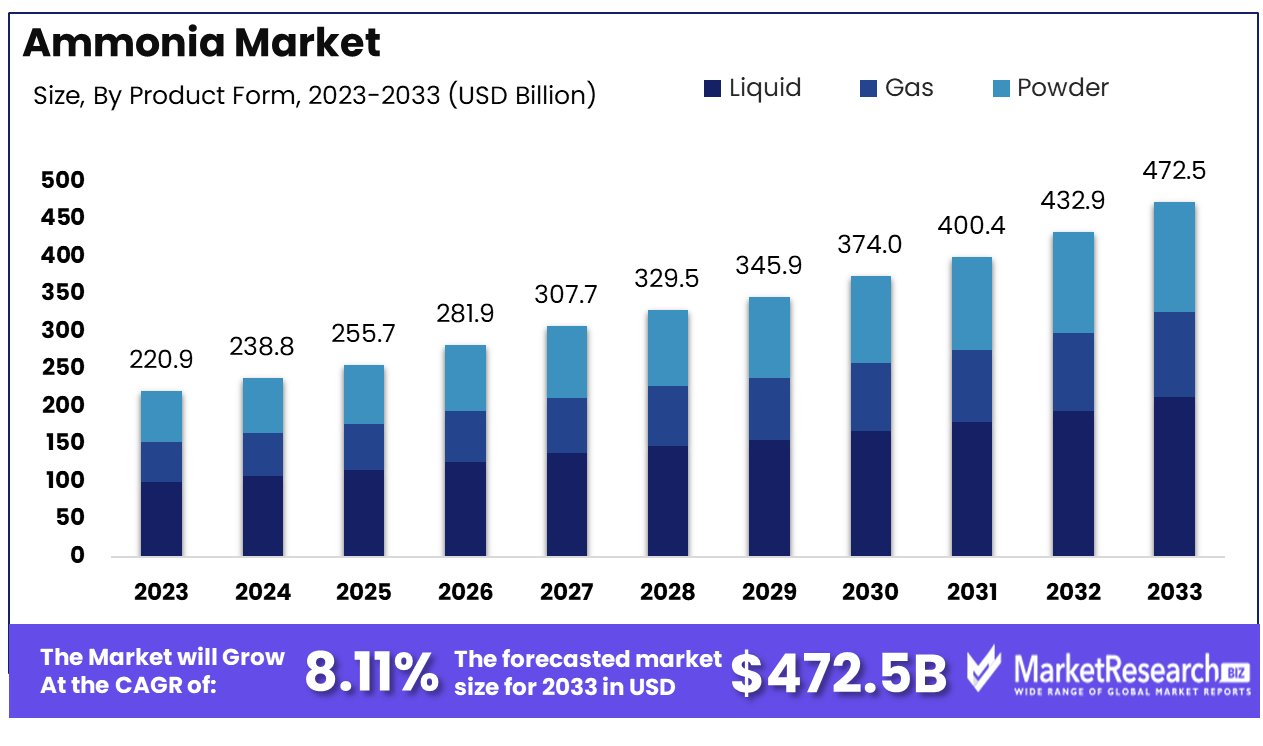
The ammonia market was valued at USD 220.93 billion in 2023. It is expected to reach USD 472.5 billion by 2033, with a CAGR of 8.11% during the forecast period from 2024 to 2033.
The surge in demand for fertilizers in agriculture and water treatment processes are some of the main driving factors for the ammonia market. Ammonia is a natural gas that acts as a chemical building block for a wide range of commercial and household products, including fertilizers and cleaning supplies. It is also used for stabilizers, neutralizers, and refrigerants, especially in food transportation and water treatment processes.
Ammonia is also used in the production of plastics, fabrics, explosives, and pharmaceuticals. More than 90% of the ammonia produced globally is used in fertilizers to provide sustainable food production for billions of individuals all around the world.
According to an article published by CBH Group in March 2023, highlights include the launch of a new Kwinana fertilizer facility center, which will substantially deliver several advantages to western Australian grain farmers. This project starts CBH’s liquid fertilizer business, and its granular fertilizer capacity is 15,000 metric tons. Additionally, this new center has the capacity to store 32,000 metric tons of urea ammonium nitrate and 55,000 metric tons of huge amounts of granular fertilizer.
According to a report published by the United States Department of Agriculture in March 2023, highlights include the announcement that the USDA department will get USD 3 billion in applications from more than 350 independent businesses from 47 states and 2 territories for the first two rounds of the new grant initiative program to augment new domestic fertilizer manufacturing capacity. It was also declared that the first USD 29 million will be provided under the first round, which aims at projects that can come online or virtual in the near term.
Ammonia is used for various purposes, such as household cleaning. It is effective in removing stains and household grime from vegetable oil or animal fats, like cooking grease and wine stains. It is also used in the industrial sector, where it helps to purify water supplies and can capture a significant amount of heat from its surroundings. These are utilized in the water and wastewater treatment, rubber, food and beverage sectors, and paper industries. This is also used in the pharmaceutical industry.
There was a huge impact on the agricultural industry that led to a boost in the fertilizer price rate during the time of the Russia-Ukraine war. Russia is one of the world's largest fertilizer exporters. Russia also accounts for 23% of the ammonia exports.
Additionally, the manufacturing of ammonia that gets collaborated with the source will help decrease the dependence on exports from one country to another while providing a cleaner and more sustainable manufacturing process. The demand for the global ammonia market will expand due to its requirements in fertilizers and industrial manufacturing, which will help in market expansion in the coming years.
Driving Factors
Fertilizer Demand Drives Ammonia Market Growth
Ammonia, a crucial nitrogen source, accounts for about 70-88% of its use in manufacturing various nitrogenous fertilizers like urea and ammonium phosphate. This surge in demand is closely tied to the growing global population and the urgent need to enhance agricultural productivity, particularly in emerging economies.
The International Energy Agency (IEA) forecasts a nearly 40% increase in ammonia demand by 2050, spurred by the agricultural sector's expansion in regions like Africa, Latin America, the Middle East, and Southeast Asia. This trend underscores ammonia's pivotal role in addressing food security challenges, thereby reinforcing its market growth.
Refrigeration Needs Spur Ammonia Demand
The ammonia market is also buoyed by its widespread use in refrigeration applications, where it's prized for its superior thermophysical properties. The expansion of the global cold chain market, essential for preserving perishable goods, is fueling the demand for ammonia as an industrial refrigerant.
Predicted to grow substantially, the cold chain market's expansion directly correlates with increased ammonia usage. This demand is set to rise further with the growth of industries reliant on effective refrigeration, positioning ammonia as a key player in the cold storage and logistics sectors.
Ammonia's Role in Low-Carbon Energy Transition
A significant driver for the ammonia market is the shift towards low-carbon energy sources. Ammonia, especially in its 'green' or 'blue' forms, is gaining traction as a sustainable energy carrier. This is due to its potential in storing and transporting hydrogen energy efficiently.
The rising emphasis on clean energy solutions positions ammonia as a critical component in the energy transition, catering to the increasing demand for eco-friendly fuel alternatives. This shift not only augments the current market growth but also sets a trajectory for sustained expansion, aligning with global environmental goals.
Restraining Factors
Safety Concerns Impede Wider Adoption of Ammonia
Safety concerns significantly restrict the growth of the ammonia market. Ammonia's toxic and hazardous nature requires substantial investment in safety measures and personnel training to ensure safe handling and storage.
Additionally, the public perception of ammonia as a high-risk substance can be a major deterrent to its adoption in new applications, such as its use as a marine fuel. This concern over safety not only affects the operational costs for companies dealing with ammonia but also influences regulatory policies and public acceptance, potentially limiting the expansion of its use in various industries.
Competition from Alternative Products Challenges Ammonia Market
Alternatives to ammonia, such as urea and natural gas, are increasingly competing as feedstocks in various applications, posing a challenge to the growth of the ammonia market. Urea, for instance, is often preferred for certain agricultural and industrial applications due to its less hazardous nature.
Furthermore, the growing innovations in electric vehicles (EVs) are reducing the demand growth for fertilizers, which traditionally constitute a significant portion of ammonia's market. As EVs become more prevalent, the reduced need for agricultural products for biofuel production could further impact the demand for ammonia-based fertilizers, challenging the market's expansion.
Ammonia Market Segmentation Analysis
By Product Form :
Liquid ammonia is the dominant product form in the ammonia market. This dominance is due to its extensive use in various industrial and agricultural applications. With a density of approximately 682.6 kg/m^3 at 0°C and atmospheric pressure, liquid ammonia is stored under pressure and is a key component in the production of fertilizers. Its high nitrogen content makes it essential for synthesizing ammonium nitrate and urea, which are widely used as nitrogenous fertilizers. In refrigeration, liquid ammonia serves as an effective coolant due to its high heat of vaporization and compatibility with various refrigeration systems.
Gaseous ammonia, while also important, has a more specialized application scope. With a density of 0.7929 kg/m^3 at 0°C and atmospheric pressure, it is used in industrial settings for pollution control by neutralizing sulfuric and nitric acid emissions. Powder form of ammonia, though less common, finds niche applications in certain industrial processes. The versatility, efficiency, and effectiveness of liquid ammonia in large-scale agricultural and industrial applications underscore its dominance in the market.
By Application
Agriculture & Fertilizers is the dominating segment in the ammonia market, holding a 41% share. Ammonia is a critical component in fertilizer production, which is essential for modern agriculture. The synthesis of ammonium nitrate, urea, and other nitrogenous fertilizers relies heavily on ammonia. These fertilizers play a crucial role in enhancing soil fertility and increasing crop yields, addressing the growing food demand of the global population.
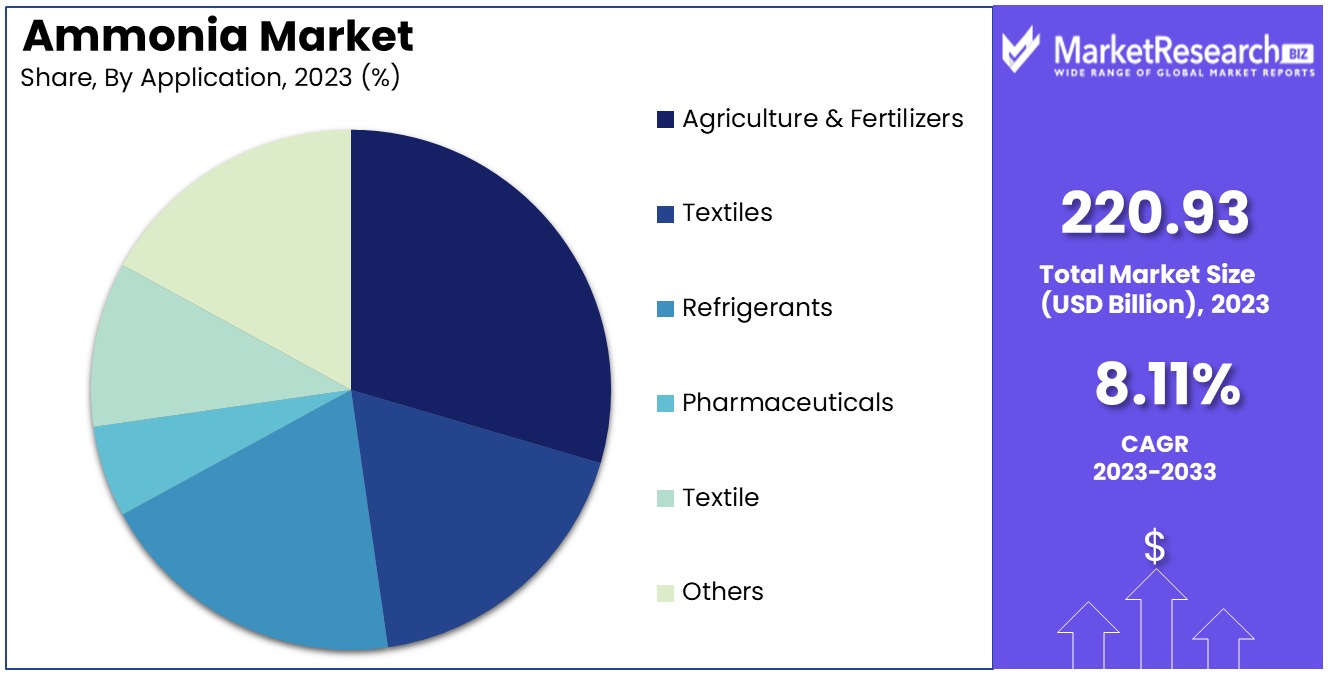
Other applications such as Textiles, Refrigerants, Pharmaceuticals, and Textile also significantly contribute to the ammonia market. In the textile industry, ammonia is used in the pretreatment of fibers and dyeing processes. As a refrigerant, ammonia's efficiency in large industrial refrigeration systems is well-recognized. In pharmaceuticals, it is used in the production of various drugs and medical products.
However, the agricultural sector's reliance on ammonia-based fertilizers for crop production and the critical role of these fertilizers in global food security make Agriculture & Fertilizers the most significant application segment in the ammonia market. The ongoing efforts to increase agricultural productivity and the continuous development of more efficient fertilizer products are expected to maintain this segment's leading position.
Ammonia Industry Segments
By Product Form
- Liquid
- Gas
- Powder
By Application
- Agriculture & Fertilizers
- Textiles
- Refrigerants
- Pharmaceuticals
- Textile
- Others
Growth Opportunities
Transition to Green Ammonia Marks a New Era in Ammonia Market Growth
The shift towards green ammonia, driven by the global move towards zero-carbon emissions, presents significant growth opportunities in the ammonia market. Green ammonia, particularly relevant for sectors like power generation and agriculture, is still in early development stages and requires substantial technological innovation and policy support for large-scale implementation.
The current ammonia production method, the Haber-Bosch process, is energy-intensive, accounting for 1-2% of global energy consumption. A more efficient process for green ammonia production is essential to meet the growing demand sustainably. As such, the development of green ammonia production methods is key to transforming the market and aligning it with global sustainability goals.
Technological Advancements Propel Bio Ammonia Market Forward
Continuous innovation in technology is driving the growth of the bio ammonia market. The conventional production of ammonia is energy-intensive and contributes to about 2% of global CO2 emissions. In response, there's a significant push towards developing bioprocessing technologies for biological ammonia production.
Companies like OCI Global, the only producer of ISCC PLUS certified bio-ammonia in Europe and the US, are leading this charge. OCI’s use of biomethane from organic waste for ammonia production results in a GHG reduction of over 70% compared to traditional methods. Such advancements are not only environmentally beneficial but also offer a competitive edge, paving the way for geographic and product expansion in the ammonia market.
Ammonia Market Regional Analysis
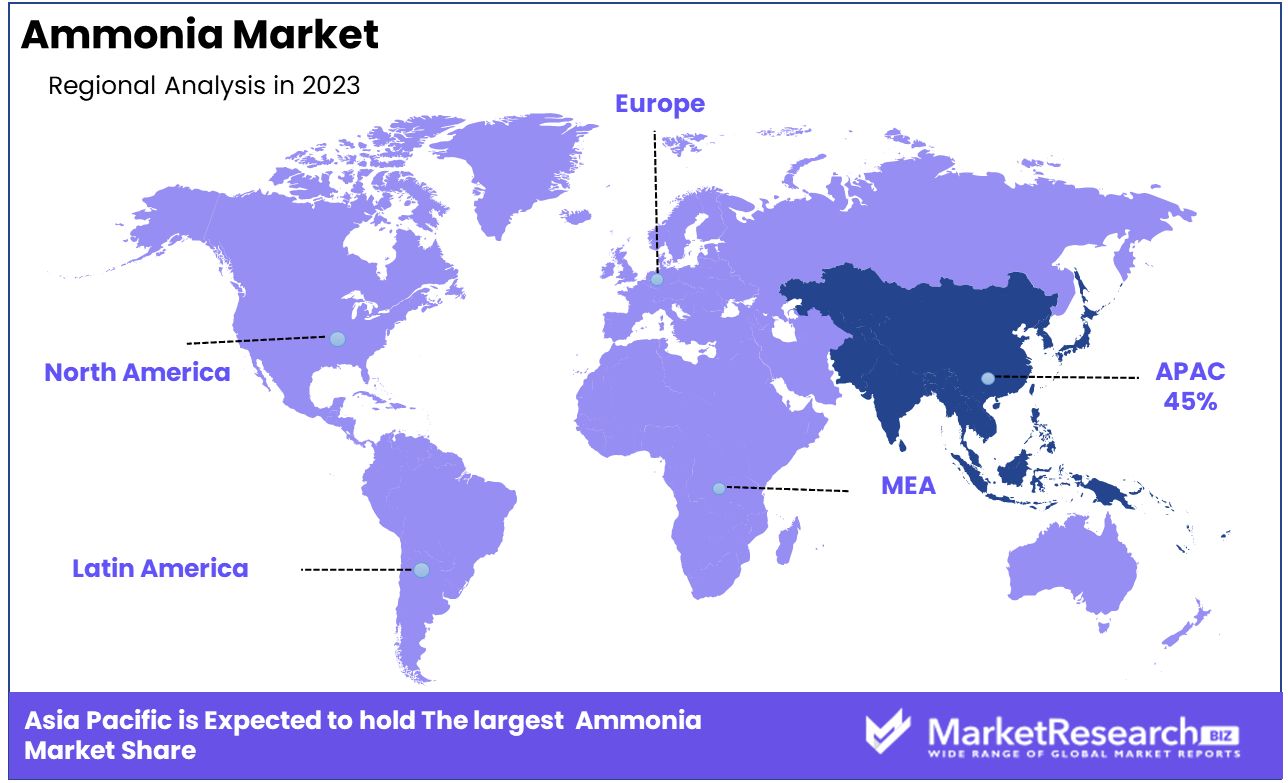
Asia-Pacific Dominates with 45% Market Share in Ammonia Market
Asia-Pacific's dominant 45% share in the global ammonia market is largely due to the region's extensive agricultural activities and the increasing demand for ammonia-based fertilizers. China, as the largest producer in the region, along with significant contributions from India, Thailand, Japan, South Korea, and Australia, drives this dominance. The growth of the ammonia market in Asia-Pacific is also propelled by the region’s expanding industrial sector, which uses ammonia in various applications, including the production of plastics, fibers, and other chemicals.
The ammonia market in Asia-Pacific is characterized by its innovative approaches to ammonia production, especially in the context of green energy. Japan and South Korea's joint initiatives in hydrogen and ammonia production, aiming to create a joint supply network, reflect the region's commitment to sustainable and alternative energy sources. The move towards green ammonia production, as seen in Japan’s aim to import 3 million tonnes of ammonia for fuel by 2030 and the MOU signed for green ammonia production opportunities in India, highlights a shift towards environmentally friendly practices. This focus on green ammonia is expected to play a pivotal role in reducing carbon emissions and promoting cleaner energy alternatives in the region.
North America: Advanced Production Technologies and High Demand
North America's ammonia market is driven by advanced production technologies and a high demand from the agricultural sector. The region, with the United States as a key player, utilizes natural gas as a primary feedstock for ammonia production, leading to cost-effective and large-scale production.
Europe: Focus on Sustainability and Innovation
Europe’s ammonia market is characterized by a strong focus on sustainability and innovation. The region is actively exploring renewable energy sources for ammonia production to reduce carbon footprint. The European Union’s environmental regulations and the growing emphasis on reducing greenhouse gas emissions are driving the development of green ammonia production technologies.
Ammonia Industry By Region
North America
- The US
- Canada
- Rest of North America
Europe
- Germany
- France
- The UK
- Spain
- Italy
- Russia
- Netherlands
- Rest of Europe
Asia-Pacific
- China
- Japan
- South Korea
- India
- New Zealand
- Singapore
- Thailand
- Vietnam
- Rest of Asia Pacific
Latin America
- Brazil
- Mexico
- Rest of Latin America
Middle East & Africa
- South Africa
- Saudi Arabia
- UAE
- Rest of Middle East & Africa
Ammonia Market Key Player Analysis
In the Ammonia Market, an essential sector for agricultural and industrial applications, the companies listed are key in driving global production and supply. CF Industries Holdings Inc., Yara, and Nutrien Ltd are industry leaders, renowned for their large-scale ammonia production capacities and global distribution networks. Their strategic positioning emphasizes operational efficiency, sustainability, and meeting the growing global demand for ammonia, particularly in fertilizers.
SABIC Agri-Nutrients Company and IFFCO stand out for their significant contributions to the agricultural sector, providing essential nutrients for crop production. Their focus on innovation and sustainability reflects the industry's commitment to supporting global food security.
Ammonia Industry Key Players
- SABIC Agri-Nutrients Company
- EuroChem
- Nutrien Ltd
- Group DF
- OCI
- IFFCO
- QATAR FERTILISER COMPANY
- Yara International ASA
- CF Industries Holdings Inc.
- LFC
- BASF SE
- Trammo
- Mitsubishi
- Koch Industries Inc.
- Mitsui
Ammonia Market Recent Development
- In June 2023, BASF SE and Yara Clean Ammonia announced their partnership for joint research to develop and establish a world-scale low-carbon blue ammonia production plant with an overall production capacity in the range of 1.2 up to 1.4 million tons per year that will also capture carbon throughout the US Gulf Coast region. By collaborating both companies will meet the ever-growing demand in the world for ammonia with low-carbon
- In May 2023, SABIC Agri-Nutrients Company and IFFCO announced a partnership to deliver 5,000 metric tonnes of low-carbon ammonia certified coming from Saudi Arabia to IFFCO for fertilizer production. This partnership will help improve the company's operations in the researched market.
Report Scope
Report Features Description Market Value (2023) USD 149.3 billion Forecast Revenue (2033) USD 273.3 billion CAGR (2024-2032) 6.4% Base Year for Estimation 2023 Historic Period 2016-2023 Forecast Period 2024-2033 Report Coverage Revenue Forecast, Market Dynamics, COVID-19 Impact, Competitive Landscape, Recent Developments Segments Covered By Product Form(Liquid, Gas, Powder), By Application(Agriculture & Fertilizers, Textiles, Refrigerants, Pharmaceuticals, Textile, Others) Regional Analysis North America - The US, Canada, Rest of North America, Europe - Germany, France, The UK, Spain, Italy, Russia, Netherlands, Rest of Europe, Asia-Pacific - China, Japan, South Korea, India, New Zealand, Singapore, Thailand, Vietnam, Rest of Asia Pacific, Latin America - Brazil, Mexico, Rest of Latin America, Middle East & Africa - South Africa, Saudi Arabia, UAE, Rest of Middle East & Africa Competitive Landscape SABIC Agri-Nutrients Company, EuroChem, Nutrien Ltd, Group DF, OCI, IFFCO, QATAR FERTILISER COMPANY, Yara International ASA, CF Industries Holdings Inc., LFC, BASF SE, Trammo, Mitsubishi, Koch Industries Inc., Mitsui Customization Scope Customization for segments, region/country-level will be provided. Moreover, additional customization can be done based on the requirements. Purchase Options We have three licenses to opt for Single User License, Multi-User License (Up to 5 Users), Corporate Use License (Unlimited User and Printable PDF) -
- 1. Executive Summary
- 1.1. Definition
- 1.2. Taxonomy
- 1.3. Research Scope
- 1.4. Key Analysis
- 1.5. Key Findings by Major Segments
- 1.6. Top strategies by Major Players
- 2. Global Ammonia Market Overview
- 2.1. Ammonia Market Dynamics
- 2.1.1. Drivers
- 2.1.2. Opportunities
- 2.1.3. Restraints
- 2.1.4. Challenges
- 2.2. Macro-economic Factors
- 2.3. Regulatory Framework
- 2.4. Market Investment Feasibility Index
- 2.5. PEST Analysis
- 2.6. PORTER’S Five Force Analysis
- 2.7. Drivers & Restraints Impact Analysis
- 2.8. Industry Chain Analysis
- 2.9. Cost Structure Analysis
- 2.10. Marketing Strategy
- 2.11. Russia-Ukraine War Impact Analysis
- 2.12. Opportunity Map Analysis
- 2.13. Market Competition Scenario Analysis
- 2.14. Product Life Cycle Analysis
- 2.15. Opportunity Orbits
- 2.16. Manufacturer Intensity Map
- 2.17. Major Companies sales by Value & Volume
- 2.1. Ammonia Market Dynamics
- 3. Global Ammonia Market Analysis, Opportunity and Forecast, 2016-2032
- 3.1. Global Ammonia Market Analysis, 2016-2021
- 3.2. Global Ammonia Market Opportunity and Forecast, 2023-2032
- 3.3. Global Ammonia Market Analysis, Opportunity and Forecast, By By Product Form, 2016-2032
- 3.3.1. Global Ammonia Market Analysis by By Product Form: Introduction
- 3.3.2. Market Size Absolute $ Opportunity Analysis and Forecast, By By Product Form, 2016-2032
- 3.3.3. Liquid
- 3.3.4. Gas
- 3.3.5. Powder
- 3.4. Global Ammonia Market Analysis, Opportunity and Forecast, By By Application, 2016-2032
- 3.4.1. Global Ammonia Market Analysis by By Application: Introduction
- 3.4.2. Market Size Absolute $ Opportunity Analysis and Forecast, By By Application, 2016-2032
- 3.4.3. Agriculture & Fertilizers
- 3.4.4. Textiles
- 3.4.5. Refrigerants
- 3.4.6. Pharmaceuticals
- 3.4.7. Textile
- 3.4.8. Others
- 4. North America Ammonia Market Analysis, Opportunity and Forecast, 2016-2032
- 4.1. North America Ammonia Market Analysis, 2016-2021
- 4.2. North America Ammonia Market Opportunity and Forecast, 2023-2032
- 4.3. North America Ammonia Market Analysis, Opportunity and Forecast, By By Product Form, 2016-2032
- 4.3.1. North America Ammonia Market Analysis by By Product Form: Introduction
- 4.3.2. Market Size Absolute $ Opportunity Analysis and Forecast, By By Product Form, 2016-2032
- 4.3.3. Liquid
- 4.3.4. Gas
- 4.3.5. Powder
- 4.4. North America Ammonia Market Analysis, Opportunity and Forecast, By By Application, 2016-2032
- 4.4.1. North America Ammonia Market Analysis by By Application: Introduction
- 4.4.2. Market Size Absolute $ Opportunity Analysis and Forecast, By By Application, 2016-2032
- 4.4.3. Agriculture & Fertilizers
- 4.4.4. Textiles
- 4.4.5. Refrigerants
- 4.4.6. Pharmaceuticals
- 4.4.7. Textile
- 4.4.8. Others
- 4.5. North America Ammonia Market Analysis, Opportunity and Forecast, By Country , 2016-2032
- 4.5.1. North America Ammonia Market Analysis by Country : Introduction
- 4.5.2. Market Size Absolute $ Opportunity Analysis and Forecast, Country , 2016-2032
- 4.5.2.1. The US
- 4.5.2.2. Canada
- 4.5.2.3. Mexico
- 5. Western Europe Ammonia Market Analysis, Opportunity and Forecast, 2016-2032
- 5.1. Western Europe Ammonia Market Analysis, 2016-2021
- 5.2. Western Europe Ammonia Market Opportunity and Forecast, 2023-2032
- 5.3. Western Europe Ammonia Market Analysis, Opportunity and Forecast, By By Product Form, 2016-2032
- 5.3.1. Western Europe Ammonia Market Analysis by By Product Form: Introduction
- 5.3.2. Market Size Absolute $ Opportunity Analysis and Forecast, By By Product Form, 2016-2032
- 5.3.3. Liquid
- 5.3.4. Gas
- 5.3.5. Powder
- 5.4. Western Europe Ammonia Market Analysis, Opportunity and Forecast, By By Application, 2016-2032
- 5.4.1. Western Europe Ammonia Market Analysis by By Application: Introduction
- 5.4.2. Market Size Absolute $ Opportunity Analysis and Forecast, By By Application, 2016-2032
- 5.4.3. Agriculture & Fertilizers
- 5.4.4. Textiles
- 5.4.5. Refrigerants
- 5.4.6. Pharmaceuticals
- 5.4.7. Textile
- 5.4.8. Others
- 5.5. Western Europe Ammonia Market Analysis, Opportunity and Forecast, By Country , 2016-2032
- 5.5.1. Western Europe Ammonia Market Analysis by Country : Introduction
- 5.5.2. Market Size Absolute $ Opportunity Analysis and Forecast, Country , 2016-2032
- 5.5.2.1. Germany
- 5.5.2.2. France
- 5.5.2.3. The UK
- 5.5.2.4. Spain
- 5.5.2.5. Italy
- 5.5.2.6. Portugal
- 5.5.2.7. Ireland
- 5.5.2.8. Austria
- 5.5.2.9. Switzerland
- 5.5.2.10. Benelux
- 5.5.2.11. Nordic
- 5.5.2.12. Rest of Western Europe
- 6. Eastern Europe Ammonia Market Analysis, Opportunity and Forecast, 2016-2032
- 6.1. Eastern Europe Ammonia Market Analysis, 2016-2021
- 6.2. Eastern Europe Ammonia Market Opportunity and Forecast, 2023-2032
- 6.3. Eastern Europe Ammonia Market Analysis, Opportunity and Forecast, By By Product Form, 2016-2032
- 6.3.1. Eastern Europe Ammonia Market Analysis by By Product Form: Introduction
- 6.3.2. Market Size Absolute $ Opportunity Analysis and Forecast, By By Product Form, 2016-2032
- 6.3.3. Liquid
- 6.3.4. Gas
- 6.3.5. Powder
- 6.4. Eastern Europe Ammonia Market Analysis, Opportunity and Forecast, By By Application, 2016-2032
- 6.4.1. Eastern Europe Ammonia Market Analysis by By Application: Introduction
- 6.4.2. Market Size Absolute $ Opportunity Analysis and Forecast, By By Application, 2016-2032
- 6.4.3. Agriculture & Fertilizers
- 6.4.4. Textiles
- 6.4.5. Refrigerants
- 6.4.6. Pharmaceuticals
- 6.4.7. Textile
- 6.4.8. Others
- 6.5. Eastern Europe Ammonia Market Analysis, Opportunity and Forecast, By Country , 2016-2032
- 6.5.1. Eastern Europe Ammonia Market Analysis by Country : Introduction
- 6.5.2. Market Size Absolute $ Opportunity Analysis and Forecast, Country , 2016-2032
- 6.5.2.1. Russia
- 6.5.2.2. Poland
- 6.5.2.3. The Czech Republic
- 6.5.2.4. Greece
- 6.5.2.5. Rest of Eastern Europe
- 7. APAC Ammonia Market Analysis, Opportunity and Forecast, 2016-2032
- 7.1. APAC Ammonia Market Analysis, 2016-2021
- 7.2. APAC Ammonia Market Opportunity and Forecast, 2023-2032
- 7.3. APAC Ammonia Market Analysis, Opportunity and Forecast, By By Product Form, 2016-2032
- 7.3.1. APAC Ammonia Market Analysis by By Product Form: Introduction
- 7.3.2. Market Size Absolute $ Opportunity Analysis and Forecast, By By Product Form, 2016-2032
- 7.3.3. Liquid
- 7.3.4. Gas
- 7.3.5. Powder
- 7.4. APAC Ammonia Market Analysis, Opportunity and Forecast, By By Application, 2016-2032
- 7.4.1. APAC Ammonia Market Analysis by By Application: Introduction
- 7.4.2. Market Size Absolute $ Opportunity Analysis and Forecast, By By Application, 2016-2032
- 7.4.3. Agriculture & Fertilizers
- 7.4.4. Textiles
- 7.4.5. Refrigerants
- 7.4.6. Pharmaceuticals
- 7.4.7. Textile
- 7.4.8. Others
- 7.5. APAC Ammonia Market Analysis, Opportunity and Forecast, By Country , 2016-2032
- 7.5.1. APAC Ammonia Market Analysis by Country : Introduction
- 7.5.2. Market Size Absolute $ Opportunity Analysis and Forecast, Country , 2016-2032
- 7.5.2.1. China
- 7.5.2.2. Japan
- 7.5.2.3. South Korea
- 7.5.2.4. India
- 7.5.2.5. Australia & New Zeland
- 7.5.2.6. Indonesia
- 7.5.2.7. Malaysia
- 7.5.2.8. Philippines
- 7.5.2.9. Singapore
- 7.5.2.10. Thailand
- 7.5.2.11. Vietnam
- 7.5.2.12. Rest of APAC
- 8. Latin America Ammonia Market Analysis, Opportunity and Forecast, 2016-2032
- 8.1. Latin America Ammonia Market Analysis, 2016-2021
- 8.2. Latin America Ammonia Market Opportunity and Forecast, 2023-2032
- 8.3. Latin America Ammonia Market Analysis, Opportunity and Forecast, By By Product Form, 2016-2032
- 8.3.1. Latin America Ammonia Market Analysis by By Product Form: Introduction
- 8.3.2. Market Size Absolute $ Opportunity Analysis and Forecast, By By Product Form, 2016-2032
- 8.3.3. Liquid
- 8.3.4. Gas
- 8.3.5. Powder
- 8.4. Latin America Ammonia Market Analysis, Opportunity and Forecast, By By Application, 2016-2032
- 8.4.1. Latin America Ammonia Market Analysis by By Application: Introduction
- 8.4.2. Market Size Absolute $ Opportunity Analysis and Forecast, By By Application, 2016-2032
- 8.4.3. Agriculture & Fertilizers
- 8.4.4. Textiles
- 8.4.5. Refrigerants
- 8.4.6. Pharmaceuticals
- 8.4.7. Textile
- 8.4.8. Others
- 8.5. Latin America Ammonia Market Analysis, Opportunity and Forecast, By Country , 2016-2032
- 8.5.1. Latin America Ammonia Market Analysis by Country : Introduction
- 8.5.2. Market Size Absolute $ Opportunity Analysis and Forecast, Country , 2016-2032
- 8.5.2.1. Brazil
- 8.5.2.2. Colombia
- 8.5.2.3. Chile
- 8.5.2.4. Argentina
- 8.5.2.5. Costa Rica
- 8.5.2.6. Rest of Latin America
- 9. Middle East & Africa Ammonia Market Analysis, Opportunity and Forecast, 2016-2032
- 9.1. Middle East & Africa Ammonia Market Analysis, 2016-2021
- 9.2. Middle East & Africa Ammonia Market Opportunity and Forecast, 2023-2032
- 9.3. Middle East & Africa Ammonia Market Analysis, Opportunity and Forecast, By By Product Form, 2016-2032
- 9.3.1. Middle East & Africa Ammonia Market Analysis by By Product Form: Introduction
- 9.3.2. Market Size Absolute $ Opportunity Analysis and Forecast, By By Product Form, 2016-2032
- 9.3.3. Liquid
- 9.3.4. Gas
- 9.3.5. Powder
- 9.4. Middle East & Africa Ammonia Market Analysis, Opportunity and Forecast, By By Application, 2016-2032
- 9.4.1. Middle East & Africa Ammonia Market Analysis by By Application: Introduction
- 9.4.2. Market Size Absolute $ Opportunity Analysis and Forecast, By By Application, 2016-2032
- 9.4.3. Agriculture & Fertilizers
- 9.4.4. Textiles
- 9.4.5. Refrigerants
- 9.4.6. Pharmaceuticals
- 9.4.7. Textile
- 9.4.8. Others
- 9.5. Middle East & Africa Ammonia Market Analysis, Opportunity and Forecast, By Country , 2016-2032
- 9.5.1. Middle East & Africa Ammonia Market Analysis by Country : Introduction
- 9.5.2. Market Size Absolute $ Opportunity Analysis and Forecast, Country , 2016-2032
- 9.5.2.1. Algeria
- 9.5.2.2. Egypt
- 9.5.2.3. Israel
- 9.5.2.4. Kuwait
- 9.5.2.5. Nigeria
- 9.5.2.6. Saudi Arabia
- 9.5.2.7. South Africa
- 9.5.2.8. Turkey
- 9.5.2.9. The UAE
- 9.5.2.10. Rest of MEA
- 10. Global Ammonia Market Analysis, Opportunity and Forecast, By Region , 2016-2032
- 10.1. Global Ammonia Market Analysis by Region : Introduction
- 10.2. Market Size Absolute $ Opportunity Analysis and Forecast, By Region , 2016-2032
- 10.2.1. North America
- 10.2.2. Western Europe
- 10.2.3. Eastern Europe
- 10.2.4. APAC
- 10.2.5. Latin America
- 10.2.6. Middle East & Africa
- 11. Global Ammonia Market Competitive Landscape, Market Share Analysis, and Company Profiles
- 11.1. Market Share Analysis
- 11.2. Company Profiles
- 11.3. SABIC Agri-Nutrients Company
- 11.3.1. Company Overview
- 11.3.2. Financial Highlights
- 11.3.3. Product Portfolio
- 11.3.4. SWOT Analysis
- 11.3.5. Key Strategies and Developments
- 11.4. EuroChem
- 11.4.1. Company Overview
- 11.4.2. Financial Highlights
- 11.4.3. Product Portfolio
- 11.4.4. SWOT Analysis
- 11.4.5. Key Strategies and Developments
- 11.5. Nutrien Ltd
- 11.5.1. Company Overview
- 11.5.2. Financial Highlights
- 11.5.3. Product Portfolio
- 11.5.4. SWOT Analysis
- 11.5.5. Key Strategies and Developments
- 11.6. Group DF
- 11.6.1. Company Overview
- 11.6.2. Financial Highlights
- 11.6.3. Product Portfolio
- 11.6.4. SWOT Analysis
- 11.6.5. Key Strategies and Developments
- 11.7. OCI
- 11.7.1. Company Overview
- 11.7.2. Financial Highlights
- 11.7.3. Product Portfolio
- 11.7.4. SWOT Analysis
- 11.7.5. Key Strategies and Developments
- 11.8. IFFCO
- 11.8.1. Company Overview
- 11.8.2. Financial Highlights
- 11.8.3. Product Portfolio
- 11.8.4. SWOT Analysis
- 11.8.5. Key Strategies and Developments
- 11.9. QATAR FERTILISER COMPANY
- 11.9.1. Company Overview
- 11.9.2. Financial Highlights
- 11.9.3. Product Portfolio
- 11.9.4. SWOT Analysis
- 11.9.5. Key Strategies and Developments
- 11.10. Yara
- 11.10.1. Company Overview
- 11.10.2. Financial Highlights
- 11.10.3. Product Portfolio
- 11.10.4. SWOT Analysis
- 11.10.5. Key Strategies and Developments
- 11.11. CF Industries Holdings Inc.
- 11.11.1. Company Overview
- 11.11.2. Financial Highlights
- 11.11.3. Product Portfolio
- 11.11.4. SWOT Analysis
- 11.11.5. Key Strategies and Developments
- 11.12. LFC
- 11.12.1. Company Overview
- 11.12.2. Financial Highlights
- 11.12.3. Product Portfolio
- 11.12.4. SWOT Analysis
- 11.12.5. Key Strategies and Developments
- 11.13.1. Company Overview
- 11.13.2. Financial Highlights
- 11.13.3. Product Portfolio
- 11.13.4. SWOT Analysis
- 11.13.5. Key Strategies and Developments
- 11.14. BASF SE
- 11.14.1. Company Overview
- 11.14.2. Financial Highlights
- 11.14.3. Product Portfolio
- 11.14.4. SWOT Analysis
- 11.14.5. Key Strategies and Developments
- 11.15. Mitsubishi
- 11.15.1. Company Overview
- 11.15.2. Financial Highlights
- 11.15.3. Product Portfolio
- 11.15.4. SWOT Analysis
- 11.15.5. Key Strategies and Developments
- 11.16. Koch Industries Inc.
- 11.16.1. Company Overview
- 11.16.2. Financial Highlights
- 11.16.3. Product Portfolio
- 11.16.4. SWOT Analysis
- 11.16.5. Key Strategies and Developments
- 11.17. Mitsui
- 11.17.1. Company Overview
- 11.17.2. Financial Highlights
- 11.17.3. Product Portfolio
- 11.17.4. SWOT Analysis
- 11.17.5. Key Strategies and Developments
- 12. Assumptions and Acronyms
- 13. Research Methodology
- 14. Contact
- List of Figures
- Figure 1: Global Ammonia Market Revenue (US$ Mn) Market Share by By Product Form in 2022
- Figure 2: Global Ammonia Market Market Attractiveness Analysis by By Product Form, 2016-2032
- Figure 3: Global Ammonia Market Revenue (US$ Mn) Market Share by By Applicationin 2022
- Figure 4: Global Ammonia Market Market Attractiveness Analysis by By Application, 2016-2032
- Figure 5: Global Ammonia Market Revenue (US$ Mn) Market Share by Region in 2022
- Figure 6: Global Ammonia Market Market Attractiveness Analysis by Region, 2016-2032
- Figure 7: Global Ammonia Market Market Revenue (US$ Mn) (2016-2032)
- Figure 8: Global Ammonia Market Market Revenue (US$ Mn) Comparison by Region (2016-2032)
- Figure 9: Global Ammonia Market Market Revenue (US$ Mn) Comparison by By Product Form (2016-2032)
- Figure 10: Global Ammonia Market Market Revenue (US$ Mn) Comparison by By Application (2016-2032)
- Figure 11: Global Ammonia Market Market Y-o-Y Growth Rate Comparison by Region (2016-2032)
- Figure 12: Global Ammonia Market Market Y-o-Y Growth Rate Comparison by By Product Form (2016-2032)
- Figure 13: Global Ammonia Market Market Y-o-Y Growth Rate Comparison by By Application (2016-2032)
- Figure 14: Global Ammonia Market Market Share Comparison by Region (2016-2032)
- Figure 15: Global Ammonia Market Market Share Comparison by By Product Form (2016-2032)
- Figure 16: Global Ammonia Market Market Share Comparison by By Application (2016-2032)
- Figure 17: North America Ammonia Market Revenue (US$ Mn) Market Share by By Product Formin 2022
- Figure 18: North America Ammonia Market Market Attractiveness Analysis by By Product Form, 2016-2032
- Figure 19: North America Ammonia Market Revenue (US$ Mn) Market Share by By Applicationin 2022
- Figure 20: North America Ammonia Market Market Attractiveness Analysis by By Application, 2016-2032
- Figure 21: North America Ammonia Market Revenue (US$ Mn) Market Share by Country in 2022
- Figure 22: North America Ammonia Market Market Attractiveness Analysis by Country, 2016-2032
- Figure 23: North America Ammonia Market Market Revenue (US$ Mn) (2016-2032)
- Figure 24: North America Ammonia Market Market Revenue (US$ Mn) Comparison by Country (2016-2032)
- Figure 25: North America Ammonia Market Market Revenue (US$ Mn) Comparison by By Product Form (2016-2032)
- Figure 26: North America Ammonia Market Market Revenue (US$ Mn) Comparison by By Application (2016-2032)
- Figure 27: North America Ammonia Market Market Y-o-Y Growth Rate Comparison by Country (2016-2032)
- Figure 28: North America Ammonia Market Market Y-o-Y Growth Rate Comparison by By Product Form (2016-2032)
- Figure 29: North America Ammonia Market Market Y-o-Y Growth Rate Comparison by By Application (2016-2032)
- Figure 30: North America Ammonia Market Market Share Comparison by Country (2016-2032)
- Figure 31: North America Ammonia Market Market Share Comparison by By Product Form (2016-2032)
- Figure 32: North America Ammonia Market Market Share Comparison by By Application (2016-2032)
- Figure 33: Western Europe Ammonia Market Revenue (US$ Mn) Market Share by By Product Formin 2022
- Figure 34: Western Europe Ammonia Market Market Attractiveness Analysis by By Product Form, 2016-2032
- Figure 35: Western Europe Ammonia Market Revenue (US$ Mn) Market Share by By Applicationin 2022
- Figure 36: Western Europe Ammonia Market Market Attractiveness Analysis by By Application, 2016-2032
- Figure 37: Western Europe Ammonia Market Revenue (US$ Mn) Market Share by Country in 2022
- Figure 38: Western Europe Ammonia Market Market Attractiveness Analysis by Country, 2016-2032
- Figure 39: Western Europe Ammonia Market Market Revenue (US$ Mn) (2016-2032)
- Figure 40: Western Europe Ammonia Market Market Revenue (US$ Mn) Comparison by Country (2016-2032)
- Figure 41: Western Europe Ammonia Market Market Revenue (US$ Mn) Comparison by By Product Form (2016-2032)
- Figure 42: Western Europe Ammonia Market Market Revenue (US$ Mn) Comparison by By Application (2016-2032)
- Figure 43: Western Europe Ammonia Market Market Y-o-Y Growth Rate Comparison by Country (2016-2032)
- Figure 44: Western Europe Ammonia Market Market Y-o-Y Growth Rate Comparison by By Product Form (2016-2032)
- Figure 45: Western Europe Ammonia Market Market Y-o-Y Growth Rate Comparison by By Application (2016-2032)
- Figure 46: Western Europe Ammonia Market Market Share Comparison by Country (2016-2032)
- Figure 47: Western Europe Ammonia Market Market Share Comparison by By Product Form (2016-2032)
- Figure 48: Western Europe Ammonia Market Market Share Comparison by By Application (2016-2032)
- Figure 49: Eastern Europe Ammonia Market Revenue (US$ Mn) Market Share by By Product Formin 2022
- Figure 50: Eastern Europe Ammonia Market Market Attractiveness Analysis by By Product Form, 2016-2032
- Figure 51: Eastern Europe Ammonia Market Revenue (US$ Mn) Market Share by By Applicationin 2022
- Figure 52: Eastern Europe Ammonia Market Market Attractiveness Analysis by By Application, 2016-2032
- Figure 53: Eastern Europe Ammonia Market Revenue (US$ Mn) Market Share by Country in 2022
- Figure 54: Eastern Europe Ammonia Market Market Attractiveness Analysis by Country, 2016-2032
- Figure 55: Eastern Europe Ammonia Market Market Revenue (US$ Mn) (2016-2032)
- Figure 56: Eastern Europe Ammonia Market Market Revenue (US$ Mn) Comparison by Country (2016-2032)
- Figure 57: Eastern Europe Ammonia Market Market Revenue (US$ Mn) Comparison by By Product Form (2016-2032)
- Figure 58: Eastern Europe Ammonia Market Market Revenue (US$ Mn) Comparison by By Application (2016-2032)
- Figure 59: Eastern Europe Ammonia Market Market Y-o-Y Growth Rate Comparison by Country (2016-2032)
- Figure 60: Eastern Europe Ammonia Market Market Y-o-Y Growth Rate Comparison by By Product Form (2016-2032)
- Figure 61: Eastern Europe Ammonia Market Market Y-o-Y Growth Rate Comparison by By Application (2016-2032)
- Figure 62: Eastern Europe Ammonia Market Market Share Comparison by Country (2016-2032)
- Figure 63: Eastern Europe Ammonia Market Market Share Comparison by By Product Form (2016-2032)
- Figure 64: Eastern Europe Ammonia Market Market Share Comparison by By Application (2016-2032)
- Figure 65: APAC Ammonia Market Revenue (US$ Mn) Market Share by By Product Formin 2022
- Figure 66: APAC Ammonia Market Market Attractiveness Analysis by By Product Form, 2016-2032
- Figure 67: APAC Ammonia Market Revenue (US$ Mn) Market Share by By Applicationin 2022
- Figure 68: APAC Ammonia Market Market Attractiveness Analysis by By Application, 2016-2032
- Figure 69: APAC Ammonia Market Revenue (US$ Mn) Market Share by Country in 2022
- Figure 70: APAC Ammonia Market Market Attractiveness Analysis by Country, 2016-2032
- Figure 71: APAC Ammonia Market Market Revenue (US$ Mn) (2016-2032)
- Figure 72: APAC Ammonia Market Market Revenue (US$ Mn) Comparison by Country (2016-2032)
- Figure 73: APAC Ammonia Market Market Revenue (US$ Mn) Comparison by By Product Form (2016-2032)
- Figure 74: APAC Ammonia Market Market Revenue (US$ Mn) Comparison by By Application (2016-2032)
- Figure 75: APAC Ammonia Market Market Y-o-Y Growth Rate Comparison by Country (2016-2032)
- Figure 76: APAC Ammonia Market Market Y-o-Y Growth Rate Comparison by By Product Form (2016-2032)
- Figure 77: APAC Ammonia Market Market Y-o-Y Growth Rate Comparison by By Application (2016-2032)
- Figure 78: APAC Ammonia Market Market Share Comparison by Country (2016-2032)
- Figure 79: APAC Ammonia Market Market Share Comparison by By Product Form (2016-2032)
- Figure 80: APAC Ammonia Market Market Share Comparison by By Application (2016-2032)
- Figure 81: Latin America Ammonia Market Revenue (US$ Mn) Market Share by By Product Formin 2022
- Figure 82: Latin America Ammonia Market Market Attractiveness Analysis by By Product Form, 2016-2032
- Figure 83: Latin America Ammonia Market Revenue (US$ Mn) Market Share by By Applicationin 2022
- Figure 84: Latin America Ammonia Market Market Attractiveness Analysis by By Application, 2016-2032
- Figure 85: Latin America Ammonia Market Revenue (US$ Mn) Market Share by Country in 2022
- Figure 86: Latin America Ammonia Market Market Attractiveness Analysis by Country, 2016-2032
- Figure 87: Latin America Ammonia Market Market Revenue (US$ Mn) (2016-2032)
- Figure 88: Latin America Ammonia Market Market Revenue (US$ Mn) Comparison by Country (2016-2032)
- Figure 89: Latin America Ammonia Market Market Revenue (US$ Mn) Comparison by By Product Form (2016-2032)
- Figure 90: Latin America Ammonia Market Market Revenue (US$ Mn) Comparison by By Application (2016-2032)
- Figure 91: Latin America Ammonia Market Market Y-o-Y Growth Rate Comparison by Country (2016-2032)
- Figure 92: Latin America Ammonia Market Market Y-o-Y Growth Rate Comparison by By Product Form (2016-2032)
- Figure 93: Latin America Ammonia Market Market Y-o-Y Growth Rate Comparison by By Application (2016-2032)
- Figure 94: Latin America Ammonia Market Market Share Comparison by Country (2016-2032)
- Figure 95: Latin America Ammonia Market Market Share Comparison by By Product Form (2016-2032)
- Figure 96: Latin America Ammonia Market Market Share Comparison by By Application (2016-2032)
- Figure 97: Middle East & Africa Ammonia Market Revenue (US$ Mn) Market Share by By Product Formin 2022
- Figure 98: Middle East & Africa Ammonia Market Market Attractiveness Analysis by By Product Form, 2016-2032
- Figure 99: Middle East & Africa Ammonia Market Revenue (US$ Mn) Market Share by By Applicationin 2022
- Figure 100: Middle East & Africa Ammonia Market Market Attractiveness Analysis by By Application, 2016-2032
- Figure 101: Middle East & Africa Ammonia Market Revenue (US$ Mn) Market Share by Country in 2022
- Figure 102: Middle East & Africa Ammonia Market Market Attractiveness Analysis by Country, 2016-2032
- Figure 103: Middle East & Africa Ammonia Market Market Revenue (US$ Mn) (2016-2032)
- Figure 104: Middle East & Africa Ammonia Market Market Revenue (US$ Mn) Comparison by Country (2016-2032)
- Figure 105: Middle East & Africa Ammonia Market Market Revenue (US$ Mn) Comparison by By Product Form (2016-2032)
- Figure 106: Middle East & Africa Ammonia Market Market Revenue (US$ Mn) Comparison by By Application (2016-2032)
- Figure 107: Middle East & Africa Ammonia Market Market Y-o-Y Growth Rate Comparison by Country (2016-2032)
- Figure 108: Middle East & Africa Ammonia Market Market Y-o-Y Growth Rate Comparison by By Product Form (2016-2032)
- Figure 109: Middle East & Africa Ammonia Market Market Y-o-Y Growth Rate Comparison by By Application (2016-2032)
- Figure 110: Middle East & Africa Ammonia Market Market Share Comparison by Country (2016-2032)
- Figure 111: Middle East & Africa Ammonia Market Market Share Comparison by By Product Form (2016-2032)
- Figure 112: Middle East & Africa Ammonia Market Market Share Comparison by By Application (2016-2032)
- List of Tables
- Table 1: Global Ammonia Market Market Comparison by By Product Form (2016-2032)
- Table 2: Global Ammonia Market Market Comparison by By Application (2016-2032)
- Table 3: Global Ammonia Market Revenue (US$ Mn) Comparison by Region (2016-2032)
- Table 4: Global Ammonia Market Market Revenue (US$ Mn) (2016-2032)
- Table 5: Global Ammonia Market Market Revenue (US$ Mn) Comparison by Region (2016-2032)
- Table 6: Global Ammonia Market Market Revenue (US$ Mn) Comparison by By Product Form (2016-2032)
- Table 7: Global Ammonia Market Market Revenue (US$ Mn) Comparison by By Application (2016-2032)
- Table 8: Global Ammonia Market Market Y-o-Y Growth Rate Comparison by Region (2016-2032)
- Table 9: Global Ammonia Market Market Y-o-Y Growth Rate Comparison by By Product Form (2016-2032)
- Table 10: Global Ammonia Market Market Y-o-Y Growth Rate Comparison by By Application (2016-2032)
- Table 11: Global Ammonia Market Market Share Comparison by Region (2016-2032)
- Table 12: Global Ammonia Market Market Share Comparison by By Product Form (2016-2032)
- Table 13: Global Ammonia Market Market Share Comparison by By Application (2016-2032)
- Table 14: North America Ammonia Market Market Comparison by By Application (2016-2032)
- Table 15: North America Ammonia Market Revenue (US$ Mn) Comparison by Country (2016-2032)
- Table 16: North America Ammonia Market Market Revenue (US$ Mn) (2016-2032)
- Table 17: North America Ammonia Market Market Revenue (US$ Mn) Comparison by Country (2016-2032)
- Table 18: North America Ammonia Market Market Revenue (US$ Mn) Comparison by By Product Form (2016-2032)
- Table 19: North America Ammonia Market Market Revenue (US$ Mn) Comparison by By Application (2016-2032)
- Table 20: North America Ammonia Market Market Y-o-Y Growth Rate Comparison by Country (2016-2032)
- Table 21: North America Ammonia Market Market Y-o-Y Growth Rate Comparison by By Product Form (2016-2032)
- Table 22: North America Ammonia Market Market Y-o-Y Growth Rate Comparison by By Application (2016-2032)
- Table 23: North America Ammonia Market Market Share Comparison by Country (2016-2032)
- Table 24: North America Ammonia Market Market Share Comparison by By Product Form (2016-2032)
- Table 25: North America Ammonia Market Market Share Comparison by By Application (2016-2032)
- Table 26: Western Europe Ammonia Market Market Comparison by By Product Form (2016-2032)
- Table 27: Western Europe Ammonia Market Market Comparison by By Application (2016-2032)
- Table 28: Western Europe Ammonia Market Revenue (US$ Mn) Comparison by Country (2016-2032)
- Table 29: Western Europe Ammonia Market Market Revenue (US$ Mn) (2016-2032)
- Table 30: Western Europe Ammonia Market Market Revenue (US$ Mn) Comparison by Country (2016-2032)
- Table 31: Western Europe Ammonia Market Market Revenue (US$ Mn) Comparison by By Product Form (2016-2032)
- Table 32: Western Europe Ammonia Market Market Revenue (US$ Mn) Comparison by By Application (2016-2032)
- Table 33: Western Europe Ammonia Market Market Y-o-Y Growth Rate Comparison by Country (2016-2032)
- Table 34: Western Europe Ammonia Market Market Y-o-Y Growth Rate Comparison by By Product Form (2016-2032)
- Table 35: Western Europe Ammonia Market Market Y-o-Y Growth Rate Comparison by By Application (2016-2032)
- Table 36: Western Europe Ammonia Market Market Share Comparison by Country (2016-2032)
- Table 37: Western Europe Ammonia Market Market Share Comparison by By Product Form (2016-2032)
- Table 38: Western Europe Ammonia Market Market Share Comparison by By Application (2016-2032)
- Table 39: Eastern Europe Ammonia Market Market Comparison by By Product Form (2016-2032)
- Table 40: Eastern Europe Ammonia Market Market Comparison by By Application (2016-2032)
- Table 41: Eastern Europe Ammonia Market Revenue (US$ Mn) Comparison by Country (2016-2032)
- Table 42: Eastern Europe Ammonia Market Market Revenue (US$ Mn) (2016-2032)
- Table 43: Eastern Europe Ammonia Market Market Revenue (US$ Mn) Comparison by Country (2016-2032)
- Table 44: Eastern Europe Ammonia Market Market Revenue (US$ Mn) Comparison by By Product Form (2016-2032)
- Table 45: Eastern Europe Ammonia Market Market Revenue (US$ Mn) Comparison by By Application (2016-2032)
- Table 46: Eastern Europe Ammonia Market Market Y-o-Y Growth Rate Comparison by Country (2016-2032)
- Table 47: Eastern Europe Ammonia Market Market Y-o-Y Growth Rate Comparison by By Product Form (2016-2032)
- Table 48: Eastern Europe Ammonia Market Market Y-o-Y Growth Rate Comparison by By Application (2016-2032)
- Table 49: Eastern Europe Ammonia Market Market Share Comparison by Country (2016-2032)
- Table 50: Eastern Europe Ammonia Market Market Share Comparison by By Product Form (2016-2032)
- Table 51: Eastern Europe Ammonia Market Market Share Comparison by By Application (2016-2032)
- Table 52: APAC Ammonia Market Market Comparison by By Product Form (2016-2032)
- Table 53: APAC Ammonia Market Market Comparison by By Application (2016-2032)
- Table 54: APAC Ammonia Market Revenue (US$ Mn) Comparison by Country (2016-2032)
- Table 55: APAC Ammonia Market Market Revenue (US$ Mn) (2016-2032)
- Table 56: APAC Ammonia Market Market Revenue (US$ Mn) Comparison by Country (2016-2032)
- Table 57: APAC Ammonia Market Market Revenue (US$ Mn) Comparison by By Product Form (2016-2032)
- Table 58: APAC Ammonia Market Market Revenue (US$ Mn) Comparison by By Application (2016-2032)
- Table 59: APAC Ammonia Market Market Y-o-Y Growth Rate Comparison by Country (2016-2032)
- Table 60: APAC Ammonia Market Market Y-o-Y Growth Rate Comparison by By Product Form (2016-2032)
- Table 61: APAC Ammonia Market Market Y-o-Y Growth Rate Comparison by By Application (2016-2032)
- Table 62: APAC Ammonia Market Market Share Comparison by Country (2016-2032)
- Table 63: APAC Ammonia Market Market Share Comparison by By Product Form (2016-2032)
- Table 64: APAC Ammonia Market Market Share Comparison by By Application (2016-2032)
- Table 65: Latin America Ammonia Market Market Comparison by By Product Form (2016-2032)
- Table 66: Latin America Ammonia Market Market Comparison by By Application (2016-2032)
- Table 67: Latin America Ammonia Market Revenue (US$ Mn) Comparison by Country (2016-2032)
- Table 68: Latin America Ammonia Market Market Revenue (US$ Mn) (2016-2032)
- Table 69: Latin America Ammonia Market Market Revenue (US$ Mn) Comparison by Country (2016-2032)
- Table 70: Latin America Ammonia Market Market Revenue (US$ Mn) Comparison by By Product Form (2016-2032)
- Table 71: Latin America Ammonia Market Market Revenue (US$ Mn) Comparison by By Application (2016-2032)
- Table 72: Latin America Ammonia Market Market Y-o-Y Growth Rate Comparison by Country (2016-2032)
- Table 73: Latin America Ammonia Market Market Y-o-Y Growth Rate Comparison by By Product Form (2016-2032)
- Table 74: Latin America Ammonia Market Market Y-o-Y Growth Rate Comparison by By Application (2016-2032)
- Table 75: Latin America Ammonia Market Market Share Comparison by Country (2016-2032)
- Table 76: Latin America Ammonia Market Market Share Comparison by By Product Form (2016-2032)
- Table 77: Latin America Ammonia Market Market Share Comparison by By Application (2016-2032)
- Table 78: Middle East & Africa Ammonia Market Market Comparison by By Product Form (2016-2032)
- Table 79: Middle East & Africa Ammonia Market Market Comparison by By Application (2016-2032)
- Table 80: Middle East & Africa Ammonia Market Revenue (US$ Mn) Comparison by Country (2016-2032)
- Table 81: Middle East & Africa Ammonia Market Market Revenue (US$ Mn) (2016-2032)
- Table 82: Middle East & Africa Ammonia Market Market Revenue (US$ Mn) Comparison by Country (2016-2032)
- Table 83: Middle East & Africa Ammonia Market Market Revenue (US$ Mn) Comparison by By Product Form (2016-2032)
- Table 84: Middle East & Africa Ammonia Market Market Revenue (US$ Mn) Comparison by By Application (2016-2032)
- Table 85: Middle East & Africa Ammonia Market Market Y-o-Y Growth Rate Comparison by Country (2016-2032)
- Table 86: Middle East & Africa Ammonia Market Market Y-o-Y Growth Rate Comparison by By Product Form (2016-2032)
- Table 87: Middle East & Africa Ammonia Market Market Y-o-Y Growth Rate Comparison by By Application (2016-2032)
- Table 88: Middle East & Africa Ammonia Market Market Share Comparison by Country (2016-2032)
- Table 89: Middle East & Africa Ammonia Market Market Share Comparison by By Product Form (2016-2032)
- Table 90: Middle East & Africa Ammonia Market Market Share Comparison by By Application (2016-2032)
- 1. Executive Summary
-
- SABIC Agri-Nutrients Company
- EuroChem
- Nutrien Ltd
- Group DF
- OCI
- IFFCO
- QATAR FERTILISER COMPANY
- Yara International ASA
- CF Industries Holdings Inc.
- LFC
- BASF SE
- Trammo
- Mitsubishi
- Koch Industries Inc.
- Mitsui
Our Clients


View Our Licence Options
