
Global Aluminum Billets Market By Type(Aluminum Billets Series 1000, Aluminum Billets Series 3000, Aluminum Billets Series 6000, Others), By Application(Transportation, Packaging, Construction, Electronics, Others), By Region And Companies - Industry Segment Outlook, Market Assessment, Competition Scenario, Trends, And Forecast 2024-2033
-
27585
-
August 2024
-
300
-


-
This report was compiled by Shreyas Rokade Shreyas Rokade is a seasoned Research Analyst with CMFE, bringing extensive expertise in market research and consulting, with a strong background in Chemical Engineering. Correspondence Team Lead-CMFE Linkedin | Detailed Market research Methodology Our methodology involves a mix of primary research, including interviews with leading mental health experts, and secondary research from reputable medical journals and databases. View Detailed Methodology Page
-
Quick Navigation
Report Overview
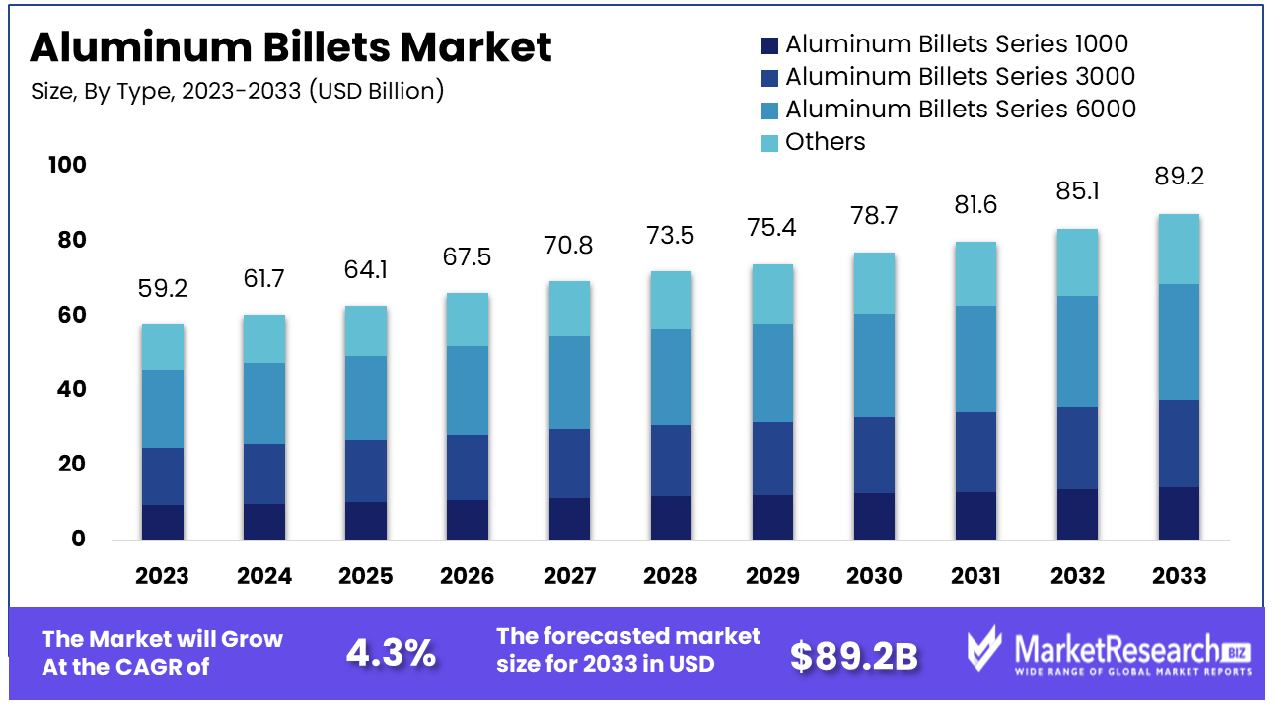
The Global Aluminum Billets Market was valued at USD 59.2 billion in 2023. It is expected to reach USD 89.2 billion by 2033, with a CAGR of 4.3% during the forecast period from 2024 to 2033.
The Aluminum Billets Market encompasses the production and distribution of cylindrical or rectangular bars of aluminum, created through continuous casting or direct chill casting methods. These billets serve as critical raw materials in the automotive, construction, and manufacturing sectors, where they are further processed into various forms, including extrusions and forgings.
As industries seek lightweight and sustainable materials to enhance efficiency and reduce environmental impact, the demand for aluminum billets is anticipated to grow. Understanding the dynamics of this market is essential for strategic decision-making regarding resource allocation, production optimization, and competitive positioning.
In the context of the global Aluminum Billets Market, the data from February 2024 underlines a nuanced trajectory. The total national production of aluminum billets decreased by 8.4% month-over-month to 1.162 million metric tons, although it showed a 7.9% increase year-over-year. This indicates a volatile short-term market but suggests potential stabilization or growth on an annual basis.
A key player, Emirates Global Aluminium (EGA), contributes significantly with billets comprising 46% of its total production. Notably, a large fraction of EGA’s billets are cast using the high extrudability 6063 alloy, which is particularly favored for its superior finish and strength, catering to rigorous industry demands. This specialization might position EGA favorably in markets with stringent quality requirements.
Furthermore, Matalco Inc., a prominent North American producer, illustrates significant capacity and growth potential within the sector. With its new $100 million investment in the Lordstown remelt and casting plant, in Ohio, Matalco brought an annual production capability of 45,000 tons in 2016, projected to reach 175,000 tons at full capacity. This expansion not only boosts Matalco’s production capacity but also enhances its ability to meet diverse market demands across North America.
The contrasting figures of monthly production decline and annual increase, combined with strategic investments by key industry players like EGA and Matalco, depict a market that is adjusting to dynamic global demands and technological advancements. The focus on high-quality, specialized alloys and capacity expansion are likely to drive the long-term growth of the Aluminum Billets Market, despite short-term fluctuations. This evolving landscape presents both challenges and opportunities for stakeholders in the aluminum industry.
Key Takeaways
- Market Growth: The Global Aluminum Billets Market was valued at USD 59.2 billion in 2023. It is expected to reach USD 89.2 billion by 2033, with a CAGR of 4.3% during the forecast period from 2024 to 2033.
- By Type: Aluminum Billets Series 6000 dominated the market with 35%.
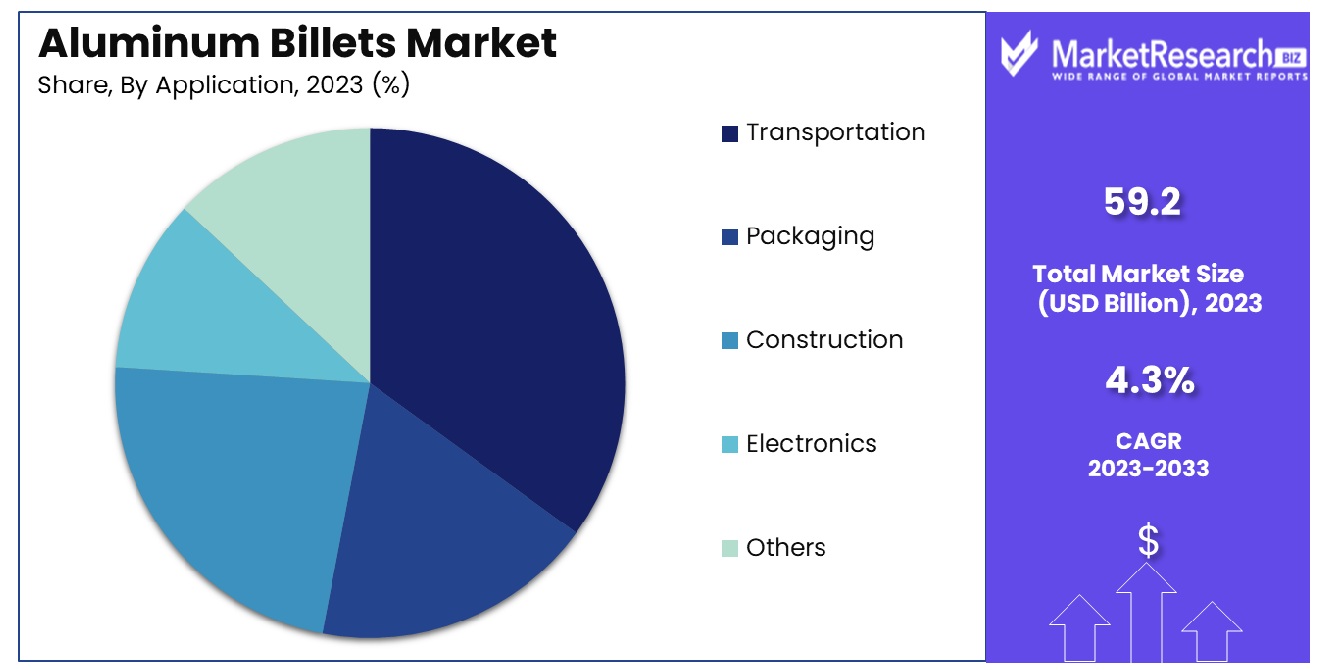
- By Application: Transportation applications dominated the market with a 40% share.
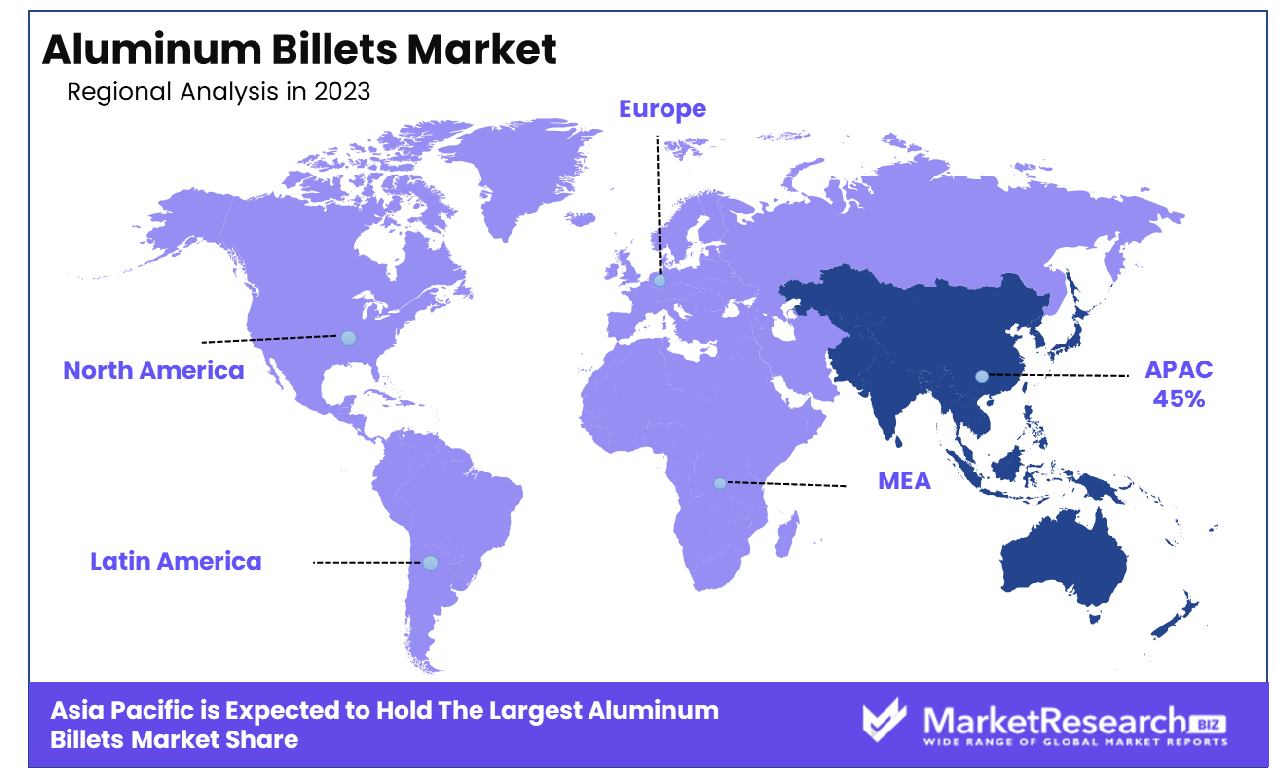
- Regional Dominance: Asia Pacific dominates the aluminum billets market with a 45% share.
Driving factors
Automotive Industry's Shift to Lightweight Materials
The automotive sector's pivot towards lightweight materials significantly propels the demand for aluminum billets. As manufacturers aim to enhance fuel efficiency and reduce carbon emissions, aluminum stands out as an ideal solution due to its strength-to-weight ratio. This shift is not just a trend but a response to global regulatory pressures and consumer preferences for more environmentally friendly vehicles.
Consequently, the increased incorporation of aluminum in automotive design and production directly correlates with a rise in the aluminum billets market. Industry reports have indicated that the demand for aluminum in automotive applications is projected to grow at an annual rate of over 7%, underscoring its critical role in this sector's evolution.
Expansion in Construction Activities
The construction industry's growth, particularly in emerging markets, has led to an augmented demand for durable and lightweight construction materials. Aluminum billets are extensively utilized in creating frameworks, facades, windows, and doors due to their corrosion resistance and aesthetic flexibility.
As urbanization accelerates and infrastructural investments intensify, the demand for aluminum billets in construction is expected to witness a substantial increase. This trend is supported by projections indicating a compound annual growth rate (CAGR) of around 6% in the construction sector's use of aluminum, pointing to a sustained expansion of this market segment.
Advancements in the Aerospace Industry
The aerospace industry's expansion is a critical driver for the high-strength aluminum billets market. Aluminum billets are crucial for manufacturing various aerospace components due to their lightweight and high-strength properties, which are essential for achieving fuel efficiency and performance targets in aircraft design.
With global air traffic set to double in the next 20 years, the aerospace sector's demand for aluminum billets is anticipated to surge, further fueling market growth. The ongoing advancements in aerospace technology, coupled with increasing commercial and defense aircraft production, are expected to maintain a steady demand for high-quality aluminum billets.
Restraining Factors
Fluctuations in Raw Material Prices Impacting Production Costs
The aluminum billets market faces significant challenges due to fluctuations in raw material prices. Bauxite, the primary raw material for aluminum production, is subject to volatile pricing influenced by global supply-demand dynamics, geopolitical factors, and market speculation. For instance, the price of aluminum on the London Metal Exchange (LME) saw fluctuations ranging from $1,450 per metric ton in 2015 to nearly $2,500 per metric ton in 2021.
These price swings directly affect the production costs of aluminum billets, making it difficult for manufacturers to maintain stable profit margins and pricing strategies. Consequently, the unpredictability of raw material costs can lead to hesitation among manufacturers to invest in new production capacities, potentially slowing the overall market growth.
Environmental Regulations Concerning Aluminum Production Emissions
Stringent environmental regulations present another major restraining factor for the aluminum billets market. Aluminum production is energy-intensive and generates significant greenhouse gas emissions, including carbon dioxide and perfluorocarbons. Governments worldwide are increasingly implementing strict regulations to reduce industrial emissions and promote sustainable practices. For example, the European Union’s Emissions Trading System (ETS) imposes limits on carbon emissions for aluminum producers, compelling them to invest in cleaner technologies and practices.
Additionally, in China, the world’s largest aluminum producer, the government has introduced policies to curb pollution, such as imposing stricter emission standards and limiting production capacities. Compliance with these regulations often requires substantial capital investment in advanced emission control technologies and sustainable production methods, thereby increasing the overall production costs and impacting market growth. Furthermore, the ongoing global push towards reducing carbon footprints and achieving net-zero emissions goals continues to exert pressure on the aluminum industry, challenging its growth prospects despite the rising demand.
By Type Analysis
Aluminum Billets Series 6000 dominated with a market share of 35% due to demand.
In 2023, the Aluminum Billets Market was notably segmented by type, with Aluminum Billets Series 6000 emerging as the dominant category. This segment captured more than a 35% share of the market, reflecting its widespread adoption due to its superior properties such as high strength, corrosion resistance, and versatility in various applications.
Aluminum Billets Series 1000 accounted for approximately 20% of the market. This series, known for its excellent corrosion resistance and high thermal and electrical conductivity, is predominantly used in applications requiring good workability and resistance to oxidation.
Aluminum Billets Series 3000 held around 25% of the market share. This series is valued for its good formability and resistance to corrosion, making it suitable for manufacturing products in the automotive and packaging industries.
Aluminum Billets Series 6000, as previously mentioned, was the leading segment, commanding over 35% of the market. Its properties, including enhanced strength and good machinability, contribute to its extensive use in structural applications and manufacturing processes.
Others, which include various specialized and alloyed aluminum billets, represented the remaining 20% of the market. This category includes less common series and alloys tailored for niche applications, which require specific properties not covered by the primary series.
By Application Analysis
Transportation held the largest share at 40%, driven by extensive industry use.
In 2023, the Aluminum Billets Market demonstrated significant segmentation by application, with the Transportation sector holding a dominant market position. This segment captured more than a 40% share of the market, driven by the increasing demand for lightweight and high-strength materials in the automotive and aerospace industries.
Transportation led the market, accounting for over 40% of the share. This dominance is attributed to the sector's need for aluminum billets, which are integral to vehicle and aircraft manufacturing due to their excellent strength-to-weight ratio, corrosion resistance, and durability.
Packaging followed with a substantial market share of approximately 25%. Aluminum billets are utilized in the production of cans, foils, and other packaging materials, thanks to their malleability, recyclability, and ability to provide a barrier against light, oxygen, and moisture.
Construction captured around 20% of the market. Aluminum billets are employed in building frameworks, facades, and roofing materials due to their strength, lightweight nature, and resistance to environmental factors, which contribute to their preference for modern construction practices.
Electronics represented about 10% of the market. This segment utilizes aluminum billets for components that require good thermal and electrical conductivity, as well as durability.
Others encompassed the remaining 5% of the market. This category includes niche applications in various industries that utilize specialized aluminum billets for specific functions and performance requirements.
Key Market Segments
By Type
- Aluminum Billets Series 1000
- Aluminum Billets Series 3000
- Aluminum Billets Series 6000
- Others
By Application
- Transportation
- Packaging
- Construction
- Electronics
- Others
Growth Opportunity
Technological Advancements in Aluminum Billet Production Processes
The global aluminum billets market in 2023 stands to benefit significantly from ongoing technological advancements in production processes. Innovations such as advanced casting techniques, enhanced automation, and the integration of artificial intelligence (AI) in manufacturing are set to revolutionize the industry. These advancements promise to improve production efficiency, reduce waste, and enhance the overall quality of aluminum billets.
For instance, continuous casting technology has been shown to increase production rates and lower energy consumption compared to traditional methods. Additionally, AI-driven predictive maintenance and process optimization can lead to significant cost savings by minimizing downtime and ensuring consistent quality. These technological improvements not only streamline production but also help manufacturers meet the growing demand for high-quality aluminum billets in various sectors, including automotive, aerospace, and construction.
Rising Demand for Recycled Aluminum Billets in Green Construction
In 2023, the global aluminum billets market is also poised to capitalize on the rising demand for recycled aluminum billets, particularly in green construction. The construction industry is increasingly focusing on sustainability and reducing carbon footprints, driving the demand for eco-friendly materials. Recycled aluminum billets offer a compelling solution due to their lower environmental impact compared to primary aluminum. The production of recycled aluminum requires only 5% of the energy needed to produce primary aluminum, significantly reducing greenhouse gas emissions. This aligns with the global push towards sustainable construction practices and green building certifications such as LEED (Leadership in Energy and Environmental Design).
The growing trend of urbanization and the need for sustainable infrastructure further amplify the demand for recycled aluminum billets. Companies that can efficiently produce high-quality recycled billets are likely to gain a competitive edge, as they cater to the increasing preference for sustainable materials in the construction industry. This shift towards recycled aluminum not only supports environmental goals but also opens new revenue streams for aluminum billet manufacturers, fostering market growth.
Latest Trends
Adoption of Automation and AI in Aluminum Billet Manufacturing
In 2023, one of the most significant trends shaping the global aluminum billets market is the adoption of automation and artificial intelligence (AI) in manufacturing processes. The integration of these advanced technologies is transforming the production landscape by enhancing efficiency, reducing operational costs, and improving product quality. Automation facilitates streamlined production workflows, minimizes human error, and increases throughput. For instance, robotic systems in casting and handling processes ensure precision and consistency, leading to higher-quality aluminum billets. AI, on the other hand, plays a crucial role in predictive maintenance, quality control, and process optimization.
Machine learning algorithms can analyze vast amounts of production data to predict equipment failures, optimize operational parameters, and ensure consistent quality output. These advancements not only boost productivity but also enhance the competitiveness of manufacturers in the global market. As more companies embrace these technologies, the aluminum billets industry is likely to see accelerated growth and innovation.
Increasing Use of Aluminum Billets in Renewable Energy Installations
Another notable trend in 2023 is the growing use of aluminum billets in renewable energy installations. As the world moves towards sustainable energy solutions, the demand for lightweight, durable, and corrosion-resistant materials like aluminum is on the rise. Aluminum billets are increasingly being used in the manufacturing of components for solar panels, wind turbines, and other renewable energy infrastructures. For example, aluminum's high strength-to-weight ratio makes it an ideal material for wind turbine blades and solar panel frames, where both durability and weight are critical factors. The global push for renewable energy adoption, driven by environmental policies and the need to reduce carbon emissions, is fueling this demand.
According to the International Renewable Energy Agency (IRENA), the renewable energy sector is expected to grow significantly, with solar and wind energy leading the way. This trend presents substantial growth opportunities for the aluminum billets market, as manufacturers develop specialized products to meet the specific requirements of renewable energy applications. The synergy between the renewable energy sector and aluminum billet production underscores a pivotal shift toward a more sustainable industrial future.
Regional Analysis
Asia Pacific dominates the aluminum billets market with a significant 45% share, driven by robust industrial activities.
The global aluminum billets market demonstrates significant regional variation in demand and production, with Asia Pacific leading the market with a commanding 45% share. This dominance is driven by the region's robust industrial activities, especially in China and India, where rapid urbanization and industrialization fuel the demand for aluminum billets in the construction, automotive, and manufacturing sectors. China's extensive infrastructure projects and India's burgeoning automotive industry are key contributors to this high market share. Additionally, the presence of major aluminum producers in the region, such as Chalco and Hindalco, further strengthens Asia Pacific's position.
In North America, the aluminum billets market is supported by a strong automotive sector and increasing investments in sustainable construction. The United States and Canada are at the forefront, with a combined market share of approximately 20%. The adoption of lightweight materials in automotive manufacturing to enhance fuel efficiency and reduce emissions is a significant driver. Moreover, the region's focus on green building practices boosts the demand for recycled aluminum billets.
Europe accounts for around 18% of the global market, with Germany, France, and the United Kingdom being key players. The region's stringent environmental regulations and commitment to sustainability drive the demand for high-quality and eco-friendly aluminum billets. Europe's automotive and aerospace industries also significantly contribute to market growth, emphasizing lightweight and high-strength materials.
The Middle East & Africa region holds a smaller yet growing share of approximately 10%. The increasing focus on infrastructure development and diversification of economies, particularly in the Gulf Cooperation Council (GCC) countries, propels the demand for aluminum billets. The construction of smart cities and large-scale infrastructure projects are key growth drivers.
Latin America, with a market share of around 7%, sees moderate growth driven by industrialization and infrastructure development. Brazil and Mexico are the primary contributors, with expanding automotive and construction industries.
Key Regions and Countries
North America
- The US
- Canada
- Rest of North America
Europe
- Germany
- France
- The UK
- Spain
- Netherlands
- Russia
- Italy
- Rest of Europe
Asia-Pacific
- China
- Japan
- Singapore
- Thailand
- South Korea
- Vietnam
- India
- New Zealand
- Rest of Asia Pacific
Latin America
- Mexico
- Brazil
- Rest of Latin America
Middle East & Africa
- Saudi Arabia
- South Africa
- UAE
- Rest of Middle East & Africa
Key Players Analysis
The global aluminum billets market in 2023 is characterized by the strategic positioning and operational efficiencies of key players. Rusal, one of the largest producers, continues to leverage its vast bauxite reserves and advanced production technologies to maintain a competitive edge. Similarly, Rio Tinto and Alcoa, with their integrated supply chains and emphasis on sustainable practices, are well-positioned to cater to the growing demand for high-quality aluminum billets.
Emirates Global Aluminium (EGA) and Norsk Hydro stand out for their significant investments in green technologies, aiming to reduce carbon footprints and align with global sustainability goals. Their commitment to innovation and sustainable production processes enhances their market appeal, especially in regions with stringent environmental regulations.
In Asia, Yinhai Aluminum, Xinfa Group, and Chalco dominate the market, driven by their extensive production capacities and strong domestic demand. Chalco, in particular, benefits from its strategic initiatives in technological advancements and production efficiency, reinforcing its market leadership. The aggressive expansion strategies of these companies in both domestic and international markets underscore their pivotal roles in the industry.
Alba and SNTO are notable for their high-quality production capabilities and strategic geographic locations, which facilitate efficient distribution across key markets. Glencore and Matalco, with their robust global supply chains and focus on recycled aluminum, cater to the increasing demand for sustainable and eco-friendly aluminum products.
Emerging players like Jiangyin Tianyang Metal, Wanji, and Henan Haihuang are gaining traction through strategic partnerships and investments in advanced manufacturing technologies, enhancing their competitive positions in the market. Companies such as Noranda Aluminum, Kumz, and Aluar are also expanding their market presence through innovative production techniques and a focus on high-strength, lightweight aluminum billets for various industrial applications.
Market Key Players
- Rusal
- Rio Tinto
- Alcoa
- EGA
- Yinhai Aluminum
- Xinfa Group
- Norsk Hydro
- Alba
- Chalco
- SNTO
- Noranda Aluminum
- Glencore
- Matalco
- Jiangyin Tianyang Metal
- Wanji
- Kumz
- Aluar
- Henan Haihuang
Recent Development
- In June 2023, It acquired a smaller competitor, strengthening its market position in China. This acquisition is expected to boost Yinhai’s annual production capacity by 15,000 tonnes. The company also launched a new line of customized aluminum billets in August 2024 for the electronic and automotive industries, focusing on specialized market needs.
- In May 2023, Completed a significant merger with a European aluminum company, aiming to boost its production capabilities and market reach. The merger is expected to increase Rio Tinto’s aluminum billet output by approximately 30,000 tonnes per year. In November 2023, the company also launched a new series of high-strength aluminum billets designed for the aerospace industry, emphasizing innovation in its product line.
- In January 2023, Rusal launched a new production line in Siberia, enhancing its aluminum billet manufacturing capacity by 20,000 tonnes annually. This expansion aims to meet the growing demand in the Asia-Pacific region. Additionally, Rusal announced a strategic partnership with a major automotive manufacturer in March 2024 to supply eco-friendly aluminum billets, showcasing its commitment to sustainability.
Report Scope
Report Features Description Market Value (2023) USD 59.2 Billion Forecast Revenue (2033) USD 89.2 Billion CAGR (2024-2032) 4.3% Base Year for Estimation 2023 Historic Period 2016-2023 Forecast Period 2024-2033 Report Coverage Revenue Forecast, Market Dynamics, COVID-19 Impact, Competitive Landscape, Recent Developments Segments Covered By Type(Aluminum Billets Series 1000, Aluminum Billets Series 3000, Aluminum Billets Series 6000, Others), By Application(Transportation, Packaging, Construction, Electronics, Others) Regional Analysis North America - The US, Canada, Rest of North America, Europe - Germany, France, The UK, Spain, Italy, Russia, Netherlands, Rest of Europe, Asia-Pacific - China, Japan, South Korea, India, New Zealand, Singapore, Thailand, Vietnam, Rest of Asia Pacific, Latin America - Brazil, Mexico, Rest of Latin America, Middle East & Africa - South Africa, Saudi Arabia, UAE, Rest of Middle East & Africa Competitive Landscape Rusal, Rio Tinto, Alcoa, EGA, Yinhai Aluminum, Xinfa Group, Norsk Hydro, Alba, Chalco, SNTO, Noranda Aluminum, Glencore, Matalco, Jiangyin Tianyang Metal, Wanji, Kumz, Aluar, Henan Haihuang Customization Scope Customization for segments, region/country-level will be provided. Moreover, additional customization can be done based on the requirements. Purchase Options We have three licenses to opt for Single User License, Multi-User License (Up to 5 Users), Corporate Use License (Unlimited User and Printable PDF) -
-
- Rusal
- Rio Tinto
- Alcoa
- EGA
- Yinhai Aluminum
- Xinfa Group
- Norsk Hydro
- Alba
- Chalco
- SNTO
- Noranda Aluminum
- Glencore
- Matalco
- Jiangyin Tianyang Metal
- Wanji
- Kumz
- Aluar
- Henan Haihuang
Our Clients


View Our Licence Options
