
After School Care Market Report By Type of Service (Academic Assistance [Homework Help, Tutoring], Recreational Activities [Sports and Physical Activities, Arts and Crafts, Music and Dance], Extended Day Care [Early Drop-off, Late Pickup], Enrichment Programs, Others), By Program Type (Center-Based Programs, Home-Based Programs, School-Based Programs, Others), By Age Group, By Provider Type, By Region and Companies - Industry Segment Outlook, Market Assessment, Competition Scenario, Trends and Forecast 2024-2033
-
41627
-
July 2024
-
321
-


-
This report was compiled by Trishita Deb Trishita Deb is an experienced market research and consulting professional with over 7 years of expertise across healthcare, consumer goods, and materials, contributing to over 400 healthcare-related reports. Correspondence Team Lead- Healthcare Linkedin | Detailed Market research Methodology Our methodology involves a mix of primary research, including interviews with leading mental health experts, and secondary research from reputable medical journals and databases. View Detailed Methodology Page
-
Quick Navigation
Report Overview
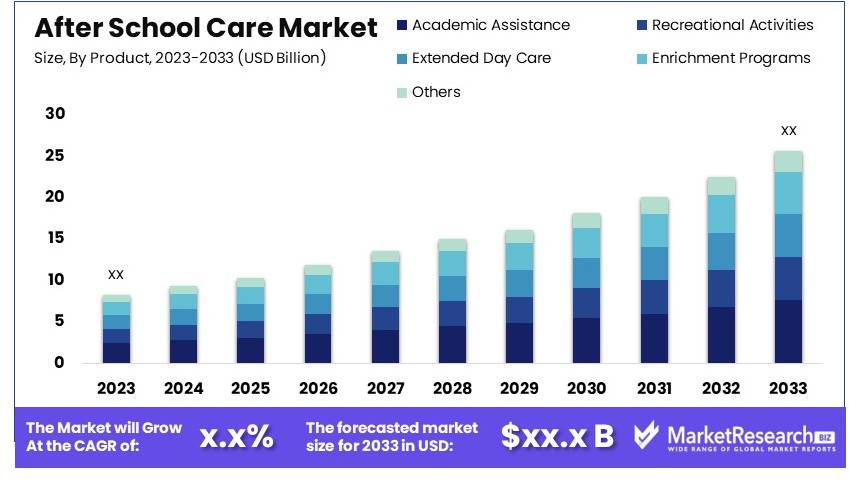
The Global After School Care Market size is expected to be worth around USD xx.x Billion by 2033, from USD xx.x in 2023, growing at a CAGR of xx.x% during the forecast period from 2024 to 2033.
The after school care market provides programs and services for children outside regular school hours. This market caters to working parents needing reliable and safe environments for their children during afternoons and early evenings. Services include homework help, recreational activities, and enrichment programs like arts and sports.
Key factors driving this market are the increasing number of dual-income households and growing awareness of child development benefits. The market is segmented by program type, age group, and service provider. Investment in high-quality staff and facilities is crucial for market players to meet safety standards and attract families.
The after-school care market is expanding rapidly due to several key factors. One significant driver is the growing awareness among parents about the benefits of structured after-school programs. These programs provide a safe environment for children and support their academic and social development. The 21st Century Community Learning Centers (21st CCLC) initiative is a major federal funding source that supports local after-school, before-school, and summer learning programs. This initiative ensures that learning extends beyond the traditional school day, addressing the unique needs of local communities.
The focus on STEM activities in after-school programs is particularly noteworthy. Community partnerships and mentorship from STEM professionals enrich the learning experience, making these programs highly attractive to parents who want to prepare their children for future job markets. Additionally, the increasing participation of working parents in the labor force drives demand for reliable and high-quality after-school care services.
Technological advancements also play a crucial role. Many after-school programs now incorporate digital tools and online resources, making learning more engaging and accessible. These innovations align with the growing trend of personalized learning experiences tailored to individual student needs.
Despite these positive trends, challenges remain. Funding limitations and regulatory requirements can hinder program expansion. However, the continuous support from federal initiatives like 21st CCLC and growing private sector involvement provide a strong foundation for overcoming these obstacles.
The after-school care market is poised for significant growth. This growth is driven by increased parental awareness, federal funding support, focus on STEM activities, and technological advancements. Providers that can innovate and meet diverse community needs are well-positioned to thrive in this evolving market.
Key Takeaways
- Market Value: The After School Care Market was valued at USD xx.x billion in 2023 and is expected to reach USD xx.x billion by 2033, with a CAGR of xx.x%.
- By Type of Service Analysis: Academic Assistance dominated with 40%; crucial for its role in supporting students' educational needs.
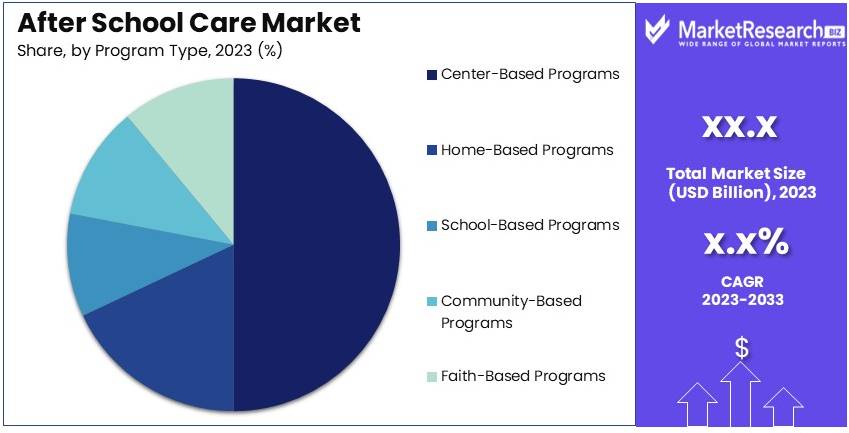
- By Program Type Analysis: Center-Based Programs dominated with 50%; preferred for their structured and comprehensive offerings.
- By Age Group Analysis: Early Elementary (Ages 6-8) dominated with 35%; key demographic due to high demand for after-school programs at this age.
- By Provider Type Analysis: Private Providers dominated with 60%; indicating the strong presence and trust in private after-school services.
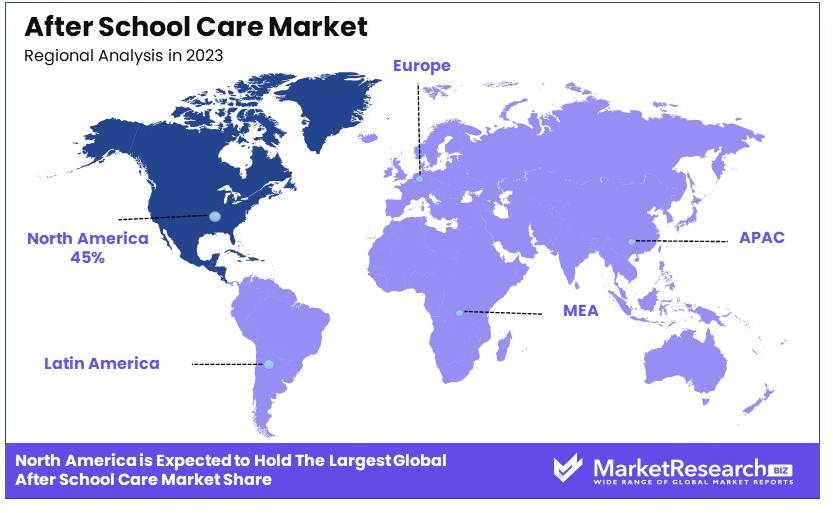
- Dominant Region: North America 45%; driven by high demand and well-established after-school care infrastructure.
- High Growth Region: Asia-Pacific; expected growth due to rising awareness and government initiatives in child education and care.
- Analyst Viewpoint: The market is expanding with increasing parental demand for holistic child development programs. Future growth will be driven by innovative, inclusive, and diverse program offerings.
Driving Factors
Increasing Number of Dual-Income Households Drives Market Growth
The rise in dual-income households significantly drives the after school care market. With both parents working full-time, there is an increased need for reliable childcare options beyond regular school hours. This trend has necessitated the expansion of after school care services to accommodate the growing number of working parents.
In the United States, the Bureau of Labor Statistics reported that in 2020, both parents were employed in 59.8% of married-couple families with children. This demographic shift has led to a growing market for after school programs. Providers like KinderCare have expanded their services to meet the needs of working parents. As more families require dependable after school care, the market for these services continues to grow, enhancing the overall development and safety of children during after school hours.
Focus on Children's Holistic Development Drives Market Growth
A growing focus on children's holistic development is driving demand for after school care programs. Parents increasingly recognize the importance of extracurricular activities for their children's overall growth. Programs that offer enrichment activities, such as music, arts, sports, and STEM, are seeing heightened demand.
For instance, Kumon, a global after school academic enrichment program, has seen significant growth and now operates in over 50 countries. This is due to its emphasis on developing children's math and reading skills beyond the regular school curriculum. As parents seek to enhance their children's education and skills, after school programs that provide diverse and enriching activities are becoming more popular, contributing to market expansion.
Government Initiatives and Funding Drive Market Growth
Government initiatives and funding are crucial drivers of the after school care market. Many governments recognize the importance of after school care and are implementing policies and providing funding to support these programs. This support makes after school care more accessible and affordable, thereby driving market growth.
In the United States, the 21st Century Community Learning Centers federal grant program provides funding for after school programs in high-poverty areas. This initiative has led to the establishment of numerous after school programs across the country, serving millions of children annually. By making after school care more accessible, these government efforts help expand the market, ensuring that more children benefit from structured, supportive environments after school.
Restraining Factors
High Operational Costs Restrain Market Growth
Running a quality after school care program involves significant costs, including staffing, facilities, materials, and insurance. These high operational expenses can lead to higher fees for parents, potentially limiting accessibility for some families.
For instance, according to a 2019 survey by the Afterschool Alliance, 57% of parents in the U.S. who don't have children in after school programs cited high costs as a barrier. This cost factor can restrain market growth by limiting the number of families able to afford these services.
The high expenses required to maintain quality programs result in elevated fees, making it difficult for many families to enroll their children. Consequently, this financial barrier reduces the potential customer base for after school care providers, slowing down market expansion.
Staffing Challenges and High Turnover Restrain Market Growth
The after school care sector often faces difficulties in recruiting and retaining qualified staff due to factors such as low wages, part-time hours, and lack of benefits. High staff turnover can affect program quality and consistency, potentially impacting parent satisfaction and trust.
For example, a study by the National AfterSchool Association found that the average turnover rate for after school program staff was around 30% annually. This staffing instability can hinder the growth and quality of after school care programs.
Inconsistent staffing leads to disruptions in program delivery and can diminish the overall experience for children. Parents may become dissatisfied with the fluctuating quality and choose alternative arrangements, thereby limiting the market growth for after school care services.
Type of Service Analysis
Academic Assistance dominates with 40% due to the high demand for homework help and tutoring.
The after-school care market by type of service includes various segments catering to different needs. Academic Assistance leads this market with a 40% share. Parents and guardians prioritize their children's academic success, making services like Homework Help and Tutoring highly sought after. These services provide structured support, helping students complete assignments and improve their understanding of subjects. The rising educational standards and competition drive this demand, as parents seek to give their children an academic edge.
Recreational Activities hold a 30% share of the market. Within this segment, Sports and Physical Activities are particularly popular, promoting physical health and teamwork skills. Arts and Crafts, along with Music and Dance, are also significant, offering creative outlets and enhancing cognitive and motor skills. These activities are essential for a well-rounded development, providing balance to academic pressures.
Extended Day Care makes up 15% of the market. Services like Early Drop-off and Late Pickup are crucial for working parents who need flexible care options outside regular school hours. This segment supports parents with demanding work schedules, ensuring their children are in a safe and supervised environment.
Enrichment Programs, with a 10% market share, include STEM Activities, Language Learning, and Social Skills Development. These programs are gaining traction as they offer specialized skills that are increasingly valued in today's society. STEM Activities, in particular, are popular due to the growing emphasis on science and technology education.
Other services constitute the remaining 5% of the market. This category includes various niche services tailored to specific needs, such as specialized therapeutic programs or cultural activities. Though smaller in market share, these services play a crucial role in addressing unique requirements of different children and families.
Program Type Analysis
Center-Based Programs dominate with 50% due to their structured environment and wide range of activities.
In the after-school care market by program type, Center-Based Programs lead with a 50% share. These programs are favored for their structured environments, professional staff, and diverse activity offerings. Parents trust these centers for their reliability and the comprehensive care they provide. The wide range of activities, from academic support to recreational and enrichment programs, makes them appealing to a broad audience.
Home-Based Programs hold a 20% share of the market. These programs offer a more personal and familiar environment, often preferred by parents who want a home-like setting for their children. Home-based programs typically have smaller group sizes, allowing for more individualized attention and a close-knit community feel.
School-Based Programs account for 15% of the market. These programs benefit from being located within the school premises, providing convenience for parents and continuity for children. They often collaborate with school staff to align activities with the school curriculum, enhancing the overall educational experience.
Community-Based Programs make up 10% of the market. These programs leverage local community resources and spaces, such as community centers and parks, to provide after-school care. They are often run by local organizations and volunteers, fostering a sense of community involvement and support.
Faith-Based Programs constitute the remaining 5% of the market. These programs integrate religious education with after-school care, appealing to families who want their children to receive moral and spiritual guidance alongside academic and recreational activities. Though smaller in market share, these programs have a dedicated following among faith-based communities.
Age Group Analysis
Early Elementary (Ages 6-8) dominates with 35% due to the critical development stage and need for structured activities.
In the after-school care market segmented by age group, Early Elementary (Ages 6-8) leads with a 35% share. This age group is at a crucial development stage where structured activities and supervision are essential. Programs targeting this segment focus on balancing academic support with recreational and enrichment activities, ensuring holistic development. The demand is high as parents seek to ensure their children receive appropriate guidance and support during these formative years.
Preschoolers (Ages 3-5) account for 25% of the market. These young children require specialized care that includes both educational activities and playtime. Programs for preschoolers often emphasize early learning and socialization, preparing them for the transition to formal schooling. The growing awareness of early childhood education's importance drives demand in this segment.
Late Elementary (Ages 9-11) holds a 20% share. This group benefits from programs that provide more advanced academic assistance and a variety of extracurricular activities. As children in this age group become more independent, programs also focus on developing social skills and leadership qualities.
Middle School (Ages 12-14) represents 15% of the market. Programs for this segment often include a mix of academic support, life skills training, and recreational activities. This age group is navigating early adolescence, making mentorship and guidance crucial components of after-school care.
High School (Ages 15-18) makes up the remaining 5%. While older students are more independent, there is still a need for programs that offer academic tutoring, college preparation, and career guidance. These programs support students in their transition to higher education and adulthood.
Provider Type Analysis
Private Providers dominate with 60% due to their flexibility and diverse program offerings.
In the after-school care market by provider type, Private Providers lead with a 60% share. This segment includes both For-Profit and Non-Profit Organizations. Private providers are favored for their flexibility, diverse program offerings, and ability to adapt quickly to market demands. They often offer a wide range of activities and services, catering to various needs and preferences. For-Profit organizations are driven by market competition to maintain high standards and innovative programs, while Non-Profit organizations focus on community service and often provide subsidized care for low-income families.
Public Providers account for 40% of the market. This segment includes School Districts and Government-Funded Programs. Public providers play a crucial role in ensuring access to after-school care for all children, particularly those from disadvantaged backgrounds. School districts offer programs that are closely aligned with the school curriculum, providing continuity and academic support. Government-funded programs often target specific needs, such as those of low-income families or at-risk youth, ensuring that after-school care is accessible and affordable for all.
School Districts hold a significant portion of the public provider segment, leveraging existing school infrastructure and resources to offer comprehensive after-school programs. These programs benefit from close integration with the school system, ensuring that activities are aligned with educational goals.
Government-Funded Programs make up the rest of the public provider segment. These programs are essential in providing equitable access to quality after-school care. They often focus on underserved communities, ensuring that all children have the opportunity to participate in enriching and supportive after-school activities.
Key Market Segments
By Type of Service
- Academic Assistance
- Homework Help
- Tutoring
- Recreational Activities
- Sports and Physical Activities
- Arts and Crafts
- Music and Dance
- Extended Day Care
- Early Drop-off
- Late Pickup
- Enrichment Programs
- STEM Activities
- Language Learning
- Social Skills Development
- Others
By Program Type
- Center-Based Programs
- Home-Based Programs
- School-Based Programs
- Community-Based Programs
- Faith-Based Programs
By Age Group
- Preschoolers (Ages 3-5)
- Early Elementary (Ages 6-8)
- Late Elementary (Ages 9-11)
- Middle School (Ages 12-14)
- High School (Ages 15-18)
By Provider Type
- Private Providers
- For-Profit Organizations
- Non-Profit Organizations
- Public Providers
- School Districts
- Government-Funded Programs
Growth Opportunities
Integration of Technology and Digital Learning Offers Growth Opportunity
There's significant potential for growth in after school programs that incorporate technology and digital learning components. This can include coding classes, robotics workshops, or digital art programs.
For example, Code Ninjas, an after school program focusing on teaching kids coding and technology skills, has rapidly expanded to over 300 locations across the United States and Canada since its founding in 2016, demonstrating the strong demand for tech-focused after school care. By integrating technology and digital learning, after school programs can attract tech-savvy parents and children, fostering an innovative learning environment and driving market expansion.
Specialized Programs for Children with Special Needs Offer Growth Opportunity
There is a growing need for after school care programs that cater to children with special needs, including those with learning disabilities, autism therapy, or physical disabilities. This niche market presents a significant growth opportunity.
For instance, the Friendship Circle, an organization that provides programs for children with special needs, has expanded to over 80 locations worldwide, offering specialized after school activities and support for this underserved population. By developing tailored programs for children with special needs, after school care providers can meet a critical demand, attract dedicated funding, and create a supportive community, thereby driving market growth.
Partnerships with Schools and Community Organizations Offer Growth Opportunity
After school care providers can grow by forming partnerships with local schools and community organizations. These partnerships can provide access to facilities, resources, and a built-in customer base.
For example, Right At School, a leading provider of in-school and after school programs, has grown rapidly by partnering directly with schools to offer on-site after school care, now serving over 25,000 students daily across multiple states. By collaborating with schools and community organizations, after school care providers can enhance their service offerings, increase enrollment, and strengthen their market presence, facilitating significant growth opportunities.
Trending Factors
Focus on STEAM Education Are Trending Factors
There's a growing trend towards incorporating STEAM (Science, Technology, Engineering, Arts, and Mathematics) education into after school programs. Parents seek programs that supplement and enhance their children's learning in these critical areas.
For instance, Sylvan Learning has expanded its traditional tutoring services to include EDGE programs focusing on STEM subjects for after school enrichment. This trend reflects a rising demand for educational programs that prepare children for future academic and career success. By integrating STEAM education, after school programs can attract more participants, enhance learning outcomes, and stay aligned with educational priorities, driving market trends in after school care.
Emphasis on Physical Activity and Outdoor Learning Are Trending Factors
With growing concerns about childhood obesity and the benefits of outdoor play, there's a trend towards after school programs emphasizing physical activity and outdoor learning experiences. Programs like the Outdoor Kids program by the Sierra Club have gained popularity by offering nature-based after school activities.
These programs combine environmental education with physical outdoor experiences, promoting healthy lifestyles and environmental awareness. By focusing on physical activity and outdoor learning, after school programs can address health concerns, attract environmentally conscious families, and enhance children's overall development, driving market trends in after school care.
Regional Analysis
North America Dominates with 45% Market Share in the After School Care Market
North America's substantial 45% market share in the after school care market can be largely credited to high dual-income household rates and strong governmental support for child care programs. The region's emphasis on extracurricular activities that contribute to holistic child development is also a significant driver. Furthermore, the extensive presence of established child care providers who offer diversified and quality services adds to this high market share.
The after school care market in North America is influenced by the growing awareness of the benefits of early education and social interaction for children. The availability of customized programs catering to varied interests and educational needs, such as sports, arts, and academic tutoring, makes these services appealing to parents. Additionally, technological integration in child care services, providing online monitoring and interactive learning, plays a crucial role in the industry’s growth.
The future of the after school care market in North America looks promising due to ongoing trends toward work-life balance and increasing employment among parents. Expected legislative support for child care facilities and subsidies will likely enhance market growth. Moreover, the rising trend of organized and structured child development programs is predicted to further solidify the region's dominance in this market.
Regional Market Share and Growth Statistics
- Europe: Holding a 30% share, Europe benefits from strong regulatory support and high parental focus on child development, contributing to steady growth in the after school care market.
- Asia Pacific: This region, with a 15% market share, sees growth driven by increasing urbanization, rising disposable incomes, and cultural shifts towards formal child education and care.
- Middle East & Africa: Capturing 5% of the market, the growth in this region is slowly increasing with the expanding expatriate population and gradual shift in social norms regarding child care.
- Latin America: Representing 5% of the market, Latin America is experiencing growth due to the increasing number of working parents and the growing recognition of the importance of child development activities outside of regular school hours.
Key Regions and Countries
- North America
- The US
- Canada
- Mexico
- Western Europe
- Germany
- France
- The UK
- Spain
- Italy
- Portugal
- Ireland
- Austria
- Switzerland
- Benelux
- Nordic
- Rest of Western Europe
- Eastern Europe
- Russia
- Poland
- The Czech Republic
- Greece
- Rest of Eastern Europe
- APAC
- China
- Japan
- South Korea
- India
- Australia & New Zealand
- Indonesia
- Malaysia
- Philippines
- Singapore
- Thailand
- Vietnam
- Rest of APAC
- Latin America
- Brazil
- Colombia
- Chile
- Argentina
- Costa Rica
- Rest of Latin America
- Middle East & Africa
- Algeria
- Egypt
- Israel
- Kuwait
- Nigeria
- Saudi Arabia
- South Africa
- Turkey
- United Arab Emirates
- Rest of MEA
Key Players Analysis
In the after school care market, KinderCare Education and its Champions programs are prominent, offering extensive services across the nation. The YMCA provides community-focused care with a strong reputation for quality. Bright Horizons Family Solutions and Knowledge Universe stand out with their wide-ranging educational programs. The Learning Experience and Boys & Girls Clubs of America offer enriching activities, enhancing their market position.
Springboard Education, The Goddard School, and Primrose Schools emphasize educational excellence, appealing to parents seeking quality care. La Petite Academy and Everbrook Academy focus on comprehensive development, attracting a diverse clientele. Huntington Learning Center, KLA Schools, and Champions Before and After School Programs provide specialized academic support, boosting their market influence.
These companies maintain their competitive edge through extensive networks, diverse program offerings, and strong brand reputations. Their ability to provide reliable and enriching care makes them leaders in the after school care market.
Market Key Players
- KinderCare Education
- YMCA
- Bright Horizons Family Solutions
- Knowledge Universe
- Champions (KinderCare)
- The Learning Experience
- Boys & Girls Clubs of America
- Springboard Education
- The Goddard School
- Primrose Schools
- La Petite Academy
- Everbrook Academy
- Huntington Learning Center
- KLA Schools
- Champions Before and After School Programs
Recent Developments
- March 2024: Think Together, a nonprofit organization providing after-school programs in California, has significantly expanded its services. They now operate in nearly 500 schools, serving over 200,000 students from San Diego to San Francisco. Their programs focus on academic support, enrichment activities, and school improvement to prepare students for college and careers. The organization also partners with companies like Broadcom Inc. to introduce coding into over 400 schools, impacting over 150,000 students.
- April 2024: New York City Public Schools have expanded their after-school offerings to over 900 programs citywide. These programs provide a variety of activities including tutoring, arts and crafts, sports, and STEM education. The goal is to offer students opportunities to learn new skills and explore their interests beyond the regular school day. This expansion aims to support students' academic and personal growth by providing a safe and engaging environment after school.
Report Scope
Report Features Description Market Value (2023) USD xx.x Forecast Revenue (2033) USD xx.x Billion CAGR (2024-2033) xx.x% Base Year for Estimation 2023 Historic Period 2018-2023 Forecast Period 2024-2033 Report Coverage Revenue Forecast, Market Dynamics, Competitive Landscape, Recent Developments Segments Covered By Type of Service (Academic Assistance [Homework Help, Tutoring], Recreational Activities [Sports and Physical Activities, Arts and Crafts, Music and Dance], Extended Day Care [Early Drop-off, Late Pickup], Enrichment Programs [STEM Activities, Language Learning, Social Skills Development], Others), By Program Type (Center-Based Programs, Home-Based Programs, School-Based Programs, Community-Based Programs, Faith-Based Programs), By Age Group (Preschoolers [Ages 3-5], Early Elementary [Ages 6-8], Late Elementary [Ages 9-11], Middle School [Ages 12-14], High School [Ages 15-18]), By Provider Type (Private Providers [For-Profit Organizations, Non-Profit Organizations], Public Providers [School Districts, Government-Funded Programs]) Regional Analysis North America - The US, Canada, & Mexico; Western Europe - Germany, France, The UK, Spain, Italy, Portugal, Ireland, Austria, Switzerland, Benelux, Nordic, & Rest of Western Europe; Eastern Europe - Russia, Poland, The Czech Republic, Greece, & Rest of Eastern Europe; APAC - China, Japan, South Korea, India, Australia & New Zealand, Indonesia, Malaysia, Philippines, Singapore, Thailand, Vietnam, & Rest of APAC; Latin America - Brazil, Colombia, Chile, Argentina, Costa Rica, & Rest of Latin America; Middle East & Africa - Algeria, Egypt, Israel, Kuwait, Nigeria, Saudi Arabia, South Africa, Turkey, United Arab Emirates, & Rest of MEA Competitive Landscape KinderCare Education, YMCA, Bright Horizons Family Solutions, Knowledge Universe, Champions (KinderCare), The Learning Experience, Boys & Girls Clubs of America, Springboard Education, The Goddard School, Primrose Schools, La Petite Academy, Everbrook Academy, Huntington Learning Center, KLA Schools, Champions Before and After School Programs Customization Scope Customization for segments, region/country-level will be provided. Moreover, additional customization can be done based on the requirements. Purchase Options We have three licenses to opt for: Single User License, Multi-User License (Up to 5 Users), Corporate Use License (Unlimited User and Printable PDF) -
- 1. Executive Summary
- 1.1. Definition
- 1.2. Taxonomy
- 1.3. Research Scope
- 1.4. Key Analysis
- 1.5. Key Findings by Major Segments
- 1.6. Top strategies by Major Players
- 2. Global After School Care Market Overview
- 2.1. After School Care Market Dynamics
- 2.1.1. Drivers
- 2.1.2. Opportunities
- 2.1.3. Restraints
- 2.1.4. Challenges
- 2.2. Macro-economic Factors
- 2.3. Regulatory Framework
- 2.4. Market Investment Feasibility Index
- 2.5. PEST Analysis
- 2.6. PORTER’S Five Force Analysis
- 2.7. Drivers & Restraints Impact Analysis
- 2.8. Industry Chain Analysis
- 2.9. Cost Structure Analysis
- 2.10. Marketing Strategy
- 2.11. Russia-Ukraine War Impact Analysis
- 2.12. Opportunity Map Analysis
- 2.13. Market Competition Scenario Analysis
- 2.14. Product Life Cycle Analysis
- 2.15. Opportunity Orbits
- 2.16. Manufacturer Intensity Map
- 2.17. Major Companies sales by Value & Volume
- 2.1. After School Care Market Dynamics
- 3. Global After School Care Market Analysis, Opportunity and Forecast, 2016-2032
- 3.1. Global After School Care Market Analysis, 2016-2021
- 3.2. Global After School Care Market Opportunity and Forecast, 2023-2032
- 3.3. Global After School Care Market Analysis, Opportunity and Forecast, By Type of Service, 2016-2032
- 3.3.1. Global After School Care Market Analysis by Type of Service: Introduction
- 3.3.2. Market Size Absolute $ Opportunity Analysis and Forecast, By Type of Service, 2016-2032
- 3.3.3. Academic Assistance
- 3.3.4. Recreational Activities
- 3.3.5. Extended Day Care
- 3.3.6. Enrichment Programs
- 3.3.7. Others
- 3.4. Global After School Care Market Analysis, Opportunity and Forecast, By Program Type, 2016-2032
- 3.4.1. Global After School Care Market Analysis by Program Type: Introduction
- 3.4.2. Market Size Absolute $ Opportunity Analysis and Forecast, By Program Type, 2016-2032
- 3.4.3. Center-Based Programs
- 3.4.4. Home-Based Programs
- 3.4.5. School-Based Programs
- 3.4.6. Community-Based Programs
- 3.4.7. Faith-Based Programs
- 3.5. Global After School Care Market Analysis, Opportunity and Forecast, By Age Group, 2016-2032
- 3.5.1. Global After School Care Market Analysis by Age Group: Introduction
- 3.5.2. Market Size Absolute $ Opportunity Analysis and Forecast, By Age Group, 2016-2032
- 3.5.3. Preschoolers (Ages 3-5)
- 3.5.4. Early Elementary (Ages 6-8)
- 3.5.5. Late Elementary (Ages 9-11)
- 3.5.6. Middle School (Ages 12-14)
- 3.5.7. High School (Ages 15-18)
- 3.6. Global After School Care Market Analysis, Opportunity and Forecast, By Provider Type, 2016-2032
- 3.6.1. Global After School Care Market Analysis by Provider Type: Introduction
- 3.6.2. Market Size Absolute $ Opportunity Analysis and Forecast, By Provider Type, 2016-2032
- 3.6.3. Private Providers
- 3.6.4. Public Providers
- 4. North America After School Care Market Analysis, Opportunity and Forecast, 2016-2032
- 4.1. North America After School Care Market Analysis, 2016-2021
- 4.2. North America After School Care Market Opportunity and Forecast, 2023-2032
- 4.3. North America After School Care Market Analysis, Opportunity and Forecast, By Type of Service, 2016-2032
- 4.3.1. North America After School Care Market Analysis by Type of Service: Introduction
- 4.3.2. Market Size Absolute $ Opportunity Analysis and Forecast, By Type of Service, 2016-2032
- 4.3.3. Academic Assistance
- 4.3.4. Recreational Activities
- 4.3.5. Extended Day Care
- 4.3.6. Enrichment Programs
- 4.3.7. Others
- 4.4. North America After School Care Market Analysis, Opportunity and Forecast, By Program Type, 2016-2032
- 4.4.1. North America After School Care Market Analysis by Program Type: Introduction
- 4.4.2. Market Size Absolute $ Opportunity Analysis and Forecast, By Program Type, 2016-2032
- 4.4.3. Center-Based Programs
- 4.4.4. Home-Based Programs
- 4.4.5. School-Based Programs
- 4.4.6. Community-Based Programs
- 4.4.7. Faith-Based Programs
- 4.5. North America After School Care Market Analysis, Opportunity and Forecast, By Age Group, 2016-2032
- 4.5.1. North America After School Care Market Analysis by Age Group: Introduction
- 4.5.2. Market Size Absolute $ Opportunity Analysis and Forecast, By Age Group, 2016-2032
- 4.5.3. Preschoolers (Ages 3-5)
- 4.5.4. Early Elementary (Ages 6-8)
- 4.5.5. Late Elementary (Ages 9-11)
- 4.5.6. Middle School (Ages 12-14)
- 4.5.7. High School (Ages 15-18)
- 4.6. North America After School Care Market Analysis, Opportunity and Forecast, By Provider Type, 2016-2032
- 4.6.1. North America After School Care Market Analysis by Provider Type: Introduction
- 4.6.2. Market Size Absolute $ Opportunity Analysis and Forecast, By Provider Type, 2016-2032
- 4.6.3. Private Providers
- 4.6.4. Public Providers
- 4.7. North America After School Care Market Analysis, Opportunity and Forecast, By Country , 2016-2032
- 4.7.1. North America After School Care Market Analysis by Country : Introduction
- 4.7.2. Market Size Absolute $ Opportunity Analysis and Forecast, Country , 2016-2032
- 4.7.2.1. The US
- 4.7.2.2. Canada
- 4.7.2.3. Mexico
- 5. Western Europe After School Care Market Analysis, Opportunity and Forecast, 2016-2032
- 5.1. Western Europe After School Care Market Analysis, 2016-2021
- 5.2. Western Europe After School Care Market Opportunity and Forecast, 2023-2032
- 5.3. Western Europe After School Care Market Analysis, Opportunity and Forecast, By Type of Service, 2016-2032
- 5.3.1. Western Europe After School Care Market Analysis by Type of Service: Introduction
- 5.3.2. Market Size Absolute $ Opportunity Analysis and Forecast, By Type of Service, 2016-2032
- 5.3.3. Academic Assistance
- 5.3.4. Recreational Activities
- 5.3.5. Extended Day Care
- 5.3.6. Enrichment Programs
- 5.3.7. Others
- 5.4. Western Europe After School Care Market Analysis, Opportunity and Forecast, By Program Type, 2016-2032
- 5.4.1. Western Europe After School Care Market Analysis by Program Type: Introduction
- 5.4.2. Market Size Absolute $ Opportunity Analysis and Forecast, By Program Type, 2016-2032
- 5.4.3. Center-Based Programs
- 5.4.4. Home-Based Programs
- 5.4.5. School-Based Programs
- 5.4.6. Community-Based Programs
- 5.4.7. Faith-Based Programs
- 5.5. Western Europe After School Care Market Analysis, Opportunity and Forecast, By Age Group, 2016-2032
- 5.5.1. Western Europe After School Care Market Analysis by Age Group: Introduction
- 5.5.2. Market Size Absolute $ Opportunity Analysis and Forecast, By Age Group, 2016-2032
- 5.5.3. Preschoolers (Ages 3-5)
- 5.5.4. Early Elementary (Ages 6-8)
- 5.5.5. Late Elementary (Ages 9-11)
- 5.5.6. Middle School (Ages 12-14)
- 5.5.7. High School (Ages 15-18)
- 5.6. Western Europe After School Care Market Analysis, Opportunity and Forecast, By Provider Type, 2016-2032
- 5.6.1. Western Europe After School Care Market Analysis by Provider Type: Introduction
- 5.6.2. Market Size Absolute $ Opportunity Analysis and Forecast, By Provider Type, 2016-2032
- 5.6.3. Private Providers
- 5.6.4. Public Providers
- 5.7. Western Europe After School Care Market Analysis, Opportunity and Forecast, By Country , 2016-2032
- 5.7.1. Western Europe After School Care Market Analysis by Country : Introduction
- 5.7.2. Market Size Absolute $ Opportunity Analysis and Forecast, Country , 2016-2032
- 5.7.2.1. Germany
- 5.7.2.2. France
- 5.7.2.3. The UK
- 5.7.2.4. Spain
- 5.7.2.5. Italy
- 5.7.2.6. Portugal
- 5.7.2.7. Ireland
- 5.7.2.8. Austria
- 5.7.2.9. Switzerland
- 5.7.2.10. Benelux
- 5.7.2.11. Nordic
- 5.7.2.12. Rest of Western Europe
- 6. Eastern Europe After School Care Market Analysis, Opportunity and Forecast, 2016-2032
- 6.1. Eastern Europe After School Care Market Analysis, 2016-2021
- 6.2. Eastern Europe After School Care Market Opportunity and Forecast, 2023-2032
- 6.3. Eastern Europe After School Care Market Analysis, Opportunity and Forecast, By Type of Service, 2016-2032
- 6.3.1. Eastern Europe After School Care Market Analysis by Type of Service: Introduction
- 6.3.2. Market Size Absolute $ Opportunity Analysis and Forecast, By Type of Service, 2016-2032
- 6.3.3. Academic Assistance
- 6.3.4. Recreational Activities
- 6.3.5. Extended Day Care
- 6.3.6. Enrichment Programs
- 6.3.7. Others
- 6.4. Eastern Europe After School Care Market Analysis, Opportunity and Forecast, By Program Type, 2016-2032
- 6.4.1. Eastern Europe After School Care Market Analysis by Program Type: Introduction
- 6.4.2. Market Size Absolute $ Opportunity Analysis and Forecast, By Program Type, 2016-2032
- 6.4.3. Center-Based Programs
- 6.4.4. Home-Based Programs
- 6.4.5. School-Based Programs
- 6.4.6. Community-Based Programs
- 6.4.7. Faith-Based Programs
- 6.5. Eastern Europe After School Care Market Analysis, Opportunity and Forecast, By Age Group, 2016-2032
- 6.5.1. Eastern Europe After School Care Market Analysis by Age Group: Introduction
- 6.5.2. Market Size Absolute $ Opportunity Analysis and Forecast, By Age Group, 2016-2032
- 6.5.3. Preschoolers (Ages 3-5)
- 6.5.4. Early Elementary (Ages 6-8)
- 6.5.5. Late Elementary (Ages 9-11)
- 6.5.6. Middle School (Ages 12-14)
- 6.5.7. High School (Ages 15-18)
- 6.6. Eastern Europe After School Care Market Analysis, Opportunity and Forecast, By Provider Type, 2016-2032
- 6.6.1. Eastern Europe After School Care Market Analysis by Provider Type: Introduction
- 6.6.2. Market Size Absolute $ Opportunity Analysis and Forecast, By Provider Type, 2016-2032
- 6.6.3. Private Providers
- 6.6.4. Public Providers
- 6.7. Eastern Europe After School Care Market Analysis, Opportunity and Forecast, By Country , 2016-2032
- 6.7.1. Eastern Europe After School Care Market Analysis by Country : Introduction
- 6.7.2. Market Size Absolute $ Opportunity Analysis and Forecast, Country , 2016-2032
- 6.7.2.1. Russia
- 6.7.2.2. Poland
- 6.7.2.3. The Czech Republic
- 6.7.2.4. Greece
- 6.7.2.5. Rest of Eastern Europe
- 7. APAC After School Care Market Analysis, Opportunity and Forecast, 2016-2032
- 7.1. APAC After School Care Market Analysis, 2016-2021
- 7.2. APAC After School Care Market Opportunity and Forecast, 2023-2032
- 7.3. APAC After School Care Market Analysis, Opportunity and Forecast, By Type of Service, 2016-2032
- 7.3.1. APAC After School Care Market Analysis by Type of Service: Introduction
- 7.3.2. Market Size Absolute $ Opportunity Analysis and Forecast, By Type of Service, 2016-2032
- 7.3.3. Academic Assistance
- 7.3.4. Recreational Activities
- 7.3.5. Extended Day Care
- 7.3.6. Enrichment Programs
- 7.3.7. Others
- 7.4. APAC After School Care Market Analysis, Opportunity and Forecast, By Program Type, 2016-2032
- 7.4.1. APAC After School Care Market Analysis by Program Type: Introduction
- 7.4.2. Market Size Absolute $ Opportunity Analysis and Forecast, By Program Type, 2016-2032
- 7.4.3. Center-Based Programs
- 7.4.4. Home-Based Programs
- 7.4.5. School-Based Programs
- 7.4.6. Community-Based Programs
- 7.4.7. Faith-Based Programs
- 7.5. APAC After School Care Market Analysis, Opportunity and Forecast, By Age Group, 2016-2032
- 7.5.1. APAC After School Care Market Analysis by Age Group: Introduction
- 7.5.2. Market Size Absolute $ Opportunity Analysis and Forecast, By Age Group, 2016-2032
- 7.5.3. Preschoolers (Ages 3-5)
- 7.5.4. Early Elementary (Ages 6-8)
- 7.5.5. Late Elementary (Ages 9-11)
- 7.5.6. Middle School (Ages 12-14)
- 7.5.7. High School (Ages 15-18)
- 7.6. APAC After School Care Market Analysis, Opportunity and Forecast, By Provider Type, 2016-2032
- 7.6.1. APAC After School Care Market Analysis by Provider Type: Introduction
- 7.6.2. Market Size Absolute $ Opportunity Analysis and Forecast, By Provider Type, 2016-2032
- 7.6.3. Private Providers
- 7.6.4. Public Providers
- 7.7. APAC After School Care Market Analysis, Opportunity and Forecast, By Country , 2016-2032
- 7.7.1. APAC After School Care Market Analysis by Country : Introduction
- 7.7.2. Market Size Absolute $ Opportunity Analysis and Forecast, Country , 2016-2032
- 7.7.2.1. China
- 7.7.2.2. Japan
- 7.7.2.3. South Korea
- 7.7.2.4. India
- 7.7.2.5. Australia & New Zeland
- 7.7.2.6. Indonesia
- 7.7.2.7. Malaysia
- 7.7.2.8. Philippines
- 7.7.2.9. Singapore
- 7.7.2.10. Thailand
- 7.7.2.11. Vietnam
- 7.7.2.12. Rest of APAC
- 8. Latin America After School Care Market Analysis, Opportunity and Forecast, 2016-2032
- 8.1. Latin America After School Care Market Analysis, 2016-2021
- 8.2. Latin America After School Care Market Opportunity and Forecast, 2023-2032
- 8.3. Latin America After School Care Market Analysis, Opportunity and Forecast, By Type of Service, 2016-2032
- 8.3.1. Latin America After School Care Market Analysis by Type of Service: Introduction
- 8.3.2. Market Size Absolute $ Opportunity Analysis and Forecast, By Type of Service, 2016-2032
- 8.3.3. Academic Assistance
- 8.3.4. Recreational Activities
- 8.3.5. Extended Day Care
- 8.3.6. Enrichment Programs
- 8.3.7. Others
- 8.4. Latin America After School Care Market Analysis, Opportunity and Forecast, By Program Type, 2016-2032
- 8.4.1. Latin America After School Care Market Analysis by Program Type: Introduction
- 8.4.2. Market Size Absolute $ Opportunity Analysis and Forecast, By Program Type, 2016-2032
- 8.4.3. Center-Based Programs
- 8.4.4. Home-Based Programs
- 8.4.5. School-Based Programs
- 8.4.6. Community-Based Programs
- 8.4.7. Faith-Based Programs
- 8.5. Latin America After School Care Market Analysis, Opportunity and Forecast, By Age Group, 2016-2032
- 8.5.1. Latin America After School Care Market Analysis by Age Group: Introduction
- 8.5.2. Market Size Absolute $ Opportunity Analysis and Forecast, By Age Group, 2016-2032
- 8.5.3. Preschoolers (Ages 3-5)
- 8.5.4. Early Elementary (Ages 6-8)
- 8.5.5. Late Elementary (Ages 9-11)
- 8.5.6. Middle School (Ages 12-14)
- 8.5.7. High School (Ages 15-18)
- 8.6. Latin America After School Care Market Analysis, Opportunity and Forecast, By Provider Type, 2016-2032
- 8.6.1. Latin America After School Care Market Analysis by Provider Type: Introduction
- 8.6.2. Market Size Absolute $ Opportunity Analysis and Forecast, By Provider Type, 2016-2032
- 8.6.3. Private Providers
- 8.6.4. Public Providers
- 8.7. Latin America After School Care Market Analysis, Opportunity and Forecast, By Country , 2016-2032
- 8.7.1. Latin America After School Care Market Analysis by Country : Introduction
- 8.7.2. Market Size Absolute $ Opportunity Analysis and Forecast, Country , 2016-2032
- 8.7.2.1. Brazil
- 8.7.2.2. Colombia
- 8.7.2.3. Chile
- 8.7.2.4. Argentina
- 8.7.2.5. Costa Rica
- 8.7.2.6. Rest of Latin America
- 9. Middle East & Africa After School Care Market Analysis, Opportunity and Forecast, 2016-2032
- 9.1. Middle East & Africa After School Care Market Analysis, 2016-2021
- 9.2. Middle East & Africa After School Care Market Opportunity and Forecast, 2023-2032
- 9.3. Middle East & Africa After School Care Market Analysis, Opportunity and Forecast, By Type of Service, 2016-2032
- 9.3.1. Middle East & Africa After School Care Market Analysis by Type of Service: Introduction
- 9.3.2. Market Size Absolute $ Opportunity Analysis and Forecast, By Type of Service, 2016-2032
- 9.3.3. Academic Assistance
- 9.3.4. Recreational Activities
- 9.3.5. Extended Day Care
- 9.3.6. Enrichment Programs
- 9.3.7. Others
- 9.4. Middle East & Africa After School Care Market Analysis, Opportunity and Forecast, By Program Type, 2016-2032
- 9.4.1. Middle East & Africa After School Care Market Analysis by Program Type: Introduction
- 9.4.2. Market Size Absolute $ Opportunity Analysis and Forecast, By Program Type, 2016-2032
- 9.4.3. Center-Based Programs
- 9.4.4. Home-Based Programs
- 9.4.5. School-Based Programs
- 9.4.6. Community-Based Programs
- 9.4.7. Faith-Based Programs
- 9.5. Middle East & Africa After School Care Market Analysis, Opportunity and Forecast, By Age Group, 2016-2032
- 9.5.1. Middle East & Africa After School Care Market Analysis by Age Group: Introduction
- 9.5.2. Market Size Absolute $ Opportunity Analysis and Forecast, By Age Group, 2016-2032
- 9.5.3. Preschoolers (Ages 3-5)
- 9.5.4. Early Elementary (Ages 6-8)
- 9.5.5. Late Elementary (Ages 9-11)
- 9.5.6. Middle School (Ages 12-14)
- 9.5.7. High School (Ages 15-18)
- 9.6. Middle East & Africa After School Care Market Analysis, Opportunity and Forecast, By Provider Type, 2016-2032
- 9.6.1. Middle East & Africa After School Care Market Analysis by Provider Type: Introduction
- 9.6.2. Market Size Absolute $ Opportunity Analysis and Forecast, By Provider Type, 2016-2032
- 9.6.3. Private Providers
- 9.6.4. Public Providers
- 9.7. Middle East & Africa After School Care Market Analysis, Opportunity and Forecast, By Country , 2016-2032
- 9.7.1. Middle East & Africa After School Care Market Analysis by Country : Introduction
- 9.7.2. Market Size Absolute $ Opportunity Analysis and Forecast, Country , 2016-2032
- 9.7.2.1. Algeria
- 9.7.2.2. Egypt
- 9.7.2.3. Israel
- 9.7.2.4. Kuwait
- 9.7.2.5. Nigeria
- 9.7.2.6. Saudi Arabia
- 9.7.2.7. South Africa
- 9.7.2.8. Turkey
- 9.7.2.9. The UAE
- 9.7.2.10. Rest of MEA
- 10. Global After School Care Market Analysis, Opportunity and Forecast, By Region , 2016-2032
- 10.1. Global After School Care Market Analysis by Region : Introduction
- 10.2. Market Size Absolute $ Opportunity Analysis and Forecast, By Region , 2016-2032
- 10.2.1. North America
- 10.2.2. Western Europe
- 10.2.3. Eastern Europe
- 10.2.4. APAC
- 10.2.5. Latin America
- 10.2.6. Middle East & Africa
- 11. Global After School Care Market Competitive Landscape, Market Share Analysis, and Company Profiles
- 11.1. Market Share Analysis
- 11.2. Company Profiles
- 11.3. KinderCare Education
- 11.3.1. Company Overview
- 11.3.2. Financial Highlights
- 11.3.3. Product Portfolio
- 11.3.4. SWOT Analysis
- 11.3.5. Key Strategies and Developments
- 11.4. YMCA
- 11.4.1. Company Overview
- 11.4.2. Financial Highlights
- 11.4.3. Product Portfolio
- 11.4.4. SWOT Analysis
- 11.4.5. Key Strategies and Developments
- 11.5. Bright Horizons Family Solutions
- 11.5.1. Company Overview
- 11.5.2. Financial Highlights
- 11.5.3. Product Portfolio
- 11.5.4. SWOT Analysis
- 11.5.5. Key Strategies and Developments
- 11.6. Knowledge Universe
- 11.6.1. Company Overview
- 11.6.2. Financial Highlights
- 11.6.3. Product Portfolio
- 11.6.4. SWOT Analysis
- 11.6.5. Key Strategies and Developments
- 11.7. Champions (KinderCare)
- 11.7.1. Company Overview
- 11.7.2. Financial Highlights
- 11.7.3. Product Portfolio
- 11.7.4. SWOT Analysis
- 11.7.5. Key Strategies and Developments
- 11.8. The Learning Experience
- 11.8.1. Company Overview
- 11.8.2. Financial Highlights
- 11.8.3. Product Portfolio
- 11.8.4. SWOT Analysis
- 11.8.5. Key Strategies and Developments
- 11.9. Boys & Girls Clubs of America
- 11.9.1. Company Overview
- 11.9.2. Financial Highlights
- 11.9.3. Product Portfolio
- 11.9.4. SWOT Analysis
- 11.9.5. Key Strategies and Developments
- 11.10. Springboard Education
- 11.10.1. Company Overview
- 11.10.2. Financial Highlights
- 11.10.3. Product Portfolio
- 11.10.4. SWOT Analysis
- 11.10.5. Key Strategies and Developments
- 11.11. The Goddard School
- 11.11.1. Company Overview
- 11.11.2. Financial Highlights
- 11.11.3. Product Portfolio
- 11.11.4. SWOT Analysis
- 11.11.5. Key Strategies and Developments
- 11.12. Primrose Schools
- 11.12.1. Company Overview
- 11.12.2. Financial Highlights
- 11.12.3. Product Portfolio
- 11.12.4. SWOT Analysis
- 11.12.5. Key Strategies and Developments
- 11.13.1. Company Overview
- 11.13.2. Financial Highlights
- 11.13.3. Product Portfolio
- 11.13.4. SWOT Analysis
- 11.13.5. Key Strategies and Developments
- 11.14. La Petite Academy
- 11.14.1. Company Overview
- 11.14.2. Financial Highlights
- 11.14.3. Product Portfolio
- 11.14.4. SWOT Analysis
- 11.14.5. Key Strategies and Developments
- 11.15. Huntington Learning Center
- 11.15.1. Company Overview
- 11.15.2. Financial Highlights
- 11.15.3. Product Portfolio
- 11.15.4. SWOT Analysis
- 11.15.5. Key Strategies and Developments
- 11.16. KLA Schools
- 11.16.1. Company Overview
- 11.16.2. Financial Highlights
- 11.16.3. Product Portfolio
- 11.16.4. SWOT Analysis
- 11.16.5. Key Strategies and Developments
- 11.17. Champions Before and After School Programs
- 11.17.1. Company Overview
- 11.17.2. Financial Highlights
- 11.17.3. Product Portfolio
- 11.17.4. SWOT Analysis
- 11.17.5. Key Strategies and Developments
- 12. Assumptions and Acronyms
- 13. Research Methodology
- 14. Contact
"
- List of Figures
- "
- Figure 1: Global After School Care Market Revenue (US$ Mn) Market Share by Type of Service in 2022
- Figure 2: Global After School Care Market Attractiveness Analysis by Type of Service, 2016-2032
- Figure 3: Global After School Care Market Revenue (US$ Mn) Market Share by Program Typein 2022
- Figure 4: Global After School Care Market Attractiveness Analysis by Program Type, 2016-2032
- Figure 5: Global After School Care Market Revenue (US$ Mn) Market Share by Age Groupin 2022
- Figure 6: Global After School Care Market Attractiveness Analysis by Age Group, 2016-2032
- Figure 7: Global After School Care Market Revenue (US$ Mn) Market Share by Provider Typein 2022
- Figure 8: Global After School Care Market Attractiveness Analysis by Provider Type, 2016-2032
- Figure 9: Global After School Care Market Revenue (US$ Mn) Market Share by Region in 2022
- Figure 10: Global After School Care Market Attractiveness Analysis by Region, 2016-2032
- Figure 11: Global After School Care Market Revenue (US$ Mn) (2016-2032)
- Figure 12: Global After School Care Market Revenue (US$ Mn) Comparison by Region (2016-2032)
- Figure 13: Global After School Care Market Revenue (US$ Mn) Comparison by Type of Service (2016-2032)
- Figure 14: Global After School Care Market Revenue (US$ Mn) Comparison by Program Type (2016-2032)
- Figure 15: Global After School Care Market Revenue (US$ Mn) Comparison by Age Group (2016-2032)
- Figure 16: Global After School Care Market Revenue (US$ Mn) Comparison by Provider Type (2016-2032)
- Figure 17: Global After School Care Market Y-o-Y Growth Rate Comparison by Region (2016-2032)
- Figure 18: Global After School Care Market Y-o-Y Growth Rate Comparison by Type of Service (2016-2032)
- Figure 19: Global After School Care Market Y-o-Y Growth Rate Comparison by Program Type (2016-2032)
- Figure 20: Global After School Care Market Y-o-Y Growth Rate Comparison by Age Group (2016-2032)
- Figure 21: Global After School Care Market Y-o-Y Growth Rate Comparison by Provider Type (2016-2032)
- Figure 22: Global After School Care Market Share Comparison by Region (2016-2032)
- Figure 23: Global After School Care Market Share Comparison by Type of Service (2016-2032)
- Figure 24: Global After School Care Market Share Comparison by Program Type (2016-2032)
- Figure 25: Global After School Care Market Share Comparison by Age Group (2016-2032)
- Figure 26: Global After School Care Market Share Comparison by Provider Type (2016-2032)
- Figure 27: North America After School Care Market Revenue (US$ Mn) Market Share by Type of Servicein 2022
- Figure 28: North America After School Care Market Attractiveness Analysis by Type of Service, 2016-2032
- Figure 29: North America After School Care Market Revenue (US$ Mn) Market Share by Program Typein 2022
- Figure 30: North America After School Care Market Attractiveness Analysis by Program Type, 2016-2032
- Figure 31: North America After School Care Market Revenue (US$ Mn) Market Share by Age Groupin 2022
- Figure 32: North America After School Care Market Attractiveness Analysis by Age Group, 2016-2032
- Figure 33: North America After School Care Market Revenue (US$ Mn) Market Share by Provider Typein 2022
- Figure 34: North America After School Care Market Attractiveness Analysis by Provider Type, 2016-2032
- Figure 35: North America After School Care Market Revenue (US$ Mn) Market Share by Country in 2022
- Figure 36: North America After School Care Market Attractiveness Analysis by Country, 2016-2032
- Figure 37: North America After School Care Market Revenue (US$ Mn) (2016-2032)
- Figure 38: North America After School Care Market Revenue (US$ Mn) Comparison by Country (2016-2032)
- Figure 39: North America After School Care Market Revenue (US$ Mn) Comparison by Type of Service (2016-2032)
- Figure 40: North America After School Care Market Revenue (US$ Mn) Comparison by Program Type (2016-2032)
- Figure 41: North America After School Care Market Revenue (US$ Mn) Comparison by Age Group (2016-2032)
- Figure 42: North America After School Care Market Revenue (US$ Mn) Comparison by Provider Type (2016-2032)
- Figure 43: North America After School Care Market Y-o-Y Growth Rate Comparison by Country (2016-2032)
- Figure 44: North America After School Care Market Y-o-Y Growth Rate Comparison by Type of Service (2016-2032)
- Figure 45: North America After School Care Market Y-o-Y Growth Rate Comparison by Program Type (2016-2032)
- Figure 46: North America After School Care Market Y-o-Y Growth Rate Comparison by Age Group (2016-2032)
- Figure 47: North America After School Care Market Y-o-Y Growth Rate Comparison by Provider Type (2016-2032)
- Figure 48: North America After School Care Market Share Comparison by Country (2016-2032)
- Figure 49: North America After School Care Market Share Comparison by Type of Service (2016-2032)
- Figure 50: North America After School Care Market Share Comparison by Program Type (2016-2032)
- Figure 51: North America After School Care Market Share Comparison by Age Group (2016-2032)
- Figure 52: North America After School Care Market Share Comparison by Provider Type (2016-2032)
- Figure 53: Western Europe After School Care Market Revenue (US$ Mn) Market Share by Type of Servicein 2022
- Figure 54: Western Europe After School Care Market Attractiveness Analysis by Type of Service, 2016-2032
- Figure 55: Western Europe After School Care Market Revenue (US$ Mn) Market Share by Program Typein 2022
- Figure 56: Western Europe After School Care Market Attractiveness Analysis by Program Type, 2016-2032
- Figure 57: Western Europe After School Care Market Revenue (US$ Mn) Market Share by Age Groupin 2022
- Figure 58: Western Europe After School Care Market Attractiveness Analysis by Age Group, 2016-2032
- Figure 59: Western Europe After School Care Market Revenue (US$ Mn) Market Share by Provider Typein 2022
- Figure 60: Western Europe After School Care Market Attractiveness Analysis by Provider Type, 2016-2032
- Figure 61: Western Europe After School Care Market Revenue (US$ Mn) Market Share by Country in 2022
- Figure 62: Western Europe After School Care Market Attractiveness Analysis by Country, 2016-2032
- Figure 63: Western Europe After School Care Market Revenue (US$ Mn) (2016-2032)
- Figure 64: Western Europe After School Care Market Revenue (US$ Mn) Comparison by Country (2016-2032)
- Figure 65: Western Europe After School Care Market Revenue (US$ Mn) Comparison by Type of Service (2016-2032)
- Figure 66: Western Europe After School Care Market Revenue (US$ Mn) Comparison by Program Type (2016-2032)
- Figure 67: Western Europe After School Care Market Revenue (US$ Mn) Comparison by Age Group (2016-2032)
- Figure 68: Western Europe After School Care Market Revenue (US$ Mn) Comparison by Provider Type (2016-2032)
- Figure 69: Western Europe After School Care Market Y-o-Y Growth Rate Comparison by Country (2016-2032)
- Figure 70: Western Europe After School Care Market Y-o-Y Growth Rate Comparison by Type of Service (2016-2032)
- Figure 71: Western Europe After School Care Market Y-o-Y Growth Rate Comparison by Program Type (2016-2032)
- Figure 72: Western Europe After School Care Market Y-o-Y Growth Rate Comparison by Age Group (2016-2032)
- Figure 73: Western Europe After School Care Market Y-o-Y Growth Rate Comparison by Provider Type (2016-2032)
- Figure 74: Western Europe After School Care Market Share Comparison by Country (2016-2032)
- Figure 75: Western Europe After School Care Market Share Comparison by Type of Service (2016-2032)
- Figure 76: Western Europe After School Care Market Share Comparison by Program Type (2016-2032)
- Figure 77: Western Europe After School Care Market Share Comparison by Age Group (2016-2032)
- Figure 78: Western Europe After School Care Market Share Comparison by Provider Type (2016-2032)
- Figure 79: Eastern Europe After School Care Market Revenue (US$ Mn) Market Share by Type of Servicein 2022
- Figure 80: Eastern Europe After School Care Market Attractiveness Analysis by Type of Service, 2016-2032
- Figure 81: Eastern Europe After School Care Market Revenue (US$ Mn) Market Share by Program Typein 2022
- Figure 82: Eastern Europe After School Care Market Attractiveness Analysis by Program Type, 2016-2032
- Figure 83: Eastern Europe After School Care Market Revenue (US$ Mn) Market Share by Age Groupin 2022
- Figure 84: Eastern Europe After School Care Market Attractiveness Analysis by Age Group, 2016-2032
- Figure 85: Eastern Europe After School Care Market Revenue (US$ Mn) Market Share by Provider Typein 2022
- Figure 86: Eastern Europe After School Care Market Attractiveness Analysis by Provider Type, 2016-2032
- Figure 87: Eastern Europe After School Care Market Revenue (US$ Mn) Market Share by Country in 2022
- Figure 88: Eastern Europe After School Care Market Attractiveness Analysis by Country, 2016-2032
- Figure 89: Eastern Europe After School Care Market Revenue (US$ Mn) (2016-2032)
- Figure 90: Eastern Europe After School Care Market Revenue (US$ Mn) Comparison by Country (2016-2032)
- Figure 91: Eastern Europe After School Care Market Revenue (US$ Mn) Comparison by Type of Service (2016-2032)
- Figure 92: Eastern Europe After School Care Market Revenue (US$ Mn) Comparison by Program Type (2016-2032)
- Figure 93: Eastern Europe After School Care Market Revenue (US$ Mn) Comparison by Age Group (2016-2032)
- Figure 94: Eastern Europe After School Care Market Revenue (US$ Mn) Comparison by Provider Type (2016-2032)
- Figure 95: Eastern Europe After School Care Market Y-o-Y Growth Rate Comparison by Country (2016-2032)
- Figure 96: Eastern Europe After School Care Market Y-o-Y Growth Rate Comparison by Type of Service (2016-2032)
- Figure 97: Eastern Europe After School Care Market Y-o-Y Growth Rate Comparison by Program Type (2016-2032)
- Figure 98: Eastern Europe After School Care Market Y-o-Y Growth Rate Comparison by Age Group (2016-2032)
- Figure 99: Eastern Europe After School Care Market Y-o-Y Growth Rate Comparison by Provider Type (2016-2032)
- Figure 100: Eastern Europe After School Care Market Share Comparison by Country (2016-2032)
- Figure 101: Eastern Europe After School Care Market Share Comparison by Type of Service (2016-2032)
- Figure 102: Eastern Europe After School Care Market Share Comparison by Program Type (2016-2032)
- Figure 103: Eastern Europe After School Care Market Share Comparison by Age Group (2016-2032)
- Figure 104: Eastern Europe After School Care Market Share Comparison by Provider Type (2016-2032)
- Figure 105: APAC After School Care Market Revenue (US$ Mn) Market Share by Type of Servicein 2022
- Figure 106: APAC After School Care Market Attractiveness Analysis by Type of Service, 2016-2032
- Figure 107: APAC After School Care Market Revenue (US$ Mn) Market Share by Program Typein 2022
- Figure 108: APAC After School Care Market Attractiveness Analysis by Program Type, 2016-2032
- Figure 109: APAC After School Care Market Revenue (US$ Mn) Market Share by Age Groupin 2022
- Figure 110: APAC After School Care Market Attractiveness Analysis by Age Group, 2016-2032
- Figure 111: APAC After School Care Market Revenue (US$ Mn) Market Share by Provider Typein 2022
- Figure 112: APAC After School Care Market Attractiveness Analysis by Provider Type, 2016-2032
- Figure 113: APAC After School Care Market Revenue (US$ Mn) Market Share by Country in 2022
- Figure 114: APAC After School Care Market Attractiveness Analysis by Country, 2016-2032
- Figure 115: APAC After School Care Market Revenue (US$ Mn) (2016-2032)
- Figure 116: APAC After School Care Market Revenue (US$ Mn) Comparison by Country (2016-2032)
- Figure 117: APAC After School Care Market Revenue (US$ Mn) Comparison by Type of Service (2016-2032)
- Figure 118: APAC After School Care Market Revenue (US$ Mn) Comparison by Program Type (2016-2032)
- Figure 119: APAC After School Care Market Revenue (US$ Mn) Comparison by Age Group (2016-2032)
- Figure 120: APAC After School Care Market Revenue (US$ Mn) Comparison by Provider Type (2016-2032)
- Figure 121: APAC After School Care Market Y-o-Y Growth Rate Comparison by Country (2016-2032)
- Figure 122: APAC After School Care Market Y-o-Y Growth Rate Comparison by Type of Service (2016-2032)
- Figure 123: APAC After School Care Market Y-o-Y Growth Rate Comparison by Program Type (2016-2032)
- Figure 124: APAC After School Care Market Y-o-Y Growth Rate Comparison by Age Group (2016-2032)
- Figure 125: APAC After School Care Market Y-o-Y Growth Rate Comparison by Provider Type (2016-2032)
- Figure 126: APAC After School Care Market Share Comparison by Country (2016-2032)
- Figure 127: APAC After School Care Market Share Comparison by Type of Service (2016-2032)
- Figure 128: APAC After School Care Market Share Comparison by Program Type (2016-2032)
- Figure 129: APAC After School Care Market Share Comparison by Age Group (2016-2032)
- Figure 130: APAC After School Care Market Share Comparison by Provider Type (2016-2032)
- Figure 131: Latin America After School Care Market Revenue (US$ Mn) Market Share by Type of Servicein 2022
- Figure 132: Latin America After School Care Market Attractiveness Analysis by Type of Service, 2016-2032
- Figure 133: Latin America After School Care Market Revenue (US$ Mn) Market Share by Program Typein 2022
- Figure 134: Latin America After School Care Market Attractiveness Analysis by Program Type, 2016-2032
- Figure 135: Latin America After School Care Market Revenue (US$ Mn) Market Share by Age Groupin 2022
- Figure 136: Latin America After School Care Market Attractiveness Analysis by Age Group, 2016-2032
- Figure 137: Latin America After School Care Market Revenue (US$ Mn) Market Share by Provider Typein 2022
- Figure 138: Latin America After School Care Market Attractiveness Analysis by Provider Type, 2016-2032
- Figure 139: Latin America After School Care Market Revenue (US$ Mn) Market Share by Country in 2022
- Figure 140: Latin America After School Care Market Attractiveness Analysis by Country, 2016-2032
- Figure 141: Latin America After School Care Market Revenue (US$ Mn) (2016-2032)
- Figure 142: Latin America After School Care Market Revenue (US$ Mn) Comparison by Country (2016-2032)
- Figure 143: Latin America After School Care Market Revenue (US$ Mn) Comparison by Type of Service (2016-2032)
- Figure 144: Latin America After School Care Market Revenue (US$ Mn) Comparison by Program Type (2016-2032)
- Figure 145: Latin America After School Care Market Revenue (US$ Mn) Comparison by Age Group (2016-2032)
- Figure 146: Latin America After School Care Market Revenue (US$ Mn) Comparison by Provider Type (2016-2032)
- Figure 147: Latin America After School Care Market Y-o-Y Growth Rate Comparison by Country (2016-2032)
- Figure 148: Latin America After School Care Market Y-o-Y Growth Rate Comparison by Type of Service (2016-2032)
- Figure 149: Latin America After School Care Market Y-o-Y Growth Rate Comparison by Program Type (2016-2032)
- Figure 150: Latin America After School Care Market Y-o-Y Growth Rate Comparison by Age Group (2016-2032)
- Figure 151: Latin America After School Care Market Y-o-Y Growth Rate Comparison by Provider Type (2016-2032)
- Figure 152: Latin America After School Care Market Share Comparison by Country (2016-2032)
- Figure 153: Latin America After School Care Market Share Comparison by Type of Service (2016-2032)
- Figure 154: Latin America After School Care Market Share Comparison by Program Type (2016-2032)
- Figure 155: Latin America After School Care Market Share Comparison by Age Group (2016-2032)
- Figure 156: Latin America After School Care Market Share Comparison by Provider Type (2016-2032)
- Figure 157: Middle East & Africa After School Care Market Revenue (US$ Mn) Market Share by Type of Servicein 2022
- Figure 158: Middle East & Africa After School Care Market Attractiveness Analysis by Type of Service, 2016-2032
- Figure 159: Middle East & Africa After School Care Market Revenue (US$ Mn) Market Share by Program Typein 2022
- Figure 160: Middle East & Africa After School Care Market Attractiveness Analysis by Program Type, 2016-2032
- Figure 161: Middle East & Africa After School Care Market Revenue (US$ Mn) Market Share by Age Groupin 2022
- Figure 162: Middle East & Africa After School Care Market Attractiveness Analysis by Age Group, 2016-2032
- Figure 163: Middle East & Africa After School Care Market Revenue (US$ Mn) Market Share by Provider Typein 2022
- Figure 164: Middle East & Africa After School Care Market Attractiveness Analysis by Provider Type, 2016-2032
- Figure 165: Middle East & Africa After School Care Market Revenue (US$ Mn) Market Share by Country in 2022
- Figure 166: Middle East & Africa After School Care Market Attractiveness Analysis by Country, 2016-2032
- Figure 167: Middle East & Africa After School Care Market Revenue (US$ Mn) (2016-2032)
- Figure 168: Middle East & Africa After School Care Market Revenue (US$ Mn) Comparison by Country (2016-2032)
- Figure 169: Middle East & Africa After School Care Market Revenue (US$ Mn) Comparison by Type of Service (2016-2032)
- Figure 170: Middle East & Africa After School Care Market Revenue (US$ Mn) Comparison by Program Type (2016-2032)
- Figure 171: Middle East & Africa After School Care Market Revenue (US$ Mn) Comparison by Age Group (2016-2032)
- Figure 172: Middle East & Africa After School Care Market Revenue (US$ Mn) Comparison by Provider Type (2016-2032)
- Figure 173: Middle East & Africa After School Care Market Y-o-Y Growth Rate Comparison by Country (2016-2032)
- Figure 174: Middle East & Africa After School Care Market Y-o-Y Growth Rate Comparison by Type of Service (2016-2032)
- Figure 175: Middle East & Africa After School Care Market Y-o-Y Growth Rate Comparison by Program Type (2016-2032)
- Figure 176: Middle East & Africa After School Care Market Y-o-Y Growth Rate Comparison by Age Group (2016-2032)
- Figure 177: Middle East & Africa After School Care Market Y-o-Y Growth Rate Comparison by Provider Type (2016-2032)
- Figure 178: Middle East & Africa After School Care Market Share Comparison by Country (2016-2032)
- Figure 179: Middle East & Africa After School Care Market Share Comparison by Type of Service (2016-2032)
- Figure 180: Middle East & Africa After School Care Market Share Comparison by Program Type (2016-2032)
- Figure 181: Middle East & Africa After School Care Market Share Comparison by Age Group (2016-2032)
- Figure 182: Middle East & Africa After School Care Market Share Comparison by Provider Type (2016-2032)
"
- List of Tables
- "
- Table 1: Global After School Care Market Comparison by Type of Service (2016-2032)
- Table 2: Global After School Care Market Comparison by Program Type (2016-2032)
- Table 3: Global After School Care Market Comparison by Age Group (2016-2032)
- Table 4: Global After School Care Market Comparison by Provider Type (2016-2032)
- Table 5: Global After School Care Market Revenue (US$ Mn) Comparison by Region (2016-2032)
- Table 6: Global After School Care Market Revenue (US$ Mn) (2016-2032)
- Table 7: Global After School Care Market Revenue (US$ Mn) Comparison by Region (2016-2032)
- Table 8: Global After School Care Market Revenue (US$ Mn) Comparison by Type of Service (2016-2032)
- Table 9: Global After School Care Market Revenue (US$ Mn) Comparison by Program Type (2016-2032)
- Table 10: Global After School Care Market Revenue (US$ Mn) Comparison by Age Group (2016-2032)
- Table 11: Global After School Care Market Revenue (US$ Mn) Comparison by Provider Type (2016-2032)
- Table 12: Global After School Care Market Y-o-Y Growth Rate Comparison by Region (2016-2032)
- Table 13: Global After School Care Market Y-o-Y Growth Rate Comparison by Type of Service (2016-2032)
- Table 14: Global After School Care Market Y-o-Y Growth Rate Comparison by Program Type (2016-2032)
- Table 15: Global After School Care Market Y-o-Y Growth Rate Comparison by Age Group (2016-2032)
- Table 16: Global After School Care Market Y-o-Y Growth Rate Comparison by Provider Type (2016-2032)
- Table 17: Global After School Care Market Share Comparison by Region (2016-2032)
- Table 18: Global After School Care Market Share Comparison by Type of Service (2016-2032)
- Table 19: Global After School Care Market Share Comparison by Program Type (2016-2032)
- Table 20: Global After School Care Market Share Comparison by Age Group (2016-2032)
- Table 21: Global After School Care Market Share Comparison by Provider Type (2016-2032)
- Table 22: North America After School Care Market Comparison by Program Type (2016-2032)
- Table 23: North America After School Care Market Comparison by Age Group (2016-2032)
- Table 24: North America After School Care Market Comparison by Provider Type (2016-2032)
- Table 25: North America After School Care Market Revenue (US$ Mn) Comparison by Country (2016-2032)
- Table 26: North America After School Care Market Revenue (US$ Mn) (2016-2032)
- Table 27: North America After School Care Market Revenue (US$ Mn) Comparison by Country (2016-2032)
- Table 28: North America After School Care Market Revenue (US$ Mn) Comparison by Type of Service (2016-2032)
- Table 29: North America After School Care Market Revenue (US$ Mn) Comparison by Program Type (2016-2032)
- Table 30: North America After School Care Market Revenue (US$ Mn) Comparison by Age Group (2016-2032)
- Table 31: North America After School Care Market Revenue (US$ Mn) Comparison by Provider Type (2016-2032)
- Table 32: North America After School Care Market Y-o-Y Growth Rate Comparison by Country (2016-2032)
- Table 33: North America After School Care Market Y-o-Y Growth Rate Comparison by Type of Service (2016-2032)
- Table 34: North America After School Care Market Y-o-Y Growth Rate Comparison by Program Type (2016-2032)
- Table 35: North America After School Care Market Y-o-Y Growth Rate Comparison by Age Group (2016-2032)
- Table 36: North America After School Care Market Y-o-Y Growth Rate Comparison by Provider Type (2016-2032)
- Table 37: North America After School Care Market Share Comparison by Country (2016-2032)
- Table 38: North America After School Care Market Share Comparison by Type of Service (2016-2032)
- Table 39: North America After School Care Market Share Comparison by Program Type (2016-2032)
- Table 40: North America After School Care Market Share Comparison by Age Group (2016-2032)
- Table 41: North America After School Care Market Share Comparison by Provider Type (2016-2032)
- Table 42: Western Europe After School Care Market Comparison by Type of Service (2016-2032)
- Table 43: Western Europe After School Care Market Comparison by Program Type (2016-2032)
- Table 44: Western Europe After School Care Market Comparison by Age Group (2016-2032)
- Table 45: Western Europe After School Care Market Comparison by Provider Type (2016-2032)
- Table 46: Western Europe After School Care Market Revenue (US$ Mn) Comparison by Country (2016-2032)
- Table 47: Western Europe After School Care Market Revenue (US$ Mn) (2016-2032)
- Table 48: Western Europe After School Care Market Revenue (US$ Mn) Comparison by Country (2016-2032)
- Table 49: Western Europe After School Care Market Revenue (US$ Mn) Comparison by Type of Service (2016-2032)
- Table 50: Western Europe After School Care Market Revenue (US$ Mn) Comparison by Program Type (2016-2032)
- Table 51: Western Europe After School Care Market Revenue (US$ Mn) Comparison by Age Group (2016-2032)
- Table 52: Western Europe After School Care Market Revenue (US$ Mn) Comparison by Provider Type (2016-2032)
- Table 53: Western Europe After School Care Market Y-o-Y Growth Rate Comparison by Country (2016-2032)
- Table 54: Western Europe After School Care Market Y-o-Y Growth Rate Comparison by Type of Service (2016-2032)
- Table 55: Western Europe After School Care Market Y-o-Y Growth Rate Comparison by Program Type (2016-2032)
- Table 56: Western Europe After School Care Market Y-o-Y Growth Rate Comparison by Age Group (2016-2032)
- Table 57: Western Europe After School Care Market Y-o-Y Growth Rate Comparison by Provider Type (2016-2032)
- Table 58: Western Europe After School Care Market Share Comparison by Country (2016-2032)
- Table 59: Western Europe After School Care Market Share Comparison by Type of Service (2016-2032)
- Table 60: Western Europe After School Care Market Share Comparison by Program Type (2016-2032)
- Table 61: Western Europe After School Care Market Share Comparison by Age Group (2016-2032)
- Table 62: Western Europe After School Care Market Share Comparison by Provider Type (2016-2032)
- Table 63: Eastern Europe After School Care Market Comparison by Type of Service (2016-2032)
- Table 64: Eastern Europe After School Care Market Comparison by Program Type (2016-2032)
- Table 65: Eastern Europe After School Care Market Comparison by Age Group (2016-2032)
- Table 66: Eastern Europe After School Care Market Comparison by Provider Type (2016-2032)
- Table 67: Eastern Europe After School Care Market Revenue (US$ Mn) Comparison by Country (2016-2032)
- Table 68: Eastern Europe After School Care Market Revenue (US$ Mn) (2016-2032)
- Table 69: Eastern Europe After School Care Market Revenue (US$ Mn) Comparison by Country (2016-2032)
- Table 70: Eastern Europe After School Care Market Revenue (US$ Mn) Comparison by Type of Service (2016-2032)
- Table 71: Eastern Europe After School Care Market Revenue (US$ Mn) Comparison by Program Type (2016-2032)
- Table 72: Eastern Europe After School Care Market Revenue (US$ Mn) Comparison by Age Group (2016-2032)
- Table 73: Eastern Europe After School Care Market Revenue (US$ Mn) Comparison by Provider Type (2016-2032)
- Table 74: Eastern Europe After School Care Market Y-o-Y Growth Rate Comparison by Country (2016-2032)
- Table 75: Eastern Europe After School Care Market Y-o-Y Growth Rate Comparison by Type of Service (2016-2032)
- Table 76: Eastern Europe After School Care Market Y-o-Y Growth Rate Comparison by Program Type (2016-2032)
- Table 77: Eastern Europe After School Care Market Y-o-Y Growth Rate Comparison by Age Group (2016-2032)
- Table 78: Eastern Europe After School Care Market Y-o-Y Growth Rate Comparison by Provider Type (2016-2032)
- Table 79: Eastern Europe After School Care Market Share Comparison by Country (2016-2032)
- Table 80: Eastern Europe After School Care Market Share Comparison by Type of Service (2016-2032)
- Table 81: Eastern Europe After School Care Market Share Comparison by Program Type (2016-2032)
- Table 82: Eastern Europe After School Care Market Share Comparison by Age Group (2016-2032)
- Table 83: Eastern Europe After School Care Market Share Comparison by Provider Type (2016-2032)
- Table 84: APAC After School Care Market Comparison by Type of Service (2016-2032)
- Table 85: APAC After School Care Market Comparison by Program Type (2016-2032)
- Table 86: APAC After School Care Market Comparison by Age Group (2016-2032)
- Table 87: APAC After School Care Market Comparison by Provider Type (2016-2032)
- Table 88: APAC After School Care Market Revenue (US$ Mn) Comparison by Country (2016-2032)
- Table 89: APAC After School Care Market Revenue (US$ Mn) (2016-2032)
- Table 90: APAC After School Care Market Revenue (US$ Mn) Comparison by Country (2016-2032)
- Table 91: APAC After School Care Market Revenue (US$ Mn) Comparison by Type of Service (2016-2032)
- Table 92: APAC After School Care Market Revenue (US$ Mn) Comparison by Program Type (2016-2032)
- Table 93: APAC After School Care Market Revenue (US$ Mn) Comparison by Age Group (2016-2032)
- Table 94: APAC After School Care Market Revenue (US$ Mn) Comparison by Provider Type (2016-2032)
- Table 95: APAC After School Care Market Y-o-Y Growth Rate Comparison by Country (2016-2032)
- Table 96: APAC After School Care Market Y-o-Y Growth Rate Comparison by Type of Service (2016-2032)
- Table 97: APAC After School Care Market Y-o-Y Growth Rate Comparison by Program Type (2016-2032)
- Table 98: APAC After School Care Market Y-o-Y Growth Rate Comparison by Age Group (2016-2032)
- Table 99: APAC After School Care Market Y-o-Y Growth Rate Comparison by Provider Type (2016-2032)
- Table 100: APAC After School Care Market Share Comparison by Country (2016-2032)
- Table 101: APAC After School Care Market Share Comparison by Type of Service (2016-2032)
- Table 102: APAC After School Care Market Share Comparison by Program Type (2016-2032)
- Table 103: APAC After School Care Market Share Comparison by Age Group (2016-2032)
- Table 104: APAC After School Care Market Share Comparison by Provider Type (2016-2032)
- Table 105: Latin America After School Care Market Comparison by Type of Service (2016-2032)
- Table 106: Latin America After School Care Market Comparison by Program Type (2016-2032)
- Table 107: Latin America After School Care Market Comparison by Age Group (2016-2032)
- Table 108: Latin America After School Care Market Comparison by Provider Type (2016-2032)
- Table 109: Latin America After School Care Market Revenue (US$ Mn) Comparison by Country (2016-2032)
- Table 110: Latin America After School Care Market Revenue (US$ Mn) (2016-2032)
- Table 111: Latin America After School Care Market Revenue (US$ Mn) Comparison by Country (2016-2032)
- Table 112: Latin America After School Care Market Revenue (US$ Mn) Comparison by Type of Service (2016-2032)
- Table 113: Latin America After School Care Market Revenue (US$ Mn) Comparison by Program Type (2016-2032)
- Table 114: Latin America After School Care Market Revenue (US$ Mn) Comparison by Age Group (2016-2032)
- Table 115: Latin America After School Care Market Revenue (US$ Mn) Comparison by Provider Type (2016-2032)
- Table 116: Latin America After School Care Market Y-o-Y Growth Rate Comparison by Country (2016-2032)
- Table 117: Latin America After School Care Market Y-o-Y Growth Rate Comparison by Type of Service (2016-2032)
- Table 118: Latin America After School Care Market Y-o-Y Growth Rate Comparison by Program Type (2016-2032)
- Table 119: Latin America After School Care Market Y-o-Y Growth Rate Comparison by Age Group (2016-2032)
- Table 120: Latin America After School Care Market Y-o-Y Growth Rate Comparison by Provider Type (2016-2032)
- Table 121: Latin America After School Care Market Share Comparison by Country (2016-2032)
- Table 122: Latin America After School Care Market Share Comparison by Type of Service (2016-2032)
- Table 123: Latin America After School Care Market Share Comparison by Program Type (2016-2032)
- Table 124: Latin America After School Care Market Share Comparison by Age Group (2016-2032)
- Table 125: Latin America After School Care Market Share Comparison by Provider Type (2016-2032)
- Table 126: Middle East & Africa After School Care Market Comparison by Type of Service (2016-2032)
- Table 127: Middle East & Africa After School Care Market Comparison by Program Type (2016-2032)
- Table 128: Middle East & Africa After School Care Market Comparison by Age Group (2016-2032)
- Table 129: Middle East & Africa After School Care Market Comparison by Provider Type (2016-2032)
- Table 130: Middle East & Africa After School Care Market Revenue (US$ Mn) Comparison by Country (2016-2032)
- Table 131: Middle East & Africa After School Care Market Revenue (US$ Mn) (2016-2032)
- Table 132: Middle East & Africa After School Care Market Revenue (US$ Mn) Comparison by Country (2016-2032)
- Table 133: Middle East & Africa After School Care Market Revenue (US$ Mn) Comparison by Type of Service (2016-2032)
- Table 134: Middle East & Africa After School Care Market Revenue (US$ Mn) Comparison by Program Type (2016-2032)
- Table 135: Middle East & Africa After School Care Market Revenue (US$ Mn) Comparison by Age Group (2016-2032)
- Table 136: Middle East & Africa After School Care Market Revenue (US$ Mn) Comparison by Provider Type (2016-2032)
- Table 137: Middle East & Africa After School Care Market Y-o-Y Growth Rate Comparison by Country (2016-2032)
- Table 138: Middle East & Africa After School Care Market Y-o-Y Growth Rate Comparison by Type of Service (2016-2032)
- Table 139: Middle East & Africa After School Care Market Y-o-Y Growth Rate Comparison by Program Type (2016-2032)
- Table 140: Middle East & Africa After School Care Market Y-o-Y Growth Rate Comparison by Age Group (2016-2032)
- Table 141: Middle East & Africa After School Care Market Y-o-Y Growth Rate Comparison by Provider Type (2016-2032)
- Table 142: Middle East & Africa After School Care Market Share Comparison by Country (2016-2032)
- Table 143: Middle East & Africa After School Care Market Share Comparison by Type of Service (2016-2032)
- Table 144: Middle East & Africa After School Care Market Share Comparison by Program Type (2016-2032)
- Table 145: Middle East & Africa After School Care Market Share Comparison by Age Group (2016-2032)
- Table 146: Middle East & Africa After School Care Market Share Comparison by Provider Type (2016-2032)
- 1. Executive Summary
-
- Young Men's Christian Association (YMCA)
- Boys & Girls Clubs of America
- After-School All-Stars
- WINGS for Kids
- CareforKids
- Bright Horizons Family Solutions
- KinderCare Education
- Primrose Schools
- Afterschool Alliance
- Sylvan Learning
- Children's Learning Adventure
- The Learning Experience
- Club Z! Tutoring
Our Clients


View Our Licence Options
