
Global Aerospace Raw Materials Market By Platform Type(Commercial Aircraft, Regional Aircraft, General Aviation, Military Aircraft, Helicopter, Spacecraft), By Material Type(Titanium & Alloys, Aluminum & Alloys, Steel & Alloys, Composites, Others), By Sales Channel Type(Direct Sales, Distributor Sales), By Region And Companies - Industry Segment Outlook, Market Assessment, Competition Scenario, Trends, And Forecast 2024-2033
-
46235
-
May 2024
-
300
-


-
This report was compiled by Research Team Research team of over 50 passionate professionals leverages advanced research methodologies and analytical expertise to deliver insightful, data-driven market intelligence that empowers businesses across diverse industries to make strategic, well-informed Correspondence Research Team Linkedin | Detailed Market research Methodology Our methodology involves a mix of primary research, including interviews with leading mental health experts, and secondary research from reputable medical journals and databases. View Detailed Methodology Page
-
Quick Navigation
Report Overview
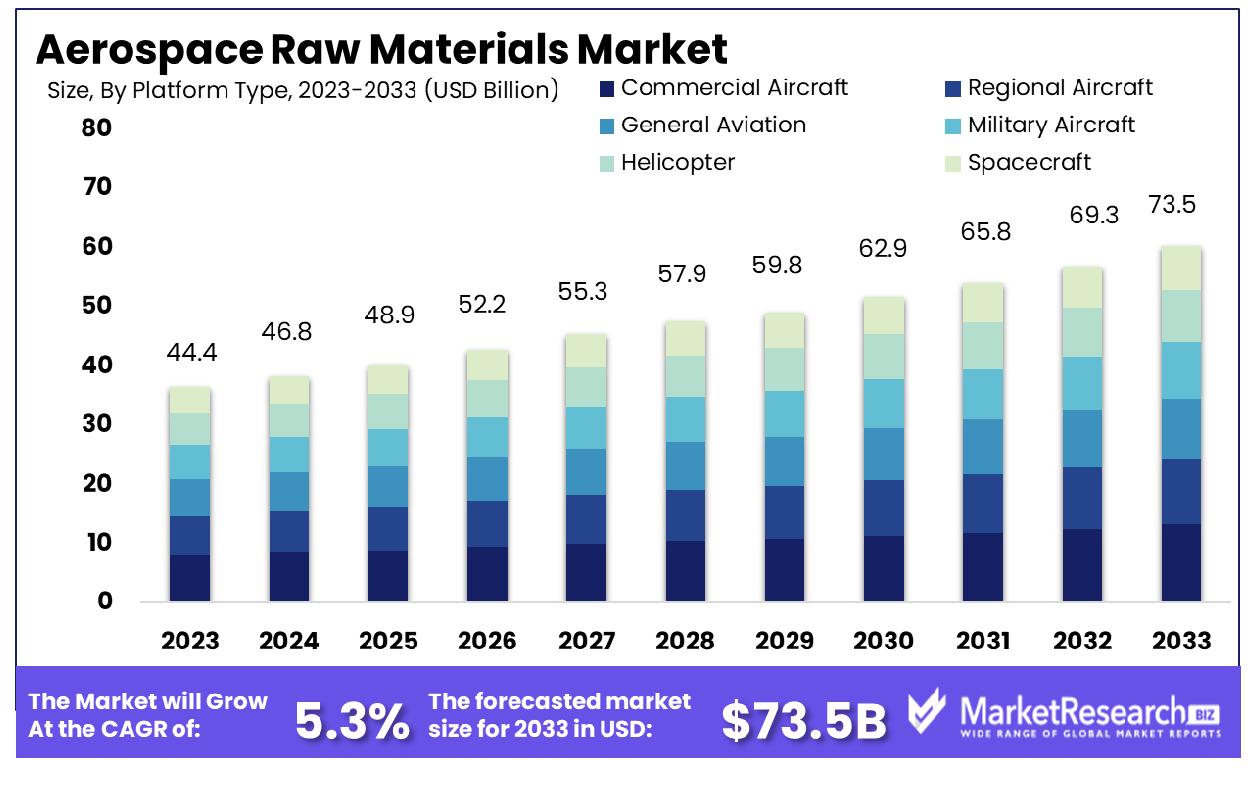
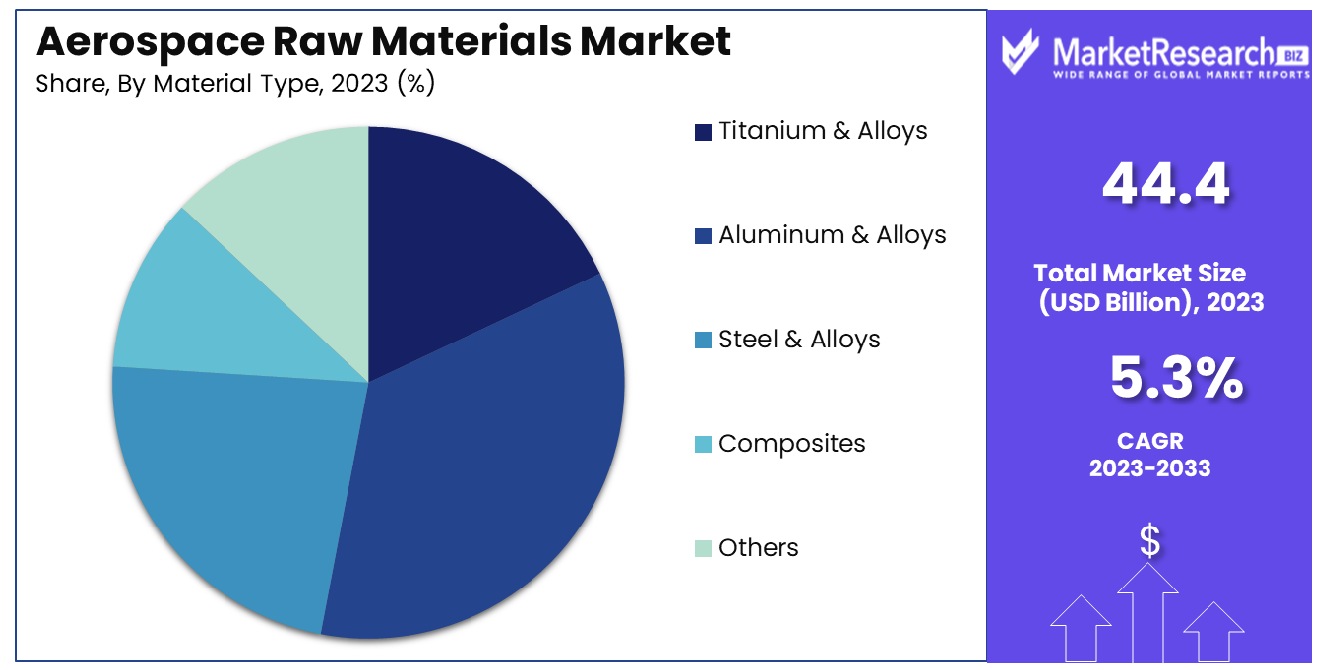
The Global Aerospace Raw Materials Market was valued at USD 44.4 billion in 2023. It is expected to reach USD 73.5 billion by 2033, with a CAGR of 5.3% during the forecast period from 2024 to 2033.
The Aerospace Raw Materials Market encompasses the procurement and utilization of essential materials required for manufacturing aerospace components and structures. This market is pivotal in sourcing metals like aluminum and titanium, advanced composites, alloys, and thermoplastics, which are integral for crafting airframes, engines, and interior fittings.
The strategic selection of these materials directly influences the performance, weight, and durability of aerospace products, thereby impacting overall industry competitiveness and innovation. Vice Presidents, CEOs, Chief Marketing Officers, and Product Managers within the aerospace sector must prioritize advancements and sustainability in this market to enhance product efficiency and meet stringent regulatory standards.
The Aerospace Raw Materials Market is currently undergoing significant transformations driven by fluctuations in material costs and demands for advanced, lightweight materials. Notably, the price of stainless steel, a critical component in aerospace manufacturing, has doubled since September 2022. This surge has elevated overall raw material costs by 69% over the past year, posing financial challenges for manufacturers and impacting production costs across the industry. Despite these hurdles, the market exhibits robust growth potential, projected to expand at a compound annual growth rate (CAGR) of 6.46% and reach USD 11.39 billion by 2030.
This growth trajectory is supported by the increasing demand for more fuel-efficient and environmentally friendly aircraft, which necessitates continuous innovation in materials technology. Manufacturers are compelled to explore alternative materials and composites that can reduce aircraft weight without compromising structural integrity. Moreover, the adoption of these advanced materials aligns with the industry's shift towards sustainability, aiming to reduce the environmental impact of aviation.
For industry leaders, navigating these cost dynamics while investing in research and development for sustainable materials is crucial. They must strategically manage their supply chains to mitigate the risks associated with price volatility and ensure steady material availability. This approach will not only address immediate cost concerns but also position companies competitively in a market that values technological advancement and environmental responsibility.
Key Takeaways
- Market Growth: The Global Aerospace Raw Materials Market was valued at USD 44.4 billion in 2023. It is expected to reach USD 73.5 billion by 2033, with a CAGR of 5.3% during the forecast period from 2024 to 2033.
- By Platform Type: Commercial aircraft led with a 45% share.
- By Material Type: Aluminum and alloys held a 40% dominance.
- By Sales Channel Type: Distributor sales commanded a 65% majority.
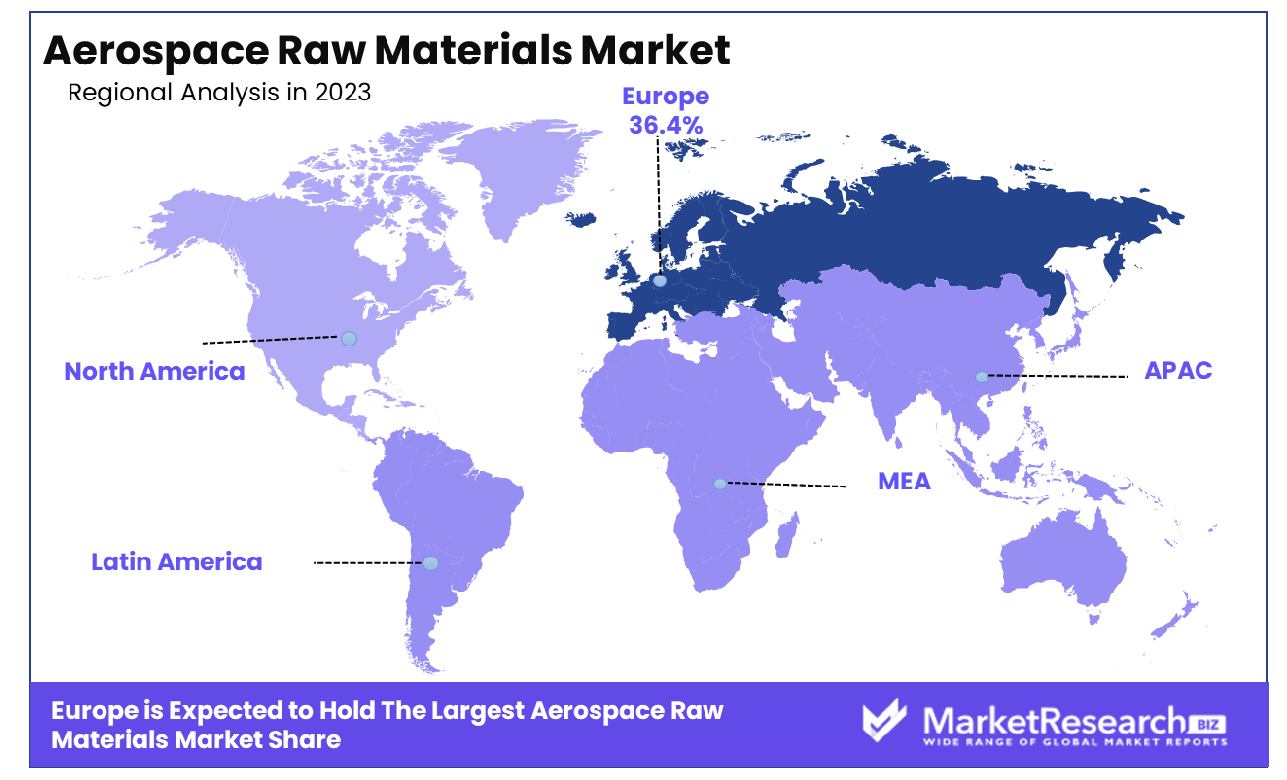
- Regional Dominance: Europe holds 36.4% of the aerospace raw materials market.
- Growth Opportunity: In 2023, the aerospace raw materials market is thriving due to a focus on sustainability and enhanced R&D for innovative, environmentally friendly, and efficient materials.
Driving factors
Global Aerospace Industry Expansion and Rising Air Travel Demand
The global aerospace industry is undergoing rapid expansion, driven primarily by increasing demand for air travel, particularly in emerging markets. This surge in air traffic is compelling aerospace companies to expand their fleets, directly influencing the demand for aerospace raw materials. The growing number of aircraft orders is reflected in production forecasts, with Boeing projecting a need for 43,610 new aircraft over the next 20 years, a testament to the ongoing growth trajectory of the aerospace sector.
This escalation is not only boosting the volume demand for raw materials such as aluminum, titanium, and composites but is also pushing the market towards more innovative, lightweight materials that contribute to fuel efficiency and emissions reductions.
Technological Advancements and R&D in Aerospace
Technological advancements and robust research and development (R&D) initiatives are pivotal in shaping the aerospace raw materials market. The shift towards next-generation aircraft that are lighter, more fuel-efficient, and capable of reducing carbon footprints drives the need for advanced materials.
For instance, the integration of carbon fiber reinforced polymers (CFRP) and other composite materials enhances aircraft performance by reducing weight and increasing durability and resistance to environmental factors. The continuous innovation in material science, supported by substantial R&D investments by key aerospace players, is essential for developing materials that meet the evolving standards of the aerospace industry.
Global Demand for New and Efficient Aerospace Materials
The global push for new and efficient aerospace materials is closely linked to environmental sustainability goals and the need for operational efficiency in the aerospace sector. With stringent environmental regulations and rising fuel prices, the industry is compelled to adopt materials that contribute to the overall efficiency of aircraft.
Materials such as advanced alloys and composites are being increasingly preferred for their benefits in weight reduction and maintenance costs, leading to their expanded use in both military and commercial aircraft. The demand for these innovative materials is expected to grow, as they are critical to achieving the industry's goals of sustainability and cost-effectiveness in operations.
Restraining Factors
Industry Shifts Impacting Metal Utilization
Changes within the aerospace industry, particularly the shift towards composite materials and away from traditional metals like aluminum and titanium, significantly impact the dynamics of the aerospace raw materials market. This transition is driven by the demand for more fuel-efficient and lighter aircraft. As a result, the usage of metals is evolving, with a notable reduction in the preference for heavy metals and an increased incorporation of lighter alloys and composites.
For instance, the Boeing 787 and Airbus A350 series have set trends by incorporating approximately 50% composite materials in their structures, directly influencing the demand and market dynamics for traditional aerospace metals. This shift poses challenges for suppliers and manufacturers of these metals, compelling them to innovate and diversify their offerings to include advanced materials that align with current industry preferences.
Stringent Security and Regulatory Challenges
The aerospace raw materials market is further constrained by stringent security and regulatory policies, especially within the defense sector. These regulations dictate the standards for material composition, quality, and sourcing, which can significantly slow down production processes and increase costs. For example, materials used in military aircraft must comply with rigorous safety and performance standards, often requiring extensive testing and certification.
This regulatory environment, while crucial for safety and reliability, often acts as a barrier to the rapid adoption of new materials and technologies, thereby restraining market growth. The defense sector's need for materials that meet high security and performance specifications can limit the market's ability to quickly adapt to new technologies and material innovations.
By Platform Type Analysis
Commercial aircraft held a dominant 45% market share by platform type.
In 2023, Commercial Aircraft held a dominant market position in the By Platform Type segment of the Aerospace Raw Materials Market, capturing more than 45% of the market share. This segment's strong performance is primarily attributed to the increasing demand for new aircraft to accommodate the global surge in air travel and the replacement of older aircraft with more fuel-efficient models. The aerospace industry's focus on sustainability has also driven the demand for advanced lightweight materials, contributing to the growth of this segment.
Following Commercial Aircraft, the segments of Regional Aircraft and General Aviation also showed significant market activity. Regional Aircraft accounted for approximately 20% of the market, supported by the rising demand for short-haul flights and the expansion of regional air services. General Aviation, which includes private and business aircraft, held about 15% of the market, benefitting from the increasing number of high-net-worth individuals and the demand for personalized travel.
Military Aircraft and Helicopters represented smaller yet vital segments of the aerospace raw materials market. Military Aircraft accounted for around 10% of the market, driven by global increases in defense budgets and ongoing technological upgrades. The Helicopter segment, holding a 5% market share, saw growth due to its versatile applications in disaster relief, medical evacuation, and transportation in remote areas.
The Spacecraft segment, though the smallest, captured about 5% of the market. This segment is poised for growth with rising investments in space exploration and satellite deployment by both governmental and private entities. The demand for materials capable of withstanding extreme space conditions supports this segment's expansion.
Collectively, these segments underscore the diverse applications and dynamic nature of the Aerospace Raw Materials Market, reflecting different growth drivers and technological advancements across platforms.
By Material Type Analysis
Aluminum and alloys led the materials segment, capturing 40% of the market.
In 2023, Aluminum & Alloys held a dominant market position in the By Material Type segment of the Aerospace Raw Materials Market, capturing more than 40% of the market share. Aluminum & Alloys are favored in the aerospace industry due to their strength-to-weight ratio, corrosion resistance, and cost-effectiveness, which are crucial for aircraft performance and fuel efficiency.
Following closely, Composites accounted for approximately 25% of the market. The rising adoption of composites is driven by their advantages in reducing aircraft weight and enhancing durability, which significantly improve fuel efficiency and operational capabilities. Composites are increasingly used in both structural applications and critical components of aircraft.
Titanium & Alloys, known for their high strength, lightweight, and resistance to high temperatures, held around 20% of the market. These materials are predominantly used in engine components and critical aerospace structures, where their properties can be fully utilized to enhance performance and longevity.
Steel & Alloys, which accounted for 10% of the market share, are utilized for their durability and cost-effectiveness. They are primarily used in landing gear and other applications where high strength and resistance to wear and tear are essential.
The Others category, comprising various specialty materials, made up about 5% of the market. This segment includes materials such as ceramics and thermoplastics, which are used in specific applications that require unique properties such as high heat resistance or electrical insulation.
Overall, the Aerospace Raw Materials Market is characterized by a diverse range of materials, each serving specific purposes that contribute to advancements in aerospace technology and efficiency.
By Sales Channel Type Analysis
Distributor sales are significantly led by channel type, comprising 65% of the market.
In 2023, Distributor Sales held a dominant market position in the By Sales Channel Type segment of the Aerospace Raw Materials Market, capturing more than 65% of the market share. This significant portion of the market underscores the critical role distributors play in the aerospace supply chain, offering extensive networks and streamlined logistics that facilitate the efficient distribution of raw materials globally.
Distributors provide value-added services such as inventory management, just-in-time delivery, and supply chain optimization, which are crucial for manufacturers facing tight production schedules and cost constraints.
Direct Sales accounted for the remaining 35% of the market. This channel is typically favored by manufacturers seeking to establish close relationships with raw material suppliers to ensure the reliability and quality of supply. Direct sales are often preferred for transactions involving highly specialized materials or when significant customization is required. This approach allows aerospace manufacturers to exert greater control over their supply chains, enhancing transparency and reducing potential risks associated with third-party handling.
The distinct advantages of each sales channel cater to different strategic needs within the aerospace industry. While distributor sales offer broad access and logistical advantages, direct sales provide precision and customization. As the aerospace sector continues to evolve with technological advancements and shifting market dynamics, the balance between these sales channels may shift, reflecting changes in manufacturing strategies and supply chain configurations.
Key Market Segments
By Platform Type
- Commercial Aircraft
- Regional Aircraft
- General Aviation
- Military Aircraft
- Helicopter
- Spacecraft
By Material Type
- Titanium & Alloys
- Aluminum & Alloys
- Steel & Alloys
- Composites
- Others
By Sales Channel Type
- Direct Sales
- Distributor Sales
Growth Opportunity
Rising Focus on Environmental Sustainability
In 2023, the global aerospace raw materials market is witnessing significant growth opportunities driven by an intensifying focus on environmental sustainability. As the aerospace industry faces mounting pressures to reduce its environmental footprint, there is an escalating demand for advanced materials that not only meet stringent safety and performance standards but also comply with rigorous environmental regulations.
This shift is catalyzed by global policy changes and an increased awareness among stakeholders about the importance of sustainable practices. Consequently, materials that offer enhanced efficiency and lower emissions are becoming critical in the design and manufacture of aerospace components. This trend is likely to influence market dynamics substantially, fostering innovation and potentially leading to the development of new, eco-friendly materials.
Increasing Research and Development Activities
Concurrently, the aerospace raw materials market is experiencing a surge in research and development (R&D) activities aimed at material innovation and technology enhancement. The drive to develop materials that can withstand extreme conditions while providing weight reductions and cost savings is fueling investments in R&D.
These activities are not only focused on creating new materials but also on improving the processing and recyclability of existing materials, thus extending their lifecycle and reducing waste. As aerospace companies continue to seek competitive advantages through material technology, the R&D landscape in this market is expanding, leading to more sophisticated and application-specific materials that could revolutionize aerospace manufacturing processes.
Latest Trends
Increased Production Rates by Airbus and Boeing
In 2023, a notable trend within the global aerospace raw materials market is the strategic decision by industry giants, Airbus and Boeing, to increase their production rates for key aircraft programs. This upsurge in production is in response to recovering demand in the aviation sector, particularly for commercial airliners, as global travel restrictions ease. The planned increase in production rates is expected to drive substantial demand for aerospace raw materials.
Suppliers and manufacturers in the aerospace supply chain are likely to experience heightened activity, necessitating robust logistical and operational capabilities to meet the increased production demands. This trend underscores a bullish outlook for the aerospace materials market, reflecting a resurgence in the aviation industry's growth trajectory post-pandemic.
Continued High Demand for Titanium and Composites
Furthermore, 2023 continues to see strong demand for specific aerospace materials, notably titanium and composites. These materials are prized for their strength-to-weight ratios and corrosion resistance, qualities essential for modern aerospace applications. Titanium and composites are integral to manufacturing processes that aim to enhance aircraft performance while minimizing environmental impact.
Their continued high demand is driven by ongoing efforts to improve fuel efficiency and reduce emissions in line with global sustainability goals. As aerospace manufacturers and suppliers focus on these advanced materials, the market for titanium and composites is expected to remain robust, supported by technological advancements and increased adoption in both commercial and military aerospace valves sectors.
Regional Analysis
The aerospace raw materials market in Europe holds a significant 36.4% share globally.
The aerospace raw materials market is segmented into five key regions: North America, Europe, Asia Pacific, Middle East & Africa, and Latin America, each demonstrating unique growth dynamics and market potentials.
North America, a prominent player in the aerospace sector, leverages its advanced manufacturing capabilities and substantial investments in aerospace R&D. The region's market is bolstered by the presence of major aerospace corporations and extensive supply chain infrastructure, supporting a robust demand for high-performance materials.
Europe holds a dominant position, accounting for 36.4% of the global market. This is attributed to its strong aerospace industry, led by major manufacturers and suppliers who are pushing for innovation in lightweight and durable aerospace materials. The focus on reducing environmental impact and enhancing fuel efficiency continues to drive the European market forward.
The Asia Pacific region is witnessing rapid growth, driven by the expanding aviation sectors in countries like China and India. Increasing air traffic, coupled with rising military expenditures in the region, fuels the demand for aerospace raw materials. The region is expected to exhibit significant growth rates over the forecast period, supported by ongoing industrial expansions and technological advancements.
The Middle East & Africa region, though smaller in comparison, shows potential due to increasing investments in airport infrastructure developments and the growing focus on diversifying economies away from oil dependency. This shift is likely to increase the demand for aircraft, subsequently boosting the market for aerospace raw materials.
Latin America, while currently the smallest segment, is poised for growth. Factors such as the gradual recovery of Brazil’s economy and increasing air travel in South America contribute to the region's market expansion prospects.
Key Regions and Countries
North America
- The US
- Canada
- Rest of North America
Europe
- Germany
- France
- The UK
- Spain
- Netherlands
- Russia
- Italy
- Rest of Europe
Asia-Pacific
- China
- Japan
- Singapore
- Thailand
- South Korea
- Vietnam
- India
- New Zealand
- Rest of Asia Pacific
Latin America
- Mexico
- Brazil
- Rest of Latin America
Middle East & Africa
- Saudi Arabia
- South Africa
- UAE
- Rest of Middle East & Africa
Key Players Analysis
In the dynamic landscape of the global Aerospace Raw Materials Market in 2023, several key players are pivotal in driving industry standards and innovation. Global Titanium Inc., renowned for its specialized production capabilities, continues to lead in the supply of titanium, essential for lightweight and high-strength aerospace components. AMETEK Inc., with its diversified portfolio, strengthens its position through advanced materials technologies that enhance product reliability and performance in aerospace applications.
ArcelorMittal stands out for its vast array of steel and alloy products, catering to the rigorous demands of aerospace manufacturing. Its commitment to sustainable practices aligns with the industry's shift towards environmentally friendly materials. Similarly, NSSMC Group leverages its expertise in steel products, focusing on innovation to meet the stringent quality standards required in aerospace.
Supreme Engineering Ltd and AMG Advanced Metallurgical Group play crucial roles in supplying specialized alloys that are fundamental to aerospace engineering. Their focus on R&D helps in developing materials that resist extreme conditions encountered in aviation environments.
Allegheny Technologies Incorporated (ATI) and Precision Castparts Corp are notable for their precision in producing critical aerospace components. Their advanced manufacturing processes ensure high performance and durability, which are paramount in the aerospace sector.
Special Metals and Doncasters Group Ltd further enrich the market with their niche offerings in superalloys and precision-engineered components, respectively. These companies are integral to the supply chain, providing materials that uphold safety and efficiency in aerospace operations.
Market Key Players
- Global Titanium Inc
- AMETEK Inc
- ArcelorMittal
- NSSMC Group
- Supreme Engineering Ltd
- Technologies
- AMG Advanced Metallurgical Group
- Allegheny
- Incorporated (ATI)
- Precision Castparts Corp
- Special Metals
- Doncasters Group Ltd
Recent Development
- In April 2024, PaperShell, aided by RISE, developed bio-based materials from agricultural and forestry waste. Secured SEK 114 million in funding, advancing pilot production for customizable fiber composites and weather-resistant plastics.
- In March 2024, Open Trellis CEO Dale Fickett discusses U.S. manufacturing opportunities amid mixed economic signals. Emphasizes leveraging tech combinations, understanding cost implications, and aligning with innovation-led industrial policy.
Report Scope
Report Features Description Market Value (2023) USD 44.4 Billion Forecast Revenue (2033) USD 73.5 Billion CAGR (2024-2032) 5.3% Base Year for Estimation 2023 Historic Period 2016-2023 Forecast Period 2024-2033 Report Coverage Revenue Forecast, Market Dynamics, COVID-19 Impact, Competitive Landscape, Recent Developments Segments Covered By Platform Type(Commercial Aircraft, Regional Aircraft, General Aviation, Military Aircraft, Helicopter, Spacecraft), By Material Type(Titanium & Alloys, Aluminum & Alloys, Steel & Alloys, Composites, Others), By Sales Channel Type(Direct Sales, Distributor Sales) Regional Analysis North America - The US, Canada, Rest of North America, Europe - Germany, France, The UK, Spain, Italy, Russia, Netherlands, Rest of Europe, Asia-Pacific - China, Japan, South Korea, India, New Zealand, Singapore, Thailand, Vietnam, Rest of Asia Pacific, Latin America - Brazil, Mexico, Rest of Latin America, Middle East & Africa - South Africa, Saudi Arabia, UAE, Rest of Middle East & Africa Competitive Landscape Global Titanium Inc, AMETEK Inc, ArcelorMittal, NSSMC Group, Supreme Engineering Ltd, Technologies, AMG Advanced Metallurgical Group, Allegheny, Incorporated (ATI), Precision Castparts Corp, Special Metals, Doncasters Group Ltd Customization Scope Customization for segments, region/country-level will be provided. Moreover, additional customization can be done based on the requirements. Purchase Options We have three licenses to opt for Single User License, Multi-User License (Up to 5 Users), Corporate Use License (Unlimited User and Printable PDF) -
- 1. Executive Summary
- 1.1. Definition
- 1.2. Taxonomy
- 1.3. Research Scope
- 1.4. Key Analysis
- 1.5. Key Findings by Major Segments
- 1.6. Top strategies by Major Players
- 2. Global Aerospace Raw Materials Market Overview
- 2.1. Aerospace Raw Materials Market Dynamics
- 2.1.1. Drivers
- 2.1.2. Opportunities
- 2.1.3. Restraints
- 2.1.4. Challenges
- 2.2. Macro-economic Factors
- 2.3. Regulatory Framework
- 2.4. Market Investment Feasibility Index
- 2.5. PEST Analysis
- 2.6. PORTER’S Five Force Analysis
- 2.7. Drivers & Restraints Impact Analysis
- 2.8. Industry Chain Analysis
- 2.9. Cost Structure Analysis
- 2.10. Marketing Strategy
- 2.11. Russia-Ukraine War Impact Analysis
- 2.12. Opportunity Map Analysis
- 2.13. Market Competition Scenario Analysis
- 2.14. Product Life Cycle Analysis
- 2.15. Opportunity Orbits
- 2.16. Manufacturer Intensity Map
- 2.17. Major Companies sales by Value & Volume
- 2.1. Aerospace Raw Materials Market Dynamics
- 3. Global Aerospace Raw Materials Market Analysis, Opportunity and Forecast, 2016-2032
- 3.1. Global Aerospace Raw Materials Market Analysis, 2016-2021
- 3.2. Global Aerospace Raw Materials Market Opportunity and Forecast, 2023-2032
- 3.3. Global Aerospace Raw Materials Market Analysis, Opportunity and Forecast, By By Platform Type, 2016-2032
- 3.3.1. Global Aerospace Raw Materials Market Analysis by By Platform Type: Introduction
- 3.3.2. Market Size Absolute $ Opportunity Analysis and Forecast, By By Platform Type, 2016-2032
- 3.3.3. Commercial Aircraft
- 3.3.4. Regional Aircraft
- 3.3.5. General Aviation
- 3.3.6. Military Aircraft
- 3.3.7. Helicopter
- 3.3.8. Spacecraft
- 3.4. Global Aerospace Raw Materials Market Analysis, Opportunity and Forecast, By By Material Type, 2016-2032
- 3.4.1. Global Aerospace Raw Materials Market Analysis by By Material Type: Introduction
- 3.4.2. Market Size Absolute $ Opportunity Analysis and Forecast, By By Material Type, 2016-2032
- 3.4.3. Titanium & Alloys
- 3.4.4. Aluminum & Alloys
- 3.4.5. Steel & Alloys
- 3.4.6. Composites
- 3.4.7. Others
- 3.5. Global Aerospace Raw Materials Market Analysis, Opportunity and Forecast, By By Sales Channel Type, 2016-2032
- 3.5.1. Global Aerospace Raw Materials Market Analysis by By Sales Channel Type: Introduction
- 3.5.2. Market Size Absolute $ Opportunity Analysis and Forecast, By By Sales Channel Type, 2016-2032
- 3.5.3. Direct Sales
- 3.5.4. Distributor Sales
- 4. North America Aerospace Raw Materials Market Analysis, Opportunity and Forecast, 2016-2032
- 4.1. North America Aerospace Raw Materials Market Analysis, 2016-2021
- 4.2. North America Aerospace Raw Materials Market Opportunity and Forecast, 2023-2032
- 4.3. North America Aerospace Raw Materials Market Analysis, Opportunity and Forecast, By By Platform Type, 2016-2032
- 4.3.1. North America Aerospace Raw Materials Market Analysis by By Platform Type: Introduction
- 4.3.2. Market Size Absolute $ Opportunity Analysis and Forecast, By By Platform Type, 2016-2032
- 4.3.3. Commercial Aircraft
- 4.3.4. Regional Aircraft
- 4.3.5. General Aviation
- 4.3.6. Military Aircraft
- 4.3.7. Helicopter
- 4.3.8. Spacecraft
- 4.4. North America Aerospace Raw Materials Market Analysis, Opportunity and Forecast, By By Material Type, 2016-2032
- 4.4.1. North America Aerospace Raw Materials Market Analysis by By Material Type: Introduction
- 4.4.2. Market Size Absolute $ Opportunity Analysis and Forecast, By By Material Type, 2016-2032
- 4.4.3. Titanium & Alloys
- 4.4.4. Aluminum & Alloys
- 4.4.5. Steel & Alloys
- 4.4.6. Composites
- 4.4.7. Others
- 4.5. North America Aerospace Raw Materials Market Analysis, Opportunity and Forecast, By By Sales Channel Type, 2016-2032
- 4.5.1. North America Aerospace Raw Materials Market Analysis by By Sales Channel Type: Introduction
- 4.5.2. Market Size Absolute $ Opportunity Analysis and Forecast, By By Sales Channel Type, 2016-2032
- 4.5.3. Direct Sales
- 4.5.4. Distributor Sales
- 4.6. North America Aerospace Raw Materials Market Analysis, Opportunity and Forecast, By Country , 2016-2032
- 4.6.1. North America Aerospace Raw Materials Market Analysis by Country : Introduction
- 4.6.2. Market Size Absolute $ Opportunity Analysis and Forecast, Country , 2016-2032
- 4.6.2.1. The US
- 4.6.2.2. Canada
- 4.6.2.3. Mexico
- 5. Western Europe Aerospace Raw Materials Market Analysis, Opportunity and Forecast, 2016-2032
- 5.1. Western Europe Aerospace Raw Materials Market Analysis, 2016-2021
- 5.2. Western Europe Aerospace Raw Materials Market Opportunity and Forecast, 2023-2032
- 5.3. Western Europe Aerospace Raw Materials Market Analysis, Opportunity and Forecast, By By Platform Type, 2016-2032
- 5.3.1. Western Europe Aerospace Raw Materials Market Analysis by By Platform Type: Introduction
- 5.3.2. Market Size Absolute $ Opportunity Analysis and Forecast, By By Platform Type, 2016-2032
- 5.3.3. Commercial Aircraft
- 5.3.4. Regional Aircraft
- 5.3.5. General Aviation
- 5.3.6. Military Aircraft
- 5.3.7. Helicopter
- 5.3.8. Spacecraft
- 5.4. Western Europe Aerospace Raw Materials Market Analysis, Opportunity and Forecast, By By Material Type, 2016-2032
- 5.4.1. Western Europe Aerospace Raw Materials Market Analysis by By Material Type: Introduction
- 5.4.2. Market Size Absolute $ Opportunity Analysis and Forecast, By By Material Type, 2016-2032
- 5.4.3. Titanium & Alloys
- 5.4.4. Aluminum & Alloys
- 5.4.5. Steel & Alloys
- 5.4.6. Composites
- 5.4.7. Others
- 5.5. Western Europe Aerospace Raw Materials Market Analysis, Opportunity and Forecast, By By Sales Channel Type, 2016-2032
- 5.5.1. Western Europe Aerospace Raw Materials Market Analysis by By Sales Channel Type: Introduction
- 5.5.2. Market Size Absolute $ Opportunity Analysis and Forecast, By By Sales Channel Type, 2016-2032
- 5.5.3. Direct Sales
- 5.5.4. Distributor Sales
- 5.6. Western Europe Aerospace Raw Materials Market Analysis, Opportunity and Forecast, By Country , 2016-2032
- 5.6.1. Western Europe Aerospace Raw Materials Market Analysis by Country : Introduction
- 5.6.2. Market Size Absolute $ Opportunity Analysis and Forecast, Country , 2016-2032
- 5.6.2.1. Germany
- 5.6.2.2. France
- 5.6.2.3. The UK
- 5.6.2.4. Spain
- 5.6.2.5. Italy
- 5.6.2.6. Portugal
- 5.6.2.7. Ireland
- 5.6.2.8. Austria
- 5.6.2.9. Switzerland
- 5.6.2.10. Benelux
- 5.6.2.11. Nordic
- 5.6.2.12. Rest of Western Europe
- 6. Eastern Europe Aerospace Raw Materials Market Analysis, Opportunity and Forecast, 2016-2032
- 6.1. Eastern Europe Aerospace Raw Materials Market Analysis, 2016-2021
- 6.2. Eastern Europe Aerospace Raw Materials Market Opportunity and Forecast, 2023-2032
- 6.3. Eastern Europe Aerospace Raw Materials Market Analysis, Opportunity and Forecast, By By Platform Type, 2016-2032
- 6.3.1. Eastern Europe Aerospace Raw Materials Market Analysis by By Platform Type: Introduction
- 6.3.2. Market Size Absolute $ Opportunity Analysis and Forecast, By By Platform Type, 2016-2032
- 6.3.3. Commercial Aircraft
- 6.3.4. Regional Aircraft
- 6.3.5. General Aviation
- 6.3.6. Military Aircraft
- 6.3.7. Helicopter
- 6.3.8. Spacecraft
- 6.4. Eastern Europe Aerospace Raw Materials Market Analysis, Opportunity and Forecast, By By Material Type, 2016-2032
- 6.4.1. Eastern Europe Aerospace Raw Materials Market Analysis by By Material Type: Introduction
- 6.4.2. Market Size Absolute $ Opportunity Analysis and Forecast, By By Material Type, 2016-2032
- 6.4.3. Titanium & Alloys
- 6.4.4. Aluminum & Alloys
- 6.4.5. Steel & Alloys
- 6.4.6. Composites
- 6.4.7. Others
- 6.5. Eastern Europe Aerospace Raw Materials Market Analysis, Opportunity and Forecast, By By Sales Channel Type, 2016-2032
- 6.5.1. Eastern Europe Aerospace Raw Materials Market Analysis by By Sales Channel Type: Introduction
- 6.5.2. Market Size Absolute $ Opportunity Analysis and Forecast, By By Sales Channel Type, 2016-2032
- 6.5.3. Direct Sales
- 6.5.4. Distributor Sales
- 6.6. Eastern Europe Aerospace Raw Materials Market Analysis, Opportunity and Forecast, By Country , 2016-2032
- 6.6.1. Eastern Europe Aerospace Raw Materials Market Analysis by Country : Introduction
- 6.6.2. Market Size Absolute $ Opportunity Analysis and Forecast, Country , 2016-2032
- 6.6.2.1. Russia
- 6.6.2.2. Poland
- 6.6.2.3. The Czech Republic
- 6.6.2.4. Greece
- 6.6.2.5. Rest of Eastern Europe
- 7. APAC Aerospace Raw Materials Market Analysis, Opportunity and Forecast, 2016-2032
- 7.1. APAC Aerospace Raw Materials Market Analysis, 2016-2021
- 7.2. APAC Aerospace Raw Materials Market Opportunity and Forecast, 2023-2032
- 7.3. APAC Aerospace Raw Materials Market Analysis, Opportunity and Forecast, By By Platform Type, 2016-2032
- 7.3.1. APAC Aerospace Raw Materials Market Analysis by By Platform Type: Introduction
- 7.3.2. Market Size Absolute $ Opportunity Analysis and Forecast, By By Platform Type, 2016-2032
- 7.3.3. Commercial Aircraft
- 7.3.4. Regional Aircraft
- 7.3.5. General Aviation
- 7.3.6. Military Aircraft
- 7.3.7. Helicopter
- 7.3.8. Spacecraft
- 7.4. APAC Aerospace Raw Materials Market Analysis, Opportunity and Forecast, By By Material Type, 2016-2032
- 7.4.1. APAC Aerospace Raw Materials Market Analysis by By Material Type: Introduction
- 7.4.2. Market Size Absolute $ Opportunity Analysis and Forecast, By By Material Type, 2016-2032
- 7.4.3. Titanium & Alloys
- 7.4.4. Aluminum & Alloys
- 7.4.5. Steel & Alloys
- 7.4.6. Composites
- 7.4.7. Others
- 7.5. APAC Aerospace Raw Materials Market Analysis, Opportunity and Forecast, By By Sales Channel Type, 2016-2032
- 7.5.1. APAC Aerospace Raw Materials Market Analysis by By Sales Channel Type: Introduction
- 7.5.2. Market Size Absolute $ Opportunity Analysis and Forecast, By By Sales Channel Type, 2016-2032
- 7.5.3. Direct Sales
- 7.5.4. Distributor Sales
- 7.6. APAC Aerospace Raw Materials Market Analysis, Opportunity and Forecast, By Country , 2016-2032
- 7.6.1. APAC Aerospace Raw Materials Market Analysis by Country : Introduction
- 7.6.2. Market Size Absolute $ Opportunity Analysis and Forecast, Country , 2016-2032
- 7.6.2.1. China
- 7.6.2.2. Japan
- 7.6.2.3. South Korea
- 7.6.2.4. India
- 7.6.2.5. Australia & New Zeland
- 7.6.2.6. Indonesia
- 7.6.2.7. Malaysia
- 7.6.2.8. Philippines
- 7.6.2.9. Singapore
- 7.6.2.10. Thailand
- 7.6.2.11. Vietnam
- 7.6.2.12. Rest of APAC
- 8. Latin America Aerospace Raw Materials Market Analysis, Opportunity and Forecast, 2016-2032
- 8.1. Latin America Aerospace Raw Materials Market Analysis, 2016-2021
- 8.2. Latin America Aerospace Raw Materials Market Opportunity and Forecast, 2023-2032
- 8.3. Latin America Aerospace Raw Materials Market Analysis, Opportunity and Forecast, By By Platform Type, 2016-2032
- 8.3.1. Latin America Aerospace Raw Materials Market Analysis by By Platform Type: Introduction
- 8.3.2. Market Size Absolute $ Opportunity Analysis and Forecast, By By Platform Type, 2016-2032
- 8.3.3. Commercial Aircraft
- 8.3.4. Regional Aircraft
- 8.3.5. General Aviation
- 8.3.6. Military Aircraft
- 8.3.7. Helicopter
- 8.3.8. Spacecraft
- 8.4. Latin America Aerospace Raw Materials Market Analysis, Opportunity and Forecast, By By Material Type, 2016-2032
- 8.4.1. Latin America Aerospace Raw Materials Market Analysis by By Material Type: Introduction
- 8.4.2. Market Size Absolute $ Opportunity Analysis and Forecast, By By Material Type, 2016-2032
- 8.4.3. Titanium & Alloys
- 8.4.4. Aluminum & Alloys
- 8.4.5. Steel & Alloys
- 8.4.6. Composites
- 8.4.7. Others
- 8.5. Latin America Aerospace Raw Materials Market Analysis, Opportunity and Forecast, By By Sales Channel Type, 2016-2032
- 8.5.1. Latin America Aerospace Raw Materials Market Analysis by By Sales Channel Type: Introduction
- 8.5.2. Market Size Absolute $ Opportunity Analysis and Forecast, By By Sales Channel Type, 2016-2032
- 8.5.3. Direct Sales
- 8.5.4. Distributor Sales
- 8.6. Latin America Aerospace Raw Materials Market Analysis, Opportunity and Forecast, By Country , 2016-2032
- 8.6.1. Latin America Aerospace Raw Materials Market Analysis by Country : Introduction
- 8.6.2. Market Size Absolute $ Opportunity Analysis and Forecast, Country , 2016-2032
- 8.6.2.1. Brazil
- 8.6.2.2. Colombia
- 8.6.2.3. Chile
- 8.6.2.4. Argentina
- 8.6.2.5. Costa Rica
- 8.6.2.6. Rest of Latin America
- 9. Middle East & Africa Aerospace Raw Materials Market Analysis, Opportunity and Forecast, 2016-2032
- 9.1. Middle East & Africa Aerospace Raw Materials Market Analysis, 2016-2021
- 9.2. Middle East & Africa Aerospace Raw Materials Market Opportunity and Forecast, 2023-2032
- 9.3. Middle East & Africa Aerospace Raw Materials Market Analysis, Opportunity and Forecast, By By Platform Type, 2016-2032
- 9.3.1. Middle East & Africa Aerospace Raw Materials Market Analysis by By Platform Type: Introduction
- 9.3.2. Market Size Absolute $ Opportunity Analysis and Forecast, By By Platform Type, 2016-2032
- 9.3.3. Commercial Aircraft
- 9.3.4. Regional Aircraft
- 9.3.5. General Aviation
- 9.3.6. Military Aircraft
- 9.3.7. Helicopter
- 9.3.8. Spacecraft
- 9.4. Middle East & Africa Aerospace Raw Materials Market Analysis, Opportunity and Forecast, By By Material Type, 2016-2032
- 9.4.1. Middle East & Africa Aerospace Raw Materials Market Analysis by By Material Type: Introduction
- 9.4.2. Market Size Absolute $ Opportunity Analysis and Forecast, By By Material Type, 2016-2032
- 9.4.3. Titanium & Alloys
- 9.4.4. Aluminum & Alloys
- 9.4.5. Steel & Alloys
- 9.4.6. Composites
- 9.4.7. Others
- 9.5. Middle East & Africa Aerospace Raw Materials Market Analysis, Opportunity and Forecast, By By Sales Channel Type, 2016-2032
- 9.5.1. Middle East & Africa Aerospace Raw Materials Market Analysis by By Sales Channel Type: Introduction
- 9.5.2. Market Size Absolute $ Opportunity Analysis and Forecast, By By Sales Channel Type, 2016-2032
- 9.5.3. Direct Sales
- 9.5.4. Distributor Sales
- 9.6. Middle East & Africa Aerospace Raw Materials Market Analysis, Opportunity and Forecast, By Country , 2016-2032
- 9.6.1. Middle East & Africa Aerospace Raw Materials Market Analysis by Country : Introduction
- 9.6.2. Market Size Absolute $ Opportunity Analysis and Forecast, Country , 2016-2032
- 9.6.2.1. Algeria
- 9.6.2.2. Egypt
- 9.6.2.3. Israel
- 9.6.2.4. Kuwait
- 9.6.2.5. Nigeria
- 9.6.2.6. Saudi Arabia
- 9.6.2.7. South Africa
- 9.6.2.8. Turkey
- 9.6.2.9. The UAE
- 9.6.2.10. Rest of MEA
- 10. Global Aerospace Raw Materials Market Analysis, Opportunity and Forecast, By Region , 2016-2032
- 10.1. Global Aerospace Raw Materials Market Analysis by Region : Introduction
- 10.2. Market Size Absolute $ Opportunity Analysis and Forecast, By Region , 2016-2032
- 10.2.1. North America
- 10.2.2. Western Europe
- 10.2.3. Eastern Europe
- 10.2.4. APAC
- 10.2.5. Latin America
- 10.2.6. Middle East & Africa
- 11. Global Aerospace Raw Materials Market Competitive Landscape, Market Share Analysis, and Company Profiles
- 11.1. Market Share Analysis
- 11.2. Company Profiles
- 11.3. Global Titanium Inc
- 11.3.1. Company Overview
- 11.3.2. Financial Highlights
- 11.3.3. Product Portfolio
- 11.3.4. SWOT Analysis
- 11.3.5. Key Strategies and Developments
- 11.4. AMETEK Inc
- 11.4.1. Company Overview
- 11.4.2. Financial Highlights
- 11.4.3. Product Portfolio
- 11.4.4. SWOT Analysis
- 11.4.5. Key Strategies and Developments
- 11.5. ArcelorMittal
- 11.5.1. Company Overview
- 11.5.2. Financial Highlights
- 11.5.3. Product Portfolio
- 11.5.4. SWOT Analysis
- 11.5.5. Key Strategies and Developments
- 11.6. NSSMC Group
- 11.6.1. Company Overview
- 11.6.2. Financial Highlights
- 11.6.3. Product Portfolio
- 11.6.4. SWOT Analysis
- 11.6.5. Key Strategies and Developments
- 11.7. Supreme Engineering Ltd
- 11.7.1. Company Overview
- 11.7.2. Financial Highlights
- 11.7.3. Product Portfolio
- 11.7.4. SWOT Analysis
- 11.7.5. Key Strategies and Developments
- 11.8. Technologies
- 11.8.1. Company Overview
- 11.8.2. Financial Highlights
- 11.8.3. Product Portfolio
- 11.8.4. SWOT Analysis
- 11.8.5. Key Strategies and Developments
- 11.9. AMG Advanced Metallurgical Group
- 11.9.1. Company Overview
- 11.9.2. Financial Highlights
- 11.9.3. Product Portfolio
- 11.9.4. SWOT Analysis
- 11.9.5. Key Strategies and Developments
- 11.10. Allegheny
- 11.10.1. Company Overview
- 11.10.2. Financial Highlights
- 11.10.3. Product Portfolio
- 11.10.4. SWOT Analysis
- 11.10.5. Key Strategies and Developments
- 11.11. Incorporated (ATI)
- 11.11.1. Company Overview
- 11.11.2. Financial Highlights
- 11.11.3. Product Portfolio
- 11.11.4. SWOT Analysis
- 11.11.5. Key Strategies and Developments
- 11.12. Precision Castparts Corp
- 11.12.1. Company Overview
- 11.12.2. Financial Highlights
- 11.12.3. Product Portfolio
- 11.12.4. SWOT Analysis
- 11.12.5. Key Strategies and Developments
- 11.13.1. Company Overview
- 11.13.2. Financial Highlights
- 11.13.3. Product Portfolio
- 11.13.4. SWOT Analysis
- 11.13.5. Key Strategies and Developments
- 11.14. Special Metals
- 11.14.1. Company Overview
- 11.14.2. Financial Highlights
- 11.14.3. Product Portfolio
- 11.14.4. SWOT Analysis
- 11.14.5. Key Strategies and Developments
- 12. Assumptions and Acronyms
- 13. Research Methodology
- 14. Contact
"
- List of Figures
- "
- Figure 1: Global Aerospace Raw Materials Market Revenue (US$ Mn) Market Share by By Platform Type in 2022
- Figure 2: Global Aerospace Raw Materials Market Market Attractiveness Analysis by By Platform Type, 2016-2032
- Figure 3: Global Aerospace Raw Materials Market Revenue (US$ Mn) Market Share by By Material Typein 2022
- Figure 4: Global Aerospace Raw Materials Market Market Attractiveness Analysis by By Material Type, 2016-2032
- Figure 5: Global Aerospace Raw Materials Market Revenue (US$ Mn) Market Share by By Sales Channel Typein 2022
- Figure 6: Global Aerospace Raw Materials Market Market Attractiveness Analysis by By Sales Channel Type, 2016-2032
- Figure 7: Global Aerospace Raw Materials Market Revenue (US$ Mn) Market Share by Region in 2022
- Figure 8: Global Aerospace Raw Materials Market Market Attractiveness Analysis by Region, 2016-2032
- Figure 9: Global Aerospace Raw Materials Market Market Revenue (US$ Mn) (2016-2032)
- Figure 10: Global Aerospace Raw Materials Market Market Revenue (US$ Mn) Comparison by Region (2016-2032)
- Figure 11: Global Aerospace Raw Materials Market Market Revenue (US$ Mn) Comparison by By Platform Type (2016-2032)
- Figure 12: Global Aerospace Raw Materials Market Market Revenue (US$ Mn) Comparison by By Material Type (2016-2032)
- Figure 13: Global Aerospace Raw Materials Market Market Revenue (US$ Mn) Comparison by By Sales Channel Type (2016-2032)
- Figure 14: Global Aerospace Raw Materials Market Market Y-o-Y Growth Rate Comparison by Region (2016-2032)
- Figure 15: Global Aerospace Raw Materials Market Market Y-o-Y Growth Rate Comparison by By Platform Type (2016-2032)
- Figure 16: Global Aerospace Raw Materials Market Market Y-o-Y Growth Rate Comparison by By Material Type (2016-2032)
- Figure 17: Global Aerospace Raw Materials Market Market Y-o-Y Growth Rate Comparison by By Sales Channel Type (2016-2032)
- Figure 18: Global Aerospace Raw Materials Market Market Share Comparison by Region (2016-2032)
- Figure 19: Global Aerospace Raw Materials Market Market Share Comparison by By Platform Type (2016-2032)
- Figure 20: Global Aerospace Raw Materials Market Market Share Comparison by By Material Type (2016-2032)
- Figure 21: Global Aerospace Raw Materials Market Market Share Comparison by By Sales Channel Type (2016-2032)
- Figure 22: North America Aerospace Raw Materials Market Revenue (US$ Mn) Market Share by By Platform Typein 2022
- Figure 23: North America Aerospace Raw Materials Market Market Attractiveness Analysis by By Platform Type, 2016-2032
- Figure 24: North America Aerospace Raw Materials Market Revenue (US$ Mn) Market Share by By Material Typein 2022
- Figure 25: North America Aerospace Raw Materials Market Market Attractiveness Analysis by By Material Type, 2016-2032
- Figure 26: North America Aerospace Raw Materials Market Revenue (US$ Mn) Market Share by By Sales Channel Typein 2022
- Figure 27: North America Aerospace Raw Materials Market Market Attractiveness Analysis by By Sales Channel Type, 2016-2032
- Figure 28: North America Aerospace Raw Materials Market Revenue (US$ Mn) Market Share by Country in 2022
- Figure 29: North America Aerospace Raw Materials Market Market Attractiveness Analysis by Country, 2016-2032
- Figure 30: North America Aerospace Raw Materials Market Market Revenue (US$ Mn) (2016-2032)
- Figure 31: North America Aerospace Raw Materials Market Market Revenue (US$ Mn) Comparison by Country (2016-2032)
- Figure 32: North America Aerospace Raw Materials Market Market Revenue (US$ Mn) Comparison by By Platform Type (2016-2032)
- Figure 33: North America Aerospace Raw Materials Market Market Revenue (US$ Mn) Comparison by By Material Type (2016-2032)
- Figure 34: North America Aerospace Raw Materials Market Market Revenue (US$ Mn) Comparison by By Sales Channel Type (2016-2032)
- Figure 35: North America Aerospace Raw Materials Market Market Y-o-Y Growth Rate Comparison by Country (2016-2032)
- Figure 36: North America Aerospace Raw Materials Market Market Y-o-Y Growth Rate Comparison by By Platform Type (2016-2032)
- Figure 37: North America Aerospace Raw Materials Market Market Y-o-Y Growth Rate Comparison by By Material Type (2016-2032)
- Figure 38: North America Aerospace Raw Materials Market Market Y-o-Y Growth Rate Comparison by By Sales Channel Type (2016-2032)
- Figure 39: North America Aerospace Raw Materials Market Market Share Comparison by Country (2016-2032)
- Figure 40: North America Aerospace Raw Materials Market Market Share Comparison by By Platform Type (2016-2032)
- Figure 41: North America Aerospace Raw Materials Market Market Share Comparison by By Material Type (2016-2032)
- Figure 42: North America Aerospace Raw Materials Market Market Share Comparison by By Sales Channel Type (2016-2032)
- Figure 43: Western Europe Aerospace Raw Materials Market Revenue (US$ Mn) Market Share by By Platform Typein 2022
- Figure 44: Western Europe Aerospace Raw Materials Market Market Attractiveness Analysis by By Platform Type, 2016-2032
- Figure 45: Western Europe Aerospace Raw Materials Market Revenue (US$ Mn) Market Share by By Material Typein 2022
- Figure 46: Western Europe Aerospace Raw Materials Market Market Attractiveness Analysis by By Material Type, 2016-2032
- Figure 47: Western Europe Aerospace Raw Materials Market Revenue (US$ Mn) Market Share by By Sales Channel Typein 2022
- Figure 48: Western Europe Aerospace Raw Materials Market Market Attractiveness Analysis by By Sales Channel Type, 2016-2032
- Figure 49: Western Europe Aerospace Raw Materials Market Revenue (US$ Mn) Market Share by Country in 2022
- Figure 50: Western Europe Aerospace Raw Materials Market Market Attractiveness Analysis by Country, 2016-2032
- Figure 51: Western Europe Aerospace Raw Materials Market Market Revenue (US$ Mn) (2016-2032)
- Figure 52: Western Europe Aerospace Raw Materials Market Market Revenue (US$ Mn) Comparison by Country (2016-2032)
- Figure 53: Western Europe Aerospace Raw Materials Market Market Revenue (US$ Mn) Comparison by By Platform Type (2016-2032)
- Figure 54: Western Europe Aerospace Raw Materials Market Market Revenue (US$ Mn) Comparison by By Material Type (2016-2032)
- Figure 55: Western Europe Aerospace Raw Materials Market Market Revenue (US$ Mn) Comparison by By Sales Channel Type (2016-2032)
- Figure 56: Western Europe Aerospace Raw Materials Market Market Y-o-Y Growth Rate Comparison by Country (2016-2032)
- Figure 57: Western Europe Aerospace Raw Materials Market Market Y-o-Y Growth Rate Comparison by By Platform Type (2016-2032)
- Figure 58: Western Europe Aerospace Raw Materials Market Market Y-o-Y Growth Rate Comparison by By Material Type (2016-2032)
- Figure 59: Western Europe Aerospace Raw Materials Market Market Y-o-Y Growth Rate Comparison by By Sales Channel Type (2016-2032)
- Figure 60: Western Europe Aerospace Raw Materials Market Market Share Comparison by Country (2016-2032)
- Figure 61: Western Europe Aerospace Raw Materials Market Market Share Comparison by By Platform Type (2016-2032)
- Figure 62: Western Europe Aerospace Raw Materials Market Market Share Comparison by By Material Type (2016-2032)
- Figure 63: Western Europe Aerospace Raw Materials Market Market Share Comparison by By Sales Channel Type (2016-2032)
- Figure 64: Eastern Europe Aerospace Raw Materials Market Revenue (US$ Mn) Market Share by By Platform Typein 2022
- Figure 65: Eastern Europe Aerospace Raw Materials Market Market Attractiveness Analysis by By Platform Type, 2016-2032
- Figure 66: Eastern Europe Aerospace Raw Materials Market Revenue (US$ Mn) Market Share by By Material Typein 2022
- Figure 67: Eastern Europe Aerospace Raw Materials Market Market Attractiveness Analysis by By Material Type, 2016-2032
- Figure 68: Eastern Europe Aerospace Raw Materials Market Revenue (US$ Mn) Market Share by By Sales Channel Typein 2022
- Figure 69: Eastern Europe Aerospace Raw Materials Market Market Attractiveness Analysis by By Sales Channel Type, 2016-2032
- Figure 70: Eastern Europe Aerospace Raw Materials Market Revenue (US$ Mn) Market Share by Country in 2022
- Figure 71: Eastern Europe Aerospace Raw Materials Market Market Attractiveness Analysis by Country, 2016-2032
- Figure 72: Eastern Europe Aerospace Raw Materials Market Market Revenue (US$ Mn) (2016-2032)
- Figure 73: Eastern Europe Aerospace Raw Materials Market Market Revenue (US$ Mn) Comparison by Country (2016-2032)
- Figure 74: Eastern Europe Aerospace Raw Materials Market Market Revenue (US$ Mn) Comparison by By Platform Type (2016-2032)
- Figure 75: Eastern Europe Aerospace Raw Materials Market Market Revenue (US$ Mn) Comparison by By Material Type (2016-2032)
- Figure 76: Eastern Europe Aerospace Raw Materials Market Market Revenue (US$ Mn) Comparison by By Sales Channel Type (2016-2032)
- Figure 77: Eastern Europe Aerospace Raw Materials Market Market Y-o-Y Growth Rate Comparison by Country (2016-2032)
- Figure 78: Eastern Europe Aerospace Raw Materials Market Market Y-o-Y Growth Rate Comparison by By Platform Type (2016-2032)
- Figure 79: Eastern Europe Aerospace Raw Materials Market Market Y-o-Y Growth Rate Comparison by By Material Type (2016-2032)
- Figure 80: Eastern Europe Aerospace Raw Materials Market Market Y-o-Y Growth Rate Comparison by By Sales Channel Type (2016-2032)
- Figure 81: Eastern Europe Aerospace Raw Materials Market Market Share Comparison by Country (2016-2032)
- Figure 82: Eastern Europe Aerospace Raw Materials Market Market Share Comparison by By Platform Type (2016-2032)
- Figure 83: Eastern Europe Aerospace Raw Materials Market Market Share Comparison by By Material Type (2016-2032)
- Figure 84: Eastern Europe Aerospace Raw Materials Market Market Share Comparison by By Sales Channel Type (2016-2032)
- Figure 85: APAC Aerospace Raw Materials Market Revenue (US$ Mn) Market Share by By Platform Typein 2022
- Figure 86: APAC Aerospace Raw Materials Market Market Attractiveness Analysis by By Platform Type, 2016-2032
- Figure 87: APAC Aerospace Raw Materials Market Revenue (US$ Mn) Market Share by By Material Typein 2022
- Figure 88: APAC Aerospace Raw Materials Market Market Attractiveness Analysis by By Material Type, 2016-2032
- Figure 89: APAC Aerospace Raw Materials Market Revenue (US$ Mn) Market Share by By Sales Channel Typein 2022
- Figure 90: APAC Aerospace Raw Materials Market Market Attractiveness Analysis by By Sales Channel Type, 2016-2032
- Figure 91: APAC Aerospace Raw Materials Market Revenue (US$ Mn) Market Share by Country in 2022
- Figure 92: APAC Aerospace Raw Materials Market Market Attractiveness Analysis by Country, 2016-2032
- Figure 93: APAC Aerospace Raw Materials Market Market Revenue (US$ Mn) (2016-2032)
- Figure 94: APAC Aerospace Raw Materials Market Market Revenue (US$ Mn) Comparison by Country (2016-2032)
- Figure 95: APAC Aerospace Raw Materials Market Market Revenue (US$ Mn) Comparison by By Platform Type (2016-2032)
- Figure 96: APAC Aerospace Raw Materials Market Market Revenue (US$ Mn) Comparison by By Material Type (2016-2032)
- Figure 97: APAC Aerospace Raw Materials Market Market Revenue (US$ Mn) Comparison by By Sales Channel Type (2016-2032)
- Figure 98: APAC Aerospace Raw Materials Market Market Y-o-Y Growth Rate Comparison by Country (2016-2032)
- Figure 99: APAC Aerospace Raw Materials Market Market Y-o-Y Growth Rate Comparison by By Platform Type (2016-2032)
- Figure 100: APAC Aerospace Raw Materials Market Market Y-o-Y Growth Rate Comparison by By Material Type (2016-2032)
- Figure 101: APAC Aerospace Raw Materials Market Market Y-o-Y Growth Rate Comparison by By Sales Channel Type (2016-2032)
- Figure 102: APAC Aerospace Raw Materials Market Market Share Comparison by Country (2016-2032)
- Figure 103: APAC Aerospace Raw Materials Market Market Share Comparison by By Platform Type (2016-2032)
- Figure 104: APAC Aerospace Raw Materials Market Market Share Comparison by By Material Type (2016-2032)
- Figure 105: APAC Aerospace Raw Materials Market Market Share Comparison by By Sales Channel Type (2016-2032)
- Figure 106: Latin America Aerospace Raw Materials Market Revenue (US$ Mn) Market Share by By Platform Typein 2022
- Figure 107: Latin America Aerospace Raw Materials Market Market Attractiveness Analysis by By Platform Type, 2016-2032
- Figure 108: Latin America Aerospace Raw Materials Market Revenue (US$ Mn) Market Share by By Material Typein 2022
- Figure 109: Latin America Aerospace Raw Materials Market Market Attractiveness Analysis by By Material Type, 2016-2032
- Figure 110: Latin America Aerospace Raw Materials Market Revenue (US$ Mn) Market Share by By Sales Channel Typein 2022
- Figure 111: Latin America Aerospace Raw Materials Market Market Attractiveness Analysis by By Sales Channel Type, 2016-2032
- Figure 112: Latin America Aerospace Raw Materials Market Revenue (US$ Mn) Market Share by Country in 2022
- Figure 113: Latin America Aerospace Raw Materials Market Market Attractiveness Analysis by Country, 2016-2032
- Figure 114: Latin America Aerospace Raw Materials Market Market Revenue (US$ Mn) (2016-2032)
- Figure 115: Latin America Aerospace Raw Materials Market Market Revenue (US$ Mn) Comparison by Country (2016-2032)
- Figure 116: Latin America Aerospace Raw Materials Market Market Revenue (US$ Mn) Comparison by By Platform Type (2016-2032)
- Figure 117: Latin America Aerospace Raw Materials Market Market Revenue (US$ Mn) Comparison by By Material Type (2016-2032)
- Figure 118: Latin America Aerospace Raw Materials Market Market Revenue (US$ Mn) Comparison by By Sales Channel Type (2016-2032)
- Figure 119: Latin America Aerospace Raw Materials Market Market Y-o-Y Growth Rate Comparison by Country (2016-2032)
- Figure 120: Latin America Aerospace Raw Materials Market Market Y-o-Y Growth Rate Comparison by By Platform Type (2016-2032)
- Figure 121: Latin America Aerospace Raw Materials Market Market Y-o-Y Growth Rate Comparison by By Material Type (2016-2032)
- Figure 122: Latin America Aerospace Raw Materials Market Market Y-o-Y Growth Rate Comparison by By Sales Channel Type (2016-2032)
- Figure 123: Latin America Aerospace Raw Materials Market Market Share Comparison by Country (2016-2032)
- Figure 124: Latin America Aerospace Raw Materials Market Market Share Comparison by By Platform Type (2016-2032)
- Figure 125: Latin America Aerospace Raw Materials Market Market Share Comparison by By Material Type (2016-2032)
- Figure 126: Latin America Aerospace Raw Materials Market Market Share Comparison by By Sales Channel Type (2016-2032)
- Figure 127: Middle East & Africa Aerospace Raw Materials Market Revenue (US$ Mn) Market Share by By Platform Typein 2022
- Figure 128: Middle East & Africa Aerospace Raw Materials Market Market Attractiveness Analysis by By Platform Type, 2016-2032
- Figure 129: Middle East & Africa Aerospace Raw Materials Market Revenue (US$ Mn) Market Share by By Material Typein 2022
- Figure 130: Middle East & Africa Aerospace Raw Materials Market Market Attractiveness Analysis by By Material Type, 2016-2032
- Figure 131: Middle East & Africa Aerospace Raw Materials Market Revenue (US$ Mn) Market Share by By Sales Channel Typein 2022
- Figure 132: Middle East & Africa Aerospace Raw Materials Market Market Attractiveness Analysis by By Sales Channel Type, 2016-2032
- Figure 133: Middle East & Africa Aerospace Raw Materials Market Revenue (US$ Mn) Market Share by Country in 2022
- Figure 134: Middle East & Africa Aerospace Raw Materials Market Market Attractiveness Analysis by Country, 2016-2032
- Figure 135: Middle East & Africa Aerospace Raw Materials Market Market Revenue (US$ Mn) (2016-2032)
- Figure 136: Middle East & Africa Aerospace Raw Materials Market Market Revenue (US$ Mn) Comparison by Country (2016-2032)
- Figure 137: Middle East & Africa Aerospace Raw Materials Market Market Revenue (US$ Mn) Comparison by By Platform Type (2016-2032)
- Figure 138: Middle East & Africa Aerospace Raw Materials Market Market Revenue (US$ Mn) Comparison by By Material Type (2016-2032)
- Figure 139: Middle East & Africa Aerospace Raw Materials Market Market Revenue (US$ Mn) Comparison by By Sales Channel Type (2016-2032)
- Figure 140: Middle East & Africa Aerospace Raw Materials Market Market Y-o-Y Growth Rate Comparison by Country (2016-2032)
- Figure 141: Middle East & Africa Aerospace Raw Materials Market Market Y-o-Y Growth Rate Comparison by By Platform Type (2016-2032)
- Figure 142: Middle East & Africa Aerospace Raw Materials Market Market Y-o-Y Growth Rate Comparison by By Material Type (2016-2032)
- Figure 143: Middle East & Africa Aerospace Raw Materials Market Market Y-o-Y Growth Rate Comparison by By Sales Channel Type (2016-2032)
- Figure 144: Middle East & Africa Aerospace Raw Materials Market Market Share Comparison by Country (2016-2032)
- Figure 145: Middle East & Africa Aerospace Raw Materials Market Market Share Comparison by By Platform Type (2016-2032)
- Figure 146: Middle East & Africa Aerospace Raw Materials Market Market Share Comparison by By Material Type (2016-2032)
- Figure 147: Middle East & Africa Aerospace Raw Materials Market Market Share Comparison by By Sales Channel Type (2016-2032)
"
- List of Tables
- "
- Table 1: Global Aerospace Raw Materials Market Market Comparison by By Platform Type (2016-2032)
- Table 2: Global Aerospace Raw Materials Market Market Comparison by By Material Type (2016-2032)
- Table 3: Global Aerospace Raw Materials Market Market Comparison by By Sales Channel Type (2016-2032)
- Table 4: Global Aerospace Raw Materials Market Revenue (US$ Mn) Comparison by Region (2016-2032)
- Table 5: Global Aerospace Raw Materials Market Market Revenue (US$ Mn) (2016-2032)
- Table 6: Global Aerospace Raw Materials Market Market Revenue (US$ Mn) Comparison by Region (2016-2032)
- Table 7: Global Aerospace Raw Materials Market Market Revenue (US$ Mn) Comparison by By Platform Type (2016-2032)
- Table 8: Global Aerospace Raw Materials Market Market Revenue (US$ Mn) Comparison by By Material Type (2016-2032)
- Table 9: Global Aerospace Raw Materials Market Market Revenue (US$ Mn) Comparison by By Sales Channel Type (2016-2032)
- Table 10: Global Aerospace Raw Materials Market Market Y-o-Y Growth Rate Comparison by Region (2016-2032)
- Table 11: Global Aerospace Raw Materials Market Market Y-o-Y Growth Rate Comparison by By Platform Type (2016-2032)
- Table 12: Global Aerospace Raw Materials Market Market Y-o-Y Growth Rate Comparison by By Material Type (2016-2032)
- Table 13: Global Aerospace Raw Materials Market Market Y-o-Y Growth Rate Comparison by By Sales Channel Type (2016-2032)
- Table 14: Global Aerospace Raw Materials Market Market Share Comparison by Region (2016-2032)
- Table 15: Global Aerospace Raw Materials Market Market Share Comparison by By Platform Type (2016-2032)
- Table 16: Global Aerospace Raw Materials Market Market Share Comparison by By Material Type (2016-2032)
- Table 17: Global Aerospace Raw Materials Market Market Share Comparison by By Sales Channel Type (2016-2032)
- Table 18: North America Aerospace Raw Materials Market Market Comparison by By Material Type (2016-2032)
- Table 19: North America Aerospace Raw Materials Market Market Comparison by By Sales Channel Type (2016-2032)
- Table 20: North America Aerospace Raw Materials Market Revenue (US$ Mn) Comparison by Country (2016-2032)
- Table 21: North America Aerospace Raw Materials Market Market Revenue (US$ Mn) (2016-2032)
- Table 22: North America Aerospace Raw Materials Market Market Revenue (US$ Mn) Comparison by Country (2016-2032)
- Table 23: North America Aerospace Raw Materials Market Market Revenue (US$ Mn) Comparison by By Platform Type (2016-2032)
- Table 24: North America Aerospace Raw Materials Market Market Revenue (US$ Mn) Comparison by By Material Type (2016-2032)
- Table 25: North America Aerospace Raw Materials Market Market Revenue (US$ Mn) Comparison by By Sales Channel Type (2016-2032)
- Table 26: North America Aerospace Raw Materials Market Market Y-o-Y Growth Rate Comparison by Country (2016-2032)
- Table 27: North America Aerospace Raw Materials Market Market Y-o-Y Growth Rate Comparison by By Platform Type (2016-2032)
- Table 28: North America Aerospace Raw Materials Market Market Y-o-Y Growth Rate Comparison by By Material Type (2016-2032)
- Table 29: North America Aerospace Raw Materials Market Market Y-o-Y Growth Rate Comparison by By Sales Channel Type (2016-2032)
- Table 30: North America Aerospace Raw Materials Market Market Share Comparison by Country (2016-2032)
- Table 31: North America Aerospace Raw Materials Market Market Share Comparison by By Platform Type (2016-2032)
- Table 32: North America Aerospace Raw Materials Market Market Share Comparison by By Material Type (2016-2032)
- Table 33: North America Aerospace Raw Materials Market Market Share Comparison by By Sales Channel Type (2016-2032)
- Table 34: Western Europe Aerospace Raw Materials Market Market Comparison by By Platform Type (2016-2032)
- Table 35: Western Europe Aerospace Raw Materials Market Market Comparison by By Material Type (2016-2032)
- Table 36: Western Europe Aerospace Raw Materials Market Market Comparison by By Sales Channel Type (2016-2032)
- Table 37: Western Europe Aerospace Raw Materials Market Revenue (US$ Mn) Comparison by Country (2016-2032)
- Table 38: Western Europe Aerospace Raw Materials Market Market Revenue (US$ Mn) (2016-2032)
- Table 39: Western Europe Aerospace Raw Materials Market Market Revenue (US$ Mn) Comparison by Country (2016-2032)
- Table 40: Western Europe Aerospace Raw Materials Market Market Revenue (US$ Mn) Comparison by By Platform Type (2016-2032)
- Table 41: Western Europe Aerospace Raw Materials Market Market Revenue (US$ Mn) Comparison by By Material Type (2016-2032)
- Table 42: Western Europe Aerospace Raw Materials Market Market Revenue (US$ Mn) Comparison by By Sales Channel Type (2016-2032)
- Table 43: Western Europe Aerospace Raw Materials Market Market Y-o-Y Growth Rate Comparison by Country (2016-2032)
- Table 44: Western Europe Aerospace Raw Materials Market Market Y-o-Y Growth Rate Comparison by By Platform Type (2016-2032)
- Table 45: Western Europe Aerospace Raw Materials Market Market Y-o-Y Growth Rate Comparison by By Material Type (2016-2032)
- Table 46: Western Europe Aerospace Raw Materials Market Market Y-o-Y Growth Rate Comparison by By Sales Channel Type (2016-2032)
- Table 47: Western Europe Aerospace Raw Materials Market Market Share Comparison by Country (2016-2032)
- Table 48: Western Europe Aerospace Raw Materials Market Market Share Comparison by By Platform Type (2016-2032)
- Table 49: Western Europe Aerospace Raw Materials Market Market Share Comparison by By Material Type (2016-2032)
- Table 50: Western Europe Aerospace Raw Materials Market Market Share Comparison by By Sales Channel Type (2016-2032)
- Table 51: Eastern Europe Aerospace Raw Materials Market Market Comparison by By Platform Type (2016-2032)
- Table 52: Eastern Europe Aerospace Raw Materials Market Market Comparison by By Material Type (2016-2032)
- Table 53: Eastern Europe Aerospace Raw Materials Market Market Comparison by By Sales Channel Type (2016-2032)
- Table 54: Eastern Europe Aerospace Raw Materials Market Revenue (US$ Mn) Comparison by Country (2016-2032)
- Table 55: Eastern Europe Aerospace Raw Materials Market Market Revenue (US$ Mn) (2016-2032)
- Table 56: Eastern Europe Aerospace Raw Materials Market Market Revenue (US$ Mn) Comparison by Country (2016-2032)
- Table 57: Eastern Europe Aerospace Raw Materials Market Market Revenue (US$ Mn) Comparison by By Platform Type (2016-2032)
- Table 58: Eastern Europe Aerospace Raw Materials Market Market Revenue (US$ Mn) Comparison by By Material Type (2016-2032)
- Table 59: Eastern Europe Aerospace Raw Materials Market Market Revenue (US$ Mn) Comparison by By Sales Channel Type (2016-2032)
- Table 60: Eastern Europe Aerospace Raw Materials Market Market Y-o-Y Growth Rate Comparison by Country (2016-2032)
- Table 61: Eastern Europe Aerospace Raw Materials Market Market Y-o-Y Growth Rate Comparison by By Platform Type (2016-2032)
- Table 62: Eastern Europe Aerospace Raw Materials Market Market Y-o-Y Growth Rate Comparison by By Material Type (2016-2032)
- Table 63: Eastern Europe Aerospace Raw Materials Market Market Y-o-Y Growth Rate Comparison by By Sales Channel Type (2016-2032)
- Table 64: Eastern Europe Aerospace Raw Materials Market Market Share Comparison by Country (2016-2032)
- Table 65: Eastern Europe Aerospace Raw Materials Market Market Share Comparison by By Platform Type (2016-2032)
- Table 66: Eastern Europe Aerospace Raw Materials Market Market Share Comparison by By Material Type (2016-2032)
- Table 67: Eastern Europe Aerospace Raw Materials Market Market Share Comparison by By Sales Channel Type (2016-2032)
- Table 68: APAC Aerospace Raw Materials Market Market Comparison by By Platform Type (2016-2032)
- Table 69: APAC Aerospace Raw Materials Market Market Comparison by By Material Type (2016-2032)
- Table 70: APAC Aerospace Raw Materials Market Market Comparison by By Sales Channel Type (2016-2032)
- Table 71: APAC Aerospace Raw Materials Market Revenue (US$ Mn) Comparison by Country (2016-2032)
- Table 72: APAC Aerospace Raw Materials Market Market Revenue (US$ Mn) (2016-2032)
- Table 73: APAC Aerospace Raw Materials Market Market Revenue (US$ Mn) Comparison by Country (2016-2032)
- Table 74: APAC Aerospace Raw Materials Market Market Revenue (US$ Mn) Comparison by By Platform Type (2016-2032)
- Table 75: APAC Aerospace Raw Materials Market Market Revenue (US$ Mn) Comparison by By Material Type (2016-2032)
- Table 76: APAC Aerospace Raw Materials Market Market Revenue (US$ Mn) Comparison by By Sales Channel Type (2016-2032)
- Table 77: APAC Aerospace Raw Materials Market Market Y-o-Y Growth Rate Comparison by Country (2016-2032)
- Table 78: APAC Aerospace Raw Materials Market Market Y-o-Y Growth Rate Comparison by By Platform Type (2016-2032)
- Table 79: APAC Aerospace Raw Materials Market Market Y-o-Y Growth Rate Comparison by By Material Type (2016-2032)
- Table 80: APAC Aerospace Raw Materials Market Market Y-o-Y Growth Rate Comparison by By Sales Channel Type (2016-2032)
- Table 81: APAC Aerospace Raw Materials Market Market Share Comparison by Country (2016-2032)
- Table 82: APAC Aerospace Raw Materials Market Market Share Comparison by By Platform Type (2016-2032)
- Table 83: APAC Aerospace Raw Materials Market Market Share Comparison by By Material Type (2016-2032)
- Table 84: APAC Aerospace Raw Materials Market Market Share Comparison by By Sales Channel Type (2016-2032)
- Table 85: Latin America Aerospace Raw Materials Market Market Comparison by By Platform Type (2016-2032)
- Table 86: Latin America Aerospace Raw Materials Market Market Comparison by By Material Type (2016-2032)
- Table 87: Latin America Aerospace Raw Materials Market Market Comparison by By Sales Channel Type (2016-2032)
- Table 88: Latin America Aerospace Raw Materials Market Revenue (US$ Mn) Comparison by Country (2016-2032)
- Table 89: Latin America Aerospace Raw Materials Market Market Revenue (US$ Mn) (2016-2032)
- Table 90: Latin America Aerospace Raw Materials Market Market Revenue (US$ Mn) Comparison by Country (2016-2032)
- Table 91: Latin America Aerospace Raw Materials Market Market Revenue (US$ Mn) Comparison by By Platform Type (2016-2032)
- Table 92: Latin America Aerospace Raw Materials Market Market Revenue (US$ Mn) Comparison by By Material Type (2016-2032)
- Table 93: Latin America Aerospace Raw Materials Market Market Revenue (US$ Mn) Comparison by By Sales Channel Type (2016-2032)
- Table 94: Latin America Aerospace Raw Materials Market Market Y-o-Y Growth Rate Comparison by Country (2016-2032)
- Table 95: Latin America Aerospace Raw Materials Market Market Y-o-Y Growth Rate Comparison by By Platform Type (2016-2032)
- Table 96: Latin America Aerospace Raw Materials Market Market Y-o-Y Growth Rate Comparison by By Material Type (2016-2032)
- Table 97: Latin America Aerospace Raw Materials Market Market Y-o-Y Growth Rate Comparison by By Sales Channel Type (2016-2032)
- Table 98: Latin America Aerospace Raw Materials Market Market Share Comparison by Country (2016-2032)
- Table 99: Latin America Aerospace Raw Materials Market Market Share Comparison by By Platform Type (2016-2032)
- Table 100: Latin America Aerospace Raw Materials Market Market Share Comparison by By Material Type (2016-2032)
- Table 101: Latin America Aerospace Raw Materials Market Market Share Comparison by By Sales Channel Type (2016-2032)
- Table 102: Middle East & Africa Aerospace Raw Materials Market Market Comparison by By Platform Type (2016-2032)
- Table 103: Middle East & Africa Aerospace Raw Materials Market Market Comparison by By Material Type (2016-2032)
- Table 104: Middle East & Africa Aerospace Raw Materials Market Market Comparison by By Sales Channel Type (2016-2032)
- Table 105: Middle East & Africa Aerospace Raw Materials Market Revenue (US$ Mn) Comparison by Country (2016-2032)
- Table 106: Middle East & Africa Aerospace Raw Materials Market Market Revenue (US$ Mn) (2016-2032)
- Table 107: Middle East & Africa Aerospace Raw Materials Market Market Revenue (US$ Mn) Comparison by Country (2016-2032)
- Table 108: Middle East & Africa Aerospace Raw Materials Market Market Revenue (US$ Mn) Comparison by By Platform Type (2016-2032)
- Table 109: Middle East & Africa Aerospace Raw Materials Market Market Revenue (US$ Mn) Comparison by By Material Type (2016-2032)
- Table 110: Middle East & Africa Aerospace Raw Materials Market Market Revenue (US$ Mn) Comparison by By Sales Channel Type (2016-2032)
- Table 111: Middle East & Africa Aerospace Raw Materials Market Market Y-o-Y Growth Rate Comparison by Country (2016-2032)
- Table 112: Middle East & Africa Aerospace Raw Materials Market Market Y-o-Y Growth Rate Comparison by By Platform Type (2016-2032)
- Table 113: Middle East & Africa Aerospace Raw Materials Market Market Y-o-Y Growth Rate Comparison by By Material Type (2016-2032)
- Table 114: Middle East & Africa Aerospace Raw Materials Market Market Y-o-Y Growth Rate Comparison by By Sales Channel Type (2016-2032)
- Table 115: Middle East & Africa Aerospace Raw Materials Market Market Share Comparison by Country (2016-2032)
- Table 116: Middle East & Africa Aerospace Raw Materials Market Market Share Comparison by By Platform Type (2016-2032)
- Table 117: Middle East & Africa Aerospace Raw Materials Market Market Share Comparison by By Material Type (2016-2032)
- Table 118: Middle East & Africa Aerospace Raw Materials Market Market Share Comparison by By Sales Channel Type (2016-2032)
- 1. Executive Summary
-
- Global Titanium Inc
- AMETEK Inc
- ArcelorMittal
- NSSMC Group
- Supreme Engineering Ltd
- Technologies
- AMG Advanced Metallurgical Group
- Allegheny
- Incorporated (ATI)
- Precision Castparts Corp
- Special Metals
- Doncasters Group Ltd
Our Clients


View Our Licence Options
