Active Pharmaceutical Ingredient Market By Type of Drug(Prescription Drugs, Over-the-counter Drugs, Others), By Type(Innovative APIs, Generic APIS, Others), By Therapeutic Application(Communicable Diseases, Oncology, Others), By Region And Companies - Industry Segment Outlook, Market Assessment, Competition Scenario, Trends, And Forecast 2023-2032
-
41427
-
Sep 2023
-
170
-


-
This report was compiled by Correspondence Linkedin | Detailed Market research Methodology Our methodology involves a mix of primary research, including interviews with leading mental health experts, and secondary research from reputable medical journals and databases. View Detailed Methodology Page
-
Quick Navigation
Report Overview
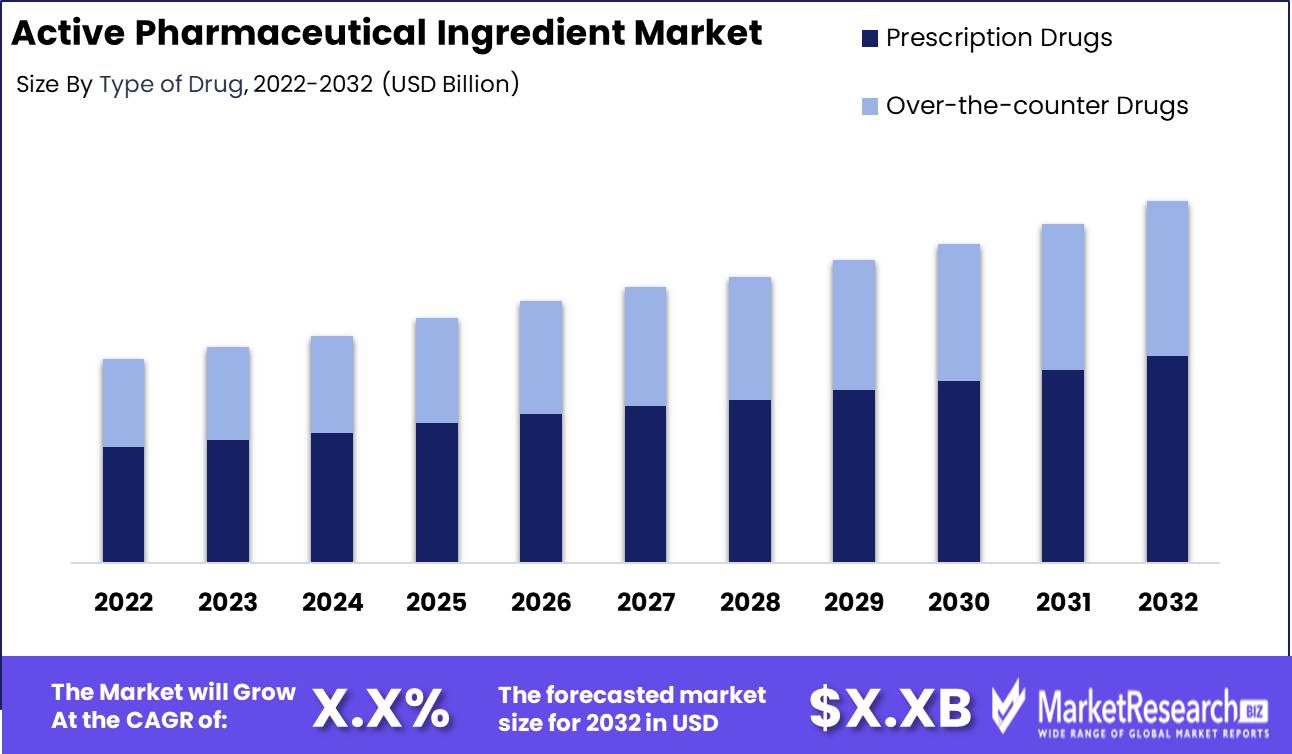
Active Pharmaceutical Ingredient Market size is expected to be worth around USD XX by 2032 from USD XX in 2022, growing at a CAGR of XX% during the forecast period from 2023 to 2032.
The active pharmaceutical ingredient market is experiencing significant growth and attracting major investments from various industries. The market, which refers to the chemical components responsible for the therapeutic effects of pharmaceutical drugs, plays a crucial role in the healthcare sector. With a surge in demand for effective medications, the active pharmaceutical ingredient market has witnessed notable innovations aimed at improving drug efficacy and patient outcomes. Companies are incorporating these ingredients into their products and services to provide high-quality healthcare solutions.
One of the key drivers of the active pharmaceutical ingredient market is the growing emphasis on transparency, explainability, and accountability in the pharmaceutical industry. As consumers become more informed about their healthcare choices, there is a need for pharmaceutical companies to disclose information about the ingredients used in their products. This increased transparency not only helps build trust with consumers but also ensures that companies adhere to ethical standards.
Furthermore, the active pharmaceutical ingredient market has witnessed significant growth due to its extensive applications in various business sectors. From pharmaceutical companies developing new drugs to cosmetic manufacturers creating innovative skincare products, the versatility of active pharmaceutical ingredients knows no bounds. This market has become a vital component in the success of many industries, enabling them to offer efficient and reliable solutions to their customers.
There are several notable examples of active pharmaceutical ingredient applications in various sectors. In the pharmaceutical industry, these ingredients are used to develop drugs that target specific diseases or conditions, improving patient outcomes and quality of life. In the cosmetics industry, active pharmaceutical ingredients are incorporated into skincare products to address various skin concerns and provide anti-aging benefits. Additionally, the food and beverage industry utilizes these ingredients to enhance the nutritional value and functional benefits of their products.
Driving factors
Generic Drug Demand
The demand for generic drugs has witnessed a tremendous upsurge over the years. Generic drugs, also known as off-patent drugs, are cost-effective alternatives to brand-name medications. They contain the same active ingredient, dosage form, and strength, ensuring therapeutic equivalence. Patients and healthcare providers have recognized the potential benefits of generic drugs, including reduced healthcare costs and increased accessibility to essential medications.
This surge in demand for generic drugs has propelled the active pharmaceutical ingredient market to new heights. Generic drug manufacturers heavily rely on APIs for the production of these cost-effective medications. Consequently, the robust demand for generic drugs directly influences the demand for APIs in the pharmaceutical industry.
Drug Patent Expirations
The expiration of drug patents serves as a catalyst for the API market. When pharmaceutical patents expire, it paves the way for other manufacturers to produce generic versions of the drug, thereby increasing competition and driving down prices. Generic drug manufacturers source APIs from API manufacturers to create affordable alternatives to patented drugs.
The expiration of drug patents creates a significant opportunity for API manufacturers to collaborate with generic drug manufacturers and supply them with high-quality active pharmaceutical ingredients. This allows the API market to thrive and expand, providing a wider range of options for patients and healthcare systems worldwide.
Biopharmaceuticals
In recent years, the biopharmaceutical sector has witnessed tremendous growth and innovation. Biopharmaceuticals are drugs derived from living organisms, such as proteins, peptides, or monoclonal antibodies. These complex molecules require advanced manufacturing processes and specialized APIs.
The production of biopharmaceuticals necessitates the use of biologically active substances, requiring a different set of skills and expertise from API manufacturers. As the biopharmaceutical industry continues to evolve, API manufacturers are adapting and expanding their capabilities to meet the unique demands of this sector.
The rising prominence of biopharmaceuticals presents a significant opportunity for API manufacturers to diversify their product portfolios and cater to the increasing demand for advanced therapies. By leveraging their expertise in API production, they can contribute to the development and manufacturing of groundbreaking biopharmaceutical products.
Restraining Factors
Price Erosion
Another restraining factor impacting the API market is price erosion. Price erosion refers to the gradual decline in the price of APIs over time. This phenomenon is primarily driven by factors such as increased competition, patent expiration of branded drugs, and cost-containment efforts by healthcare systems.
As APIs become commoditized and generic versions become available and affordable, the profit margins for API manufacturers tend to decrease. This puts pressure on their sustainability and profitability, reducing their ability to invest in research and development activities and maintain quality standards.
Price erosion also affects the overall value chain of the pharmaceutical industry. Pharmaceutical companies, in search of cost savings, often look for cheaper API sources, leading to a shift of API manufacturing to low-cost countries. While this may seem advantageous in terms of cost, it can compromise quality control measures and increase the risk of counterfeit or substandard APIs entering the market.
Supply Chain Disruptions
The active pharmaceutical ingredient market heavily relies on a global supply chain, connecting manufacturers, suppliers, and distributors across different continents. However, this interconnectedness can pose risks, especially when supply chain disruptions occur.
Supply chain disruptions include events such as natural disasters, geopolitical tensions, trade disputes, and pandemics. These disruptions can lead to delays in the transportation of APIs, shortages in supply, and increased prices. The COVID-19 pandemic, for instance, highlighted the vulnerabilities of the API supply chain, as many countries faced critical shortages of essential drugs due to disrupted supplies.
To mitigate the risks associated with supply chain disruptions, API manufacturers must invest in contingency planning, diversification of suppliers and transportation routes, and maintaining buffer stocks. However, such measures incur additional costs and can impact the pricing of APIs, further exacerbating the challenges faced by the industry.
Type of Drug Analysis
Prescription Drugs Segment dominates active pharmaceutical ingredient market
The active pharmaceutical ingredient (API) market has grown a lot recently. Prescription drugs are the dominant part of this API market. Prescription drugs are medications you can only get with a doctor's prescription. Regulators watch prescription drugs closely to ensure they are safe and work. Prescription drugs are big in the API market for several reasons. First, chronic diseases like heart disease, cancer, and diabetes are more common as the population ages. Effective prescription drugs are needed more.
Also, new research has led to innovative prescription drugs that target specific diseases. These complex prescription drugs require specialized manufacturing. So prescription drugs cover many customized medications for individual patients. In addition, countries are spending more on healthcare, including developing new prescription drugs. This brings better prescription drugs with better results.
Prescription drug use has grown especially fast in emerging economies as their healthcare has improved. More people can access and afford prescription medications. Chronic illnesses have also increased with lifestyle changes. So demand for prescription drugs has risen sharply.
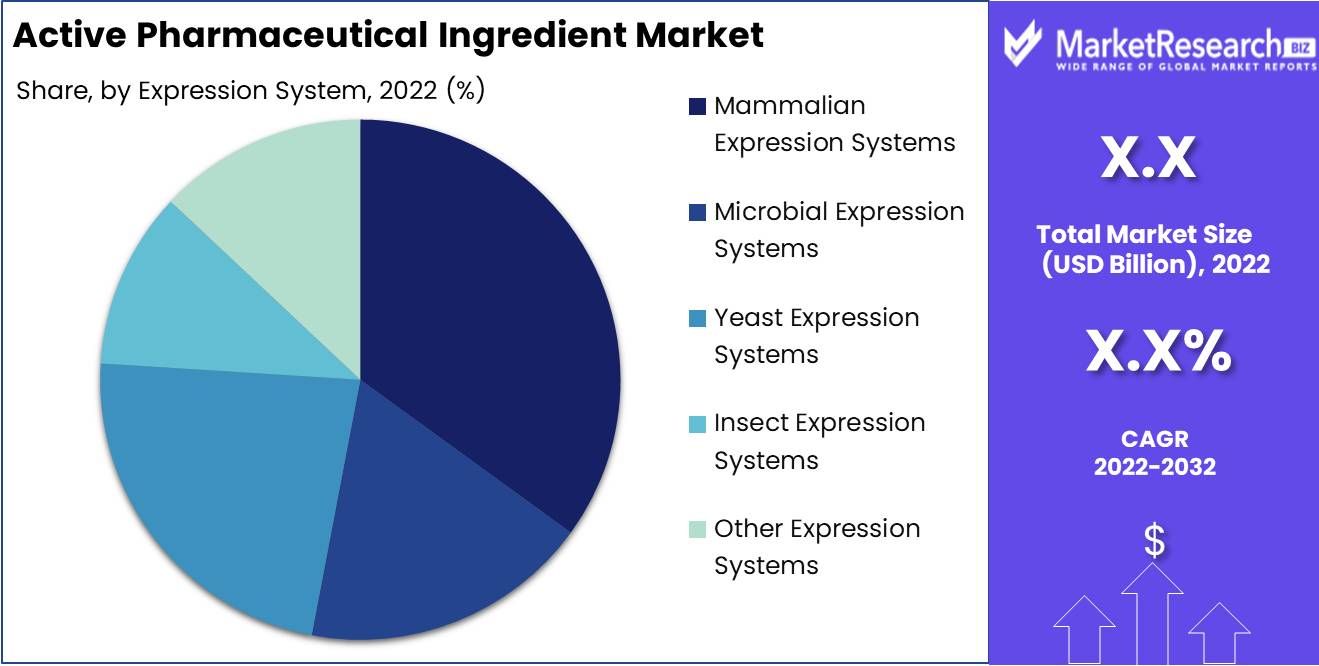
Expression System Analysis
Mammalian expression systems segment dominates the active pharmaceutical ingredient market
Mammalian expression systems have become the dominant technology for producing active pharmaceutical ingredients, particularly for biological drugs. This is due to their unique ability to generate complex human proteins that require post-translational modifications like glycosylation in order to be functional. Mammalian cells provide proper folding and assembly for multidomain proteins, maintaining their stability and bioactivity. The cell culture conditions also closely mimic the environment inside human cells, enabling optimal protein expression.
Additionally, mammalian cell lines used for API production are extremely well characterized and have a proven safety record. This minimizes the risks of host cell impurities. Improvements in vector design and expression constructs have also enabled high yields from mammalian systems, making them commercially viable on a large scale. The productivity of mammalian expression has increased to the point where they can produce APIs cost-effectively.
Finally, mammalian systems have a long track record of regulatory compliance for approved biological drugs across the globe. This experience facilitates regulatory filings for new biological drugs that utilize mammalian cell expression. The surge in demand for recombinant protein therapies and monoclonal antibodies has further driven the rapid adoption of mammalian expression.
Key Market Segments
By Type of Drug
- Prescription Drugs
- Over-the-counter Drugs
By Type
- Innovative APIs
- Generic APIS
Synthetic APIs, by Type
- Innovative Synthetic APIs
- Generic Synthetic APIs
- Biotech APIs Market
Biotech APIs, by Type
- Innovative Biotech APIs
- Generic Biotech APIs
Biotech APIs, by Product
- Monoclonal Antibodies
- Hormones
- Cytokines
- Fusion Proteins
- Therapeutic Enzymes
- Recombinant Vaccines
- Blood Factors
Biotech APIs, by Expression System
- Mammalian Expression Systems
- Microbial Expression Systems
- Yeast Expression Systems
- Insect Expression Systems
- Other Expression Systems
By Therapeutic Application
- Communicable Diseases
- Oncology
- Diabetes
- Cardiovascular Diseases
- Pain Management
- Respiratory Diseases
- Other
Growth Opportunity
Contract Development and Manufacturing (CDMO): Driving Growth and Efficiency
Contract development and manufacturing organizations (CDMOs) play a crucial role in the pharmaceutical industry, bridging the gap between API manufacturers and pharmaceutical companies. CDMOs offer end-to-end services, including process development, manufacturing, packaging, and regulatory support, enabling pharmaceutical companies to focus on their core competencies, such as research and marketing.
API manufacturers can leverage CDMOs to streamline their operations, reduce costs, and enhance efficiency. By collaborating with CDMOs, API manufacturers can benefit from their expertise, state-of-the-art facilities, and regulatory compliance, thereby accelerating the development and commercialization of their products. The growing trend of outsourcing manufacturing processes to CDMOs is expected to fuel the growth of the API market in the coming years.
Emerging Markets: Key Players in API Market Expansion
Emerging markets, such as India, China, Brazil, and South Africa, are playing a pivotal role in the expansion of the API market. These markets offer significant advantages, such as a large patient population, growing pharmaceutical industries, low manufacturing costs, and supportive government policies.
India, in particular, has emerged as a global API hub, accounting for a substantial share of the global API market. The favorable regulatory environment, availability of skilled labor, and a vast pool of API manufacturers have contributed to India's dominance in API production. Similarly, China's booming pharmaceutical industry, coupled with its strong manufacturing capabilities, has made it a key player in the API market.
Furthermore, the rising healthcare expenditure and increasing demand for affordable medications in emerging markets are driving the demand for generic drugs, which heavily rely on APIs. As a result, API manufacturers are actively tapping into these markets to cater to the growing demand, thus propelling the growth of the overall API market.
Continuous Manufacturing: Revolutionizing API Production
Continuous manufacturing has revolutionized the pharmaceutical industry, including API production. Traditionally, API manufacturing involved batch-based processes that required significant resources, time, and manual intervention. However, continuous manufacturing offers numerous advantages, such as increased productivity, cost-effectiveness, reduced waste generation, improved product quality, and shortened development timelines.
Adopting continuous manufacturing in API production enables manufacturers to optimize their operations, enhance process control, and achieve consistent quality. This, in turn, leads to improved time-to-market, reduced production costs, and increased competitiveness. The integration of advanced technologies, such as process analytical technology (PAT), automation, and artificial intelligence (AI), further enhances the efficiency and effectiveness of continuous API manufacturing.
Latest Trends
Biocatalysis and Green Chemistry: Revolutionizing API Production
Biocatalysis and Green Chemistry are transforming the API landscape by offering sustainable and eco-friendly solutions for pharmaceutical manufacturing. These innovative approaches utilize biological catalysts or enzymes to drive chemical reactions, replacing traditional methods that are often resource-intensive and generate large amounts of waste. The adoption of Biocatalysis and Green Chemistry not only reduces the environmental impact but also improves cost-effectiveness and process efficiency. Companies embracing this trend are able to position themselves as responsible and forward-thinking players in the API market, gaining a competitive edge.
Virtual API Manufacturing: Embracing Digital Transformations
Virtual API Manufacturing, also known as remote or digital manufacturing, is a transformative trend that optimizes efficiency by utilizing advanced technologies. It involves leveraging digital platforms and interconnected systems to monitor, control, and streamline API production processes. By implementing virtual manufacturing, companies can significantly reduce costs associated with physical infrastructure, labor, and transportation. The advantages of virtual manufacturing include enhanced scalability, real-time analytics, and improved supply chain management. Embracing this trend empowers API manufacturers to achieve operational excellence, thereby fostering competitiveness in the market.
API Patents: Protecting Intellectual Property
API Patents play a pivotal role in shaping the active pharmaceutical ingredient industry. Securing patents for novel APIs provides manufacturers with exclusivity and protects their intellectual property rights. Patents act as a defensive measure against competitors, preventing them from replicating or manufacturing the same API without permission. This exclusivity grants companies a significant advantage, allowing them to leverage their patent portfolio as a strategic asset and potentially establish long-term market dominance. API manufacturers investing in research and development to develop innovative APIs must prioritize protecting their inventions through patents to safeguard their competitiveness.
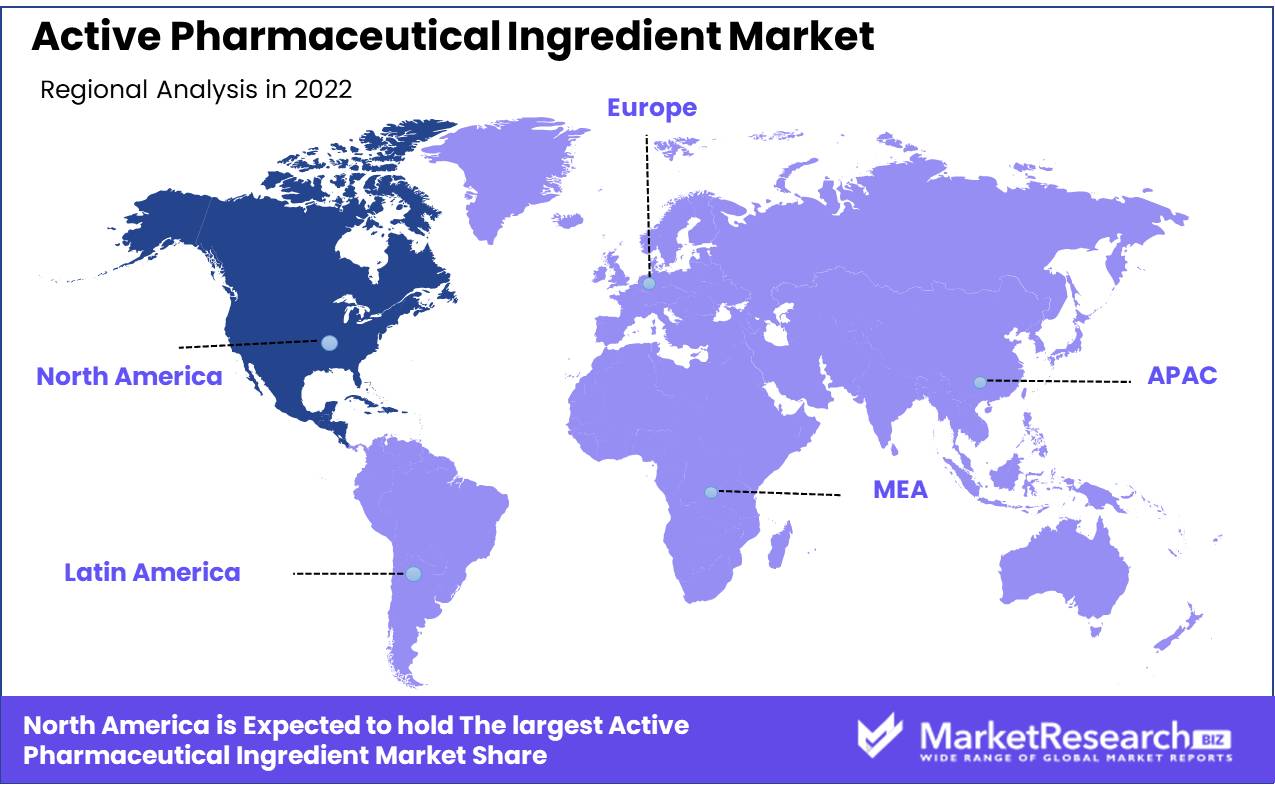
Regional Analysis
North America: The Dominant Region in the Active Pharmaceutical Ingredient Market
North America boasts a thriving pharmaceutical industry, driven by constant technological advancements and robust research and development (R&D) efforts. The region is home to cutting-edge laboratory facilities, advanced manufacturing technologies, and state-of-the-art equipment. This enables pharmaceutical companies in North America to develop, produce, and supply high-quality APIs with precision and efficiency.
North America's pharmaceutical industry operates under strict regulatory standards enforced by agencies such as the Food and Drug Administration (FDA) in the United States and Health Canada. These regulatory bodies rigorously assess the safety, efficacy, and quality of APIs to ensure patient safety. The adherence to strict compliance measures sets North American API manufacturers apart and gives them a competitive edge, especially when exporting APIs to other regions.
The region boasts a well-established and reliable supply chain infrastructure, encompassing raw material sourcing, manufacturing facilities, and distribution networks. North America's well-connected transportation system facilitates the seamless movement of APIs from manufacturing facilities to end-users, both within the region and internationally. This efficient supply chain ensures a steady and uninterrupted flow of APIs, thereby maintaining the region's dominance in the global market.
North America's pharmaceutical industry is home to a highly skilled and knowledgeable workforce. The region attracts top talent from around the world, with its renowned academic institutions, research centers, and pharmaceutical companies offering rewarding career opportunities. The collective expertise of scientists, researchers, and professionals in North America contributes to the continuous innovation and development of APIs, cementing the region's position as a key player in the global market.
Key Regions and Countries
North America
- US
- Canada
- Mexico
Western Europe
- Germany
- France
- The UK
- Spain
- Italy
- Portugal
- Ireland
- Austria
- Switzerland
- Benelux
- Nordic
- Rest of Western Europe
Eastern Europe
- Russia
- Poland
- The Czech Republic
- Greece
- Rest of Eastern Europe
APAC
- China
- Japan
- South Korea
- India
- Australia & New Zealand
- Indonesia
- Malaysia
- Philippines
- Singapore
- Thailand
- Vietnam
- Rest of APAC
Latin America
- Brazil
- Colombia
- Chile
- Argentina
- Costa Rica
- Rest of Latin America
Middle East & Africa
- Algeria
- Egypt
- Israel
- Kuwait
- Nigeria
- Saudi Arabia
- South Africa
- Turkey
- United Arab Emirates
- Rest of MEA
Key Players Analysis
Pfizer, a renowned pharmaceutical giant, has established itself as a key player in the API market. With a strong focus on research and development, Pfizer consistently introduces groundbreaking APIs to the market. Leveraging its vast experience, the company has developed a wide range of APIs used in the treatment of various diseases, including cancer, cardiovascular disorders, and neurological conditions. Pfizer's commitment to quality and safety has garnered immense trust among healthcare professionals and patients alike.
Novartis, another leading player, has positioned itself as a global provider of API solutions. Their extensive portfolio boasts APIs that cater to critical therapeutic areas, such as oncology, immunology, and neurology. Novartis's commitment to research and development allows them to develop innovative APIs that address unmet medical needs. They constantly strive to create patient-centric solutions, focusing not only on efficacy but also on affordability and accessibility.
Sanofi, a global biopharmaceutical company, has emerged as a key player in the API market by harnessing the power of biotechnology. By integrating biotechnological advancements, Sanofi has revolutionized the production of APIs, making them more efficient and cost-effective. Their extensive range of APIs covers therapeutic areas such as diabetes, cardiovascular diseases, and rare genetic disorders. Sanofi's commitment to sustainability and environmental responsibility further strengthens its position in the API market.
Boehringer Ingelheim, known for its strong emphasis on innovation, plays a vital role in shaping the API market. With an extensive network of research and development centers, Boehringer Ingelheim consistently introduces novel APIs that address evolving healthcare needs. The company's APIs are widely recognized for their superior quality and efficacy. Boehringer Ingelheim's commitment to improving patient outcomes and advancing healthcare globally has earned them a prominent position among API manufacturers.
Top Key Players in Active Pharmaceutical Ingredient Market
- Pfizer
- Novartis
- Sanofi
- Boehringer Ingelheim
- BASF
- Merck & Co.
- Teva Pharmaceutical
- Sun Pharmaceutical
- Aurobindo Pharma
- Cipla
- Others
Recent Development
- In 2022, Dr. Reddy's Laboratories opened a new state-of-the-art API manufacturing facility in Andhra Pradesh, India, representing a major investment aimed at increasing production capacity and meeting growing global API demand.
- In 2021, Pfizer invested $120 million to expand its API manufacturing facility in Michigan, U.S. This significant investment was motivated by surging demand for high-quality APIs and the necessity to enhance overall capabilities.
- In 2020, Swiss pharmaceutical company Lonza Group unveiled a large-scale, cutting-edge API manufacturing facility in Visp, Switzerland. This new facility greatly expands Lonza's capacity to produce top-quality APIs.
Report Scope
Report Features Description Market Value (2022) USD XX Forecast Revenue (2032) USD XX CAGR (2023-2032) XX% Base Year for Estimation 2022 Historic Period 2016-2022 Forecast Period 2023-2032 Report Coverage Revenue Forecast, Market Dynamics, COVID-19 Impact, Competitive Landscape, Recent Developments Segments Covered By Type of Drug(Prescription Drugs, Over-the-counter Drugs, Others), By Type(Innovative APIs, Generic APIS, Others), By Therapeutic Application(Communicable Diseases, Oncology, Others) Regional Analysis North America – The US, Canada, & Mexico; Western Europe – Germany, France, The UK, Spain, Italy, Portugal, Ireland, Austria, Switzerland, Benelux, Nordic, & Rest of Western Europe; Eastern Europe – Russia, Poland, The Czech Republic, Greece, & Rest of Eastern Europe; APAC – China, Japan, South Korea, India, Australia & New Zealand, Indonesia, Malaysia, Philippines, Singapore, Thailand, Vietnam, & Rest of APAC; Latin America – Brazil, Colombia, Chile, Argentina, Costa Rica, & Rest of Latin America; Middle East & Africa – Algeria, Egypt, Israel, Kuwait, Nigeria, Saudi Arabia, South Africa, Turkey, United Arab Emirates, & Rest of MEA Competitive Landscape Pfizer, Novartis , Sanofi , Boehringer Ingelheim, BASF, Merck & Co., Teva Pharmaceutical, Sun Pharmaceutical, Aurobindo Pharma, Cipla Customization Scope Customization for segments, region/country-level will be provided. Moreover, additional customization can be done based on the requirements. Purchase Options We have three licenses to opt for: Single User License, Multi-User License (Up to 5 Users), Corporate Use License (Unlimited User and Printable PDF) -
- 1. Executive Summary
- 1.1. Definition
- 1.2. Taxonomy
- 1.3. Research Scope
- 1.4. Key Analysis
- 1.5. Key Findings by Major Segments
- 1.6. Top strategies by Major Players
- 2. Global Active Pharmaceutical Ingredient Market Overview
- 2.1. Active Pharmaceutical Ingredient Market Dynamics
- 2.1.1. Drivers
- 2.1.2. Opportunities
- 2.1.3. Restraints
- 2.1.4. Challenges
- 2.2. Macro-economic Factors
- 2.3. Regulatory Framework
- 2.4. Market Investment Feasibility Index
- 2.5. PEST Analysis
- 2.6. PORTER’S Five Force Analysis
- 2.7. Drivers & Restraints Impact Analysis
- 2.8. Industry Chain Analysis
- 2.9. Cost Structure Analysis
- 2.10. Marketing Strategy
- 2.11. Russia-Ukraine War Impact Analysis
- 2.12. Opportunity Map Analysis
- 2.13. Market Competition Scenario Analysis
- 2.14. Product Life Cycle Analysis
- 2.15. Opportunity Orbits
- 2.16. Manufacturer Intensity Map
- 2.17. Major Companies sales by Value & Volume
- 2.1. Active Pharmaceutical Ingredient Market Dynamics
- 3. Global Active Pharmaceutical Ingredient Market Analysis, Opportunity and Forecast, 2016-2032
- 3.1. Global Active Pharmaceutical Ingredient Market Analysis, 2016-2021
- 3.2. Global Active Pharmaceutical Ingredient Market Opportunity and Forecast, 2023-2032
- 3.3. Global Active Pharmaceutical Ingredient Market Analysis, Opportunity and Forecast, By By Type of Drug, 2016-2032
- 3.3.1. Global Active Pharmaceutical Ingredient Market Analysis by By Type of Drug: Introduction
- 3.3.2. Market Size Absolute $ Opportunity Analysis and Forecast, By By Type of Drug, 2016-2032
- 3.3.3. Prescription Drugs
- 3.3.4. Over-the-counter Drugs
- 3.4. Global Active Pharmaceutical Ingredient Market Analysis, Opportunity and Forecast, By By Type, 2016-2032
- 3.4.1. Global Active Pharmaceutical Ingredient Market Analysis by By Type: Introduction
- 3.4.2. Market Size Absolute $ Opportunity Analysis and Forecast, By By Type, 2016-2032
- 3.4.3. Innovative APIs
- 3.4.4. Generic APIS
- 3.5. Global Active Pharmaceutical Ingredient Market Analysis, Opportunity and Forecast, By Synthetic APIs, by Type, 2016-2032
- 3.5.1. Global Active Pharmaceutical Ingredient Market Analysis by Synthetic APIs, by Type: Introduction
- 3.5.2. Market Size Absolute $ Opportunity Analysis and Forecast, By Synthetic APIs, by Type, 2016-2032
- 3.5.3. Innovative Synthetic APIs
- 3.5.4. Generic Synthetic APIs
- 3.5.5. Biotech APIs Market
- 3.6. Global Active Pharmaceutical Ingredient Market Analysis, Opportunity and Forecast, By Biotech APIs, by Type, 2016-2032
- 3.6.1. Global Active Pharmaceutical Ingredient Market Analysis by Biotech APIs, by Type: Introduction
- 3.6.2. Market Size Absolute $ Opportunity Analysis and Forecast, By Biotech APIs, by Type, 2016-2032
- 3.6.3. Innovative Biotech APIs
- 3.6.4. Generic Biotech APIs
- 3.7. Global Active Pharmaceutical Ingredient Market Analysis, Opportunity and Forecast, By Biotech APIs, by Product, 2016-2032
- 3.7.1. Global Active Pharmaceutical Ingredient Market Analysis by Biotech APIs, by Product: Introduction
- 3.7.2. Market Size Absolute $ Opportunity Analysis and Forecast, By Biotech APIs, by Product, 2016-2032
- 3.7.3. Monoclonal Antibodies
- 3.7.4. Hormones
- 3.7.5. Cytokines
- 3.7.6. Fusion Proteins
- 3.7.7. Therapeutic Enzymes
- 3.7.8. Recombinant Vaccines
- 3.7.9. Blood Factors
- 3.8. Global Active Pharmaceutical Ingredient Market Analysis, Opportunity and Forecast, By Biotech APIs, by Expression System, 2016-2032
- 3.8.1. Global Active Pharmaceutical Ingredient Market Analysis by Biotech APIs, by Expression System: Introduction
- 3.8.2. Market Size Absolute $ Opportunity Analysis and Forecast, By Biotech APIs, by Expression System, 2016-2032
- 3.8.3. Mammalian Expression Systems
- 3.8.4. Microbial Expression Systems
- 3.8.5. Yeast Expression Systems
- 3.8.6. Insect Expression Systems
- 3.8.7. Other Expression Systems
- 4. North America Active Pharmaceutical Ingredient Market Analysis, Opportunity and Forecast, 2016-2032
- 4.1. North America Active Pharmaceutical Ingredient Market Analysis, 2016-2021
- 4.2. North America Active Pharmaceutical Ingredient Market Opportunity and Forecast, 2023-2032
- 4.3. North America Active Pharmaceutical Ingredient Market Analysis, Opportunity and Forecast, By By Type of Drug, 2016-2032
- 4.3.1. North America Active Pharmaceutical Ingredient Market Analysis by By Type of Drug: Introduction
- 4.3.2. Market Size Absolute $ Opportunity Analysis and Forecast, By By Type of Drug, 2016-2032
- 4.3.3. Prescription Drugs
- 4.3.4. Over-the-counter Drugs
- 4.4. North America Active Pharmaceutical Ingredient Market Analysis, Opportunity and Forecast, By By Type, 2016-2032
- 4.4.1. North America Active Pharmaceutical Ingredient Market Analysis by By Type: Introduction
- 4.4.2. Market Size Absolute $ Opportunity Analysis and Forecast, By By Type, 2016-2032
- 4.4.3. Innovative APIs
- 4.4.4. Generic APIS
- 4.5. North America Active Pharmaceutical Ingredient Market Analysis, Opportunity and Forecast, By Synthetic APIs, by Type, 2016-2032
- 4.5.1. North America Active Pharmaceutical Ingredient Market Analysis by Synthetic APIs, by Type: Introduction
- 4.5.2. Market Size Absolute $ Opportunity Analysis and Forecast, By Synthetic APIs, by Type, 2016-2032
- 4.5.3. Innovative Synthetic APIs
- 4.5.4. Generic Synthetic APIs
- 4.5.5. Biotech APIs Market
- 4.6. North America Active Pharmaceutical Ingredient Market Analysis, Opportunity and Forecast, By Biotech APIs, by Type, 2016-2032
- 4.6.1. North America Active Pharmaceutical Ingredient Market Analysis by Biotech APIs, by Type: Introduction
- 4.6.2. Market Size Absolute $ Opportunity Analysis and Forecast, By Biotech APIs, by Type, 2016-2032
- 4.6.3. Innovative Biotech APIs
- 4.6.4. Generic Biotech APIs
- 4.7. North America Active Pharmaceutical Ingredient Market Analysis, Opportunity and Forecast, By Biotech APIs, by Product, 2016-2032
- 4.7.1. North America Active Pharmaceutical Ingredient Market Analysis by Biotech APIs, by Product: Introduction
- 4.7.2. Market Size Absolute $ Opportunity Analysis and Forecast, By Biotech APIs, by Product, 2016-2032
- 4.7.3. Monoclonal Antibodies
- 4.7.4. Hormones
- 4.7.5. Cytokines
- 4.7.6. Fusion Proteins
- 4.7.7. Therapeutic Enzymes
- 4.7.8. Recombinant Vaccines
- 4.7.9. Blood Factors
- 4.8. North America Active Pharmaceutical Ingredient Market Analysis, Opportunity and Forecast, By Biotech APIs, by Expression System, 2016-2032
- 4.8.1. North America Active Pharmaceutical Ingredient Market Analysis by Biotech APIs, by Expression System: Introduction
- 4.8.2. Market Size Absolute $ Opportunity Analysis and Forecast, By Biotech APIs, by Expression System, 2016-2032
- 4.8.3. Mammalian Expression Systems
- 4.8.4. Microbial Expression Systems
- 4.8.5. Yeast Expression Systems
- 4.8.6. Insect Expression Systems
- 4.8.7. Other Expression Systems
- 4.9. North America Active Pharmaceutical Ingredient Market Analysis, Opportunity and Forecast, By Country , 2016-2032
- 4.9.1. North America Active Pharmaceutical Ingredient Market Analysis by Country : Introduction
- 4.9.2. Market Size Absolute $ Opportunity Analysis and Forecast, Country , 2016-2032
- 4.9.2.1. The US
- 4.9.2.2. Canada
- 4.9.2.3. Mexico
- 5. Western Europe Active Pharmaceutical Ingredient Market Analysis, Opportunity and Forecast, 2016-2032
- 5.1. Western Europe Active Pharmaceutical Ingredient Market Analysis, 2016-2021
- 5.2. Western Europe Active Pharmaceutical Ingredient Market Opportunity and Forecast, 2023-2032
- 5.3. Western Europe Active Pharmaceutical Ingredient Market Analysis, Opportunity and Forecast, By By Type of Drug, 2016-2032
- 5.3.1. Western Europe Active Pharmaceutical Ingredient Market Analysis by By Type of Drug: Introduction
- 5.3.2. Market Size Absolute $ Opportunity Analysis and Forecast, By By Type of Drug, 2016-2032
- 5.3.3. Prescription Drugs
- 5.3.4. Over-the-counter Drugs
- 5.4. Western Europe Active Pharmaceutical Ingredient Market Analysis, Opportunity and Forecast, By By Type, 2016-2032
- 5.4.1. Western Europe Active Pharmaceutical Ingredient Market Analysis by By Type: Introduction
- 5.4.2. Market Size Absolute $ Opportunity Analysis and Forecast, By By Type, 2016-2032
- 5.4.3. Innovative APIs
- 5.4.4. Generic APIS
- 5.5. Western Europe Active Pharmaceutical Ingredient Market Analysis, Opportunity and Forecast, By Synthetic APIs, by Type, 2016-2032
- 5.5.1. Western Europe Active Pharmaceutical Ingredient Market Analysis by Synthetic APIs, by Type: Introduction
- 5.5.2. Market Size Absolute $ Opportunity Analysis and Forecast, By Synthetic APIs, by Type, 2016-2032
- 5.5.3. Innovative Synthetic APIs
- 5.5.4. Generic Synthetic APIs
- 5.5.5. Biotech APIs Market
- 5.6. Western Europe Active Pharmaceutical Ingredient Market Analysis, Opportunity and Forecast, By Biotech APIs, by Type, 2016-2032
- 5.6.1. Western Europe Active Pharmaceutical Ingredient Market Analysis by Biotech APIs, by Type: Introduction
- 5.6.2. Market Size Absolute $ Opportunity Analysis and Forecast, By Biotech APIs, by Type, 2016-2032
- 5.6.3. Innovative Biotech APIs
- 5.6.4. Generic Biotech APIs
- 5.7. Western Europe Active Pharmaceutical Ingredient Market Analysis, Opportunity and Forecast, By Biotech APIs, by Product, 2016-2032
- 5.7.1. Western Europe Active Pharmaceutical Ingredient Market Analysis by Biotech APIs, by Product: Introduction
- 5.7.2. Market Size Absolute $ Opportunity Analysis and Forecast, By Biotech APIs, by Product, 2016-2032
- 5.7.3. Monoclonal Antibodies
- 5.7.4. Hormones
- 5.7.5. Cytokines
- 5.7.6. Fusion Proteins
- 5.7.7. Therapeutic Enzymes
- 5.7.8. Recombinant Vaccines
- 5.7.9. Blood Factors
- 5.8. Western Europe Active Pharmaceutical Ingredient Market Analysis, Opportunity and Forecast, By Biotech APIs, by Expression System, 2016-2032
- 5.8.1. Western Europe Active Pharmaceutical Ingredient Market Analysis by Biotech APIs, by Expression System: Introduction
- 5.8.2. Market Size Absolute $ Opportunity Analysis and Forecast, By Biotech APIs, by Expression System, 2016-2032
- 5.8.3. Mammalian Expression Systems
- 5.8.4. Microbial Expression Systems
- 5.8.5. Yeast Expression Systems
- 5.8.6. Insect Expression Systems
- 5.8.7. Other Expression Systems
- 5.9. Western Europe Active Pharmaceutical Ingredient Market Analysis, Opportunity and Forecast, By Country , 2016-2032
- 5.9.1. Western Europe Active Pharmaceutical Ingredient Market Analysis by Country : Introduction
- 5.9.2. Market Size Absolute $ Opportunity Analysis and Forecast, Country , 2016-2032
- 5.9.2.1. Germany
- 5.9.2.2. France
- 5.9.2.3. The UK
- 5.9.2.4. Spain
- 5.9.2.5. Italy
- 5.9.2.6. Portugal
- 5.9.2.7. Ireland
- 5.9.2.8. Austria
- 5.9.2.9. Switzerland
- 5.9.2.10. Benelux
- 5.9.2.11. Nordic
- 5.9.2.12. Rest of Western Europe
- 6. Eastern Europe Active Pharmaceutical Ingredient Market Analysis, Opportunity and Forecast, 2016-2032
- 6.1. Eastern Europe Active Pharmaceutical Ingredient Market Analysis, 2016-2021
- 6.2. Eastern Europe Active Pharmaceutical Ingredient Market Opportunity and Forecast, 2023-2032
- 6.3. Eastern Europe Active Pharmaceutical Ingredient Market Analysis, Opportunity and Forecast, By By Type of Drug, 2016-2032
- 6.3.1. Eastern Europe Active Pharmaceutical Ingredient Market Analysis by By Type of Drug: Introduction
- 6.3.2. Market Size Absolute $ Opportunity Analysis and Forecast, By By Type of Drug, 2016-2032
- 6.3.3. Prescription Drugs
- 6.3.4. Over-the-counter Drugs
- 6.4. Eastern Europe Active Pharmaceutical Ingredient Market Analysis, Opportunity and Forecast, By By Type, 2016-2032
- 6.4.1. Eastern Europe Active Pharmaceutical Ingredient Market Analysis by By Type: Introduction
- 6.4.2. Market Size Absolute $ Opportunity Analysis and Forecast, By By Type, 2016-2032
- 6.4.3. Innovative APIs
- 6.4.4. Generic APIS
- 6.5. Eastern Europe Active Pharmaceutical Ingredient Market Analysis, Opportunity and Forecast, By Synthetic APIs, by Type, 2016-2032
- 6.5.1. Eastern Europe Active Pharmaceutical Ingredient Market Analysis by Synthetic APIs, by Type: Introduction
- 6.5.2. Market Size Absolute $ Opportunity Analysis and Forecast, By Synthetic APIs, by Type, 2016-2032
- 6.5.3. Innovative Synthetic APIs
- 6.5.4. Generic Synthetic APIs
- 6.5.5. Biotech APIs Market
- 6.6. Eastern Europe Active Pharmaceutical Ingredient Market Analysis, Opportunity and Forecast, By Biotech APIs, by Type, 2016-2032
- 6.6.1. Eastern Europe Active Pharmaceutical Ingredient Market Analysis by Biotech APIs, by Type: Introduction
- 6.6.2. Market Size Absolute $ Opportunity Analysis and Forecast, By Biotech APIs, by Type, 2016-2032
- 6.6.3. Innovative Biotech APIs
- 6.6.4. Generic Biotech APIs
- 6.7. Eastern Europe Active Pharmaceutical Ingredient Market Analysis, Opportunity and Forecast, By Biotech APIs, by Product, 2016-2032
- 6.7.1. Eastern Europe Active Pharmaceutical Ingredient Market Analysis by Biotech APIs, by Product: Introduction
- 6.7.2. Market Size Absolute $ Opportunity Analysis and Forecast, By Biotech APIs, by Product, 2016-2032
- 6.7.3. Monoclonal Antibodies
- 6.7.4. Hormones
- 6.7.5. Cytokines
- 6.7.6. Fusion Proteins
- 6.7.7. Therapeutic Enzymes
- 6.7.8. Recombinant Vaccines
- 6.7.9. Blood Factors
- 6.8. Eastern Europe Active Pharmaceutical Ingredient Market Analysis, Opportunity and Forecast, By Biotech APIs, by Expression System, 2016-2032
- 6.8.1. Eastern Europe Active Pharmaceutical Ingredient Market Analysis by Biotech APIs, by Expression System: Introduction
- 6.8.2. Market Size Absolute $ Opportunity Analysis and Forecast, By Biotech APIs, by Expression System, 2016-2032
- 6.8.3. Mammalian Expression Systems
- 6.8.4. Microbial Expression Systems
- 6.8.5. Yeast Expression Systems
- 6.8.6. Insect Expression Systems
- 6.8.7. Other Expression Systems
- 6.9. Eastern Europe Active Pharmaceutical Ingredient Market Analysis, Opportunity and Forecast, By Country , 2016-2032
- 6.9.1. Eastern Europe Active Pharmaceutical Ingredient Market Analysis by Country : Introduction
- 6.9.2. Market Size Absolute $ Opportunity Analysis and Forecast, Country , 2016-2032
- 6.9.2.1. Russia
- 6.9.2.2. Poland
- 6.9.2.3. The Czech Republic
- 6.9.2.4. Greece
- 6.9.2.5. Rest of Eastern Europe
- 7. APAC Active Pharmaceutical Ingredient Market Analysis, Opportunity and Forecast, 2016-2032
- 7.1. APAC Active Pharmaceutical Ingredient Market Analysis, 2016-2021
- 7.2. APAC Active Pharmaceutical Ingredient Market Opportunity and Forecast, 2023-2032
- 7.3. APAC Active Pharmaceutical Ingredient Market Analysis, Opportunity and Forecast, By By Type of Drug, 2016-2032
- 7.3.1. APAC Active Pharmaceutical Ingredient Market Analysis by By Type of Drug: Introduction
- 7.3.2. Market Size Absolute $ Opportunity Analysis and Forecast, By By Type of Drug, 2016-2032
- 7.3.3. Prescription Drugs
- 7.3.4. Over-the-counter Drugs
- 7.4. APAC Active Pharmaceutical Ingredient Market Analysis, Opportunity and Forecast, By By Type, 2016-2032
- 7.4.1. APAC Active Pharmaceutical Ingredient Market Analysis by By Type: Introduction
- 7.4.2. Market Size Absolute $ Opportunity Analysis and Forecast, By By Type, 2016-2032
- 7.4.3. Innovative APIs
- 7.4.4. Generic APIS
- 7.5. APAC Active Pharmaceutical Ingredient Market Analysis, Opportunity and Forecast, By Synthetic APIs, by Type, 2016-2032
- 7.5.1. APAC Active Pharmaceutical Ingredient Market Analysis by Synthetic APIs, by Type: Introduction
- 7.5.2. Market Size Absolute $ Opportunity Analysis and Forecast, By Synthetic APIs, by Type, 2016-2032
- 7.5.3. Innovative Synthetic APIs
- 7.5.4. Generic Synthetic APIs
- 7.5.5. Biotech APIs Market
- 7.6. APAC Active Pharmaceutical Ingredient Market Analysis, Opportunity and Forecast, By Biotech APIs, by Type, 2016-2032
- 7.6.1. APAC Active Pharmaceutical Ingredient Market Analysis by Biotech APIs, by Type: Introduction
- 7.6.2. Market Size Absolute $ Opportunity Analysis and Forecast, By Biotech APIs, by Type, 2016-2032
- 7.6.3. Innovative Biotech APIs
- 7.6.4. Generic Biotech APIs
- 7.7. APAC Active Pharmaceutical Ingredient Market Analysis, Opportunity and Forecast, By Biotech APIs, by Product, 2016-2032
- 7.7.1. APAC Active Pharmaceutical Ingredient Market Analysis by Biotech APIs, by Product: Introduction
- 7.7.2. Market Size Absolute $ Opportunity Analysis and Forecast, By Biotech APIs, by Product, 2016-2032
- 7.7.3. Monoclonal Antibodies
- 7.7.4. Hormones
- 7.7.5. Cytokines
- 7.7.6. Fusion Proteins
- 7.7.7. Therapeutic Enzymes
- 7.7.8. Recombinant Vaccines
- 7.7.9. Blood Factors
- 7.8. APAC Active Pharmaceutical Ingredient Market Analysis, Opportunity and Forecast, By Biotech APIs, by Expression System, 2016-2032
- 7.8.1. APAC Active Pharmaceutical Ingredient Market Analysis by Biotech APIs, by Expression System: Introduction
- 7.8.2. Market Size Absolute $ Opportunity Analysis and Forecast, By Biotech APIs, by Expression System, 2016-2032
- 7.8.3. Mammalian Expression Systems
- 7.8.4. Microbial Expression Systems
- 7.8.5. Yeast Expression Systems
- 7.8.6. Insect Expression Systems
- 7.8.7. Other Expression Systems
- 7.9. APAC Active Pharmaceutical Ingredient Market Analysis, Opportunity and Forecast, By Country , 2016-2032
- 7.9.1. APAC Active Pharmaceutical Ingredient Market Analysis by Country : Introduction
- 7.9.2. Market Size Absolute $ Opportunity Analysis and Forecast, Country , 2016-2032
- 7.9.2.1. China
- 7.9.2.2. Japan
- 7.9.2.3. South Korea
- 7.9.2.4. India
- 7.9.2.5. Australia & New Zeland
- 7.9.2.6. Indonesia
- 7.9.2.7. Malaysia
- 7.9.2.8. Philippines
- 7.9.2.9. Singapore
- 7.9.2.10. Thailand
- 7.9.2.11. Vietnam
- 7.9.2.12. Rest of APAC
- 8. Latin America Active Pharmaceutical Ingredient Market Analysis, Opportunity and Forecast, 2016-2032
- 8.1. Latin America Active Pharmaceutical Ingredient Market Analysis, 2016-2021
- 8.2. Latin America Active Pharmaceutical Ingredient Market Opportunity and Forecast, 2023-2032
- 8.3. Latin America Active Pharmaceutical Ingredient Market Analysis, Opportunity and Forecast, By By Type of Drug, 2016-2032
- 8.3.1. Latin America Active Pharmaceutical Ingredient Market Analysis by By Type of Drug: Introduction
- 8.3.2. Market Size Absolute $ Opportunity Analysis and Forecast, By By Type of Drug, 2016-2032
- 8.3.3. Prescription Drugs
- 8.3.4. Over-the-counter Drugs
- 8.4. Latin America Active Pharmaceutical Ingredient Market Analysis, Opportunity and Forecast, By By Type, 2016-2032
- 8.4.1. Latin America Active Pharmaceutical Ingredient Market Analysis by By Type: Introduction
- 8.4.2. Market Size Absolute $ Opportunity Analysis and Forecast, By By Type, 2016-2032
- 8.4.3. Innovative APIs
- 8.4.4. Generic APIS
- 8.5. Latin America Active Pharmaceutical Ingredient Market Analysis, Opportunity and Forecast, By Synthetic APIs, by Type, 2016-2032
- 8.5.1. Latin America Active Pharmaceutical Ingredient Market Analysis by Synthetic APIs, by Type: Introduction
- 8.5.2. Market Size Absolute $ Opportunity Analysis and Forecast, By Synthetic APIs, by Type, 2016-2032
- 8.5.3. Innovative Synthetic APIs
- 8.5.4. Generic Synthetic APIs
- 8.5.5. Biotech APIs Market
- 8.6. Latin America Active Pharmaceutical Ingredient Market Analysis, Opportunity and Forecast, By Biotech APIs, by Type, 2016-2032
- 8.6.1. Latin America Active Pharmaceutical Ingredient Market Analysis by Biotech APIs, by Type: Introduction
- 8.6.2. Market Size Absolute $ Opportunity Analysis and Forecast, By Biotech APIs, by Type, 2016-2032
- 8.6.3. Innovative Biotech APIs
- 8.6.4. Generic Biotech APIs
- 8.7. Latin America Active Pharmaceutical Ingredient Market Analysis, Opportunity and Forecast, By Biotech APIs, by Product, 2016-2032
- 8.7.1. Latin America Active Pharmaceutical Ingredient Market Analysis by Biotech APIs, by Product: Introduction
- 8.7.2. Market Size Absolute $ Opportunity Analysis and Forecast, By Biotech APIs, by Product, 2016-2032
- 8.7.3. Monoclonal Antibodies
- 8.7.4. Hormones
- 8.7.5. Cytokines
- 8.7.6. Fusion Proteins
- 8.7.7. Therapeutic Enzymes
- 8.7.8. Recombinant Vaccines
- 8.7.9. Blood Factors
- 8.8. Latin America Active Pharmaceutical Ingredient Market Analysis, Opportunity and Forecast, By Biotech APIs, by Expression System, 2016-2032
- 8.8.1. Latin America Active Pharmaceutical Ingredient Market Analysis by Biotech APIs, by Expression System: Introduction
- 8.8.2. Market Size Absolute $ Opportunity Analysis and Forecast, By Biotech APIs, by Expression System, 2016-2032
- 8.8.3. Mammalian Expression Systems
- 8.8.4. Microbial Expression Systems
- 8.8.5. Yeast Expression Systems
- 8.8.6. Insect Expression Systems
- 8.8.7. Other Expression Systems
- 8.9. Latin America Active Pharmaceutical Ingredient Market Analysis, Opportunity and Forecast, By Country , 2016-2032
- 8.9.1. Latin America Active Pharmaceutical Ingredient Market Analysis by Country : Introduction
- 8.9.2. Market Size Absolute $ Opportunity Analysis and Forecast, Country , 2016-2032
- 8.9.2.1. Brazil
- 8.9.2.2. Colombia
- 8.9.2.3. Chile
- 8.9.2.4. Argentina
- 8.9.2.5. Costa Rica
- 8.9.2.6. Rest of Latin America
- 9. Middle East & Africa Active Pharmaceutical Ingredient Market Analysis, Opportunity and Forecast, 2016-2032
- 9.1. Middle East & Africa Active Pharmaceutical Ingredient Market Analysis, 2016-2021
- 9.2. Middle East & Africa Active Pharmaceutical Ingredient Market Opportunity and Forecast, 2023-2032
- 9.3. Middle East & Africa Active Pharmaceutical Ingredient Market Analysis, Opportunity and Forecast, By By Type of Drug, 2016-2032
- 9.3.1. Middle East & Africa Active Pharmaceutical Ingredient Market Analysis by By Type of Drug: Introduction
- 9.3.2. Market Size Absolute $ Opportunity Analysis and Forecast, By By Type of Drug, 2016-2032
- 9.3.3. Prescription Drugs
- 9.3.4. Over-the-counter Drugs
- 9.4. Middle East & Africa Active Pharmaceutical Ingredient Market Analysis, Opportunity and Forecast, By By Type, 2016-2032
- 9.4.1. Middle East & Africa Active Pharmaceutical Ingredient Market Analysis by By Type: Introduction
- 9.4.2. Market Size Absolute $ Opportunity Analysis and Forecast, By By Type, 2016-2032
- 9.4.3. Innovative APIs
- 9.4.4. Generic APIS
- 9.5. Middle East & Africa Active Pharmaceutical Ingredient Market Analysis, Opportunity and Forecast, By Synthetic APIs, by Type, 2016-2032
- 9.5.1. Middle East & Africa Active Pharmaceutical Ingredient Market Analysis by Synthetic APIs, by Type: Introduction
- 9.5.2. Market Size Absolute $ Opportunity Analysis and Forecast, By Synthetic APIs, by Type, 2016-2032
- 9.5.3. Innovative Synthetic APIs
- 9.5.4. Generic Synthetic APIs
- 9.5.5. Biotech APIs Market
- 9.6. Middle East & Africa Active Pharmaceutical Ingredient Market Analysis, Opportunity and Forecast, By Biotech APIs, by Type, 2016-2032
- 9.6.1. Middle East & Africa Active Pharmaceutical Ingredient Market Analysis by Biotech APIs, by Type: Introduction
- 9.6.2. Market Size Absolute $ Opportunity Analysis and Forecast, By Biotech APIs, by Type, 2016-2032
- 9.6.3. Innovative Biotech APIs
- 9.6.4. Generic Biotech APIs
- 9.7. Middle East & Africa Active Pharmaceutical Ingredient Market Analysis, Opportunity and Forecast, By Biotech APIs, by Product, 2016-2032
- 9.7.1. Middle East & Africa Active Pharmaceutical Ingredient Market Analysis by Biotech APIs, by Product: Introduction
- 9.7.2. Market Size Absolute $ Opportunity Analysis and Forecast, By Biotech APIs, by Product, 2016-2032
- 9.7.3. Monoclonal Antibodies
- 9.7.4. Hormones
- 9.7.5. Cytokines
- 9.7.6. Fusion Proteins
- 9.7.7. Therapeutic Enzymes
- 9.7.8. Recombinant Vaccines
- 9.7.9. Blood Factors
- 9.8. Middle East & Africa Active Pharmaceutical Ingredient Market Analysis, Opportunity and Forecast, By Biotech APIs, by Expression System, 2016-2032
- 9.8.1. Middle East & Africa Active Pharmaceutical Ingredient Market Analysis by Biotech APIs, by Expression System: Introduction
- 9.8.2. Market Size Absolute $ Opportunity Analysis and Forecast, By Biotech APIs, by Expression System, 2016-2032
- 9.8.3. Mammalian Expression Systems
- 9.8.4. Microbial Expression Systems
- 9.8.5. Yeast Expression Systems
- 9.8.6. Insect Expression Systems
- 9.8.7. Other Expression Systems
- 9.9. Middle East & Africa Active Pharmaceutical Ingredient Market Analysis, Opportunity and Forecast, By Country , 2016-2032
- 9.9.1. Middle East & Africa Active Pharmaceutical Ingredient Market Analysis by Country : Introduction
- 9.9.2. Market Size Absolute $ Opportunity Analysis and Forecast, Country , 2016-2032
- 9.9.2.1. Algeria
- 9.9.2.2. Egypt
- 9.9.2.3. Israel
- 9.9.2.4. Kuwait
- 9.9.2.5. Nigeria
- 9.9.2.6. Saudi Arabia
- 9.9.2.7. South Africa
- 9.9.2.8. Turkey
- 9.9.2.9. The UAE
- 9.9.2.10. Rest of MEA
- 10. Global Active Pharmaceutical Ingredient Market Analysis, Opportunity and Forecast, By Region , 2016-2032
- 10.1. Global Active Pharmaceutical Ingredient Market Analysis by Region : Introduction
- 10.2. Market Size Absolute $ Opportunity Analysis and Forecast, By Region , 2016-2032
- 10.2.1. North America
- 10.2.2. Western Europe
- 10.2.3. Eastern Europe
- 10.2.4. APAC
- 10.2.5. Latin America
- 10.2.6. Middle East & Africa
- 11. Global Active Pharmaceutical Ingredient Market Competitive Landscape, Market Share Analysis, and Company Profiles
- 11.1. Market Share Analysis
- 11.2. Company Profiles
- 11.3. Pfizer
- 11.3.1. Company Overview
- 11.3.2. Financial Highlights
- 11.3.3. Product Portfolio
- 11.3.4. SWOT Analysis
- 11.3.5. Key Strategies and Developments
- 11.4. Novartis
- 11.4.1. Company Overview
- 11.4.2. Financial Highlights
- 11.4.3. Product Portfolio
- 11.4.4. SWOT Analysis
- 11.4.5. Key Strategies and Developments
- 11.5. Sanofi
- 11.5.1. Company Overview
- 11.5.2. Financial Highlights
- 11.5.3. Product Portfolio
- 11.5.4. SWOT Analysis
- 11.5.5. Key Strategies and Developments
- 11.6. Boehringer Ingelheim
- 11.6.1. Company Overview
- 11.6.2. Financial Highlights
- 11.6.3. Product Portfolio
- 11.6.4. SWOT Analysis
- 11.6.5. Key Strategies and Developments
- 11.7. BASF
- 11.7.1. Company Overview
- 11.7.2. Financial Highlights
- 11.7.3. Product Portfolio
- 11.7.4. SWOT Analysis
- 11.7.5. Key Strategies and Developments
- 11.8. Merck & Co.
- 11.8.1. Company Overview
- 11.8.2. Financial Highlights
- 11.8.3. Product Portfolio
- 11.8.4. SWOT Analysis
- 11.8.5. Key Strategies and Developments
- 11.9. Teva Pharmaceutical
- 11.9.1. Company Overview
- 11.9.2. Financial Highlights
- 11.9.3. Product Portfolio
- 11.9.4. SWOT Analysis
- 11.9.5. Key Strategies and Developments
- 11.10. Sun Pharmaceutical
- 11.10.1. Company Overview
- 11.10.2. Financial Highlights
- 11.10.3. Product Portfolio
- 11.10.4. SWOT Analysis
- 11.10.5. Key Strategies and Developments
- 11.11. Aurobindo Pharma
- 11.11.1. Company Overview
- 11.11.2. Financial Highlights
- 11.11.3. Product Portfolio
- 11.11.4. SWOT Analysis
- 11.11.5. Key Strategies and Developments
- 11.12. Cipla
- 11.12.1. Company Overview
- 11.12.2. Financial Highlights
- 11.12.3. Product Portfolio
- 11.12.4. SWOT Analysis
- 11.12.5. Key Strategies and Developments
- 11.13. Others
- 11.13.1. Company Overview
- 11.13.2. Financial Highlights
- 11.13.3. Product Portfolio
- 11.13.4. SWOT Analysis
- 11.13.5. Key Strategies and Developments
- 12. Assumptions and Acronyms
- 13. Research Methodology
- 14. Contact
- List of Figures
- Figure 1: Global Active Pharmaceutical Ingredient Market Revenue (US$ Mn) Market Share by By Type of Drug in 2022
- Figure 2: Global Active Pharmaceutical Ingredient Market Attractiveness Analysis by By Type of Drug, 2016-2032
- Figure 3: Global Active Pharmaceutical Ingredient Market Revenue (US$ Mn) Market Share by By Typein 2022
- Figure 4: Global Active Pharmaceutical Ingredient Market Attractiveness Analysis by By Type, 2016-2032
- Figure 5: Global Active Pharmaceutical Ingredient Market Revenue (US$ Mn) Market Share by Synthetic APIs, by Typein 2022
- Figure 6: Global Active Pharmaceutical Ingredient Market Attractiveness Analysis by Synthetic APIs, by Type, 2016-2032
- Figure 7: Global Active Pharmaceutical Ingredient Market Revenue (US$ Mn) Market Share by Biotech APIs, by Typein 2022
- Figure 8: Global Active Pharmaceutical Ingredient Market Attractiveness Analysis by Biotech APIs, by Type, 2016-2032
- Figure 9: Global Active Pharmaceutical Ingredient Market Revenue (US$ Mn) Market Share by Biotech APIs, by Productin 2022
- Figure 10: Global Active Pharmaceutical Ingredient Market Attractiveness Analysis by Biotech APIs, by Product, 2016-2032
- Figure 11: Global Active Pharmaceutical Ingredient Market Revenue (US$ Mn) Market Share by Biotech APIs, by Expression Systemin 2022
- Figure 12: Global Active Pharmaceutical Ingredient Market Attractiveness Analysis by Biotech APIs, by Expression System, 2016-2032
- Figure 13: Global Active Pharmaceutical Ingredient Market Revenue (US$ Mn) Market Share by Region in 2022
- Figure 14: Global Active Pharmaceutical Ingredient Market Attractiveness Analysis by Region, 2016-2032
- Figure 15: Global Active Pharmaceutical Ingredient Market Revenue (US$ Mn) (2016-2032)
- Figure 16: Global Active Pharmaceutical Ingredient Market Revenue (US$ Mn) Comparison by Region (2016-2032)
- Figure 17: Global Active Pharmaceutical Ingredient Market Revenue (US$ Mn) Comparison by By Type of Drug (2016-2032)
- Figure 18: Global Active Pharmaceutical Ingredient Market Revenue (US$ Mn) Comparison by By Type (2016-2032)
- Figure 19: Global Active Pharmaceutical Ingredient Market Revenue (US$ Mn) Comparison by Synthetic APIs, by Type (2016-2032)
- Figure 20: Global Active Pharmaceutical Ingredient Market Revenue (US$ Mn) Comparison by Biotech APIs, by Type (2016-2032)
- Figure 21: Global Active Pharmaceutical Ingredient Market Revenue (US$ Mn) Comparison by Biotech APIs, by Product (2016-2032)
- Figure 22: Global Active Pharmaceutical Ingredient Market Revenue (US$ Mn) Comparison by Biotech APIs, by Expression System (2016-2032)
- Figure 23: Global Active Pharmaceutical Ingredient Market Y-o-Y Growth Rate Comparison by Region (2016-2032)
- Figure 24: Global Active Pharmaceutical Ingredient Market Y-o-Y Growth Rate Comparison by By Type of Drug (2016-2032)
- Figure 25: Global Active Pharmaceutical Ingredient Market Y-o-Y Growth Rate Comparison by By Type (2016-2032)
- Figure 26: Global Active Pharmaceutical Ingredient Market Y-o-Y Growth Rate Comparison by Synthetic APIs, by Type (2016-2032)
- Figure 27: Global Active Pharmaceutical Ingredient Market Y-o-Y Growth Rate Comparison by Biotech APIs, by Type (2016-2032)
- Figure 28: Global Active Pharmaceutical Ingredient Market Y-o-Y Growth Rate Comparison by Biotech APIs, by Product (2016-2032)
- Figure 29: Global Active Pharmaceutical Ingredient Market Y-o-Y Growth Rate Comparison by Biotech APIs, by Expression System (2016-2032)
- Figure 30: Global Active Pharmaceutical Ingredient Market Share Comparison by Region (2016-2032)
- Figure 31: Global Active Pharmaceutical Ingredient Market Share Comparison by By Type of Drug (2016-2032)
- Figure 32: Global Active Pharmaceutical Ingredient Market Share Comparison by By Type (2016-2032)
- Figure 33: Global Active Pharmaceutical Ingredient Market Share Comparison by Synthetic APIs, by Type (2016-2032)
- Figure 34: Global Active Pharmaceutical Ingredient Market Share Comparison by Biotech APIs, by Type (2016-2032)
- Figure 35: Global Active Pharmaceutical Ingredient Market Share Comparison by Biotech APIs, by Product (2016-2032)
- Figure 36: Global Active Pharmaceutical Ingredient Market Share Comparison by Biotech APIs, by Expression System (2016-2032)
- Figure 37: North America Active Pharmaceutical Ingredient Market Revenue (US$ Mn) Market Share by By Type of Drugin 2022
- Figure 38: North America Active Pharmaceutical Ingredient Market Attractiveness Analysis by By Type of Drug, 2016-2032
- Figure 39: North America Active Pharmaceutical Ingredient Market Revenue (US$ Mn) Market Share by By Typein 2022
- Figure 40: North America Active Pharmaceutical Ingredient Market Attractiveness Analysis by By Type, 2016-2032
- Figure 41: North America Active Pharmaceutical Ingredient Market Revenue (US$ Mn) Market Share by Synthetic APIs, by Typein 2022
- Figure 42: North America Active Pharmaceutical Ingredient Market Attractiveness Analysis by Synthetic APIs, by Type, 2016-2032
- Figure 43: North America Active Pharmaceutical Ingredient Market Revenue (US$ Mn) Market Share by Biotech APIs, by Typein 2022
- Figure 44: North America Active Pharmaceutical Ingredient Market Attractiveness Analysis by Biotech APIs, by Type, 2016-2032
- Figure 45: North America Active Pharmaceutical Ingredient Market Revenue (US$ Mn) Market Share by Biotech APIs, by Productin 2022
- Figure 46: North America Active Pharmaceutical Ingredient Market Attractiveness Analysis by Biotech APIs, by Product, 2016-2032
- Figure 47: North America Active Pharmaceutical Ingredient Market Revenue (US$ Mn) Market Share by Biotech APIs, by Expression Systemin 2022
- Figure 48: North America Active Pharmaceutical Ingredient Market Attractiveness Analysis by Biotech APIs, by Expression System, 2016-2032
- Figure 49: North America Active Pharmaceutical Ingredient Market Revenue (US$ Mn) Market Share by Country in 2022
- Figure 50: North America Active Pharmaceutical Ingredient Market Attractiveness Analysis by Country, 2016-2032
- Figure 51: North America Active Pharmaceutical Ingredient Market Revenue (US$ Mn) (2016-2032)
- Figure 52: North America Active Pharmaceutical Ingredient Market Revenue (US$ Mn) Comparison by Country (2016-2032)
- Figure 53: North America Active Pharmaceutical Ingredient Market Revenue (US$ Mn) Comparison by By Type of Drug (2016-2032)
- Figure 54: North America Active Pharmaceutical Ingredient Market Revenue (US$ Mn) Comparison by By Type (2016-2032)
- Figure 55: North America Active Pharmaceutical Ingredient Market Revenue (US$ Mn) Comparison by Synthetic APIs, by Type (2016-2032)
- Figure 56: North America Active Pharmaceutical Ingredient Market Revenue (US$ Mn) Comparison by Biotech APIs, by Type (2016-2032)
- Figure 57: North America Active Pharmaceutical Ingredient Market Revenue (US$ Mn) Comparison by Biotech APIs, by Product (2016-2032)
- Figure 58: North America Active Pharmaceutical Ingredient Market Revenue (US$ Mn) Comparison by Biotech APIs, by Expression System (2016-2032)
- Figure 59: North America Active Pharmaceutical Ingredient Market Y-o-Y Growth Rate Comparison by Country (2016-2032)
- Figure 60: North America Active Pharmaceutical Ingredient Market Y-o-Y Growth Rate Comparison by By Type of Drug (2016-2032)
- Figure 61: North America Active Pharmaceutical Ingredient Market Y-o-Y Growth Rate Comparison by By Type (2016-2032)
- Figure 62: North America Active Pharmaceutical Ingredient Market Y-o-Y Growth Rate Comparison by Synthetic APIs, by Type (2016-2032)
- Figure 63: North America Active Pharmaceutical Ingredient Market Y-o-Y Growth Rate Comparison by Biotech APIs, by Type (2016-2032)
- Figure 64: North America Active Pharmaceutical Ingredient Market Y-o-Y Growth Rate Comparison by Biotech APIs, by Product (2016-2032)
- Figure 65: North America Active Pharmaceutical Ingredient Market Y-o-Y Growth Rate Comparison by Biotech APIs, by Expression System (2016-2032)
- Figure 66: North America Active Pharmaceutical Ingredient Market Share Comparison by Country (2016-2032)
- Figure 67: North America Active Pharmaceutical Ingredient Market Share Comparison by By Type of Drug (2016-2032)
- Figure 68: North America Active Pharmaceutical Ingredient Market Share Comparison by By Type (2016-2032)
- Figure 69: North America Active Pharmaceutical Ingredient Market Share Comparison by Synthetic APIs, by Type (2016-2032)
- Figure 70: North America Active Pharmaceutical Ingredient Market Share Comparison by Biotech APIs, by Type (2016-2032)
- Figure 71: North America Active Pharmaceutical Ingredient Market Share Comparison by Biotech APIs, by Product (2016-2032)
- Figure 72: North America Active Pharmaceutical Ingredient Market Share Comparison by Biotech APIs, by Expression System (2016-2032)
- Figure 73: Western Europe Active Pharmaceutical Ingredient Market Revenue (US$ Mn) Market Share by By Type of Drugin 2022
- Figure 74: Western Europe Active Pharmaceutical Ingredient Market Attractiveness Analysis by By Type of Drug, 2016-2032
- Figure 75: Western Europe Active Pharmaceutical Ingredient Market Revenue (US$ Mn) Market Share by By Typein 2022
- Figure 76: Western Europe Active Pharmaceutical Ingredient Market Attractiveness Analysis by By Type, 2016-2032
- Figure 77: Western Europe Active Pharmaceutical Ingredient Market Revenue (US$ Mn) Market Share by Synthetic APIs, by Typein 2022
- Figure 78: Western Europe Active Pharmaceutical Ingredient Market Attractiveness Analysis by Synthetic APIs, by Type, 2016-2032
- Figure 79: Western Europe Active Pharmaceutical Ingredient Market Revenue (US$ Mn) Market Share by Biotech APIs, by Typein 2022
- Figure 80: Western Europe Active Pharmaceutical Ingredient Market Attractiveness Analysis by Biotech APIs, by Type, 2016-2032
- Figure 81: Western Europe Active Pharmaceutical Ingredient Market Revenue (US$ Mn) Market Share by Biotech APIs, by Productin 2022
- Figure 82: Western Europe Active Pharmaceutical Ingredient Market Attractiveness Analysis by Biotech APIs, by Product, 2016-2032
- Figure 83: Western Europe Active Pharmaceutical Ingredient Market Revenue (US$ Mn) Market Share by Biotech APIs, by Expression Systemin 2022
- Figure 84: Western Europe Active Pharmaceutical Ingredient Market Attractiveness Analysis by Biotech APIs, by Expression System, 2016-2032
- Figure 85: Western Europe Active Pharmaceutical Ingredient Market Revenue (US$ Mn) Market Share by Country in 2022
- Figure 86: Western Europe Active Pharmaceutical Ingredient Market Attractiveness Analysis by Country, 2016-2032
- Figure 87: Western Europe Active Pharmaceutical Ingredient Market Revenue (US$ Mn) (2016-2032)
- Figure 88: Western Europe Active Pharmaceutical Ingredient Market Revenue (US$ Mn) Comparison by Country (2016-2032)
- Figure 89: Western Europe Active Pharmaceutical Ingredient Market Revenue (US$ Mn) Comparison by By Type of Drug (2016-2032)
- Figure 90: Western Europe Active Pharmaceutical Ingredient Market Revenue (US$ Mn) Comparison by By Type (2016-2032)
- Figure 91: Western Europe Active Pharmaceutical Ingredient Market Revenue (US$ Mn) Comparison by Synthetic APIs, by Type (2016-2032)
- Figure 92: Western Europe Active Pharmaceutical Ingredient Market Revenue (US$ Mn) Comparison by Biotech APIs, by Type (2016-2032)
- Figure 93: Western Europe Active Pharmaceutical Ingredient Market Revenue (US$ Mn) Comparison by Biotech APIs, by Product (2016-2032)
- Figure 94: Western Europe Active Pharmaceutical Ingredient Market Revenue (US$ Mn) Comparison by Biotech APIs, by Expression System (2016-2032)
- Figure 95: Western Europe Active Pharmaceutical Ingredient Market Y-o-Y Growth Rate Comparison by Country (2016-2032)
- Figure 96: Western Europe Active Pharmaceutical Ingredient Market Y-o-Y Growth Rate Comparison by By Type of Drug (2016-2032)
- Figure 97: Western Europe Active Pharmaceutical Ingredient Market Y-o-Y Growth Rate Comparison by By Type (2016-2032)
- Figure 98: Western Europe Active Pharmaceutical Ingredient Market Y-o-Y Growth Rate Comparison by Synthetic APIs, by Type (2016-2032)
- Figure 99: Western Europe Active Pharmaceutical Ingredient Market Y-o-Y Growth Rate Comparison by Biotech APIs, by Type (2016-2032)
- Figure 100: Western Europe Active Pharmaceutical Ingredient Market Y-o-Y Growth Rate Comparison by Biotech APIs, by Product (2016-2032)
- Figure 101: Western Europe Active Pharmaceutical Ingredient Market Y-o-Y Growth Rate Comparison by Biotech APIs, by Expression System (2016-2032)
- Figure 102: Western Europe Active Pharmaceutical Ingredient Market Share Comparison by Country (2016-2032)
- Figure 103: Western Europe Active Pharmaceutical Ingredient Market Share Comparison by By Type of Drug (2016-2032)
- Figure 104: Western Europe Active Pharmaceutical Ingredient Market Share Comparison by By Type (2016-2032)
- Figure 105: Western Europe Active Pharmaceutical Ingredient Market Share Comparison by Synthetic APIs, by Type (2016-2032)
- Figure 106: Western Europe Active Pharmaceutical Ingredient Market Share Comparison by Biotech APIs, by Type (2016-2032)
- Figure 107: Western Europe Active Pharmaceutical Ingredient Market Share Comparison by Biotech APIs, by Product (2016-2032)
- Figure 108: Western Europe Active Pharmaceutical Ingredient Market Share Comparison by Biotech APIs, by Expression System (2016-2032)
- Figure 109: Eastern Europe Active Pharmaceutical Ingredient Market Revenue (US$ Mn) Market Share by By Type of Drugin 2022
- Figure 110: Eastern Europe Active Pharmaceutical Ingredient Market Attractiveness Analysis by By Type of Drug, 2016-2032
- Figure 111: Eastern Europe Active Pharmaceutical Ingredient Market Revenue (US$ Mn) Market Share by By Typein 2022
- Figure 112: Eastern Europe Active Pharmaceutical Ingredient Market Attractiveness Analysis by By Type, 2016-2032
- Figure 113: Eastern Europe Active Pharmaceutical Ingredient Market Revenue (US$ Mn) Market Share by Synthetic APIs, by Typein 2022
- Figure 114: Eastern Europe Active Pharmaceutical Ingredient Market Attractiveness Analysis by Synthetic APIs, by Type, 2016-2032
- Figure 115: Eastern Europe Active Pharmaceutical Ingredient Market Revenue (US$ Mn) Market Share by Biotech APIs, by Typein 2022
- Figure 116: Eastern Europe Active Pharmaceutical Ingredient Market Attractiveness Analysis by Biotech APIs, by Type, 2016-2032
- Figure 117: Eastern Europe Active Pharmaceutical Ingredient Market Revenue (US$ Mn) Market Share by Biotech APIs, by Productin 2022
- Figure 118: Eastern Europe Active Pharmaceutical Ingredient Market Attractiveness Analysis by Biotech APIs, by Product, 2016-2032
- Figure 119: Eastern Europe Active Pharmaceutical Ingredient Market Revenue (US$ Mn) Market Share by Biotech APIs, by Expression Systemin 2022
- Figure 120: Eastern Europe Active Pharmaceutical Ingredient Market Attractiveness Analysis by Biotech APIs, by Expression System, 2016-2032
- Figure 121: Eastern Europe Active Pharmaceutical Ingredient Market Revenue (US$ Mn) Market Share by Country in 2022
- Figure 122: Eastern Europe Active Pharmaceutical Ingredient Market Attractiveness Analysis by Country, 2016-2032
- Figure 123: Eastern Europe Active Pharmaceutical Ingredient Market Revenue (US$ Mn) (2016-2032)
- Figure 124: Eastern Europe Active Pharmaceutical Ingredient Market Revenue (US$ Mn) Comparison by Country (2016-2032)
- Figure 125: Eastern Europe Active Pharmaceutical Ingredient Market Revenue (US$ Mn) Comparison by By Type of Drug (2016-2032)
- Figure 126: Eastern Europe Active Pharmaceutical Ingredient Market Revenue (US$ Mn) Comparison by By Type (2016-2032)
- Figure 127: Eastern Europe Active Pharmaceutical Ingredient Market Revenue (US$ Mn) Comparison by Synthetic APIs, by Type (2016-2032)
- Figure 128: Eastern Europe Active Pharmaceutical Ingredient Market Revenue (US$ Mn) Comparison by Biotech APIs, by Type (2016-2032)
- Figure 129: Eastern Europe Active Pharmaceutical Ingredient Market Revenue (US$ Mn) Comparison by Biotech APIs, by Product (2016-2032)
- Figure 130: Eastern Europe Active Pharmaceutical Ingredient Market Revenue (US$ Mn) Comparison by Biotech APIs, by Expression System (2016-2032)
- Figure 131: Eastern Europe Active Pharmaceutical Ingredient Market Y-o-Y Growth Rate Comparison by Country (2016-2032)
- Figure 132: Eastern Europe Active Pharmaceutical Ingredient Market Y-o-Y Growth Rate Comparison by By Type of Drug (2016-2032)
- Figure 133: Eastern Europe Active Pharmaceutical Ingredient Market Y-o-Y Growth Rate Comparison by By Type (2016-2032)
- Figure 134: Eastern Europe Active Pharmaceutical Ingredient Market Y-o-Y Growth Rate Comparison by Synthetic APIs, by Type (2016-2032)
- Figure 135: Eastern Europe Active Pharmaceutical Ingredient Market Y-o-Y Growth Rate Comparison by Biotech APIs, by Type (2016-2032)
- Figure 136: Eastern Europe Active Pharmaceutical Ingredient Market Y-o-Y Growth Rate Comparison by Biotech APIs, by Product (2016-2032)
- Figure 137: Eastern Europe Active Pharmaceutical Ingredient Market Y-o-Y Growth Rate Comparison by Biotech APIs, by Expression System (2016-2032)
- Figure 138: Eastern Europe Active Pharmaceutical Ingredient Market Share Comparison by Country (2016-2032)
- Figure 139: Eastern Europe Active Pharmaceutical Ingredient Market Share Comparison by By Type of Drug (2016-2032)
- Figure 140: Eastern Europe Active Pharmaceutical Ingredient Market Share Comparison by By Type (2016-2032)
- Figure 141: Eastern Europe Active Pharmaceutical Ingredient Market Share Comparison by Synthetic APIs, by Type (2016-2032)
- Figure 142: Eastern Europe Active Pharmaceutical Ingredient Market Share Comparison by Biotech APIs, by Type (2016-2032)
- Figure 143: Eastern Europe Active Pharmaceutical Ingredient Market Share Comparison by Biotech APIs, by Product (2016-2032)
- Figure 144: Eastern Europe Active Pharmaceutical Ingredient Market Share Comparison by Biotech APIs, by Expression System (2016-2032)
- Figure 145: APAC Active Pharmaceutical Ingredient Market Revenue (US$ Mn) Market Share by By Type of Drugin 2022
- Figure 146: APAC Active Pharmaceutical Ingredient Market Attractiveness Analysis by By Type of Drug, 2016-2032
- Figure 147: APAC Active Pharmaceutical Ingredient Market Revenue (US$ Mn) Market Share by By Typein 2022
- Figure 148: APAC Active Pharmaceutical Ingredient Market Attractiveness Analysis by By Type, 2016-2032
- Figure 149: APAC Active Pharmaceutical Ingredient Market Revenue (US$ Mn) Market Share by Synthetic APIs, by Typein 2022
- Figure 150: APAC Active Pharmaceutical Ingredient Market Attractiveness Analysis by Synthetic APIs, by Type, 2016-2032
- Figure 151: APAC Active Pharmaceutical Ingredient Market Revenue (US$ Mn) Market Share by Biotech APIs, by Typein 2022
- Figure 152: APAC Active Pharmaceutical Ingredient Market Attractiveness Analysis by Biotech APIs, by Type, 2016-2032
- Figure 153: APAC Active Pharmaceutical Ingredient Market Revenue (US$ Mn) Market Share by Biotech APIs, by Productin 2022
- Figure 154: APAC Active Pharmaceutical Ingredient Market Attractiveness Analysis by Biotech APIs, by Product, 2016-2032
- Figure 155: APAC Active Pharmaceutical Ingredient Market Revenue (US$ Mn) Market Share by Biotech APIs, by Expression Systemin 2022
- Figure 156: APAC Active Pharmaceutical Ingredient Market Attractiveness Analysis by Biotech APIs, by Expression System, 2016-2032
- Figure 157: APAC Active Pharmaceutical Ingredient Market Revenue (US$ Mn) Market Share by Country in 2022
- Figure 158: APAC Active Pharmaceutical Ingredient Market Attractiveness Analysis by Country, 2016-2032
- Figure 159: APAC Active Pharmaceutical Ingredient Market Revenue (US$ Mn) (2016-2032)
- Figure 160: APAC Active Pharmaceutical Ingredient Market Revenue (US$ Mn) Comparison by Country (2016-2032)
- Figure 161: APAC Active Pharmaceutical Ingredient Market Revenue (US$ Mn) Comparison by By Type of Drug (2016-2032)
- Figure 162: APAC Active Pharmaceutical Ingredient Market Revenue (US$ Mn) Comparison by By Type (2016-2032)
- Figure 163: APAC Active Pharmaceutical Ingredient Market Revenue (US$ Mn) Comparison by Synthetic APIs, by Type (2016-2032)
- Figure 164: APAC Active Pharmaceutical Ingredient Market Revenue (US$ Mn) Comparison by Biotech APIs, by Type (2016-2032)
- Figure 165: APAC Active Pharmaceutical Ingredient Market Revenue (US$ Mn) Comparison by Biotech APIs, by Product (2016-2032)
- Figure 166: APAC Active Pharmaceutical Ingredient Market Revenue (US$ Mn) Comparison by Biotech APIs, by Expression System (2016-2032)
- Figure 167: APAC Active Pharmaceutical Ingredient Market Y-o-Y Growth Rate Comparison by Country (2016-2032)
- Figure 168: APAC Active Pharmaceutical Ingredient Market Y-o-Y Growth Rate Comparison by By Type of Drug (2016-2032)
- Figure 169: APAC Active Pharmaceutical Ingredient Market Y-o-Y Growth Rate Comparison by By Type (2016-2032)
- Figure 170: APAC Active Pharmaceutical Ingredient Market Y-o-Y Growth Rate Comparison by Synthetic APIs, by Type (2016-2032)
- Figure 171: APAC Active Pharmaceutical Ingredient Market Y-o-Y Growth Rate Comparison by Biotech APIs, by Type (2016-2032)
- Figure 172: APAC Active Pharmaceutical Ingredient Market Y-o-Y Growth Rate Comparison by Biotech APIs, by Product (2016-2032)
- Figure 173: APAC Active Pharmaceutical Ingredient Market Y-o-Y Growth Rate Comparison by Biotech APIs, by Expression System (2016-2032)
- Figure 174: APAC Active Pharmaceutical Ingredient Market Share Comparison by Country (2016-2032)
- Figure 175: APAC Active Pharmaceutical Ingredient Market Share Comparison by By Type of Drug (2016-2032)
- Figure 176: APAC Active Pharmaceutical Ingredient Market Share Comparison by By Type (2016-2032)
- Figure 177: APAC Active Pharmaceutical Ingredient Market Share Comparison by Synthetic APIs, by Type (2016-2032)
- Figure 178: APAC Active Pharmaceutical Ingredient Market Share Comparison by Biotech APIs, by Type (2016-2032)
- Figure 179: APAC Active Pharmaceutical Ingredient Market Share Comparison by Biotech APIs, by Product (2016-2032)
- Figure 180: APAC Active Pharmaceutical Ingredient Market Share Comparison by Biotech APIs, by Expression System (2016-2032)
- Figure 181: Latin America Active Pharmaceutical Ingredient Market Revenue (US$ Mn) Market Share by By Type of Drugin 2022
- Figure 182: Latin America Active Pharmaceutical Ingredient Market Attractiveness Analysis by By Type of Drug, 2016-2032
- Figure 183: Latin America Active Pharmaceutical Ingredient Market Revenue (US$ Mn) Market Share by By Typein 2022
- Figure 184: Latin America Active Pharmaceutical Ingredient Market Attractiveness Analysis by By Type, 2016-2032
- Figure 185: Latin America Active Pharmaceutical Ingredient Market Revenue (US$ Mn) Market Share by Synthetic APIs, by Typein 2022
- Figure 186: Latin America Active Pharmaceutical Ingredient Market Attractiveness Analysis by Synthetic APIs, by Type, 2016-2032
- Figure 187: Latin America Active Pharmaceutical Ingredient Market Revenue (US$ Mn) Market Share by Biotech APIs, by Typein 2022
- Figure 188: Latin America Active Pharmaceutical Ingredient Market Attractiveness Analysis by Biotech APIs, by Type, 2016-2032
- Figure 189: Latin America Active Pharmaceutical Ingredient Market Revenue (US$ Mn) Market Share by Biotech APIs, by Productin 2022
- Figure 190: Latin America Active Pharmaceutical Ingredient Market Attractiveness Analysis by Biotech APIs, by Product, 2016-2032
- Figure 191: Latin America Active Pharmaceutical Ingredient Market Revenue (US$ Mn) Market Share by Biotech APIs, by Expression Systemin 2022
- Figure 192: Latin America Active Pharmaceutical Ingredient Market Attractiveness Analysis by Biotech APIs, by Expression System, 2016-2032
- Figure 193: Latin America Active Pharmaceutical Ingredient Market Revenue (US$ Mn) Market Share by Country in 2022
- Figure 194: Latin America Active Pharmaceutical Ingredient Market Attractiveness Analysis by Country, 2016-2032
- Figure 195: Latin America Active Pharmaceutical Ingredient Market Revenue (US$ Mn) (2016-2032)
- Figure 196: Latin America Active Pharmaceutical Ingredient Market Revenue (US$ Mn) Comparison by Country (2016-2032)
- Figure 197: Latin America Active Pharmaceutical Ingredient Market Revenue (US$ Mn) Comparison by By Type of Drug (2016-2032)
- Figure 198: Latin America Active Pharmaceutical Ingredient Market Revenue (US$ Mn) Comparison by By Type (2016-2032)
- Figure 199: Latin America Active Pharmaceutical Ingredient Market Revenue (US$ Mn) Comparison by Synthetic APIs, by Type (2016-2032)
- Figure 200: Latin America Active Pharmaceutical Ingredient Market Revenue (US$ Mn) Comparison by Biotech APIs, by Type (2016-2032)
- Figure 201: Latin America Active Pharmaceutical Ingredient Market Revenue (US$ Mn) Comparison by Biotech APIs, by Product (2016-2032)
- Figure 202: Latin America Active Pharmaceutical Ingredient Market Revenue (US$ Mn) Comparison by Biotech APIs, by Expression System (2016-2032)
- Figure 203: Latin America Active Pharmaceutical Ingredient Market Y-o-Y Growth Rate Comparison by Country (2016-2032)
- Figure 204: Latin America Active Pharmaceutical Ingredient Market Y-o-Y Growth Rate Comparison by By Type of Drug (2016-2032)
- Figure 205: Latin America Active Pharmaceutical Ingredient Market Y-o-Y Growth Rate Comparison by By Type (2016-2032)
- Figure 206: Latin America Active Pharmaceutical Ingredient Market Y-o-Y Growth Rate Comparison by Synthetic APIs, by Type (2016-2032)
- Figure 207: Latin America Active Pharmaceutical Ingredient Market Y-o-Y Growth Rate Comparison by Biotech APIs, by Type (2016-2032)
- Figure 208: Latin America Active Pharmaceutical Ingredient Market Y-o-Y Growth Rate Comparison by Biotech APIs, by Product (2016-2032)
- Figure 209: Latin America Active Pharmaceutical Ingredient Market Y-o-Y Growth Rate Comparison by Biotech APIs, by Expression System (2016-2032)
- Figure 210: Latin America Active Pharmaceutical Ingredient Market Share Comparison by Country (2016-2032)
- Figure 211: Latin America Active Pharmaceutical Ingredient Market Share Comparison by By Type of Drug (2016-2032)
- Figure 212: Latin America Active Pharmaceutical Ingredient Market Share Comparison by By Type (2016-2032)
- Figure 213: Latin America Active Pharmaceutical Ingredient Market Share Comparison by Synthetic APIs, by Type (2016-2032)
- Figure 214: Latin America Active Pharmaceutical Ingredient Market Share Comparison by Biotech APIs, by Type (2016-2032)
- Figure 215: Latin America Active Pharmaceutical Ingredient Market Share Comparison by Biotech APIs, by Product (2016-2032)
- Figure 216: Latin America Active Pharmaceutical Ingredient Market Share Comparison by Biotech APIs, by Expression System (2016-2032)
- Figure 217: Middle East & Africa Active Pharmaceutical Ingredient Market Revenue (US$ Mn) Market Share by By Type of Drugin 2022
- Figure 218: Middle East & Africa Active Pharmaceutical Ingredient Market Attractiveness Analysis by By Type of Drug, 2016-2032
- Figure 219: Middle East & Africa Active Pharmaceutical Ingredient Market Revenue (US$ Mn) Market Share by By Typein 2022
- Figure 220: Middle East & Africa Active Pharmaceutical Ingredient Market Attractiveness Analysis by By Type, 2016-2032
- Figure 221: Middle East & Africa Active Pharmaceutical Ingredient Market Revenue (US$ Mn) Market Share by Synthetic APIs, by Typein 2022
- Figure 222: Middle East & Africa Active Pharmaceutical Ingredient Market Attractiveness Analysis by Synthetic APIs, by Type, 2016-2032
- Figure 223: Middle East & Africa Active Pharmaceutical Ingredient Market Revenue (US$ Mn) Market Share by Biotech APIs, by Typein 2022
- Figure 224: Middle East & Africa Active Pharmaceutical Ingredient Market Attractiveness Analysis by Biotech APIs, by Type, 2016-2032
- Figure 225: Middle East & Africa Active Pharmaceutical Ingredient Market Revenue (US$ Mn) Market Share by Biotech APIs, by Productin 2022
- Figure 226: Middle East & Africa Active Pharmaceutical Ingredient Market Attractiveness Analysis by Biotech APIs, by Product, 2016-2032
- Figure 227: Middle East & Africa Active Pharmaceutical Ingredient Market Revenue (US$ Mn) Market Share by Biotech APIs, by Expression Systemin 2022
- Figure 228: Middle East & Africa Active Pharmaceutical Ingredient Market Attractiveness Analysis by Biotech APIs, by Expression System, 2016-2032
- Figure 229: Middle East & Africa Active Pharmaceutical Ingredient Market Revenue (US$ Mn) Market Share by Country in 2022
- Figure 230: Middle East & Africa Active Pharmaceutical Ingredient Market Attractiveness Analysis by Country, 2016-2032
- Figure 231: Middle East & Africa Active Pharmaceutical Ingredient Market Revenue (US$ Mn) (2016-2032)
- Figure 232: Middle East & Africa Active Pharmaceutical Ingredient Market Revenue (US$ Mn) Comparison by Country (2016-2032)
- Figure 233: Middle East & Africa Active Pharmaceutical Ingredient Market Revenue (US$ Mn) Comparison by By Type of Drug (2016-2032)
- Figure 234: Middle East & Africa Active Pharmaceutical Ingredient Market Revenue (US$ Mn) Comparison by By Type (2016-2032)
- Figure 235: Middle East & Africa Active Pharmaceutical Ingredient Market Revenue (US$ Mn) Comparison by Synthetic APIs, by Type (2016-2032)
- Figure 236: Middle East & Africa Active Pharmaceutical Ingredient Market Revenue (US$ Mn) Comparison by Biotech APIs, by Type (2016-2032)
- Figure 237: Middle East & Africa Active Pharmaceutical Ingredient Market Revenue (US$ Mn) Comparison by Biotech APIs, by Product (2016-2032)
- Figure 238: Middle East & Africa Active Pharmaceutical Ingredient Market Revenue (US$ Mn) Comparison by Biotech APIs, by Expression System (2016-2032)
- Figure 239: Middle East & Africa Active Pharmaceutical Ingredient Market Y-o-Y Growth Rate Comparison by Country (2016-2032)
- Figure 240: Middle East & Africa Active Pharmaceutical Ingredient Market Y-o-Y Growth Rate Comparison by By Type of Drug (2016-2032)
- Figure 241: Middle East & Africa Active Pharmaceutical Ingredient Market Y-o-Y Growth Rate Comparison by By Type (2016-2032)
- Figure 242: Middle East & Africa Active Pharmaceutical Ingredient Market Y-o-Y Growth Rate Comparison by Synthetic APIs, by Type (2016-2032)
- Figure 243: Middle East & Africa Active Pharmaceutical Ingredient Market Y-o-Y Growth Rate Comparison by Biotech APIs, by Type (2016-2032)
- Figure 244: Middle East & Africa Active Pharmaceutical Ingredient Market Y-o-Y Growth Rate Comparison by Biotech APIs, by Product (2016-2032)
- Figure 245: Middle East & Africa Active Pharmaceutical Ingredient Market Y-o-Y Growth Rate Comparison by Biotech APIs, by Expression System (2016-2032)
- Figure 246: Middle East & Africa Active Pharmaceutical Ingredient Market Share Comparison by Country (2016-2032)
- Figure 247: Middle East & Africa Active Pharmaceutical Ingredient Market Share Comparison by By Type of Drug (2016-2032)
- Figure 248: Middle East & Africa Active Pharmaceutical Ingredient Market Share Comparison by By Type (2016-2032)
- Figure 249: Middle East & Africa Active Pharmaceutical Ingredient Market Share Comparison by Synthetic APIs, by Type (2016-2032)
- Figure 250: Middle East & Africa Active Pharmaceutical Ingredient Market Share Comparison by Biotech APIs, by Type (2016-2032)
- Figure 251: Middle East & Africa Active Pharmaceutical Ingredient Market Share Comparison by Biotech APIs, by Product (2016-2032)
- Figure 252: Middle East & Africa Active Pharmaceutical Ingredient Market Share Comparison by Biotech APIs, by Expression System (2016-2032)
- List of Tables
- Table 1: Global Active Pharmaceutical Ingredient Market Comparison by By Type of Drug (2016-2032)
- Table 2: Global Active Pharmaceutical Ingredient Market Comparison by By Type (2016-2032)
- Table 3: Global Active Pharmaceutical Ingredient Market Comparison by Synthetic APIs, by Type (2016-2032)
- Table 4: Global Active Pharmaceutical Ingredient Market Comparison by Biotech APIs, by Type (2016-2032)
- Table 5: Global Active Pharmaceutical Ingredient Market Comparison by Biotech APIs, by Product (2016-2032)
- Table 6: Global Active Pharmaceutical Ingredient Market Comparison by Biotech APIs, by Expression System (2016-2032)
- Table 7: Global Active Pharmaceutical Ingredient Market Revenue (US$ Mn) Comparison by Region (2016-2032)
- Table 8: Global Active Pharmaceutical Ingredient Market Revenue (US$ Mn) (2016-2032)
- Table 9: Global Active Pharmaceutical Ingredient Market Revenue (US$ Mn) Comparison by Region (2016-2032)
- Table 10: Global Active Pharmaceutical Ingredient Market Revenue (US$ Mn) Comparison by By Type of Drug (2016-2032)
- Table 11: Global Active Pharmaceutical Ingredient Market Revenue (US$ Mn) Comparison by By Type (2016-2032)
- Table 12: Global Active Pharmaceutical Ingredient Market Revenue (US$ Mn) Comparison by Synthetic APIs, by Type (2016-2032)
- Table 13: Global Active Pharmaceutical Ingredient Market Revenue (US$ Mn) Comparison by Biotech APIs, by Type (2016-2032)
- Table 14: Global Active Pharmaceutical Ingredient Market Revenue (US$ Mn) Comparison by Biotech APIs, by Product (2016-2032)
- Table 15: Global Active Pharmaceutical Ingredient Market Revenue (US$ Mn) Comparison by Biotech APIs, by Expression System (2016-2032)
- Table 16: Global Active Pharmaceutical Ingredient Market Y-o-Y Growth Rate Comparison by Region (2016-2032)
- Table 17: Global Active Pharmaceutical Ingredient Market Y-o-Y Growth Rate Comparison by By Type of Drug (2016-2032)
- Table 18: Global Active Pharmaceutical Ingredient Market Y-o-Y Growth Rate Comparison by By Type (2016-2032)
- Table 19: Global Active Pharmaceutical Ingredient Market Y-o-Y Growth Rate Comparison by Synthetic APIs, by Type (2016-2032)
- Table 20: Global Active Pharmaceutical Ingredient Market Y-o-Y Growth Rate Comparison by Biotech APIs, by Type (2016-2032)
- Table 21: Global Active Pharmaceutical Ingredient Market Y-o-Y Growth Rate Comparison by Biotech APIs, by Product (2016-2032)
- Table 22: Global Active Pharmaceutical Ingredient Market Y-o-Y Growth Rate Comparison by Biotech APIs, by Expression System (2016-2032)
- Table 23: Global Active Pharmaceutical Ingredient Market Share Comparison by Region (2016-2032)
- Table 24: Global Active Pharmaceutical Ingredient Market Share Comparison by By Type of Drug (2016-2032)
- Table 25: Global Active Pharmaceutical Ingredient Market Share Comparison by By Type (2016-2032)
- Table 26: Global Active Pharmaceutical Ingredient Market Share Comparison by Synthetic APIs, by Type (2016-2032)
- Table 27: Global Active Pharmaceutical Ingredient Market Share Comparison by Biotech APIs, by Type (2016-2032)
- Table 28: Global Active Pharmaceutical Ingredient Market Share Comparison by Biotech APIs, by Product (2016-2032)
- Table 29: Global Active Pharmaceutical Ingredient Market Share Comparison by Biotech APIs, by Expression System (2016-2032)
- Table 30: North America Active Pharmaceutical Ingredient Market Comparison by By Type (2016-2032)
- Table 31: North America Active Pharmaceutical Ingredient Market Comparison by Synthetic APIs, by Type (2016-2032)
- Table 32: North America Active Pharmaceutical Ingredient Market Comparison by Biotech APIs, by Type (2016-2032)
- Table 33: North America Active Pharmaceutical Ingredient Market Comparison by Biotech APIs, by Product (2016-2032)
- Table 34: North America Active Pharmaceutical Ingredient Market Comparison by Biotech APIs, by Expression System (2016-2032)
- Table 35: North America Active Pharmaceutical Ingredient Market Revenue (US$ Mn) Comparison by Country (2016-2032)
- Table 36: North America Active Pharmaceutical Ingredient Market Revenue (US$ Mn) (2016-2032)
- Table 37: North America Active Pharmaceutical Ingredient Market Revenue (US$ Mn) Comparison by Country (2016-2032)
- Table 38: North America Active Pharmaceutical Ingredient Market Revenue (US$ Mn) Comparison by By Type of Drug (2016-2032)
- Table 39: North America Active Pharmaceutical Ingredient Market Revenue (US$ Mn) Comparison by By Type (2016-2032)
- Table 40: North America Active Pharmaceutical Ingredient Market Revenue (US$ Mn) Comparison by Synthetic APIs, by Type (2016-2032)
- Table 41: North America Active Pharmaceutical Ingredient Market Revenue (US$ Mn) Comparison by Biotech APIs, by Type (2016-2032)
- Table 42: North America Active Pharmaceutical Ingredient Market Revenue (US$ Mn) Comparison by Biotech APIs, by Product (2016-2032)
- Table 43: North America Active Pharmaceutical Ingredient Market Revenue (US$ Mn) Comparison by Biotech APIs, by Expression System (2016-2032)
- Table 44: North America Active Pharmaceutical Ingredient Market Y-o-Y Growth Rate Comparison by Country (2016-2032)
- Table 45: North America Active Pharmaceutical Ingredient Market Y-o-Y Growth Rate Comparison by By Type of Drug (2016-2032)
- Table 46: North America Active Pharmaceutical Ingredient Market Y-o-Y Growth Rate Comparison by By Type (2016-2032)
- Table 47: North America Active Pharmaceutical Ingredient Market Y-o-Y Growth Rate Comparison by Synthetic APIs, by Type (2016-2032)
- Table 48: North America Active Pharmaceutical Ingredient Market Y-o-Y Growth Rate Comparison by Biotech APIs, by Type (2016-2032)
- Table 49: North America Active Pharmaceutical Ingredient Market Y-o-Y Growth Rate Comparison by Biotech APIs, by Product (2016-2032)
- Table 50: North America Active Pharmaceutical Ingredient Market Y-o-Y Growth Rate Comparison by Biotech APIs, by Expression System (2016-2032)
- Table 51: North America Active Pharmaceutical Ingredient Market Share Comparison by Country (2016-2032)
- Table 52: North America Active Pharmaceutical Ingredient Market Share Comparison by By Type of Drug (2016-2032)
- Table 53: North America Active Pharmaceutical Ingredient Market Share Comparison by By Type (2016-2032)
- Table 54: North America Active Pharmaceutical Ingredient Market Share Comparison by Synthetic APIs, by Type (2016-2032)
- Table 55: North America Active Pharmaceutical Ingredient Market Share Comparison by Biotech APIs, by Type (2016-2032)
- Table 56: North America Active Pharmaceutical Ingredient Market Share Comparison by Biotech APIs, by Product (2016-2032)
- Table 57: North America Active Pharmaceutical Ingredient Market Share Comparison by Biotech APIs, by Expression System (2016-2032)
- Table 58: Western Europe Active Pharmaceutical Ingredient Market Comparison by By Type of Drug (2016-2032)
- Table 59: Western Europe Active Pharmaceutical Ingredient Market Comparison by By Type (2016-2032)
- Table 60: Western Europe Active Pharmaceutical Ingredient Market Comparison by Synthetic APIs, by Type (2016-2032)
- Table 61: Western Europe Active Pharmaceutical Ingredient Market Comparison by Biotech APIs, by Type (2016-2032)
- Table 62: Western Europe Active Pharmaceutical Ingredient Market Comparison by Biotech APIs, by Product (2016-2032)
- Table 63: Western Europe Active Pharmaceutical Ingredient Market Comparison by Biotech APIs, by Expression System (2016-2032)
- Table 64: Western Europe Active Pharmaceutical Ingredient Market Revenue (US$ Mn) Comparison by Country (2016-2032)
- Table 65: Western Europe Active Pharmaceutical Ingredient Market Revenue (US$ Mn) (2016-2032)
- Table 66: Western Europe Active Pharmaceutical Ingredient Market Revenue (US$ Mn) Comparison by Country (2016-2032)
- Table 67: Western Europe Active Pharmaceutical Ingredient Market Revenue (US$ Mn) Comparison by By Type of Drug (2016-2032)
- Table 68: Western Europe Active Pharmaceutical Ingredient Market Revenue (US$ Mn) Comparison by By Type (2016-2032)
- Table 69: Western Europe Active Pharmaceutical Ingredient Market Revenue (US$ Mn) Comparison by Synthetic APIs, by Type (2016-2032)
- Table 70: Western Europe Active Pharmaceutical Ingredient Market Revenue (US$ Mn) Comparison by Biotech APIs, by Type (2016-2032)
- Table 71: Western Europe Active Pharmaceutical Ingredient Market Revenue (US$ Mn) Comparison by Biotech APIs, by Product (2016-2032)
- Table 72: Western Europe Active Pharmaceutical Ingredient Market Revenue (US$ Mn) Comparison by Biotech APIs, by Expression System (2016-2032)
- Table 73: Western Europe Active Pharmaceutical Ingredient Market Y-o-Y Growth Rate Comparison by Country (2016-2032)
- Table 74: Western Europe Active Pharmaceutical Ingredient Market Y-o-Y Growth Rate Comparison by By Type of Drug (2016-2032)
- Table 75: Western Europe Active Pharmaceutical Ingredient Market Y-o-Y Growth Rate Comparison by By Type (2016-2032)
- Table 76: Western Europe Active Pharmaceutical Ingredient Market Y-o-Y Growth Rate Comparison by Synthetic APIs, by Type (2016-2032)
- Table 77: Western Europe Active Pharmaceutical Ingredient Market Y-o-Y Growth Rate Comparison by Biotech APIs, by Type (2016-2032)
- Table 78: Western Europe Active Pharmaceutical Ingredient Market Y-o-Y Growth Rate Comparison by Biotech APIs, by Product (2016-2032)
- Table 79: Western Europe Active Pharmaceutical Ingredient Market Y-o-Y Growth Rate Comparison by Biotech APIs, by Expression System (2016-2032)
- Table 80: Western Europe Active Pharmaceutical Ingredient Market Share Comparison by Country (2016-2032)
- Table 81: Western Europe Active Pharmaceutical Ingredient Market Share Comparison by By Type of Drug (2016-2032)
- Table 82: Western Europe Active Pharmaceutical Ingredient Market Share Comparison by By Type (2016-2032)
- Table 83: Western Europe Active Pharmaceutical Ingredient Market Share Comparison by Synthetic APIs, by Type (2016-2032)
- Table 84: Western Europe Active Pharmaceutical Ingredient Market Share Comparison by Biotech APIs, by Type (2016-2032)
- Table 85: Western Europe Active Pharmaceutical Ingredient Market Share Comparison by Biotech APIs, by Product (2016-2032)
- Table 86: Western Europe Active Pharmaceutical Ingredient Market Share Comparison by Biotech APIs, by Expression System (2016-2032)
- Table 87: Eastern Europe Active Pharmaceutical Ingredient Market Comparison by By Type of Drug (2016-2032)
- Table 88: Eastern Europe Active Pharmaceutical Ingredient Market Comparison by By Type (2016-2032)
- Table 89: Eastern Europe Active Pharmaceutical Ingredient Market Comparison by Synthetic APIs, by Type (2016-2032)
- Table 90: Eastern Europe Active Pharmaceutical Ingredient Market Comparison by Biotech APIs, by Type (2016-2032)
- Table 91: Eastern Europe Active Pharmaceutical Ingredient Market Comparison by Biotech APIs, by Product (2016-2032)
- Table 92: Eastern Europe Active Pharmaceutical Ingredient Market Comparison by Biotech APIs, by Expression System (2016-2032)
- Table 93: Eastern Europe Active Pharmaceutical Ingredient Market Revenue (US$ Mn) Comparison by Country (2016-2032)
- Table 94: Eastern Europe Active Pharmaceutical Ingredient Market Revenue (US$ Mn) (2016-2032)
- Table 95: Eastern Europe Active Pharmaceutical Ingredient Market Revenue (US$ Mn) Comparison by Country (2016-2032)
- Table 96: Eastern Europe Active Pharmaceutical Ingredient Market Revenue (US$ Mn) Comparison by By Type of Drug (2016-2032)
- Table 97: Eastern Europe Active Pharmaceutical Ingredient Market Revenue (US$ Mn) Comparison by By Type (2016-2032)
- Table 98: Eastern Europe Active Pharmaceutical Ingredient Market Revenue (US$ Mn) Comparison by Synthetic APIs, by Type (2016-2032)
- Table 99: Eastern Europe Active Pharmaceutical Ingredient Market Revenue (US$ Mn) Comparison by Biotech APIs, by Type (2016-2032)
- Table 100: Eastern Europe Active Pharmaceutical Ingredient Market Revenue (US$ Mn) Comparison by Biotech APIs, by Product (2016-2032)
- Table 101: Eastern Europe Active Pharmaceutical Ingredient Market Revenue (US$ Mn) Comparison by Biotech APIs, by Expression System (2016-2032)
- Table 102: Eastern Europe Active Pharmaceutical Ingredient Market Y-o-Y Growth Rate Comparison by Country (2016-2032)
- Table 103: Eastern Europe Active Pharmaceutical Ingredient Market Y-o-Y Growth Rate Comparison by By Type of Drug (2016-2032)
- Table 104: Eastern Europe Active Pharmaceutical Ingredient Market Y-o-Y Growth Rate Comparison by By Type (2016-2032)
- Table 105: Eastern Europe Active Pharmaceutical Ingredient Market Y-o-Y Growth Rate Comparison by Synthetic APIs, by Type (2016-2032)
- Table 106: Eastern Europe Active Pharmaceutical Ingredient Market Y-o-Y Growth Rate Comparison by Biotech APIs, by Type (2016-2032)
- Table 107: Eastern Europe Active Pharmaceutical Ingredient Market Y-o-Y Growth Rate Comparison by Biotech APIs, by Product (2016-2032)
- Table 108: Eastern Europe Active Pharmaceutical Ingredient Market Y-o-Y Growth Rate Comparison by Biotech APIs, by Expression System (2016-2032)
- Table 109: Eastern Europe Active Pharmaceutical Ingredient Market Share Comparison by Country (2016-2032)
- Table 110: Eastern Europe Active Pharmaceutical Ingredient Market Share Comparison by By Type of Drug (2016-2032)
- Table 111: Eastern Europe Active Pharmaceutical Ingredient Market Share Comparison by By Type (2016-2032)
- Table 112: Eastern Europe Active Pharmaceutical Ingredient Market Share Comparison by Synthetic APIs, by Type (2016-2032)
- Table 113: Eastern Europe Active Pharmaceutical Ingredient Market Share Comparison by Biotech APIs, by Type (2016-2032)
- Table 114: Eastern Europe Active Pharmaceutical Ingredient Market Share Comparison by Biotech APIs, by Product (2016-2032)
- Table 115: Eastern Europe Active Pharmaceutical Ingredient Market Share Comparison by Biotech APIs, by Expression System (2016-2032)
- Table 116: APAC Active Pharmaceutical Ingredient Market Comparison by By Type of Drug (2016-2032)
- Table 117: APAC Active Pharmaceutical Ingredient Market Comparison by By Type (2016-2032)
- Table 118: APAC Active Pharmaceutical Ingredient Market Comparison by Synthetic APIs, by Type (2016-2032)
- Table 119: APAC Active Pharmaceutical Ingredient Market Comparison by Biotech APIs, by Type (2016-2032)
- Table 120: APAC Active Pharmaceutical Ingredient Market Comparison by Biotech APIs, by Product (2016-2032)
- Table 121: APAC Active Pharmaceutical Ingredient Market Comparison by Biotech APIs, by Expression System (2016-2032)
- Table 122: APAC Active Pharmaceutical Ingredient Market Revenue (US$ Mn) Comparison by Country (2016-2032)
- Table 123: APAC Active Pharmaceutical Ingredient Market Revenue (US$ Mn) (2016-2032)
- Table 124: APAC Active Pharmaceutical Ingredient Market Revenue (US$ Mn) Comparison by Country (2016-2032)
- Table 125: APAC Active Pharmaceutical Ingredient Market Revenue (US$ Mn) Comparison by By Type of Drug (2016-2032)
- Table 126: APAC Active Pharmaceutical Ingredient Market Revenue (US$ Mn) Comparison by By Type (2016-2032)
- Table 127: APAC Active Pharmaceutical Ingredient Market Revenue (US$ Mn) Comparison by Synthetic APIs, by Type (2016-2032)
- Table 128: APAC Active Pharmaceutical Ingredient Market Revenue (US$ Mn) Comparison by Biotech APIs, by Type (2016-2032)
- Table 129: APAC Active Pharmaceutical Ingredient Market Revenue (US$ Mn) Comparison by Biotech APIs, by Product (2016-2032)
- Table 130: APAC Active Pharmaceutical Ingredient Market Revenue (US$ Mn) Comparison by Biotech APIs, by Expression System (2016-2032)
- Table 131: APAC Active Pharmaceutical Ingredient Market Y-o-Y Growth Rate Comparison by Country (2016-2032)
- Table 132: APAC Active Pharmaceutical Ingredient Market Y-o-Y Growth Rate Comparison by By Type of Drug (2016-2032)
- Table 133: APAC Active Pharmaceutical Ingredient Market Y-o-Y Growth Rate Comparison by By Type (2016-2032)
- Table 134: APAC Active Pharmaceutical Ingredient Market Y-o-Y Growth Rate Comparison by Synthetic APIs, by Type (2016-2032)
- Table 135: APAC Active Pharmaceutical Ingredient Market Y-o-Y Growth Rate Comparison by Biotech APIs, by Type (2016-2032)
- Table 136: APAC Active Pharmaceutical Ingredient Market Y-o-Y Growth Rate Comparison by Biotech APIs, by Product (2016-2032)
- Table 137: APAC Active Pharmaceutical Ingredient Market Y-o-Y Growth Rate Comparison by Biotech APIs, by Expression System (2016-2032)
- Table 138: APAC Active Pharmaceutical Ingredient Market Share Comparison by Country (2016-2032)
- Table 139: APAC Active Pharmaceutical Ingredient Market Share Comparison by By Type of Drug (2016-2032)
- Table 140: APAC Active Pharmaceutical Ingredient Market Share Comparison by By Type (2016-2032)
- Table 141: APAC Active Pharmaceutical Ingredient Market Share Comparison by Synthetic APIs, by Type (2016-2032)
- Table 142: APAC Active Pharmaceutical Ingredient Market Share Comparison by Biotech APIs, by Type (2016-2032)
- Table 143: APAC Active Pharmaceutical Ingredient Market Share Comparison by Biotech APIs, by Product (2016-2032)
- Table 144: APAC Active Pharmaceutical Ingredient Market Share Comparison by Biotech APIs, by Expression System (2016-2032)
- Table 145: Latin America Active Pharmaceutical Ingredient Market Comparison by By Type of Drug (2016-2032)
- Table 146: Latin America Active Pharmaceutical Ingredient Market Comparison by By Type (2016-2032)
- Table 147: Latin America Active Pharmaceutical Ingredient Market Comparison by Synthetic APIs, by Type (2016-2032)
- Table 148: Latin America Active Pharmaceutical Ingredient Market Comparison by Biotech APIs, by Type (2016-2032)
- Table 149: Latin America Active Pharmaceutical Ingredient Market Comparison by Biotech APIs, by Product (2016-2032)
- Table 150: Latin America Active Pharmaceutical Ingredient Market Comparison by Biotech APIs, by Expression System (2016-2032)
- Table 151: Latin America Active Pharmaceutical Ingredient Market Revenue (US$ Mn) Comparison by Country (2016-2032)
- Table 152: Latin America Active Pharmaceutical Ingredient Market Revenue (US$ Mn) (2016-2032)
- Table 153: Latin America Active Pharmaceutical Ingredient Market Revenue (US$ Mn) Comparison by Country (2016-2032)
- Table 154: Latin America Active Pharmaceutical Ingredient Market Revenue (US$ Mn) Comparison by By Type of Drug (2016-2032)
- Table 155: Latin America Active Pharmaceutical Ingredient Market Revenue (US$ Mn) Comparison by By Type (2016-2032)
- Table 156: Latin America Active Pharmaceutical Ingredient Market Revenue (US$ Mn) Comparison by Synthetic APIs, by Type (2016-2032)
- Table 157: Latin America Active Pharmaceutical Ingredient Market Revenue (US$ Mn) Comparison by Biotech APIs, by Type (2016-2032)
- Table 158: Latin America Active Pharmaceutical Ingredient Market Revenue (US$ Mn) Comparison by Biotech APIs, by Product (2016-2032)
- Table 159: Latin America Active Pharmaceutical Ingredient Market Revenue (US$ Mn) Comparison by Biotech APIs, by Expression System (2016-2032)
- Table 160: Latin America Active Pharmaceutical Ingredient Market Y-o-Y Growth Rate Comparison by Country (2016-2032)
- Table 161: Latin America Active Pharmaceutical Ingredient Market Y-o-Y Growth Rate Comparison by By Type of Drug (2016-2032)
- Table 162: Latin America Active Pharmaceutical Ingredient Market Y-o-Y Growth Rate Comparison by By Type (2016-2032)
- Table 163: Latin America Active Pharmaceutical Ingredient Market Y-o-Y Growth Rate Comparison by Synthetic APIs, by Type (2016-2032)
- Table 164: Latin America Active Pharmaceutical Ingredient Market Y-o-Y Growth Rate Comparison by Biotech APIs, by Type (2016-2032)
- Table 165: Latin America Active Pharmaceutical Ingredient Market Y-o-Y Growth Rate Comparison by Biotech APIs, by Product (2016-2032)
- Table 166: Latin America Active Pharmaceutical Ingredient Market Y-o-Y Growth Rate Comparison by Biotech APIs, by Expression System (2016-2032)
- Table 167: Latin America Active Pharmaceutical Ingredient Market Share Comparison by Country (2016-2032)
- Table 168: Latin America Active Pharmaceutical Ingredient Market Share Comparison by By Type of Drug (2016-2032)
- Table 169: Latin America Active Pharmaceutical Ingredient Market Share Comparison by By Type (2016-2032)
- Table 170: Latin America Active Pharmaceutical Ingredient Market Share Comparison by Synthetic APIs, by Type (2016-2032)
- Table 171: Latin America Active Pharmaceutical Ingredient Market Share Comparison by Biotech APIs, by Type (2016-2032)
- Table 172: Latin America Active Pharmaceutical Ingredient Market Share Comparison by Biotech APIs, by Product (2016-2032)
- Table 173: Latin America Active Pharmaceutical Ingredient Market Share Comparison by Biotech APIs, by Expression System (2016-2032)
- Table 174: Middle East & Africa Active Pharmaceutical Ingredient Market Comparison by By Type of Drug (2016-2032)
- Table 175: Middle East & Africa Active Pharmaceutical Ingredient Market Comparison by By Type (2016-2032)
- Table 176: Middle East & Africa Active Pharmaceutical Ingredient Market Comparison by Synthetic APIs, by Type (2016-2032)
- Table 177: Middle East & Africa Active Pharmaceutical Ingredient Market Comparison by Biotech APIs, by Type (2016-2032)
- Table 178: Middle East & Africa Active Pharmaceutical Ingredient Market Comparison by Biotech APIs, by Product (2016-2032)
- Table 179: Middle East & Africa Active Pharmaceutical Ingredient Market Comparison by Biotech APIs, by Expression System (2016-2032)
- Table 180: Middle East & Africa Active Pharmaceutical Ingredient Market Revenue (US$ Mn) Comparison by Country (2016-2032)
- Table 181: Middle East & Africa Active Pharmaceutical Ingredient Market Revenue (US$ Mn) (2016-2032)
- Table 182: Middle East & Africa Active Pharmaceutical Ingredient Market Revenue (US$ Mn) Comparison by Country (2016-2032)
- Table 183: Middle East & Africa Active Pharmaceutical Ingredient Market Revenue (US$ Mn) Comparison by By Type of Drug (2016-2032)
- Table 184: Middle East & Africa Active Pharmaceutical Ingredient Market Revenue (US$ Mn) Comparison by By Type (2016-2032)
- Table 185: Middle East & Africa Active Pharmaceutical Ingredient Market Revenue (US$ Mn) Comparison by Synthetic APIs, by Type (2016-2032)
- Table 186: Middle East & Africa Active Pharmaceutical Ingredient Market Revenue (US$ Mn) Comparison by Biotech APIs, by Type (2016-2032)
- Table 187: Middle East & Africa Active Pharmaceutical Ingredient Market Revenue (US$ Mn) Comparison by Biotech APIs, by Product (2016-2032)
- Table 188: Middle East & Africa Active Pharmaceutical Ingredient Market Revenue (US$ Mn) Comparison by Biotech APIs, by Expression System (2016-2032)
- Table 189: Middle East & Africa Active Pharmaceutical Ingredient Market Y-o-Y Growth Rate Comparison by Country (2016-2032)
- Table 190: Middle East & Africa Active Pharmaceutical Ingredient Market Y-o-Y Growth Rate Comparison by By Type of Drug (2016-2032)
- Table 191: Middle East & Africa Active Pharmaceutical Ingredient Market Y-o-Y Growth Rate Comparison by By Type (2016-2032)
- Table 192: Middle East & Africa Active Pharmaceutical Ingredient Market Y-o-Y Growth Rate Comparison by Synthetic APIs, by Type (2016-2032)
- Table 193: Middle East & Africa Active Pharmaceutical Ingredient Market Y-o-Y Growth Rate Comparison by Biotech APIs, by Type (2016-2032)
- Table 194: Middle East & Africa Active Pharmaceutical Ingredient Market Y-o-Y Growth Rate Comparison by Biotech APIs, by Product (2016-2032)
- Table 195: Middle East & Africa Active Pharmaceutical Ingredient Market Y-o-Y Growth Rate Comparison by Biotech APIs, by Expression System (2016-2032)
- Table 196: Middle East & Africa Active Pharmaceutical Ingredient Market Share Comparison by Country (2016-2032)
- Table 197: Middle East & Africa Active Pharmaceutical Ingredient Market Share Comparison by By Type of Drug (2016-2032)
- Table 198: Middle East & Africa Active Pharmaceutical Ingredient Market Share Comparison by By Type (2016-2032)
- Table 199: Middle East & Africa Active Pharmaceutical Ingredient Market Share Comparison by Synthetic APIs, by Type (2016-2032)
- Table 200: Middle East & Africa Active Pharmaceutical Ingredient Market Share Comparison by Biotech APIs, by Type (2016-2032)
- Table 201: Middle East & Africa Active Pharmaceutical Ingredient Market Share Comparison by Biotech APIs, by Product (2016-2032)
- Table 202: Middle East & Africa Active Pharmaceutical Ingredient Market Share Comparison by Biotech APIs, by Expression System (2016-2032)
- 1. Executive Summary
-
- Pfizer
- Novartis
- Sanofi
- Boehringer Ingelheim
- BASF
- Merck & Co.
- Teva Pharmaceutical
- Sun Pharmaceutical
- Aurobindo Pharma
- Cipla
- Others
Our Clients


View Our Licence Options
