
3d Printing Gases Market By Type (Argon, Nitrogen, Gas Mixtures, Argon Mixtures), By Function (Insulation, Cooling, Illumination), By Technology (Stereolithography, Laser Sintering, Poly-Jet, Material Jetting, Electron Beam Melting, Others), By Storage (Cylinder & Packaged, Merchant Liquid, Tonnage, Others) By End-use (Automotive, Aerospace & Defense, Consumer Products, Healthcare, Others), By Region And Companies - Industry Segment Outlook, Market Assessment, Competition Scenario, Trends, And Forecast 2024-2033
-
47048
-
June 2024
-
300
-


-
This report was compiled by Shreyas Rokade Shreyas Rokade is a seasoned Research Analyst with CMFE, bringing extensive expertise in market research and consulting, with a strong background in Chemical Engineering. Correspondence Team Lead-CMFE Linkedin | Detailed Market research Methodology Our methodology involves a mix of primary research, including interviews with leading mental health experts, and secondary research from reputable medical journals and databases. View Detailed Methodology Page
-
Quick Navigation
Report Overview
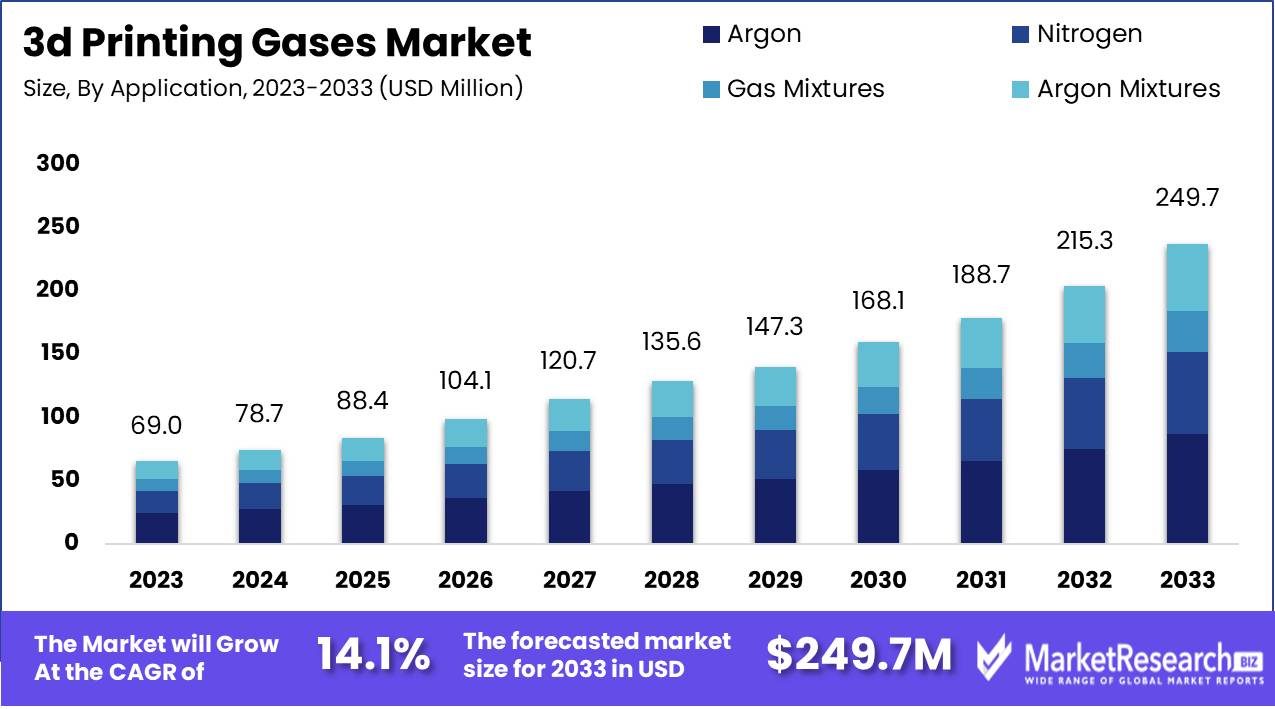
The 3d Printing Gases Market was valued at USD 69.0 Million in 2023. It is expected to reach USD 249.7 Million by 2033, with a CAGR of 14.1% during the forecast period from 2024 to 2033.
The 3D Printing Gases Market encompasses the specialized segment of industrial gases used in additive manufacturing processes. These gases, such as argon, nitrogen, and hydrogen, are crucial for maintaining optimal printing conditions, ensuring material integrity, and preventing oxidation during the printing process. The market is driven by the expanding adoption of 3D printing across various industries, including aerospace, healthcare, and automotive, where precision and material performance are paramount. Innovations in gas delivery systems and the increasing complexity of 3D printed applications are further propelling market growth, highlighting its strategic importance in the advanced manufacturing landscape.
The 3D printing gas market is experiencing robust growth, propelled by several key factors. Primarily, the increasing adoption of 3D printing for prototype applications underscores a significant shift towards rapid and cost-effective product development. This trend is further bolstered by active research and development efforts, which continually enhance the technological capabilities and applications of 3D printing. Notably, the growing feasibility of this technology for small-scale industries presents new opportunities, democratizing access to advanced manufacturing processes that were previously the domain of larger enterprises. Additionally, the expanding application of 3D printing across diverse sectors such as aerospace and automotive is driving the demand for specialized gases, essential for optimizing printing processes and ensuring product quality.
Moreover, emerging markets, particularly in China and India, are becoming pivotal in the global 3D printing landscape. The surge in demand from these regions is driven by their rapidly evolving industrial bases and increasing investment in cutting-edge manufacturing technologies. As these economies continue to modernize, the requirement for high-quality, precise 3D printing solutions grows, subsequently fueling the market for 3D printing gases. This dynamic is compounded by the broadening spectrum of industries leveraging 3D printing, further solidifying the market's growth trajectory.
Key Takeaways
- Market Growth: The 3d Printing Gases Market was valued at USD 69.0 Million in 2023. It is expected to reach USD 249.7 Million by 2033, with a CAGR of 14.1% during the forecast period from 2024 to 2033.
- By Type: Argon dominated 3D printing gases in 2023 with a 67.5% share.
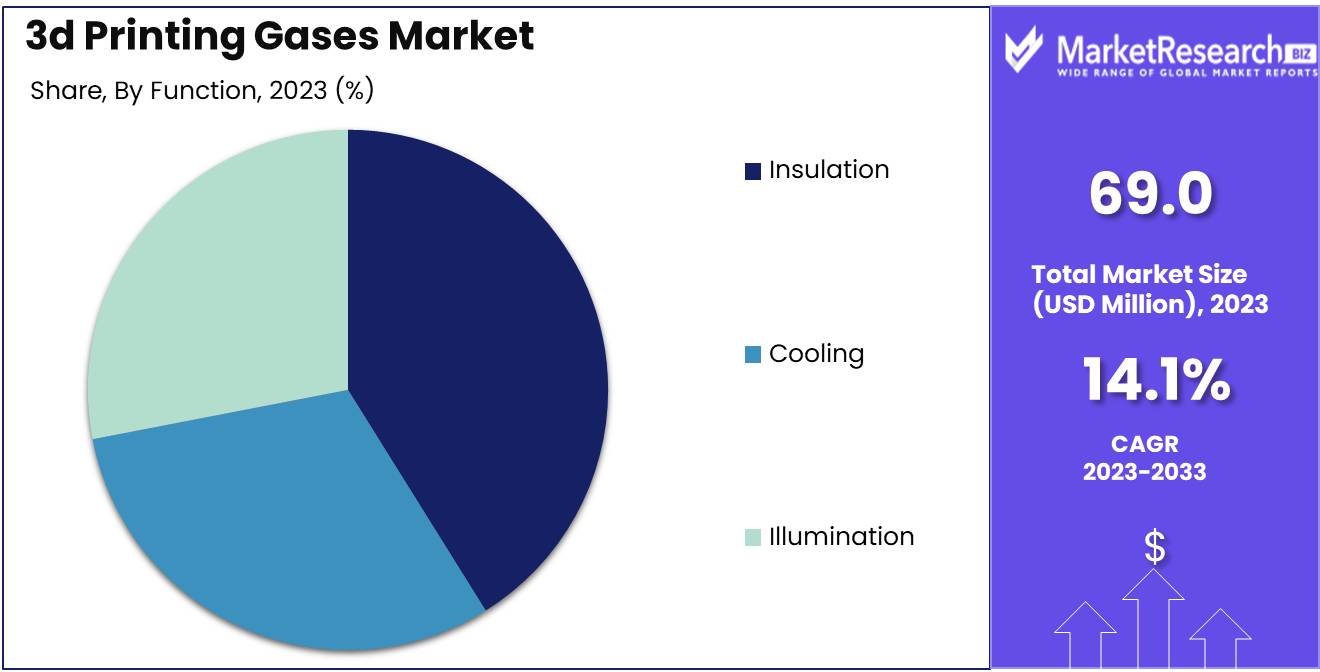
- By Function: Insulation dominated with 41.2%, followed by Cooling and Illumination.
- By Technology: In 2023, Stereolithography dominated the market, capturing over 42.1% share.
- By Storage: Cylinder & Packaged gases dominate the 3D Printing Gases Market capturing more than a 45.6% share.
- By End-User: The Automotive sector dominated, capturing 37.2% of the market.
- Regional Dominance: Asia Pacific dominates the 3D printing gases market, holding a 37% share.
- Growth Opportunity: The global 3D printing gas market will thrive due to Industry 4.0 integration and rising inert gas demand.
Driving factors
Accelerated Adoption of 3D Printing Techniques Across the Manufacturing Sector
The increasing emphasis on implementing 3D printing techniques across the manufacturing sector is a primary driver of the 3D printing gases market. As manufacturers strive for more efficient production methods, 3D printing (or additive manufacturing) offers numerous advantages, including reduced material waste, enhanced design flexibility, and faster prototyping. These benefits are propelling manufacturers across various industries automotive, consumer goods, and industrial equipment to integrate 3D printing into their operations. This integration necessitates a reliable supply of 3D printing gases, such as argon, nitrogen, and hydrogen, which are critical for ensuring the quality and integrity of printed components. As a result, the demand for these gases is expected to rise in parallel with the growing adoption of 3D printing technologies.
Surge in 3D Printing Utilization in Healthcare and Medical Devices
The healthcare sector's growing adoption of 3D printing significantly boosts the 3D printing gases market. 3D printing in healthcare enables the creation of customized medical devices, prosthetics, and implants tailored to individual patients' needs. This customization improves patient outcomes and enhances the overall efficiency of medical treatments. The production of these medical devices requires an array of 3D printing gases to maintain the sterility and precision of the printing process.
Furthermore, the development of bioprinting printing tissues and organs demands highly controlled environments facilitated by these gases. As the healthcare sector continues to explore and expand its use of 3D printing, the associated market for specialized gases is poised for substantial growth.
Expanding Application in Aerospace and Defense Sectors
The aerospace and defense sectors are increasingly adopting 3D printing, contributing to the robust growth of the 3D printing gas market. In aerospace, 3D printing allows for the creation of complex and lightweight components that meet stringent industry standards. This capability is crucial for manufacturing parts with intricate geometries that are difficult or impossible to produce using traditional methods.
Similarly, the defense sector benefits from the rapid prototyping and production capabilities of 3D printing, enabling faster development cycles and customization of mission-critical components. Both sectors rely on 3D printing gases to ensure the mechanical properties and structural integrity of printed parts, thus driving demand for these gases. The projected increase in aerospace and defense expenditures on advanced manufacturing technologies will further stimulate the market for 3D printing gases.
Restraining Factors
Fluctuating Gas Prices: A Major Challenge to Market Stability
The volatility of gas prices poses a significant challenge to the growth of the 3D printing gas market. The costs associated with gases such as argon, nitrogen, and carbon dioxide, which are essential in various 3D printing processes, are directly influenced by global market conditions. Price fluctuations can be attributed to several factors, including geopolitical tensions, supply chain disruptions, and changes in production costs.
When gas prices rise unpredictably, it impacts the overall cost structure of 3D printing operations. Manufacturers might face increased expenses, which can lead to higher prices for end-users or reduced profit margins for producers. This volatility makes it difficult for companies to forecast expenses accurately, thereby hindering long-term planning and investment in new technologies or expanded capacity. For instance, a sudden spike in gas prices could force smaller 3D printing companies to scale back operations or delay projects, ultimately slowing market growth.
Competition from Substitute Technologies: A Hindrance to Market Penetration
The 3D printing gas market faces significant competition from substitute technologies, which can dampen its growth prospects. Alternatives such as fused deposition modeling (FDM) and stereolithography (SLA) do not rely on gases to the same extent as powder bed fusion (PBF) and direct metal laser sintering (DMLS) do. These substitute technologies often use different materials and processes that circumvent the need for specialized gases, thereby offering more cost-effective solutions for certain applications.
This competitive pressure is particularly pronounced in industries such as prototyping and small-batch production, where the cost and complexity of using 3D printing gases may not be justified. For instance, FDM and SLA are widely adopted in educational institutions, hobbyist circles, and small enterprises due to their lower operational costs and ease of use. As these technologies continue to advance, they become more capable of producing high-quality parts, thus encroaching on the market share traditionally held by gas-dependent 3D printing methods.
By Type Analysis
Argon dominated 3D printing gases in 2023 with a 67.5% share.
In 2023, Argon held a dominant market position in the "By Type" segment of the 3D Printing Gases Market, capturing more than a 67.5% share. Argon's extensive use is attributed to its inert properties, which prevent oxidation and provide a stable environment during the printing process, thereby ensuring high-quality outputs. Following Argon, nitrogen secured a significant market share due to its cost-effectiveness and versatility in various 3D printing applications. Nitrogen's inert nature also helps in reducing oxidation, albeit less effectively than Argon.
Gas Mixtures, comprising various combinations tailored to specific printing needs, have seen growing adoption. These mixtures can be customized to enhance specific printing characteristics, such as improving layer adhesion or reducing residual stress in the printed parts. Finally, Argon Mixtures, which combine Argon with other gases like CO2 or O2, offer enhanced performance for specialized printing tasks, particularly in metal additive manufacturing. These mixtures optimize the benefits of Argon while addressing specific process requirements, making them a preferred choice for high-precision applications. Collectively, these segments underline the diverse and evolving landscape of the 3D printing gases market.
By Function Analysis
Insulation dominated with 41.2%, followed by Cooling and Illumination.
In 2023, Insulation held a dominant market position in the By Function segment of the 3D Printing Gases Market, capturing more than a 41.2% share. This strong performance is attributed to the growing demand for enhanced thermal properties and protection during the 3D printing process. Insulation gases, such as nitrogen and argon, play a critical role in preventing oxidation and maintaining material integrity, especially for high-value and sensitive printing materials.
Cooling follows as the second major segment, driven by its crucial role in temperature regulation during printing operations. Cooling gases help mitigate the heat generated by the 3D printing equipment, thereby ensuring precision and stability in the final printed products. This function is particularly essential in high-speed and large-scale printing processes where overheating can compromise quality and efficiency.
Illumination is the third significant segment, albeit with a smaller market share. Illumination gases are used to enhance the visibility of the printing process, ensuring accuracy and reducing errors. This is particularly important in intricate and detailed printing tasks where precision is paramount.
By Technology Analysis
In 2023, Stereolithography dominated the market, capturing over 42.1% share.
In 2023, Stereolithography held a dominant market position in the By Technology segment of the 3D Printing Gases Market, capturing more than a 42.1% share. This leading technology leverages photopolymerization to produce high-resolution and precise components, driving its extensive adoption across various industries, including aerospace, healthcare, and automotive. The accuracy and surface finish achievable with stereolithography are unparalleled, positioning it as the go-to technology for prototyping and manufacturing complex geometries.
Laser Sintering follows closely, gaining traction due to its ability to create durable and functional parts from a variety of materials, such as metals and polymers. This versatility makes it particularly valuable in industrial applications where strength and durability are paramount.
Poly-jet technology, known for its high-speed printing and multi-material capabilities, is widely used for creating prototypes and intricate models that require fine details and smooth surfaces. Material Jetting also plays a significant role, particularly in producing high-precision components with excellent mechanical properties, suitable for both prototyping and end-use products. Electron Beam Melting (EBM), though niche, is critical in the aerospace and medical sectors for producing high-strength, lightweight metal parts.
Lastly, Other technologies, including Digital Light Processing (DLP) and Binder Jetting, continue to innovate and expand their applications, contributing to the diverse landscape of the 3D Printing Gases Market.
By Storage Analysis
Cylinder & Packaged gases dominate the 3D Printing Gases Market capturing more than a 45.6% share.
In 2023, Cylinder & Packaged held a dominant market position in the By Storage segment of the 3D Printing Gases Market, capturing more than a 45.6% share. This segment's dominance can be attributed to several key factors. Firstly, the versatility and convenience of cylinder and packaged gases make them highly suitable for various 3D printing applications, ranging from prototyping to large-scale manufacturing. Secondly, the ease of transportation and storage of these gases ensures a steady supply chain, critical for uninterrupted operations in additive manufacturing. Additionally, advancements in packaging technologies have enhanced the safety and efficiency of gas storage, further solidifying this segment's market leadership.
Merchant Liquid gases, while comprising a smaller share, are growing in importance due to their cost-effectiveness for medium to large-scale operations. The Tonnage segment, providing gases in bulk, caters primarily to large industrial applications, offering significant economies of scale. Others, including specialty gases and custom blends, serve niche markets with specific performance requirements. Together, these segments create a diversified market landscape, with Cylinder & Packaged gases setting the benchmark in 2023 through their widespread applicability and logistical advantages.
By End-use Analysis
In 2023, The Automotive sector dominated, capturing 37.2% of the market.
In 2023, The Automotive sector held a dominant market position in the 3D printing gases market within the end-use segment, capturing more than a 37.2% share. This substantial market share is driven by the increasing adoption of 3D printing technologies for prototyping, tooling, and the production of complex automotive components. The precision and efficiency of 3D printing in reducing lead times and material wastage have made it a valuable asset for automotive manufacturers aiming to streamline operations and enhance product innovation.
The aerospace and defense sector, representing another significant segment, leverages 3D printing gases for the fabrication of lightweight, high-strength parts, essential for advanced aerospace applications. The consumer products industry also utilizes 3D printing gases, particularly for customized and small-batch manufacturing, reflecting a trend toward personalized products.
In healthcare, the use of 3D printing gases is expanding, notably in the creation of patient-specific medical devices and implants, improving patient outcomes through tailored healthcare solutions. The "others" category encompasses various industries, including education and research, where 3D printing technologies are utilized for experimental and developmental purposes, contributing to the broader growth of the 3D printing gases market.
Key Market Segments
By Type
- Argon
- Nitrogen
- Gas Mixtures
- Argon Mixtures
By Function
- Insulation
- Cooling
- Illumination
By Technology
- Stereolithography
- Laser Sintering
- Poly-Jet
- Material Jetting
- Electron Beam Melting
- Others
By Storage
- Cylinder & Packaged
- Merchant Liquid
- Tonnage
- Others
By End-use
- Automotive
- Aerospace & Defense
- Consumer Products
- Healthcare
- Others
Growth Opportunity
Integration with Industry 4.0 Technologies
The 3D printing gas market is poised for substantial growth in 2024, driven significantly by the integration with Industry 4.0 technologies. As manufacturing processes become increasingly digital, the demand for precise and efficient production methods escalates. 3D printing, coupled with the Internet of Things (IoT), Artificial Intelligence (AI), and big data analytics, enhances the precision, scalability, and customization capabilities of manufacturing. Gases like argon, nitrogen, and hydrogen play a crucial role in maintaining the quality of printed components by preventing oxidation and contamination during the printing process. The synergy between Industry 4.0 and 3D printing gases offers a pathway to smarter, more efficient production lines, thereby fostering market expansion.
Growing Demand for Inert Gases
The rising demand for inert gases is another pivotal factor propelling the 3D printing gas market. Inert gases, particularly argon and nitrogen, are essential in creating an optimal atmosphere for 3D printing, especially in metal additive manufacturing. These gases ensure the stability and quality of the printed materials by mitigating the risks of oxidation and other chemical reactions that could compromise the integrity of the product. With the increasing adoption of metal 3D printing in industries such as aerospace, automotive, and healthcare, the need for high-purity inert gases is surging. This trend is expected to continue, driving market growth and innovation in gas supply and management solutions.
Latest Trends
Increasing Demand for Inert Gases
The 3D printing industry is experiencing robust growth, significantly driving the demand for inert gases such as argon, nitrogen, and helium. Inert gases are crucial in ensuring high-quality prints by preventing oxidation and maintaining a stable printing environment. As industries such as aerospace, automotive, and healthcare increasingly adopt 3D printing for manufacturing complex parts and prototypes, the need for inert gases is projected to rise. The purity and consistency offered by inert gases enhance the mechanical properties and surface finish of 3D-printed components, making them indispensable for high-precision applications. This trend is anticipated to spur investments in gas production and supply chain optimization to meet the burgeoning demand.
Development of New 3D Printing Technologies
The 3D printing sector is witnessing a wave of innovation, with the development of new technologies that expand the capabilities and applications of 3D printing. Techniques such as Multi-Jet Fusion (MJF), Direct Metal Laser Sintering (DMLS), and Electron Beam Melting (EBM) are gaining traction, necessitating specialized gas mixtures to optimize their performance. These advancements are enhancing the efficiency and speed of 3D printing processes and enabling the use of a broader range of materials. The integration of these cutting-edge technologies is expected to drive the demand for customized gas solutions, tailored to meet the specific requirements of different printing methods. Companies will likely focus on research and development to create innovative gas mixtures that support the evolving landscape of 3D printing technologies.
Regional Analysis
Asia Pacific dominates the 3D printing gases market, holding a 37% share.
The 3D printing gases market exhibits significant regional variability, with distinct trends and growth drivers across North America, Europe, Asia Pacific, the Middle East & Africa, and Latin America. Asia Pacific dominates the market, accounting for approximately 37% of the global share, driven by robust industrial manufacturing bases, particularly in China, Japan, and South Korea. The region's leadership in electronics, automotive, and consumer goods manufacturing underpins this dominance. North America follows, benefiting from advanced technological adoption and substantial investments in the aerospace and healthcare sectors. The United States, in particular, is a pivotal player due to its strong innovation ecosystem and extensive use of 3D printing technologies in industrial applications.
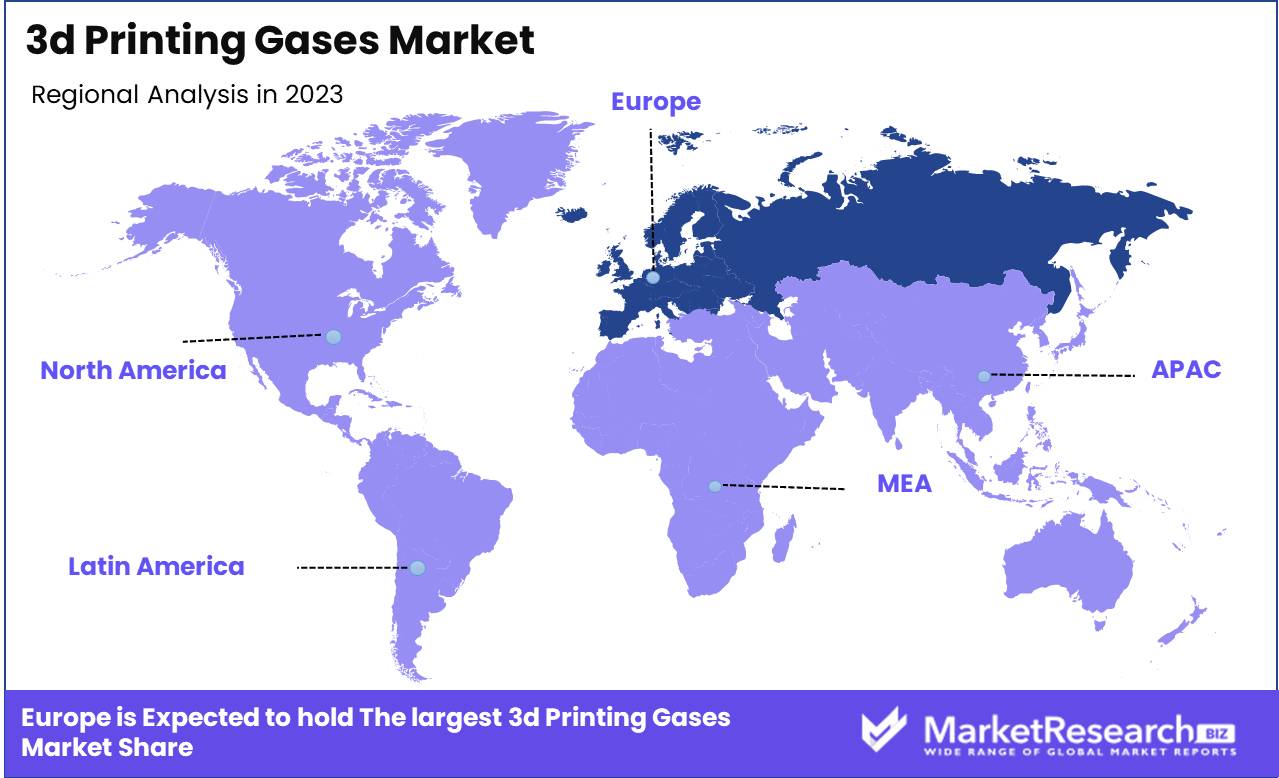
Europe's market is bolstered by strong automotive and aerospace industries, with Germany, the UK, and France being key contributors. The region's commitment to sustainable and efficient manufacturing processes further accelerates 3D printing adoption. The Middle East & Africa, while still emerging in the 3D printing domain, show promising growth due to increasing investments in infrastructure and energy sectors, particularly in the UAE and Saudi Arabia. Latin America is gradually advancing, with Brazil and Mexico spearheading the market growth through rising adoption in manufacturing and healthcare applications.
Key Regions and Countries
North America
- The US
- Canada
- Rest of North America
Europe
- Germany
- France
- The UK
- Spain
- Netherlands
- Russia
- Italy
- Rest of Europe
Asia-Pacific
- China
- Japan
- Singapore
- Thailand
- South Korea
- Vietnam
- India
- New Zealand
- Rest of Asia Pacific
Latin America
- Mexico
- Brazil
- Rest of Latin America
Middle East & Africa
- Saudi Arabia
- South Africa
- UAE
- Rest of the Middle East & Africa
Key Players Analysis
The global 3D printing gases market in 2024 is set for significant growth, driven by technological advancements and expanding industrial applications. Key players, such as Air Liquide, Air Products and Chemicals, Inc., and Linde PLC, are at the forefront, leveraging their robust portfolios and innovative solutions to cater to the evolving needs of the 3D printing industry.
Air Liquide continues to dominate with its comprehensive range of gas solutions and commitment to research and development. Their strategic focus on sustainability and efficiency aligns with the industry's demand for eco-friendly and cost-effective options. Similarly, Air Products and Chemicals, Inc. has fortified its market position through strategic partnerships and an extensive distribution network, enhancing its ability to meet diverse customer requirements globally.
Linde PLC and Praxair Inc., following their merger, have emerged as a formidable force, combining extensive expertise and resources to drive innovation. Their focus on tailored gas solutions for additive manufacturing underscores their commitment to addressing specific industry challenges.
BASF SE, with its strong chemical foundation, provides critical material innovations that complement gas applications in 3D printing. Meanwhile, companies like Iceblick Ltd. and Iwatani Corporation are making strides with niche offerings and regional strengths, contributing to market diversity.
Market Key Players
- Air Liquide
- Air Products and Chemicals, INC.
- Airgas Inc.
- BASF SE
- Iceblick Ltd.
- Iwatani Corporation
- Linde PLC
- Matheson Tri-Gas Inc.
- Messer Group
- Nippon Sanso Holdings Corporation
- Praxair Inc.
- SOL Group
- The Linde Group
- Universal Industrial Gases
Recent Development
- In March 2024, Air Liquide introduced a new range of high-purity gases designed specifically for additive manufacturing. This move is part of their strategy to cater to the growing market for specialized gases used in 3D printing processes such as laser sintering and stereolithography.
- In January 2024, BASF SE announced the launch of new gas mixtures tailored for metal 3D printing applications. This development aims to enhance the performance and quality of 3D-printed metal parts, reflecting the increasing demand for high-precision manufacturing in sectors like aerospace and automotive.
- In November 2023, BASF SE, a global leader in the chemicals industry, partnered with SK On, a prominent manufacturer of electric vehicle battery cells, to explore collaborative opportunities in the lithium-ion battery market. This partnership is focused on enhancing the use of 3D printing technologies in battery production, particularly in North America and Asia-Pacific.
Report Scope
Report Features Description Market Value (2023) USD 69.0 Million Forecast Revenue (2033) USD 249.7 Million CAGR (2024-2032) 14.1% Base Year for Estimation 2023 Historic Period 2016-2023 Forecast Period 2024-2033 Report Coverage Revenue Forecast, Market Dynamics, COVID-19 Impact, Competitive Landscape, Recent Developments Segments Covered By Type (Argon, Nitrogen, Gas Mixtures, Argon Mixtures), By Function (Insulation, Cooling, Illumination), By Technology (Stereolithography, Laser Sintering, Poly-Jet, Material Jetting, Electron Beam Melting, Others), By Storage (Cylinder & Packaged, Merchant Liquid, Tonnage, Others) By End-use (Automotive, Aerospace & Defense, Consumer Products, Healthcare, Others) Regional Analysis North America - The US, Canada, Rest of North America, Europe - Germany, France, The UK, Spain, Italy, Russia, Netherlands, Rest of Europe, Asia-Pacific - China, Japan, South Korea, India, New Zealand, Singapore, Thailand, Vietnam, Rest of Asia Pacific, Latin America - Brazil, Mexico, Rest of Latin America, Middle East & Africa - South Africa, Saudi Arabia, UAE, Rest of Middle East & Africa Competitive Landscape Air Liquide, Air Products and Chemicals, INC., Airgas Inc., BASF SE, Iceblick Ltd., Iwatani Corporation, Linde PLC, Matheson Tri-Gas Inc., Messer Group, Nippon Sanso Holdings Corporation, Praxair Inc., SOL Group, The Linde Group, Universal Industrial Gases Customization Scope Customization for segments, region/country-level will be provided. Moreover, additional customization can be done based on the requirements. Purchase Options We have three licenses to opt for Single User License, Multi-User License (Up to 5 Users), Corporate Use License (Unlimited User and Printable PDF) -
- 1. Executive Summary
- 1.1. Definition
- 1.2. Taxonomy
- 1.3. Research Scope
- 1.4. Key Analysis
- 1.5. Key Findings by Major Segments
- 1.6. Top strategies by Major Players
- 2. Global 3d Printing Gases Market Overview
- 2.1. 3d Printing Gases Market Dynamics
- 2.1.1. Drivers
- 2.1.2. Opportunities
- 2.1.3. Restraints
- 2.1.4. Challenges
- 2.2. Macro-economic Factors
- 2.3. Regulatory Framework
- 2.4. Market Investment Feasibility Index
- 2.5. PEST Analysis
- 2.6. PORTER’S Five Force Analysis
- 2.7. Drivers & Restraints Impact Analysis
- 2.8. Industry Chain Analysis
- 2.9. Cost Structure Analysis
- 2.10. Marketing Strategy
- 2.11. Russia-Ukraine War Impact Analysis
- 2.12. Opportunity Map Analysis
- 2.13. Market Competition Scenario Analysis
- 2.14. Product Life Cycle Analysis
- 2.15. Opportunity Orbits
- 2.16. Manufacturer Intensity Map
- 2.17. Major Companies sales by Value & Volume
- 2.1. 3d Printing Gases Market Dynamics
- 3. Global 3d Printing Gases Market Analysis, Opportunity and Forecast, 2016-2032
- 3.1. Global 3d Printing Gases Market Analysis, 2016-2021
- 3.2. Global 3d Printing Gases Market Opportunity and Forecast, 2023-2032
- 3.3. Global 3d Printing Gases Market Analysis, Opportunity and Forecast, By Type, 2016-2032
- 3.3.1. Global 3d Printing Gases Market Analysis by Type: Introduction
- 3.3.2. Market Size Absolute $ Opportunity Analysis and Forecast, By Type, 2016-2032
- 3.3.3. Argon
- 3.3.4. Nitrogen
- 3.3.5. Gas Mixtures
- 3.3.6. Argon Mixtures
- 3.4. Global 3d Printing Gases Market Analysis, Opportunity and Forecast, By Function , 2016-2032
- 3.4.1. Global 3d Printing Gases Market Analysis by Function : Introduction
- 3.4.2. Market Size Absolute $ Opportunity Analysis and Forecast, By Function , 2016-2032
- 3.4.3. Insulation
- 3.4.4. Cooling
- 3.4.5. Illumination
- 3.5. Global 3d Printing Gases Market Analysis, Opportunity and Forecast, By Technology, 2016-2032
- 3.5.1. Global 3d Printing Gases Market Analysis by Technology: Introduction
- 3.5.2. Market Size Absolute $ Opportunity Analysis and Forecast, By Technology, 2016-2032
- 3.5.3. Stereolithography
- 3.5.4. Laser Sintering
- 3.5.5. Poly-Jet
- 3.5.6. Material Jetting
- 3.5.7. Electron Beam Melting
- 3.5.8. Others
- 3.6. Global 3d Printing Gases Market Analysis, Opportunity and Forecast, By Storage, 2016-2032
- 3.6.1. Global 3d Printing Gases Market Analysis by Storage: Introduction
- 3.6.2. Market Size Absolute $ Opportunity Analysis and Forecast, By Storage, 2016-2032
- 3.6.3. Cylinder & Packaged
- 3.6.4. Merchant Liquid
- 3.6.5. Tonnage
- 3.6.6. Others
- 3.7. Global 3d Printing Gases Market Analysis, Opportunity and Forecast, By End-use , 2016-2032
- 3.7.1. Global 3d Printing Gases Market Analysis by End-use : Introduction
- 3.7.2. Market Size Absolute $ Opportunity Analysis and Forecast, By End-use , 2016-2032
- 3.7.3. Automotive
- 3.7.4. Aerospace & Defense
- 3.7.5. Consumer Products
- 3.7.6. Healthcare
- 3.7.7. Others
- 4. North America 3d Printing Gases Market Analysis, Opportunity and Forecast, 2016-2032
- 4.1. North America 3d Printing Gases Market Analysis, 2016-2021
- 4.2. North America 3d Printing Gases Market Opportunity and Forecast, 2023-2032
- 4.3. North America 3d Printing Gases Market Analysis, Opportunity and Forecast, By Type, 2016-2032
- 4.3.1. North America 3d Printing Gases Market Analysis by Type: Introduction
- 4.3.2. Market Size Absolute $ Opportunity Analysis and Forecast, By Type, 2016-2032
- 4.3.3. Argon
- 4.3.4. Nitrogen
- 4.3.5. Gas Mixtures
- 4.3.6. Argon Mixtures
- 4.4. North America 3d Printing Gases Market Analysis, Opportunity and Forecast, By Function , 2016-2032
- 4.4.1. North America 3d Printing Gases Market Analysis by Function : Introduction
- 4.4.2. Market Size Absolute $ Opportunity Analysis and Forecast, By Function , 2016-2032
- 4.4.3. Insulation
- 4.4.4. Cooling
- 4.4.5. Illumination
- 4.5. North America 3d Printing Gases Market Analysis, Opportunity and Forecast, By Technology, 2016-2032
- 4.5.1. North America 3d Printing Gases Market Analysis by Technology: Introduction
- 4.5.2. Market Size Absolute $ Opportunity Analysis and Forecast, By Technology, 2016-2032
- 4.5.3. Stereolithography
- 4.5.4. Laser Sintering
- 4.5.5. Poly-Jet
- 4.5.6. Material Jetting
- 4.5.7. Electron Beam Melting
- 4.5.8. Others
- 4.6. North America 3d Printing Gases Market Analysis, Opportunity and Forecast, By Storage, 2016-2032
- 4.6.1. North America 3d Printing Gases Market Analysis by Storage: Introduction
- 4.6.2. Market Size Absolute $ Opportunity Analysis and Forecast, By Storage, 2016-2032
- 4.6.3. Cylinder & Packaged
- 4.6.4. Merchant Liquid
- 4.6.5. Tonnage
- 4.6.6. Others
- 4.7. North America 3d Printing Gases Market Analysis, Opportunity and Forecast, By End-use , 2016-2032
- 4.7.1. North America 3d Printing Gases Market Analysis by End-use : Introduction
- 4.7.2. Market Size Absolute $ Opportunity Analysis and Forecast, By End-use , 2016-2032
- 4.7.3. Automotive
- 4.7.4. Aerospace & Defense
- 4.7.5. Consumer Products
- 4.7.6. Healthcare
- 4.7.7. Others
- 4.8. North America 3d Printing Gases Market Analysis, Opportunity and Forecast, By Country , 2016-2032
- 4.8.1. North America 3d Printing Gases Market Analysis by Country : Introduction
- 4.8.2. Market Size Absolute $ Opportunity Analysis and Forecast, Country , 2016-2032
- 4.8.2.1. The US
- 4.8.2.2. Canada
- 4.8.2.3. Mexico
- 5. Western Europe 3d Printing Gases Market Analysis, Opportunity and Forecast, 2016-2032
- 5.1. Western Europe 3d Printing Gases Market Analysis, 2016-2021
- 5.2. Western Europe 3d Printing Gases Market Opportunity and Forecast, 2023-2032
- 5.3. Western Europe 3d Printing Gases Market Analysis, Opportunity and Forecast, By Type, 2016-2032
- 5.3.1. Western Europe 3d Printing Gases Market Analysis by Type: Introduction
- 5.3.2. Market Size Absolute $ Opportunity Analysis and Forecast, By Type, 2016-2032
- 5.3.3. Argon
- 5.3.4. Nitrogen
- 5.3.5. Gas Mixtures
- 5.3.6. Argon Mixtures
- 5.4. Western Europe 3d Printing Gases Market Analysis, Opportunity and Forecast, By Function , 2016-2032
- 5.4.1. Western Europe 3d Printing Gases Market Analysis by Function : Introduction
- 5.4.2. Market Size Absolute $ Opportunity Analysis and Forecast, By Function , 2016-2032
- 5.4.3. Insulation
- 5.4.4. Cooling
- 5.4.5. Illumination
- 5.5. Western Europe 3d Printing Gases Market Analysis, Opportunity and Forecast, By Technology, 2016-2032
- 5.5.1. Western Europe 3d Printing Gases Market Analysis by Technology: Introduction
- 5.5.2. Market Size Absolute $ Opportunity Analysis and Forecast, By Technology, 2016-2032
- 5.5.3. Stereolithography
- 5.5.4. Laser Sintering
- 5.5.5. Poly-Jet
- 5.5.6. Material Jetting
- 5.5.7. Electron Beam Melting
- 5.5.8. Others
- 5.6. Western Europe 3d Printing Gases Market Analysis, Opportunity and Forecast, By Storage, 2016-2032
- 5.6.1. Western Europe 3d Printing Gases Market Analysis by Storage: Introduction
- 5.6.2. Market Size Absolute $ Opportunity Analysis and Forecast, By Storage, 2016-2032
- 5.6.3. Cylinder & Packaged
- 5.6.4. Merchant Liquid
- 5.6.5. Tonnage
- 5.6.6. Others
- 5.7. Western Europe 3d Printing Gases Market Analysis, Opportunity and Forecast, By End-use , 2016-2032
- 5.7.1. Western Europe 3d Printing Gases Market Analysis by End-use : Introduction
- 5.7.2. Market Size Absolute $ Opportunity Analysis and Forecast, By End-use , 2016-2032
- 5.7.3. Automotive
- 5.7.4. Aerospace & Defense
- 5.7.5. Consumer Products
- 5.7.6. Healthcare
- 5.7.7. Others
- 5.8. Western Europe 3d Printing Gases Market Analysis, Opportunity and Forecast, By Country , 2016-2032
- 5.8.1. Western Europe 3d Printing Gases Market Analysis by Country : Introduction
- 5.8.2. Market Size Absolute $ Opportunity Analysis and Forecast, Country , 2016-2032
- 5.8.2.1. Germany
- 5.8.2.2. France
- 5.8.2.3. The UK
- 5.8.2.4. Spain
- 5.8.2.5. Italy
- 5.8.2.6. Portugal
- 5.8.2.7. Ireland
- 5.8.2.8. Austria
- 5.8.2.9. Switzerland
- 5.8.2.10. Benelux
- 5.8.2.11. Nordic
- 5.8.2.12. Rest of Western Europe
- 6. Eastern Europe 3d Printing Gases Market Analysis, Opportunity and Forecast, 2016-2032
- 6.1. Eastern Europe 3d Printing Gases Market Analysis, 2016-2021
- 6.2. Eastern Europe 3d Printing Gases Market Opportunity and Forecast, 2023-2032
- 6.3. Eastern Europe 3d Printing Gases Market Analysis, Opportunity and Forecast, By Type, 2016-2032
- 6.3.1. Eastern Europe 3d Printing Gases Market Analysis by Type: Introduction
- 6.3.2. Market Size Absolute $ Opportunity Analysis and Forecast, By Type, 2016-2032
- 6.3.3. Argon
- 6.3.4. Nitrogen
- 6.3.5. Gas Mixtures
- 6.3.6. Argon Mixtures
- 6.4. Eastern Europe 3d Printing Gases Market Analysis, Opportunity and Forecast, By Function , 2016-2032
- 6.4.1. Eastern Europe 3d Printing Gases Market Analysis by Function : Introduction
- 6.4.2. Market Size Absolute $ Opportunity Analysis and Forecast, By Function , 2016-2032
- 6.4.3. Insulation
- 6.4.4. Cooling
- 6.4.5. Illumination
- 6.5. Eastern Europe 3d Printing Gases Market Analysis, Opportunity and Forecast, By Technology, 2016-2032
- 6.5.1. Eastern Europe 3d Printing Gases Market Analysis by Technology: Introduction
- 6.5.2. Market Size Absolute $ Opportunity Analysis and Forecast, By Technology, 2016-2032
- 6.5.3. Stereolithography
- 6.5.4. Laser Sintering
- 6.5.5. Poly-Jet
- 6.5.6. Material Jetting
- 6.5.7. Electron Beam Melting
- 6.5.8. Others
- 6.6. Eastern Europe 3d Printing Gases Market Analysis, Opportunity and Forecast, By Storage, 2016-2032
- 6.6.1. Eastern Europe 3d Printing Gases Market Analysis by Storage: Introduction
- 6.6.2. Market Size Absolute $ Opportunity Analysis and Forecast, By Storage, 2016-2032
- 6.6.3. Cylinder & Packaged
- 6.6.4. Merchant Liquid
- 6.6.5. Tonnage
- 6.6.6. Others
- 6.7. Eastern Europe 3d Printing Gases Market Analysis, Opportunity and Forecast, By End-use , 2016-2032
- 6.7.1. Eastern Europe 3d Printing Gases Market Analysis by End-use : Introduction
- 6.7.2. Market Size Absolute $ Opportunity Analysis and Forecast, By End-use , 2016-2032
- 6.7.3. Automotive
- 6.7.4. Aerospace & Defense
- 6.7.5. Consumer Products
- 6.7.6. Healthcare
- 6.7.7. Others
- 6.8. Eastern Europe 3d Printing Gases Market Analysis, Opportunity and Forecast, By Country , 2016-2032
- 6.8.1. Eastern Europe 3d Printing Gases Market Analysis by Country : Introduction
- 6.8.2. Market Size Absolute $ Opportunity Analysis and Forecast, Country , 2016-2032
- 6.8.2.1. Russia
- 6.8.2.2. Poland
- 6.8.2.3. The Czech Republic
- 6.8.2.4. Greece
- 6.8.2.5. Rest of Eastern Europe
- 7. APAC 3d Printing Gases Market Analysis, Opportunity and Forecast, 2016-2032
- 7.1. APAC 3d Printing Gases Market Analysis, 2016-2021
- 7.2. APAC 3d Printing Gases Market Opportunity and Forecast, 2023-2032
- 7.3. APAC 3d Printing Gases Market Analysis, Opportunity and Forecast, By Type, 2016-2032
- 7.3.1. APAC 3d Printing Gases Market Analysis by Type: Introduction
- 7.3.2. Market Size Absolute $ Opportunity Analysis and Forecast, By Type, 2016-2032
- 7.3.3. Argon
- 7.3.4. Nitrogen
- 7.3.5. Gas Mixtures
- 7.3.6. Argon Mixtures
- 7.4. APAC 3d Printing Gases Market Analysis, Opportunity and Forecast, By Function , 2016-2032
- 7.4.1. APAC 3d Printing Gases Market Analysis by Function : Introduction
- 7.4.2. Market Size Absolute $ Opportunity Analysis and Forecast, By Function , 2016-2032
- 7.4.3. Insulation
- 7.4.4. Cooling
- 7.4.5. Illumination
- 7.5. APAC 3d Printing Gases Market Analysis, Opportunity and Forecast, By Technology, 2016-2032
- 7.5.1. APAC 3d Printing Gases Market Analysis by Technology: Introduction
- 7.5.2. Market Size Absolute $ Opportunity Analysis and Forecast, By Technology, 2016-2032
- 7.5.3. Stereolithography
- 7.5.4. Laser Sintering
- 7.5.5. Poly-Jet
- 7.5.6. Material Jetting
- 7.5.7. Electron Beam Melting
- 7.5.8. Others
- 7.6. APAC 3d Printing Gases Market Analysis, Opportunity and Forecast, By Storage, 2016-2032
- 7.6.1. APAC 3d Printing Gases Market Analysis by Storage: Introduction
- 7.6.2. Market Size Absolute $ Opportunity Analysis and Forecast, By Storage, 2016-2032
- 7.6.3. Cylinder & Packaged
- 7.6.4. Merchant Liquid
- 7.6.5. Tonnage
- 7.6.6. Others
- 7.7. APAC 3d Printing Gases Market Analysis, Opportunity and Forecast, By End-use , 2016-2032
- 7.7.1. APAC 3d Printing Gases Market Analysis by End-use : Introduction
- 7.7.2. Market Size Absolute $ Opportunity Analysis and Forecast, By End-use , 2016-2032
- 7.7.3. Automotive
- 7.7.4. Aerospace & Defense
- 7.7.5. Consumer Products
- 7.7.6. Healthcare
- 7.7.7. Others
- 7.8. APAC 3d Printing Gases Market Analysis, Opportunity and Forecast, By Country , 2016-2032
- 7.8.1. APAC 3d Printing Gases Market Analysis by Country : Introduction
- 7.8.2. Market Size Absolute $ Opportunity Analysis and Forecast, Country , 2016-2032
- 7.8.2.1. China
- 7.8.2.2. Japan
- 7.8.2.3. South Korea
- 7.8.2.4. India
- 7.8.2.5. Australia & New Zeland
- 7.8.2.6. Indonesia
- 7.8.2.7. Malaysia
- 7.8.2.8. Philippines
- 7.8.2.9. Singapore
- 7.8.2.10. Thailand
- 7.8.2.11. Vietnam
- 7.8.2.12. Rest of APAC
- 8. Latin America 3d Printing Gases Market Analysis, Opportunity and Forecast, 2016-2032
- 8.1. Latin America 3d Printing Gases Market Analysis, 2016-2021
- 8.2. Latin America 3d Printing Gases Market Opportunity and Forecast, 2023-2032
- 8.3. Latin America 3d Printing Gases Market Analysis, Opportunity and Forecast, By Type, 2016-2032
- 8.3.1. Latin America 3d Printing Gases Market Analysis by Type: Introduction
- 8.3.2. Market Size Absolute $ Opportunity Analysis and Forecast, By Type, 2016-2032
- 8.3.3. Argon
- 8.3.4. Nitrogen
- 8.3.5. Gas Mixtures
- 8.3.6. Argon Mixtures
- 8.4. Latin America 3d Printing Gases Market Analysis, Opportunity and Forecast, By Function , 2016-2032
- 8.4.1. Latin America 3d Printing Gases Market Analysis by Function : Introduction
- 8.4.2. Market Size Absolute $ Opportunity Analysis and Forecast, By Function , 2016-2032
- 8.4.3. Insulation
- 8.4.4. Cooling
- 8.4.5. Illumination
- 8.5. Latin America 3d Printing Gases Market Analysis, Opportunity and Forecast, By Technology, 2016-2032
- 8.5.1. Latin America 3d Printing Gases Market Analysis by Technology: Introduction
- 8.5.2. Market Size Absolute $ Opportunity Analysis and Forecast, By Technology, 2016-2032
- 8.5.3. Stereolithography
- 8.5.4. Laser Sintering
- 8.5.5. Poly-Jet
- 8.5.6. Material Jetting
- 8.5.7. Electron Beam Melting
- 8.5.8. Others
- 8.6. Latin America 3d Printing Gases Market Analysis, Opportunity and Forecast, By Storage, 2016-2032
- 8.6.1. Latin America 3d Printing Gases Market Analysis by Storage: Introduction
- 8.6.2. Market Size Absolute $ Opportunity Analysis and Forecast, By Storage, 2016-2032
- 8.6.3. Cylinder & Packaged
- 8.6.4. Merchant Liquid
- 8.6.5. Tonnage
- 8.6.6. Others
- 8.7. Latin America 3d Printing Gases Market Analysis, Opportunity and Forecast, By End-use , 2016-2032
- 8.7.1. Latin America 3d Printing Gases Market Analysis by End-use : Introduction
- 8.7.2. Market Size Absolute $ Opportunity Analysis and Forecast, By End-use , 2016-2032
- 8.7.3. Automotive
- 8.7.4. Aerospace & Defense
- 8.7.5. Consumer Products
- 8.7.6. Healthcare
- 8.7.7. Others
- 8.8. Latin America 3d Printing Gases Market Analysis, Opportunity and Forecast, By Country , 2016-2032
- 8.8.1. Latin America 3d Printing Gases Market Analysis by Country : Introduction
- 8.8.2. Market Size Absolute $ Opportunity Analysis and Forecast, Country , 2016-2032
- 8.8.2.1. Brazil
- 8.8.2.2. Colombia
- 8.8.2.3. Chile
- 8.8.2.4. Argentina
- 8.8.2.5. Costa Rica
- 8.8.2.6. Rest of Latin America
- 9. Middle East & Africa 3d Printing Gases Market Analysis, Opportunity and Forecast, 2016-2032
- 9.1. Middle East & Africa 3d Printing Gases Market Analysis, 2016-2021
- 9.2. Middle East & Africa 3d Printing Gases Market Opportunity and Forecast, 2023-2032
- 9.3. Middle East & Africa 3d Printing Gases Market Analysis, Opportunity and Forecast, By Type, 2016-2032
- 9.3.1. Middle East & Africa 3d Printing Gases Market Analysis by Type: Introduction
- 9.3.2. Market Size Absolute $ Opportunity Analysis and Forecast, By Type, 2016-2032
- 9.3.3. Argon
- 9.3.4. Nitrogen
- 9.3.5. Gas Mixtures
- 9.3.6. Argon Mixtures
- 9.4. Middle East & Africa 3d Printing Gases Market Analysis, Opportunity and Forecast, By Function , 2016-2032
- 9.4.1. Middle East & Africa 3d Printing Gases Market Analysis by Function : Introduction
- 9.4.2. Market Size Absolute $ Opportunity Analysis and Forecast, By Function , 2016-2032
- 9.4.3. Insulation
- 9.4.4. Cooling
- 9.4.5. Illumination
- 9.5. Middle East & Africa 3d Printing Gases Market Analysis, Opportunity and Forecast, By Technology, 2016-2032
- 9.5.1. Middle East & Africa 3d Printing Gases Market Analysis by Technology: Introduction
- 9.5.2. Market Size Absolute $ Opportunity Analysis and Forecast, By Technology, 2016-2032
- 9.5.3. Stereolithography
- 9.5.4. Laser Sintering
- 9.5.5. Poly-Jet
- 9.5.6. Material Jetting
- 9.5.7. Electron Beam Melting
- 9.5.8. Others
- 9.6. Middle East & Africa 3d Printing Gases Market Analysis, Opportunity and Forecast, By Storage, 2016-2032
- 9.6.1. Middle East & Africa 3d Printing Gases Market Analysis by Storage: Introduction
- 9.6.2. Market Size Absolute $ Opportunity Analysis and Forecast, By Storage, 2016-2032
- 9.6.3. Cylinder & Packaged
- 9.6.4. Merchant Liquid
- 9.6.5. Tonnage
- 9.6.6. Others
- 9.7. Middle East & Africa 3d Printing Gases Market Analysis, Opportunity and Forecast, By End-use , 2016-2032
- 9.7.1. Middle East & Africa 3d Printing Gases Market Analysis by End-use : Introduction
- 9.7.2. Market Size Absolute $ Opportunity Analysis and Forecast, By End-use , 2016-2032
- 9.7.3. Automotive
- 9.7.4. Aerospace & Defense
- 9.7.5. Consumer Products
- 9.7.6. Healthcare
- 9.7.7. Others
- 9.8. Middle East & Africa 3d Printing Gases Market Analysis, Opportunity and Forecast, By Country , 2016-2032
- 9.8.1. Middle East & Africa 3d Printing Gases Market Analysis by Country : Introduction
- 9.8.2. Market Size Absolute $ Opportunity Analysis and Forecast, Country , 2016-2032
- 9.8.2.1. Algeria
- 9.8.2.2. Egypt
- 9.8.2.3. Israel
- 9.8.2.4. Kuwait
- 9.8.2.5. Nigeria
- 9.8.2.6. Saudi Arabia
- 9.8.2.7. South Africa
- 9.8.2.8. Turkey
- 9.8.2.9. The UAE
- 9.8.2.10. Rest of MEA
- 10. Global 3d Printing Gases Market Analysis, Opportunity and Forecast, By Region , 2016-2032
- 10.1. Global 3d Printing Gases Market Analysis by Region : Introduction
- 10.2. Market Size Absolute $ Opportunity Analysis and Forecast, By Region , 2016-2032
- 10.2.1. North America
- 10.2.2. Western Europe
- 10.2.3. Eastern Europe
- 10.2.4. APAC
- 10.2.5. Latin America
- 10.2.6. Middle East & Africa
- 11. Global 3d Printing Gases Market Competitive Landscape, Market Share Analysis, and Company Profiles
- 11.1. Market Share Analysis
- 11.2. Company Profiles
- 11.3. Air Liquide
- 11.3.1. Company Overview
- 11.3.2. Financial Highlights
- 11.3.3. Product Portfolio
- 11.3.4. SWOT Analysis
- 11.3.5. Key Strategies and Developments
- 11.4. Air Products and Chemicals, INC.
- 11.4.1. Company Overview
- 11.4.2. Financial Highlights
- 11.4.3. Product Portfolio
- 11.4.4. SWOT Analysis
- 11.4.5. Key Strategies and Developments
- 11.5. Airgas Inc.
- 11.5.1. Company Overview
- 11.5.2. Financial Highlights
- 11.5.3. Product Portfolio
- 11.5.4. SWOT Analysis
- 11.5.5. Key Strategies and Developments
- 11.6. BASF SE
- 11.6.1. Company Overview
- 11.6.2. Financial Highlights
- 11.6.3. Product Portfolio
- 11.6.4. SWOT Analysis
- 11.6.5. Key Strategies and Developments
- 11.7. Iceblick Ltd.
- 11.7.1. Company Overview
- 11.7.2. Financial Highlights
- 11.7.3. Product Portfolio
- 11.7.4. SWOT Analysis
- 11.7.5. Key Strategies and Developments
- 11.8. Iwatani Corporation
- 11.8.1. Company Overview
- 11.8.2. Financial Highlights
- 11.8.3. Product Portfolio
- 11.8.4. SWOT Analysis
- 11.8.5. Key Strategies and Developments
- 11.9. Linde PLC
- 11.9.1. Company Overview
- 11.9.2. Financial Highlights
- 11.9.3. Product Portfolio
- 11.9.4. SWOT Analysis
- 11.9.5. Key Strategies and Developments
- 11.10. Matheson Tri-Gas Inc.
- 11.10.1. Company Overview
- 11.10.2. Financial Highlights
- 11.10.3. Product Portfolio
- 11.10.4. SWOT Analysis
- 11.10.5. Key Strategies and Developments
- 11.11. Messer Group
- 11.11.1. Company Overview
- 11.11.2. Financial Highlights
- 11.11.3. Product Portfolio
- 11.11.4. SWOT Analysis
- 11.11.5. Key Strategies and Developments
- 11.12. Nippon Sanso Holdings Corporation
- 11.12.1. Company Overview
- 11.12.2. Financial Highlights
- 11.12.3. Product Portfolio
- 11.12.4. SWOT Analysis
- 11.12.5. Key Strategies and Developments
- 11.13.1. Company Overview
- 11.13.2. Financial Highlights
- 11.13.3. Product Portfolio
- 11.13.4. SWOT Analysis
- 11.13.5. Key Strategies and Developments
- 11.14. Praxair Inc.
- 11.14.1. Company Overview
- 11.14.2. Financial Highlights
- 11.14.3. Product Portfolio
- 11.14.4. SWOT Analysis
- 11.14.5. Key Strategies and Developments
- 11.15. The Linde Group
- 11.15.1. Company Overview
- 11.15.2. Financial Highlights
- 11.15.3. Product Portfolio
- 11.15.4. SWOT Analysis
- 11.15.5. Key Strategies and Developments
- 11.16. Universal Industrial Gases
- 11.16.1. Company Overview
- 11.16.2. Financial Highlights
- 11.16.3. Product Portfolio
- 11.16.4. SWOT Analysis
- 11.16.5. Key Strategies and Developments
- 12. Assumptions and Acronyms
- 13. Research Methodology
- 14. Contact
"
- List of Figures
- "
- Figure 1: Global 3d Printing Gases Market Revenue (US$ Mn) Market Share by Type in 2022
- Figure 2: Global 3d Printing Gases Market Market Attractiveness Analysis by Type, 2016-2032
- Figure 3: Global 3d Printing Gases Market Revenue (US$ Mn) Market Share by Function in 2022
- Figure 4: Global 3d Printing Gases Market Market Attractiveness Analysis by Function , 2016-2032
- Figure 5: Global 3d Printing Gases Market Revenue (US$ Mn) Market Share by Technologyin 2022
- Figure 6: Global 3d Printing Gases Market Market Attractiveness Analysis by Technology, 2016-2032
- Figure 7: Global 3d Printing Gases Market Revenue (US$ Mn) Market Share by Storagein 2022
- Figure 8: Global 3d Printing Gases Market Market Attractiveness Analysis by Storage, 2016-2032
- Figure 9: Global 3d Printing Gases Market Revenue (US$ Mn) Market Share by End-use in 2022
- Figure 10: Global 3d Printing Gases Market Market Attractiveness Analysis by End-use , 2016-2032
- Figure 11: Global 3d Printing Gases Market Revenue (US$ Mn) Market Share by Region in 2022
- Figure 12: Global 3d Printing Gases Market Market Attractiveness Analysis by Region, 2016-2032
- Figure 13: Global 3d Printing Gases Market Market Revenue (US$ Mn) (2016-2032)
- Figure 14: Global 3d Printing Gases Market Market Revenue (US$ Mn) Comparison by Region (2016-2032)
- Figure 15: Global 3d Printing Gases Market Market Revenue (US$ Mn) Comparison by Type (2016-2032)
- Figure 16: Global 3d Printing Gases Market Market Revenue (US$ Mn) Comparison by Function (2016-2032)
- Figure 17: Global 3d Printing Gases Market Market Revenue (US$ Mn) Comparison by Technology (2016-2032)
- Figure 18: Global 3d Printing Gases Market Market Revenue (US$ Mn) Comparison by Storage (2016-2032)
- Figure 19: Global 3d Printing Gases Market Market Revenue (US$ Mn) Comparison by End-use (2016-2032)
- Figure 20: Global 3d Printing Gases Market Market Y-o-Y Growth Rate Comparison by Region (2016-2032)
- Figure 21: Global 3d Printing Gases Market Market Y-o-Y Growth Rate Comparison by Type (2016-2032)
- Figure 22: Global 3d Printing Gases Market Market Y-o-Y Growth Rate Comparison by Function (2016-2032)
- Figure 23: Global 3d Printing Gases Market Market Y-o-Y Growth Rate Comparison by Technology (2016-2032)
- Figure 24: Global 3d Printing Gases Market Market Y-o-Y Growth Rate Comparison by Storage (2016-2032)
- Figure 25: Global 3d Printing Gases Market Market Y-o-Y Growth Rate Comparison by End-use (2016-2032)
- Figure 26: Global 3d Printing Gases Market Market Share Comparison by Region (2016-2032)
- Figure 27: Global 3d Printing Gases Market Market Share Comparison by Type (2016-2032)
- Figure 28: Global 3d Printing Gases Market Market Share Comparison by Function (2016-2032)
- Figure 29: Global 3d Printing Gases Market Market Share Comparison by Technology (2016-2032)
- Figure 30: Global 3d Printing Gases Market Market Share Comparison by Storage (2016-2032)
- Figure 31: Global 3d Printing Gases Market Market Share Comparison by End-use (2016-2032)
- Figure 32: North America 3d Printing Gases Market Revenue (US$ Mn) Market Share by Typein 2022
- Figure 33: North America 3d Printing Gases Market Market Attractiveness Analysis by Type, 2016-2032
- Figure 34: North America 3d Printing Gases Market Revenue (US$ Mn) Market Share by Function in 2022
- Figure 35: North America 3d Printing Gases Market Market Attractiveness Analysis by Function , 2016-2032
- Figure 36: North America 3d Printing Gases Market Revenue (US$ Mn) Market Share by Technologyin 2022
- Figure 37: North America 3d Printing Gases Market Market Attractiveness Analysis by Technology, 2016-2032
- Figure 38: North America 3d Printing Gases Market Revenue (US$ Mn) Market Share by Storagein 2022
- Figure 39: North America 3d Printing Gases Market Market Attractiveness Analysis by Storage, 2016-2032
- Figure 40: North America 3d Printing Gases Market Revenue (US$ Mn) Market Share by End-use in 2022
- Figure 41: North America 3d Printing Gases Market Market Attractiveness Analysis by End-use , 2016-2032
- Figure 42: North America 3d Printing Gases Market Revenue (US$ Mn) Market Share by Country in 2022
- Figure 43: North America 3d Printing Gases Market Market Attractiveness Analysis by Country, 2016-2032
- Figure 44: North America 3d Printing Gases Market Market Revenue (US$ Mn) (2016-2032)
- Figure 45: North America 3d Printing Gases Market Market Revenue (US$ Mn) Comparison by Country (2016-2032)
- Figure 46: North America 3d Printing Gases Market Market Revenue (US$ Mn) Comparison by Type (2016-2032)
- Figure 47: North America 3d Printing Gases Market Market Revenue (US$ Mn) Comparison by Function (2016-2032)
- Figure 48: North America 3d Printing Gases Market Market Revenue (US$ Mn) Comparison by Technology (2016-2032)
- Figure 49: North America 3d Printing Gases Market Market Revenue (US$ Mn) Comparison by Storage (2016-2032)
- Figure 50: North America 3d Printing Gases Market Market Revenue (US$ Mn) Comparison by End-use (2016-2032)
- Figure 51: North America 3d Printing Gases Market Market Y-o-Y Growth Rate Comparison by Country (2016-2032)
- Figure 52: North America 3d Printing Gases Market Market Y-o-Y Growth Rate Comparison by Type (2016-2032)
- Figure 53: North America 3d Printing Gases Market Market Y-o-Y Growth Rate Comparison by Function (2016-2032)
- Figure 54: North America 3d Printing Gases Market Market Y-o-Y Growth Rate Comparison by Technology (2016-2032)
- Figure 55: North America 3d Printing Gases Market Market Y-o-Y Growth Rate Comparison by Storage (2016-2032)
- Figure 56: North America 3d Printing Gases Market Market Y-o-Y Growth Rate Comparison by End-use (2016-2032)
- Figure 57: North America 3d Printing Gases Market Market Share Comparison by Country (2016-2032)
- Figure 58: North America 3d Printing Gases Market Market Share Comparison by Type (2016-2032)
- Figure 59: North America 3d Printing Gases Market Market Share Comparison by Function (2016-2032)
- Figure 60: North America 3d Printing Gases Market Market Share Comparison by Technology (2016-2032)
- Figure 61: North America 3d Printing Gases Market Market Share Comparison by Storage (2016-2032)
- Figure 62: North America 3d Printing Gases Market Market Share Comparison by End-use (2016-2032)
- Figure 63: Western Europe 3d Printing Gases Market Revenue (US$ Mn) Market Share by Typein 2022
- Figure 64: Western Europe 3d Printing Gases Market Market Attractiveness Analysis by Type, 2016-2032
- Figure 65: Western Europe 3d Printing Gases Market Revenue (US$ Mn) Market Share by Function in 2022
- Figure 66: Western Europe 3d Printing Gases Market Market Attractiveness Analysis by Function , 2016-2032
- Figure 67: Western Europe 3d Printing Gases Market Revenue (US$ Mn) Market Share by Technologyin 2022
- Figure 68: Western Europe 3d Printing Gases Market Market Attractiveness Analysis by Technology, 2016-2032
- Figure 69: Western Europe 3d Printing Gases Market Revenue (US$ Mn) Market Share by Storagein 2022
- Figure 70: Western Europe 3d Printing Gases Market Market Attractiveness Analysis by Storage, 2016-2032
- Figure 71: Western Europe 3d Printing Gases Market Revenue (US$ Mn) Market Share by End-use in 2022
- Figure 72: Western Europe 3d Printing Gases Market Market Attractiveness Analysis by End-use , 2016-2032
- Figure 73: Western Europe 3d Printing Gases Market Revenue (US$ Mn) Market Share by Country in 2022
- Figure 74: Western Europe 3d Printing Gases Market Market Attractiveness Analysis by Country, 2016-2032
- Figure 75: Western Europe 3d Printing Gases Market Market Revenue (US$ Mn) (2016-2032)
- Figure 76: Western Europe 3d Printing Gases Market Market Revenue (US$ Mn) Comparison by Country (2016-2032)
- Figure 77: Western Europe 3d Printing Gases Market Market Revenue (US$ Mn) Comparison by Type (2016-2032)
- Figure 78: Western Europe 3d Printing Gases Market Market Revenue (US$ Mn) Comparison by Function (2016-2032)
- Figure 79: Western Europe 3d Printing Gases Market Market Revenue (US$ Mn) Comparison by Technology (2016-2032)
- Figure 80: Western Europe 3d Printing Gases Market Market Revenue (US$ Mn) Comparison by Storage (2016-2032)
- Figure 81: Western Europe 3d Printing Gases Market Market Revenue (US$ Mn) Comparison by End-use (2016-2032)
- Figure 82: Western Europe 3d Printing Gases Market Market Y-o-Y Growth Rate Comparison by Country (2016-2032)
- Figure 83: Western Europe 3d Printing Gases Market Market Y-o-Y Growth Rate Comparison by Type (2016-2032)
- Figure 84: Western Europe 3d Printing Gases Market Market Y-o-Y Growth Rate Comparison by Function (2016-2032)
- Figure 85: Western Europe 3d Printing Gases Market Market Y-o-Y Growth Rate Comparison by Technology (2016-2032)
- Figure 86: Western Europe 3d Printing Gases Market Market Y-o-Y Growth Rate Comparison by Storage (2016-2032)
- Figure 87: Western Europe 3d Printing Gases Market Market Y-o-Y Growth Rate Comparison by End-use (2016-2032)
- Figure 88: Western Europe 3d Printing Gases Market Market Share Comparison by Country (2016-2032)
- Figure 89: Western Europe 3d Printing Gases Market Market Share Comparison by Type (2016-2032)
- Figure 90: Western Europe 3d Printing Gases Market Market Share Comparison by Function (2016-2032)
- Figure 91: Western Europe 3d Printing Gases Market Market Share Comparison by Technology (2016-2032)
- Figure 92: Western Europe 3d Printing Gases Market Market Share Comparison by Storage (2016-2032)
- Figure 93: Western Europe 3d Printing Gases Market Market Share Comparison by End-use (2016-2032)
- Figure 94: Eastern Europe 3d Printing Gases Market Revenue (US$ Mn) Market Share by Typein 2022
- Figure 95: Eastern Europe 3d Printing Gases Market Market Attractiveness Analysis by Type, 2016-2032
- Figure 96: Eastern Europe 3d Printing Gases Market Revenue (US$ Mn) Market Share by Function in 2022
- Figure 97: Eastern Europe 3d Printing Gases Market Market Attractiveness Analysis by Function , 2016-2032
- Figure 98: Eastern Europe 3d Printing Gases Market Revenue (US$ Mn) Market Share by Technologyin 2022
- Figure 99: Eastern Europe 3d Printing Gases Market Market Attractiveness Analysis by Technology, 2016-2032
- Figure 100: Eastern Europe 3d Printing Gases Market Revenue (US$ Mn) Market Share by Storagein 2022
- Figure 101: Eastern Europe 3d Printing Gases Market Market Attractiveness Analysis by Storage, 2016-2032
- Figure 102: Eastern Europe 3d Printing Gases Market Revenue (US$ Mn) Market Share by End-use in 2022
- Figure 103: Eastern Europe 3d Printing Gases Market Market Attractiveness Analysis by End-use , 2016-2032
- Figure 104: Eastern Europe 3d Printing Gases Market Revenue (US$ Mn) Market Share by Country in 2022
- Figure 105: Eastern Europe 3d Printing Gases Market Market Attractiveness Analysis by Country, 2016-2032
- Figure 106: Eastern Europe 3d Printing Gases Market Market Revenue (US$ Mn) (2016-2032)
- Figure 107: Eastern Europe 3d Printing Gases Market Market Revenue (US$ Mn) Comparison by Country (2016-2032)
- Figure 108: Eastern Europe 3d Printing Gases Market Market Revenue (US$ Mn) Comparison by Type (2016-2032)
- Figure 109: Eastern Europe 3d Printing Gases Market Market Revenue (US$ Mn) Comparison by Function (2016-2032)
- Figure 110: Eastern Europe 3d Printing Gases Market Market Revenue (US$ Mn) Comparison by Technology (2016-2032)
- Figure 111: Eastern Europe 3d Printing Gases Market Market Revenue (US$ Mn) Comparison by Storage (2016-2032)
- Figure 112: Eastern Europe 3d Printing Gases Market Market Revenue (US$ Mn) Comparison by End-use (2016-2032)
- Figure 113: Eastern Europe 3d Printing Gases Market Market Y-o-Y Growth Rate Comparison by Country (2016-2032)
- Figure 114: Eastern Europe 3d Printing Gases Market Market Y-o-Y Growth Rate Comparison by Type (2016-2032)
- Figure 115: Eastern Europe 3d Printing Gases Market Market Y-o-Y Growth Rate Comparison by Function (2016-2032)
- Figure 116: Eastern Europe 3d Printing Gases Market Market Y-o-Y Growth Rate Comparison by Technology (2016-2032)
- Figure 117: Eastern Europe 3d Printing Gases Market Market Y-o-Y Growth Rate Comparison by Storage (2016-2032)
- Figure 118: Eastern Europe 3d Printing Gases Market Market Y-o-Y Growth Rate Comparison by End-use (2016-2032)
- Figure 119: Eastern Europe 3d Printing Gases Market Market Share Comparison by Country (2016-2032)
- Figure 120: Eastern Europe 3d Printing Gases Market Market Share Comparison by Type (2016-2032)
- Figure 121: Eastern Europe 3d Printing Gases Market Market Share Comparison by Function (2016-2032)
- Figure 122: Eastern Europe 3d Printing Gases Market Market Share Comparison by Technology (2016-2032)
- Figure 123: Eastern Europe 3d Printing Gases Market Market Share Comparison by Storage (2016-2032)
- Figure 124: Eastern Europe 3d Printing Gases Market Market Share Comparison by End-use (2016-2032)
- Figure 125: APAC 3d Printing Gases Market Revenue (US$ Mn) Market Share by Typein 2022
- Figure 126: APAC 3d Printing Gases Market Market Attractiveness Analysis by Type, 2016-2032
- Figure 127: APAC 3d Printing Gases Market Revenue (US$ Mn) Market Share by Function in 2022
- Figure 128: APAC 3d Printing Gases Market Market Attractiveness Analysis by Function , 2016-2032
- Figure 129: APAC 3d Printing Gases Market Revenue (US$ Mn) Market Share by Technologyin 2022
- Figure 130: APAC 3d Printing Gases Market Market Attractiveness Analysis by Technology, 2016-2032
- Figure 131: APAC 3d Printing Gases Market Revenue (US$ Mn) Market Share by Storagein 2022
- Figure 132: APAC 3d Printing Gases Market Market Attractiveness Analysis by Storage, 2016-2032
- Figure 133: APAC 3d Printing Gases Market Revenue (US$ Mn) Market Share by End-use in 2022
- Figure 134: APAC 3d Printing Gases Market Market Attractiveness Analysis by End-use , 2016-2032
- Figure 135: APAC 3d Printing Gases Market Revenue (US$ Mn) Market Share by Country in 2022
- Figure 136: APAC 3d Printing Gases Market Market Attractiveness Analysis by Country, 2016-2032
- Figure 137: APAC 3d Printing Gases Market Market Revenue (US$ Mn) (2016-2032)
- Figure 138: APAC 3d Printing Gases Market Market Revenue (US$ Mn) Comparison by Country (2016-2032)
- Figure 139: APAC 3d Printing Gases Market Market Revenue (US$ Mn) Comparison by Type (2016-2032)
- Figure 140: APAC 3d Printing Gases Market Market Revenue (US$ Mn) Comparison by Function (2016-2032)
- Figure 141: APAC 3d Printing Gases Market Market Revenue (US$ Mn) Comparison by Technology (2016-2032)
- Figure 142: APAC 3d Printing Gases Market Market Revenue (US$ Mn) Comparison by Storage (2016-2032)
- Figure 143: APAC 3d Printing Gases Market Market Revenue (US$ Mn) Comparison by End-use (2016-2032)
- Figure 144: APAC 3d Printing Gases Market Market Y-o-Y Growth Rate Comparison by Country (2016-2032)
- Figure 145: APAC 3d Printing Gases Market Market Y-o-Y Growth Rate Comparison by Type (2016-2032)
- Figure 146: APAC 3d Printing Gases Market Market Y-o-Y Growth Rate Comparison by Function (2016-2032)
- Figure 147: APAC 3d Printing Gases Market Market Y-o-Y Growth Rate Comparison by Technology (2016-2032)
- Figure 148: APAC 3d Printing Gases Market Market Y-o-Y Growth Rate Comparison by Storage (2016-2032)
- Figure 149: APAC 3d Printing Gases Market Market Y-o-Y Growth Rate Comparison by End-use (2016-2032)
- Figure 150: APAC 3d Printing Gases Market Market Share Comparison by Country (2016-2032)
- Figure 151: APAC 3d Printing Gases Market Market Share Comparison by Type (2016-2032)
- Figure 152: APAC 3d Printing Gases Market Market Share Comparison by Function (2016-2032)
- Figure 153: APAC 3d Printing Gases Market Market Share Comparison by Technology (2016-2032)
- Figure 154: APAC 3d Printing Gases Market Market Share Comparison by Storage (2016-2032)
- Figure 155: APAC 3d Printing Gases Market Market Share Comparison by End-use (2016-2032)
- Figure 156: Latin America 3d Printing Gases Market Revenue (US$ Mn) Market Share by Typein 2022
- Figure 157: Latin America 3d Printing Gases Market Market Attractiveness Analysis by Type, 2016-2032
- Figure 158: Latin America 3d Printing Gases Market Revenue (US$ Mn) Market Share by Function in 2022
- Figure 159: Latin America 3d Printing Gases Market Market Attractiveness Analysis by Function , 2016-2032
- Figure 160: Latin America 3d Printing Gases Market Revenue (US$ Mn) Market Share by Technologyin 2022
- Figure 161: Latin America 3d Printing Gases Market Market Attractiveness Analysis by Technology, 2016-2032
- Figure 162: Latin America 3d Printing Gases Market Revenue (US$ Mn) Market Share by Storagein 2022
- Figure 163: Latin America 3d Printing Gases Market Market Attractiveness Analysis by Storage, 2016-2032
- Figure 164: Latin America 3d Printing Gases Market Revenue (US$ Mn) Market Share by End-use in 2022
- Figure 165: Latin America 3d Printing Gases Market Market Attractiveness Analysis by End-use , 2016-2032
- Figure 166: Latin America 3d Printing Gases Market Revenue (US$ Mn) Market Share by Country in 2022
- Figure 167: Latin America 3d Printing Gases Market Market Attractiveness Analysis by Country, 2016-2032
- Figure 168: Latin America 3d Printing Gases Market Market Revenue (US$ Mn) (2016-2032)
- Figure 169: Latin America 3d Printing Gases Market Market Revenue (US$ Mn) Comparison by Country (2016-2032)
- Figure 170: Latin America 3d Printing Gases Market Market Revenue (US$ Mn) Comparison by Type (2016-2032)
- Figure 171: Latin America 3d Printing Gases Market Market Revenue (US$ Mn) Comparison by Function (2016-2032)
- Figure 172: Latin America 3d Printing Gases Market Market Revenue (US$ Mn) Comparison by Technology (2016-2032)
- Figure 173: Latin America 3d Printing Gases Market Market Revenue (US$ Mn) Comparison by Storage (2016-2032)
- Figure 174: Latin America 3d Printing Gases Market Market Revenue (US$ Mn) Comparison by End-use (2016-2032)
- Figure 175: Latin America 3d Printing Gases Market Market Y-o-Y Growth Rate Comparison by Country (2016-2032)
- Figure 176: Latin America 3d Printing Gases Market Market Y-o-Y Growth Rate Comparison by Type (2016-2032)
- Figure 177: Latin America 3d Printing Gases Market Market Y-o-Y Growth Rate Comparison by Function (2016-2032)
- Figure 178: Latin America 3d Printing Gases Market Market Y-o-Y Growth Rate Comparison by Technology (2016-2032)
- Figure 179: Latin America 3d Printing Gases Market Market Y-o-Y Growth Rate Comparison by Storage (2016-2032)
- Figure 180: Latin America 3d Printing Gases Market Market Y-o-Y Growth Rate Comparison by End-use (2016-2032)
- Figure 181: Latin America 3d Printing Gases Market Market Share Comparison by Country (2016-2032)
- Figure 182: Latin America 3d Printing Gases Market Market Share Comparison by Type (2016-2032)
- Figure 183: Latin America 3d Printing Gases Market Market Share Comparison by Function (2016-2032)
- Figure 184: Latin America 3d Printing Gases Market Market Share Comparison by Technology (2016-2032)
- Figure 185: Latin America 3d Printing Gases Market Market Share Comparison by Storage (2016-2032)
- Figure 186: Latin America 3d Printing Gases Market Market Share Comparison by End-use (2016-2032)
- Figure 187: Middle East & Africa 3d Printing Gases Market Revenue (US$ Mn) Market Share by Typein 2022
- Figure 188: Middle East & Africa 3d Printing Gases Market Market Attractiveness Analysis by Type, 2016-2032
- Figure 189: Middle East & Africa 3d Printing Gases Market Revenue (US$ Mn) Market Share by Function in 2022
- Figure 190: Middle East & Africa 3d Printing Gases Market Market Attractiveness Analysis by Function , 2016-2032
- Figure 191: Middle East & Africa 3d Printing Gases Market Revenue (US$ Mn) Market Share by Technologyin 2022
- Figure 192: Middle East & Africa 3d Printing Gases Market Market Attractiveness Analysis by Technology, 2016-2032
- Figure 193: Middle East & Africa 3d Printing Gases Market Revenue (US$ Mn) Market Share by Storagein 2022
- Figure 194: Middle East & Africa 3d Printing Gases Market Market Attractiveness Analysis by Storage, 2016-2032
- Figure 195: Middle East & Africa 3d Printing Gases Market Revenue (US$ Mn) Market Share by End-use in 2022
- Figure 196: Middle East & Africa 3d Printing Gases Market Market Attractiveness Analysis by End-use , 2016-2032
- Figure 197: Middle East & Africa 3d Printing Gases Market Revenue (US$ Mn) Market Share by Country in 2022
- Figure 198: Middle East & Africa 3d Printing Gases Market Market Attractiveness Analysis by Country, 2016-2032
- Figure 199: Middle East & Africa 3d Printing Gases Market Market Revenue (US$ Mn) (2016-2032)
- Figure 200: Middle East & Africa 3d Printing Gases Market Market Revenue (US$ Mn) Comparison by Country (2016-2032)
- Figure 201: Middle East & Africa 3d Printing Gases Market Market Revenue (US$ Mn) Comparison by Type (2016-2032)
- Figure 202: Middle East & Africa 3d Printing Gases Market Market Revenue (US$ Mn) Comparison by Function (2016-2032)
- Figure 203: Middle East & Africa 3d Printing Gases Market Market Revenue (US$ Mn) Comparison by Technology (2016-2032)
- Figure 204: Middle East & Africa 3d Printing Gases Market Market Revenue (US$ Mn) Comparison by Storage (2016-2032)
- Figure 205: Middle East & Africa 3d Printing Gases Market Market Revenue (US$ Mn) Comparison by End-use (2016-2032)
- Figure 206: Middle East & Africa 3d Printing Gases Market Market Y-o-Y Growth Rate Comparison by Country (2016-2032)
- Figure 207: Middle East & Africa 3d Printing Gases Market Market Y-o-Y Growth Rate Comparison by Type (2016-2032)
- Figure 208: Middle East & Africa 3d Printing Gases Market Market Y-o-Y Growth Rate Comparison by Function (2016-2032)
- Figure 209: Middle East & Africa 3d Printing Gases Market Market Y-o-Y Growth Rate Comparison by Technology (2016-2032)
- Figure 210: Middle East & Africa 3d Printing Gases Market Market Y-o-Y Growth Rate Comparison by Storage (2016-2032)
- Figure 211: Middle East & Africa 3d Printing Gases Market Market Y-o-Y Growth Rate Comparison by End-use (2016-2032)
- Figure 212: Middle East & Africa 3d Printing Gases Market Market Share Comparison by Country (2016-2032)
- Figure 213: Middle East & Africa 3d Printing Gases Market Market Share Comparison by Type (2016-2032)
- Figure 214: Middle East & Africa 3d Printing Gases Market Market Share Comparison by Function (2016-2032)
- Figure 215: Middle East & Africa 3d Printing Gases Market Market Share Comparison by Technology (2016-2032)
- Figure 216: Middle East & Africa 3d Printing Gases Market Market Share Comparison by Storage (2016-2032)
- Figure 217: Middle East & Africa 3d Printing Gases Market Market Share Comparison by End-use (2016-2032)
"
- List of Tables
- "
- Table 1: Global 3d Printing Gases Market Market Comparison by Type (2016-2032)
- Table 2: Global 3d Printing Gases Market Market Comparison by Function (2016-2032)
- Table 3: Global 3d Printing Gases Market Market Comparison by Technology (2016-2032)
- Table 4: Global 3d Printing Gases Market Market Comparison by Storage (2016-2032)
- Table 5: Global 3d Printing Gases Market Market Comparison by End-use (2016-2032)
- Table 6: Global 3d Printing Gases Market Revenue (US$ Mn) Comparison by Region (2016-2032)
- Table 7: Global 3d Printing Gases Market Market Revenue (US$ Mn) (2016-2032)
- Table 8: Global 3d Printing Gases Market Market Revenue (US$ Mn) Comparison by Region (2016-2032)
- Table 9: Global 3d Printing Gases Market Market Revenue (US$ Mn) Comparison by Type (2016-2032)
- Table 10: Global 3d Printing Gases Market Market Revenue (US$ Mn) Comparison by Function (2016-2032)
- Table 11: Global 3d Printing Gases Market Market Revenue (US$ Mn) Comparison by Technology (2016-2032)
- Table 12: Global 3d Printing Gases Market Market Revenue (US$ Mn) Comparison by Storage (2016-2032)
- Table 13: Global 3d Printing Gases Market Market Revenue (US$ Mn) Comparison by End-use (2016-2032)
- Table 14: Global 3d Printing Gases Market Market Y-o-Y Growth Rate Comparison by Region (2016-2032)
- Table 15: Global 3d Printing Gases Market Market Y-o-Y Growth Rate Comparison by Type (2016-2032)
- Table 16: Global 3d Printing Gases Market Market Y-o-Y Growth Rate Comparison by Function (2016-2032)
- Table 17: Global 3d Printing Gases Market Market Y-o-Y Growth Rate Comparison by Technology (2016-2032)
- Table 18: Global 3d Printing Gases Market Market Y-o-Y Growth Rate Comparison by Storage (2016-2032)
- Table 19: Global 3d Printing Gases Market Market Y-o-Y Growth Rate Comparison by End-use (2016-2032)
- Table 20: Global 3d Printing Gases Market Market Share Comparison by Region (2016-2032)
- Table 21: Global 3d Printing Gases Market Market Share Comparison by Type (2016-2032)
- Table 22: Global 3d Printing Gases Market Market Share Comparison by Function (2016-2032)
- Table 23: Global 3d Printing Gases Market Market Share Comparison by Technology (2016-2032)
- Table 24: Global 3d Printing Gases Market Market Share Comparison by Storage (2016-2032)
- Table 25: Global 3d Printing Gases Market Market Share Comparison by End-use (2016-2032)
- Table 26: North America 3d Printing Gases Market Market Comparison by Function (2016-2032)
- Table 27: North America 3d Printing Gases Market Market Comparison by Technology (2016-2032)
- Table 28: North America 3d Printing Gases Market Market Comparison by Storage (2016-2032)
- Table 29: North America 3d Printing Gases Market Market Comparison by End-use (2016-2032)
- Table 30: North America 3d Printing Gases Market Revenue (US$ Mn) Comparison by Country (2016-2032)
- Table 31: North America 3d Printing Gases Market Market Revenue (US$ Mn) (2016-2032)
- Table 32: North America 3d Printing Gases Market Market Revenue (US$ Mn) Comparison by Country (2016-2032)
- Table 33: North America 3d Printing Gases Market Market Revenue (US$ Mn) Comparison by Type (2016-2032)
- Table 34: North America 3d Printing Gases Market Market Revenue (US$ Mn) Comparison by Function (2016-2032)
- Table 35: North America 3d Printing Gases Market Market Revenue (US$ Mn) Comparison by Technology (2016-2032)
- Table 36: North America 3d Printing Gases Market Market Revenue (US$ Mn) Comparison by Storage (2016-2032)
- Table 37: North America 3d Printing Gases Market Market Revenue (US$ Mn) Comparison by End-use (2016-2032)
- Table 38: North America 3d Printing Gases Market Market Y-o-Y Growth Rate Comparison by Country (2016-2032)
- Table 39: North America 3d Printing Gases Market Market Y-o-Y Growth Rate Comparison by Type (2016-2032)
- Table 40: North America 3d Printing Gases Market Market Y-o-Y Growth Rate Comparison by Function (2016-2032)
- Table 41: North America 3d Printing Gases Market Market Y-o-Y Growth Rate Comparison by Technology (2016-2032)
- Table 42: North America 3d Printing Gases Market Market Y-o-Y Growth Rate Comparison by Storage (2016-2032)
- Table 43: North America 3d Printing Gases Market Market Y-o-Y Growth Rate Comparison by End-use (2016-2032)
- Table 44: North America 3d Printing Gases Market Market Share Comparison by Country (2016-2032)
- Table 45: North America 3d Printing Gases Market Market Share Comparison by Type (2016-2032)
- Table 46: North America 3d Printing Gases Market Market Share Comparison by Function (2016-2032)
- Table 47: North America 3d Printing Gases Market Market Share Comparison by Technology (2016-2032)
- Table 48: North America 3d Printing Gases Market Market Share Comparison by Storage (2016-2032)
- Table 49: North America 3d Printing Gases Market Market Share Comparison by End-use (2016-2032)
- Table 50: Western Europe 3d Printing Gases Market Market Comparison by Type (2016-2032)
- Table 51: Western Europe 3d Printing Gases Market Market Comparison by Function (2016-2032)
- Table 52: Western Europe 3d Printing Gases Market Market Comparison by Technology (2016-2032)
- Table 53: Western Europe 3d Printing Gases Market Market Comparison by Storage (2016-2032)
- Table 54: Western Europe 3d Printing Gases Market Market Comparison by End-use (2016-2032)
- Table 55: Western Europe 3d Printing Gases Market Revenue (US$ Mn) Comparison by Country (2016-2032)
- Table 56: Western Europe 3d Printing Gases Market Market Revenue (US$ Mn) (2016-2032)
- Table 57: Western Europe 3d Printing Gases Market Market Revenue (US$ Mn) Comparison by Country (2016-2032)
- Table 58: Western Europe 3d Printing Gases Market Market Revenue (US$ Mn) Comparison by Type (2016-2032)
- Table 59: Western Europe 3d Printing Gases Market Market Revenue (US$ Mn) Comparison by Function (2016-2032)
- Table 60: Western Europe 3d Printing Gases Market Market Revenue (US$ Mn) Comparison by Technology (2016-2032)
- Table 61: Western Europe 3d Printing Gases Market Market Revenue (US$ Mn) Comparison by Storage (2016-2032)
- Table 62: Western Europe 3d Printing Gases Market Market Revenue (US$ Mn) Comparison by End-use (2016-2032)
- Table 63: Western Europe 3d Printing Gases Market Market Y-o-Y Growth Rate Comparison by Country (2016-2032)
- Table 64: Western Europe 3d Printing Gases Market Market Y-o-Y Growth Rate Comparison by Type (2016-2032)
- Table 65: Western Europe 3d Printing Gases Market Market Y-o-Y Growth Rate Comparison by Function (2016-2032)
- Table 66: Western Europe 3d Printing Gases Market Market Y-o-Y Growth Rate Comparison by Technology (2016-2032)
- Table 67: Western Europe 3d Printing Gases Market Market Y-o-Y Growth Rate Comparison by Storage (2016-2032)
- Table 68: Western Europe 3d Printing Gases Market Market Y-o-Y Growth Rate Comparison by End-use (2016-2032)
- Table 69: Western Europe 3d Printing Gases Market Market Share Comparison by Country (2016-2032)
- Table 70: Western Europe 3d Printing Gases Market Market Share Comparison by Type (2016-2032)
- Table 71: Western Europe 3d Printing Gases Market Market Share Comparison by Function (2016-2032)
- Table 72: Western Europe 3d Printing Gases Market Market Share Comparison by Technology (2016-2032)
- Table 73: Western Europe 3d Printing Gases Market Market Share Comparison by Storage (2016-2032)
- Table 74: Western Europe 3d Printing Gases Market Market Share Comparison by End-use (2016-2032)
- Table 75: Eastern Europe 3d Printing Gases Market Market Comparison by Type (2016-2032)
- Table 76: Eastern Europe 3d Printing Gases Market Market Comparison by Function (2016-2032)
- Table 77: Eastern Europe 3d Printing Gases Market Market Comparison by Technology (2016-2032)
- Table 78: Eastern Europe 3d Printing Gases Market Market Comparison by Storage (2016-2032)
- Table 79: Eastern Europe 3d Printing Gases Market Market Comparison by End-use (2016-2032)
- Table 80: Eastern Europe 3d Printing Gases Market Revenue (US$ Mn) Comparison by Country (2016-2032)
- Table 81: Eastern Europe 3d Printing Gases Market Market Revenue (US$ Mn) (2016-2032)
- Table 82: Eastern Europe 3d Printing Gases Market Market Revenue (US$ Mn) Comparison by Country (2016-2032)
- Table 83: Eastern Europe 3d Printing Gases Market Market Revenue (US$ Mn) Comparison by Type (2016-2032)
- Table 84: Eastern Europe 3d Printing Gases Market Market Revenue (US$ Mn) Comparison by Function (2016-2032)
- Table 85: Eastern Europe 3d Printing Gases Market Market Revenue (US$ Mn) Comparison by Technology (2016-2032)
- Table 86: Eastern Europe 3d Printing Gases Market Market Revenue (US$ Mn) Comparison by Storage (2016-2032)
- Table 87: Eastern Europe 3d Printing Gases Market Market Revenue (US$ Mn) Comparison by End-use (2016-2032)
- Table 88: Eastern Europe 3d Printing Gases Market Market Y-o-Y Growth Rate Comparison by Country (2016-2032)
- Table 89: Eastern Europe 3d Printing Gases Market Market Y-o-Y Growth Rate Comparison by Type (2016-2032)
- Table 90: Eastern Europe 3d Printing Gases Market Market Y-o-Y Growth Rate Comparison by Function (2016-2032)
- Table 91: Eastern Europe 3d Printing Gases Market Market Y-o-Y Growth Rate Comparison by Technology (2016-2032)
- Table 92: Eastern Europe 3d Printing Gases Market Market Y-o-Y Growth Rate Comparison by Storage (2016-2032)
- Table 93: Eastern Europe 3d Printing Gases Market Market Y-o-Y Growth Rate Comparison by End-use (2016-2032)
- Table 94: Eastern Europe 3d Printing Gases Market Market Share Comparison by Country (2016-2032)
- Table 95: Eastern Europe 3d Printing Gases Market Market Share Comparison by Type (2016-2032)
- Table 96: Eastern Europe 3d Printing Gases Market Market Share Comparison by Function (2016-2032)
- Table 97: Eastern Europe 3d Printing Gases Market Market Share Comparison by Technology (2016-2032)
- Table 98: Eastern Europe 3d Printing Gases Market Market Share Comparison by Storage (2016-2032)
- Table 99: Eastern Europe 3d Printing Gases Market Market Share Comparison by End-use (2016-2032)
- Table 100: APAC 3d Printing Gases Market Market Comparison by Type (2016-2032)
- Table 101: APAC 3d Printing Gases Market Market Comparison by Function (2016-2032)
- Table 102: APAC 3d Printing Gases Market Market Comparison by Technology (2016-2032)
- Table 103: APAC 3d Printing Gases Market Market Comparison by Storage (2016-2032)
- Table 104: APAC 3d Printing Gases Market Market Comparison by End-use (2016-2032)
- Table 105: APAC 3d Printing Gases Market Revenue (US$ Mn) Comparison by Country (2016-2032)
- Table 106: APAC 3d Printing Gases Market Market Revenue (US$ Mn) (2016-2032)
- Table 107: APAC 3d Printing Gases Market Market Revenue (US$ Mn) Comparison by Country (2016-2032)
- Table 108: APAC 3d Printing Gases Market Market Revenue (US$ Mn) Comparison by Type (2016-2032)
- Table 109: APAC 3d Printing Gases Market Market Revenue (US$ Mn) Comparison by Function (2016-2032)
- Table 110: APAC 3d Printing Gases Market Market Revenue (US$ Mn) Comparison by Technology (2016-2032)
- Table 111: APAC 3d Printing Gases Market Market Revenue (US$ Mn) Comparison by Storage (2016-2032)
- Table 112: APAC 3d Printing Gases Market Market Revenue (US$ Mn) Comparison by End-use (2016-2032)
- Table 113: APAC 3d Printing Gases Market Market Y-o-Y Growth Rate Comparison by Country (2016-2032)
- Table 114: APAC 3d Printing Gases Market Market Y-o-Y Growth Rate Comparison by Type (2016-2032)
- Table 115: APAC 3d Printing Gases Market Market Y-o-Y Growth Rate Comparison by Function (2016-2032)
- Table 116: APAC 3d Printing Gases Market Market Y-o-Y Growth Rate Comparison by Technology (2016-2032)
- Table 117: APAC 3d Printing Gases Market Market Y-o-Y Growth Rate Comparison by Storage (2016-2032)
- Table 118: APAC 3d Printing Gases Market Market Y-o-Y Growth Rate Comparison by End-use (2016-2032)
- Table 119: APAC 3d Printing Gases Market Market Share Comparison by Country (2016-2032)
- Table 120: APAC 3d Printing Gases Market Market Share Comparison by Type (2016-2032)
- Table 121: APAC 3d Printing Gases Market Market Share Comparison by Function (2016-2032)
- Table 122: APAC 3d Printing Gases Market Market Share Comparison by Technology (2016-2032)
- Table 123: APAC 3d Printing Gases Market Market Share Comparison by Storage (2016-2032)
- Table 124: APAC 3d Printing Gases Market Market Share Comparison by End-use (2016-2032)
- Table 125: Latin America 3d Printing Gases Market Market Comparison by Type (2016-2032)
- Table 126: Latin America 3d Printing Gases Market Market Comparison by Function (2016-2032)
- Table 127: Latin America 3d Printing Gases Market Market Comparison by Technology (2016-2032)
- Table 128: Latin America 3d Printing Gases Market Market Comparison by Storage (2016-2032)
- Table 129: Latin America 3d Printing Gases Market Market Comparison by End-use (2016-2032)
- Table 130: Latin America 3d Printing Gases Market Revenue (US$ Mn) Comparison by Country (2016-2032)
- Table 131: Latin America 3d Printing Gases Market Market Revenue (US$ Mn) (2016-2032)
- Table 132: Latin America 3d Printing Gases Market Market Revenue (US$ Mn) Comparison by Country (2016-2032)
- Table 133: Latin America 3d Printing Gases Market Market Revenue (US$ Mn) Comparison by Type (2016-2032)
- Table 134: Latin America 3d Printing Gases Market Market Revenue (US$ Mn) Comparison by Function (2016-2032)
- Table 135: Latin America 3d Printing Gases Market Market Revenue (US$ Mn) Comparison by Technology (2016-2032)
- Table 136: Latin America 3d Printing Gases Market Market Revenue (US$ Mn) Comparison by Storage (2016-2032)
- Table 137: Latin America 3d Printing Gases Market Market Revenue (US$ Mn) Comparison by End-use (2016-2032)
- Table 138: Latin America 3d Printing Gases Market Market Y-o-Y Growth Rate Comparison by Country (2016-2032)
- Table 139: Latin America 3d Printing Gases Market Market Y-o-Y Growth Rate Comparison by Type (2016-2032)
- Table 140: Latin America 3d Printing Gases Market Market Y-o-Y Growth Rate Comparison by Function (2016-2032)
- Table 141: Latin America 3d Printing Gases Market Market Y-o-Y Growth Rate Comparison by Technology (2016-2032)
- Table 142: Latin America 3d Printing Gases Market Market Y-o-Y Growth Rate Comparison by Storage (2016-2032)
- Table 143: Latin America 3d Printing Gases Market Market Y-o-Y Growth Rate Comparison by End-use (2016-2032)
- Table 144: Latin America 3d Printing Gases Market Market Share Comparison by Country (2016-2032)
- Table 145: Latin America 3d Printing Gases Market Market Share Comparison by Type (2016-2032)
- Table 146: Latin America 3d Printing Gases Market Market Share Comparison by Function (2016-2032)
- Table 147: Latin America 3d Printing Gases Market Market Share Comparison by Technology (2016-2032)
- Table 148: Latin America 3d Printing Gases Market Market Share Comparison by Storage (2016-2032)
- Table 149: Latin America 3d Printing Gases Market Market Share Comparison by End-use (2016-2032)
- Table 150: Middle East & Africa 3d Printing Gases Market Market Comparison by Type (2016-2032)
- Table 151: Middle East & Africa 3d Printing Gases Market Market Comparison by Function (2016-2032)
- Table 152: Middle East & Africa 3d Printing Gases Market Market Comparison by Technology (2016-2032)
- Table 153: Middle East & Africa 3d Printing Gases Market Market Comparison by Storage (2016-2032)
- Table 154: Middle East & Africa 3d Printing Gases Market Market Comparison by End-use (2016-2032)
- Table 155: Middle East & Africa 3d Printing Gases Market Revenue (US$ Mn) Comparison by Country (2016-2032)
- Table 156: Middle East & Africa 3d Printing Gases Market Market Revenue (US$ Mn) (2016-2032)
- Table 157: Middle East & Africa 3d Printing Gases Market Market Revenue (US$ Mn) Comparison by Country (2016-2032)
- Table 158: Middle East & Africa 3d Printing Gases Market Market Revenue (US$ Mn) Comparison by Type (2016-2032)
- Table 159: Middle East & Africa 3d Printing Gases Market Market Revenue (US$ Mn) Comparison by Function (2016-2032)
- Table 160: Middle East & Africa 3d Printing Gases Market Market Revenue (US$ Mn) Comparison by Technology (2016-2032)
- Table 161: Middle East & Africa 3d Printing Gases Market Market Revenue (US$ Mn) Comparison by Storage (2016-2032)
- Table 162: Middle East & Africa 3d Printing Gases Market Market Revenue (US$ Mn) Comparison by End-use (2016-2032)
- Table 163: Middle East & Africa 3d Printing Gases Market Market Y-o-Y Growth Rate Comparison by Country (2016-2032)
- Table 164: Middle East & Africa 3d Printing Gases Market Market Y-o-Y Growth Rate Comparison by Type (2016-2032)
- Table 165: Middle East & Africa 3d Printing Gases Market Market Y-o-Y Growth Rate Comparison by Function (2016-2032)
- Table 166: Middle East & Africa 3d Printing Gases Market Market Y-o-Y Growth Rate Comparison by Technology (2016-2032)
- Table 167: Middle East & Africa 3d Printing Gases Market Market Y-o-Y Growth Rate Comparison by Storage (2016-2032)
- Table 168: Middle East & Africa 3d Printing Gases Market Market Y-o-Y Growth Rate Comparison by End-use (2016-2032)
- Table 169: Middle East & Africa 3d Printing Gases Market Market Share Comparison by Country (2016-2032)
- Table 170: Middle East & Africa 3d Printing Gases Market Market Share Comparison by Type (2016-2032)
- Table 171: Middle East & Africa 3d Printing Gases Market Market Share Comparison by Function (2016-2032)
- Table 172: Middle East & Africa 3d Printing Gases Market Market Share Comparison by Technology (2016-2032)
- Table 173: Middle East & Africa 3d Printing Gases Market Market Share Comparison by Storage (2016-2032)
- Table 174: Middle East & Africa 3d Printing Gases Market Market Share Comparison by End-use (2016-2032)
- 1. Executive Summary
-
- Air Liquide
- Air Products and Chemicals, INC.
- Airgas Inc.
- BASF SE
- Iceblick Ltd.
- Iwatani Corporation
- Linde PLC
- Matheson Tri-Gas Inc.
- Messer Group
- Nippon Sanso Holdings Corporation
- Praxair Inc.
- SOL Group
- The Linde Group
- Universal Industrial Gases
Our Clients


View Our Licence Options
