
Wireline Services Market By Wireline Type (Electric line and Slickline), By Service (Completion, Well Intervention, Logging), By Hole Type (Cased-Hole and Open Hole), By Location (Onshore and Offshore), By Region And Companies - Industry Segment Outlook, Market Assessment, Competition Scenario, Trends, And Forecast 2024-2033
-
48240
-
June 2024
-
300
-


-
This report was compiled by Shreyas Rokade Shreyas Rokade is a seasoned Research Analyst with CMFE, bringing extensive expertise in market research and consulting, with a strong background in Chemical Engineering. Correspondence Team Lead-CMFE Linkedin | Detailed Market research Methodology Our methodology involves a mix of primary research, including interviews with leading mental health experts, and secondary research from reputable medical journals and databases. View Detailed Methodology Page
-
Quick Navigation
Report Overview
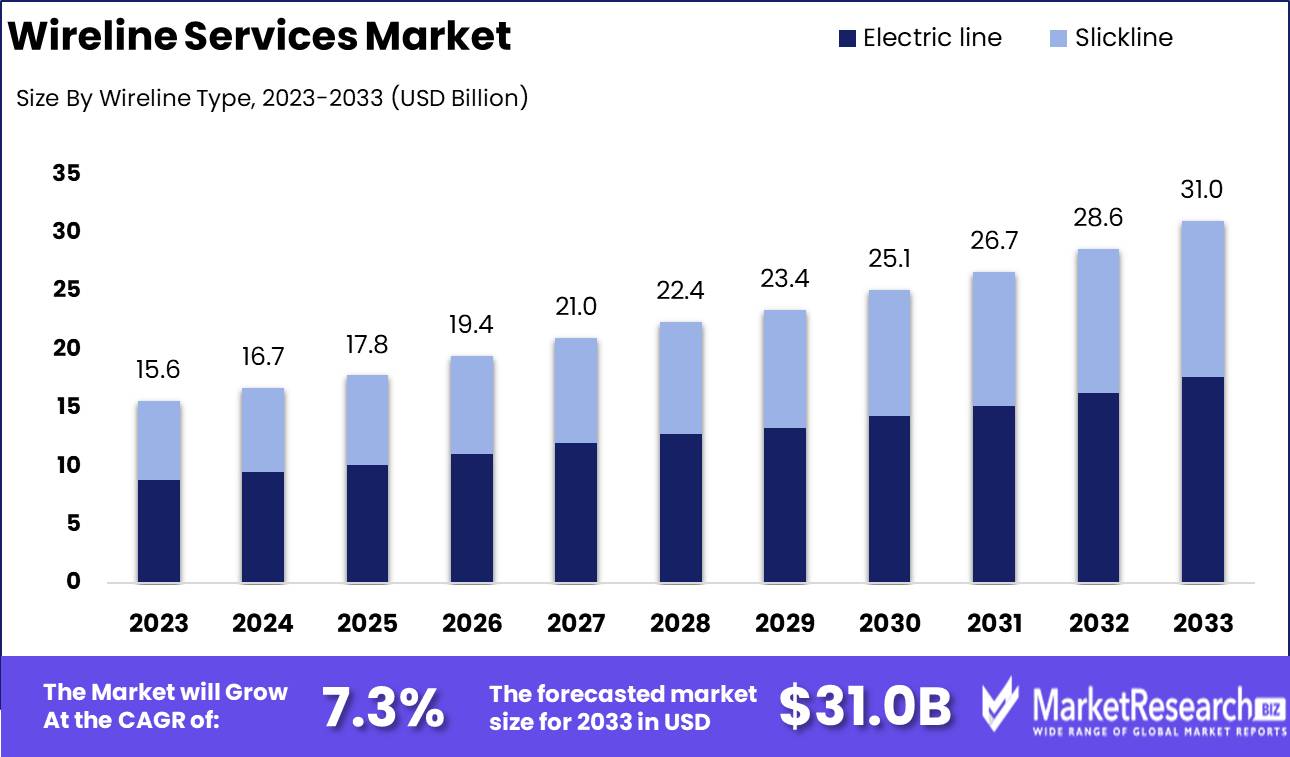
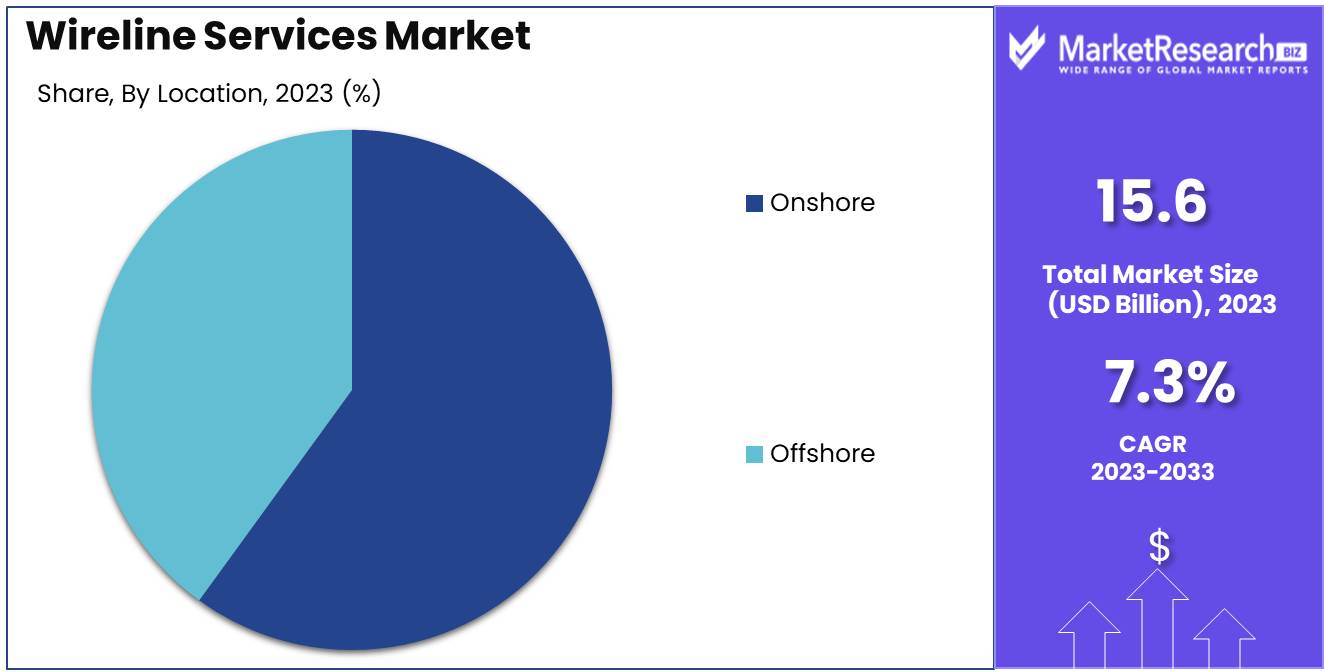
The Wireline Services Market was valued at USD 15.6 billion in 2023. It is expected to reach USD 31.0 billion by 2033, with a CAGR of 7.3% during the forecast period from 2024 to 2033.
The Wireline Services Market encompasses a range of services essential for oil and gas exploration, well intervention, and maintenance operations. These services involve deploying a wireline, a cable that transmits data from downhole sensors to the surface, facilitating tasks such as logging, perforation, pipe recovery, and reservoir evaluation. Driven by advancements in technology, the market is crucial for enhancing operational efficiency, ensuring safety, and optimizing resource extraction. Key players invest in innovative solutions to meet the growing demand for energy and the need for precise data acquisition and real-time decision-making in complex subsurface environments.
The Wireline Services Market is poised for significant growth, driven by several converging factors. The rising global demand for energy has spurred increased oil and gas exploration activities, necessitating advanced wireline services to enhance extraction efficiency and accuracy. Technological advancements in wireline tools, such as improved logging and perforation capabilities, are significantly contributing to this sector's evolution. These innovations not only optimize operational performance but also reduce non-productive time, thereby lowering overall costs.
However, the market faces challenges, particularly the volatility in oil prices, which can lead to fluctuating investment levels in exploration and production. Companies are often forced to recalibrate their strategies based on the prevailing oil price environment, impacting the demand for wireline services.
Moreover, the industry is witnessing a transformative shift with the increased adoption of digital technologies and real-time data analysis. These advancements are revolutionizing wireline operations by providing deeper insights into reservoir conditions and enabling more informed decision-making. For instance, real-time data analytics facilitate immediate adjustments to drilling and extraction processes, enhancing overall productivity and safety. As the industry moves towards greater digital integration, wireline service providers that leverage these technologies will likely gain a competitive edge. In conclusion, while the Wireline Services Market is set to benefit from growing energy demands and technological innovations, stakeholders must navigate the challenges posed by oil price volatility and continuously adapt to the evolving digital landscape to sustain growth and profitability.
Key Takeaways
- Market Growth: The Wireline Services Market was valued at USD 15.6 billion in 2023. It is expected to reach USD 31.0 billion by 2033, with a CAGR of 7.3% during the forecast period from 2024 to 2033.
- By Wireline Type: Electric line Segmentdominated due to advanced real-time data capabilities.
- By Service: Completion dominated the Wireline Services Market by enhancing productivity.
- By Hole Type: Cased-hole Segmentdominated due to extensive use in mature oilfields.
- By Location: Onshore wireline services dominated due to cost and efficiency.
- Regional Dominance: North America leads the wireline services market at 35% due to robust exploration.
- Growth Opportunity: The global wireline services market is set to grow significantly, driven by a focus on operational efficiency and the expansion of deepwater exploration.
Driving factors
Rising Global Demand for Oil and Gas Products Drives Wireline Services Market
The global demand for oil and gas products is a critical driver of the wireline services market. As the world's energy needs continue to expand, driven by industrial growth and urbanization, the necessity for efficient extraction techniques becomes more pronounced. This growing demand propels the need for advanced wireline services, which are essential for optimizing production and ensuring the efficient extraction of hydrocarbons. Wireline services, including logging, perforation, and intervention, are integral to maintaining the productivity and safety of oil and gas operations. This rising demand for energy resources ensures a consistent need for these specialized services, thereby driving market growth.
Increasing Investments in Exploration and Production Activities Enhance Market Potential
Significant investments in exploration and production (E&P) activities are bolstering the wireline services market. As oil and gas companies allocate more capital to discovering new reserves and enhancing existing ones, the demand for wireline services intensifies. These investments are crucial for sustaining the global energy supply and addressing depleting reserves. Wireline services play a pivotal role in exploration by providing crucial data on geological formations and reservoir characteristics, enabling informed decision-making. Moreover, in production phases, wireline interventions are vital for well completion and maintenance, enhancing overall efficiency and output. The uptick in E&P investments directly correlates with increased utilization of wireline services, driving market expansion.
Enhancing Production from Aged Wells: A Catalyst for Market Growth
Improving production from aged wells is a significant contributor to the wireline services market growth. Mature wells, which have been producing for years, often experience a decline in output. To counter this, advanced wireline techniques are employed to rejuvenate production. This includes well intervention services such as re-perforation, water shutoff, and zonal isolation, which are designed to enhance the flow of hydrocarbons and extend the life of the well. This highlights the importance of wireline services in maintaining and boosting production from these aging assets. As operators seek to maximize returns from existing infrastructure, the demand for effective wireline solutions increases, driving market growth.
Restraining Factors
Increasing Adoption of Alternative Technologies: Diversifying Market Preferences
The rapid advancement and adoption of alternative technologies, such as wireless communication and fiber-optic networks, present a significant restraining factor for the growth of the wireline services market. These technologies offer several advantages over traditional wireline services, including higher data transmission speeds, lower latency, and enhanced reliability. For instance, the global fiber-optic network market is projected to grow at a CAGR of 8.5% from 2021 to 2026, reflecting a robust shift towards these newer technologies.
Moreover, the proliferation of 5G technology is further accelerating this trend. With the global 5G services market expected to reach $664.75 billion by 2028, the reliance on wireless communication infrastructures is markedly increasing. This shift diverts investments and consumer preference away from wireline services, challenging the market's growth prospects. Additionally, the integration of IoT devices and smart technologies, which often leverage wireless and fiber-optic networks, underscores the growing preference for these alternatives.
Stringent Environmental Regulations: Compliance Costs and Operational Constraints
Stringent environmental regulations pose another critical challenge to the wireline services market. Governments and regulatory bodies worldwide are enforcing stricter environmental standards to reduce the carbon footprint and environmental impact of various industries, including telecommunications. For example, the European Union's stringent regulations on electronic waste and carbon emissions necessitate significant compliance measures from wireline service providers.
These regulations often result in increased operational costs due to the need for eco-friendly materials, advanced waste management systems, and the implementation of sustainable practices. The necessity to upgrade existing infrastructure to meet environmental standards further exacerbates these costs. A report indicates that the telecommunications sector's energy consumption is growing by approximately 5% annually, emphasizing the need for more sustainable operations. Compliance with these regulations not only incurs direct financial costs but also diverts resources away from innovation and expansion efforts, thereby restraining market growth.
By Wireline Type Analysis
In 2023, The Electric line Segment dominated due to advanced real-time data capabilities.
In 2023, The Electric line held a dominant market position in the By Wireline Type segment of the Wireline Services Market. Electric lines, which incorporate electrical conductors within the wireline, are essential for real-time data acquisition and well-logging. They enable operators to conduct complex downhole operations such as perforation and production logging with high precision. The ability to transmit data instantaneously enhances decision-making, optimizing drilling and production processes. Consequently, the growing demand for advanced well intervention and reservoir evaluation technologies has fueled the adoption of electric lines, positioning them as the preferred choice among service providers and operators alike.
Conversely, slackline, consisting of a single strand of non-electrical wire, is utilized for simpler tasks such as setting or retrieving wellbore equipment and gauges. While it remains a critical component for maintenance and basic intervention activities due to its cost-effectiveness and operational simplicity, it lacks the advanced data transmission capabilities of electric lines. As the industry increasingly leans towards digitalization and real-time analytics, the preference for electric lines has surged, driving significant market share in the wireline services sector. This shift underscores the industry's focus on enhancing operational efficiency and well productivity through technological advancements.
By Service Analysis
In 2023, Completion dominated the Wireline Services Market by enhancing productivity.
In 2023, Completion held a dominant market position in the By Service segment of the Wireline Services Market. Completion services, critical for enhancing productivity and ensuring operational efficiency, witnessed robust demand. The sector's growth was driven by the increasing complexity of well designs and the necessity for precise and efficient well completions to maximize extraction rates. Technological advancements in hydraulic fracturing and multistage completions further propelled the market, making Completion services indispensable for modern oil and gas operations.
Well, Intervention services also saw substantial activity, driven by the need for maintaining and optimizing existing wells. These services, encompassing both planned and corrective maintenance, are vital for extending well life and enhancing production efficiency. Innovations in intervention techniques and tools, such as coiled tubing and snubbing units, facilitated safer and more cost-effective operations, bolstering market growth.
Logging services, essential for obtaining subsurface data and informing drilling decisions, continued to be a cornerstone of the Wireline Services Market. The rise in exploratory activities and the demand for high-resolution downhole data propelled advancements in logging technology, such as real-time data transmission and advanced imaging techniques, ensuring informed decision-making and operational efficiency.
By Hole Type Analysis
In 2023, The Cased-Hole Segment dominated due to extensive use in mature oilfields.
In 2023, Cased-Hole held a dominant market position in the By-Hole Type segment of the Wireline Services Market.This segment's supremacy is attributed to the extensive use of cased-hole services in mature oilfields, where well integrity and detailed reservoir analysis are paramount. Cased-hole logging is essential for providing accurate data on the production capabilities of wells that have already been completed. The technology allows for effective monitoring and maintenance, which is critical for enhancing oil recovery rates and extending the lifespan of wells. As a result, cased-hole services continue to see robust demand, particularly in regions with extensive existing oilfield infrastructure.
In contrast, the Open Hole segment, though significant, represents a smaller portion of the market. Open-hole wireline services are primarily utilized during the initial drilling phase, offering detailed geological data before the well is cased. While essential for identifying potential reserves and planning efficient extraction methods, the use of open-hole services is generally confined to new exploration activities. Given the current focus on maximizing output from existing wells, the market demand for open-hole services remains comparatively lower, yet vital for the strategic expansion of oilfield operations.
By Location Analysis
In 2023, Onshore wireline services dominated due to cost and efficiency.
In 2023, The Onshore segment held a dominant market position in the by-location segment of the Wireline Services Market. The robust performance of onshore wireline services can be attributed to several key factors. Firstly, onshore operations typically offer lower costs and reduced logistical complexities compared to offshore projects, making them more attractive to operators aiming to optimize expenditures amidst fluctuating oil prices. Additionally, the resurgence of shale gas exploration in regions such as North America has significantly bolstered onshore wireline service demand. Enhanced recovery techniques and the necessity for precise reservoir monitoring have further driven the adoption of these services on land-based rigs.
Conversely, the Offshore segment, while smaller, remains a critical component of the market. Offshore wireline services are indispensable for deepwater and ultra-deepwater drilling activities, where the stakes are higher, and the technological requirements are more advanced. Innovations in subsea technology and the discovery of new offshore reserves, particularly in regions like Brazil and West Africa, are expected to fuel future growth. Despite higher operational costs and challenges associated with harsh environments, offshore wireline services continue to be pivotal in maximizing hydrocarbon extraction and ensuring the efficient operation of offshore platforms.
Key Market Segments
By Wireline Type
- Electric line
- Slickline
By Service
- Completion
- Well Intervention
- Logging
By Hole Type
- Cased-Hole
- Open Hole
By Location
- Onshore
- Offshore
Growth Opportunity
Increasing Focus on Operational Efficiency
The global wireline services market is poised for significant growth, driven by an increasing focus on operational efficiency within the oil and gas industry. Companies are investing heavily in advanced wireline technologies to optimize their drilling and production processes. The integration of real-time data analytics and automation in wireline services enhances decision-making capabilities, leading to improved resource management and cost reduction. This trend is expected to accelerate as companies seek to maximize output and maintain profitability in a competitive market. Moreover, the adoption of digital oilfield technologies, including predictive maintenance and remote monitoring, further underscores the emphasis on operational efficiency. By minimizing downtime and optimizing asset performance, these advancements present a substantial growth opportunity for wireline service providers.
Expansion of Deepwater and Ultra-Deepwater Exploration
The expansion of deepwater and ultra-deepwater exploration activities represents another key growth driver for the wireline services market. With the depletion of easily accessible onshore reserves, major oil and gas companies are turning to offshore fields to meet global energy demands. This shift necessitates advanced wireline services capable of operating in challenging deepwater environments. These include logging, perforation, and well intervention, which are crucial for efficient exploration and production in deepwater settings. As a result, wireline service providers with expertise in these areas are well-positioned to capitalize on the growing offshore exploration market.
Latest Trends
Adoption of Digital Technologies
The wireline services market is set to experience significant transformation driven by the adoption of digital technologies. Companies are increasingly leveraging data analytics, artificial intelligence (AI), and the Internet of Things (IoT) to enhance operational efficiency and decision-making. Digital technologies enable real-time monitoring and predictive maintenance, which reduce downtime and operational costs. This shift is not only improving the accuracy of wireline operations but also enhancing safety protocols by enabling remote monitoring and automation. The integration of digital platforms facilitates seamless communication between field operations and central control units, streamlining workflows and improving response times. As the industry continues to prioritize digitalization, service providers who invest in these technologies are expected to gain a competitive edge through enhanced service delivery and cost efficiency.
Advancements in Wireline Tools and Equipment
Parallel to the digital transformation, advancements in wireline tools and equipment are poised to play a critical role in shaping the market. Innovations in logging tools, including high-resolution imaging and advanced telemetry systems, are providing more accurate and comprehensive subsurface data. These advancements are crucial for improving the precision of well interventions and diagnostics.
Additionally, the development of more durable and efficient equipment is extending the lifecycle of wireline tools, thereby reducing operational costs and environmental impact. Enhanced tools such as fiber optic-based technologies are offering superior data transmission capabilities, further bolstering the effectiveness of wireline services. Companies that prioritize R&D in wireline equipment are likely to lead the market by offering more reliable and advanced solutions that meet the evolving demands of the oil and gas sector.
Regional Analysis
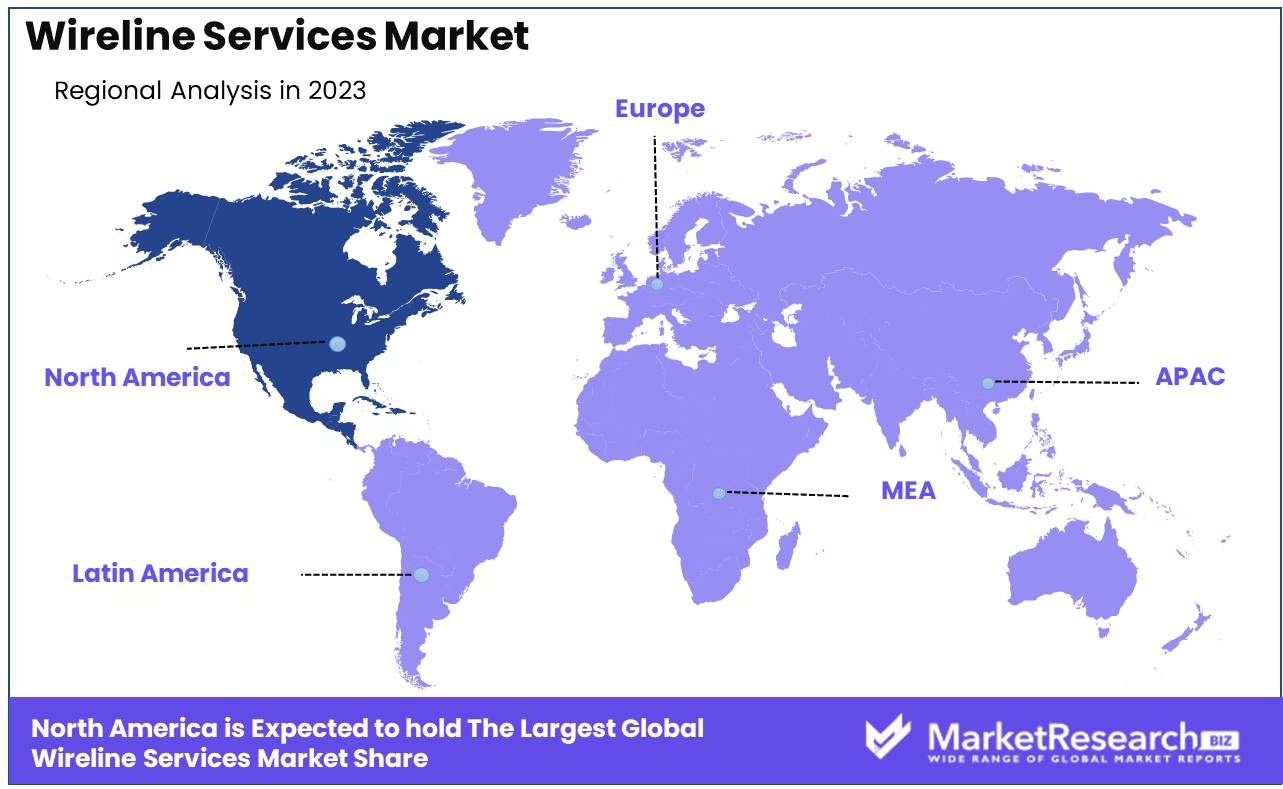
North America leads the wireline services market at 35% due to robust exploration.
The wireline services market demonstrates significant regional variances, shaped by distinct factors in North America, Europe, Asia Pacific, the Middle East & Africa, and Latin America. North America dominates the global wireline services market, accounting for 35% of the largest market share. This dominance is driven by extensive oil and gas exploration activities, particularly in the United States and Canada. The U.S. alone witnessed a surge in rig counts by 15% in 2023, boosting demand for wireline services.
Europe, contributing around 25% to the market, benefits from ongoing investments in offshore drilling in the North Sea and technological advancements in wireline logging and perforation services. In the Asia Pacific region, which holds roughly 20% of the market share, rapid industrialization and energy demands in China and India are pivotal. China's aggressive shale gas exploration, with an annual increase of 8% in drilling activities, underscores the region’s growth.
The Middle East & Africa, contributing 15%, relies heavily on substantial oil reserves in Saudi Arabia and UAE, coupled with modernization of extraction technologies. Latin America, with a 5% market share, is propelled by Brazil’s offshore pre-salt oil discoveries, which are expected to bolster the regional market through strategic investments in wireline services.
Key Regions and Countries
North America
- The US
- Canada
- Rest of North America
Europe
- Germany
- France
- The UK
- Spain
- Netherlands
- Russia
- Italy
- Rest of Europe
Asia-Pacific
- China
- Japan
- Singapore
- Thailand
- South Korea
- Vietnam
- India
- New Zealand
- Rest of Asia Pacific
Latin America
- Mexico
- Brazil
- Rest of Latin America
Middle East & Africa
- Saudi Arabia
- South Africa
- UAE
- Rest of the Middle East & Africa
Key Players Analysis
The global wireline services market in 2024 is set to be highly competitive, with several key players poised to leverage their technological advancements and extensive industry experience to capture market share.
Baker Hughes Company, Halliburton Company, and Schlumberger Limited continue to dominate the U.S. market, driven by their robust portfolios and innovative wireline technologies. These companies are expected to focus on integrating digital solutions to enhance operational efficiency and data acquisition capabilities, thereby solidifying their market leadership.
Weatherford International Plc and Superior Energy Services, Inc. are likely to leverage their specialized services and broad geographic presence to target niche segments within the wireline services sector. Their emphasis on customized solutions tailored to specific client needs will be crucial in maintaining their competitive edge.
Weir Oil And Gas and Archer Limited in the U.K., along with Siemens and Schneider Electric in Europe, are anticipated to benefit from the increasing adoption of automation and IoT technologies in wireline operations. Their strong engineering expertise and focus on sustainability align well with the industry's shift toward more efficient and environmentally friendly practices.
National Oilwell Varco, Emerson, and FMC Technologies Inc. are expected to drive growth through strategic partnerships and acquisitions, enhancing their service capabilities and expanding their global footprint.
Additionally, companies like Petrofac and Cased Hole Solutions are positioned to capitalize on emerging opportunities in offshore exploration and production activities, particularly in regions like the North Sea and the Gulf of Mexico.
Overall, the wireline services market in 2024 will witness significant advancements driven by technological innovation, strategic collaborations, and a growing emphasis on sustainable practices, with these key players at the forefront of industry transformation.
Market Key Players
- Baker Hughes Company(U.S.)
- Nabors Industries Ltd. (U.S.)
- Halliburton Company (U.S.)
- Weatherford International Plc (U.S.)
- Weir Oil And Gas (U.K.)
- Pioneer Energy Services Corp.(U.S.)
- National Oilwell Varco (U.S.)
- FMC Technologies Inc. (U.S.)
- Emerson (U.S.)
- Siemens (Germany)
- Schneider Electric (France)
- Petrofac (Jersey)
- Archer Limited(U.K.)
- Superior Energy Services, Inc (U.S.)
- Schlumberger Limited (U.S.)
- Cased Hole Solutions (U.S.)
- Weltec (Denmark)
Recent Development
- In March 2024, Halliburton introduced a new wireline logging technology designed to improve data accuracy and operational efficiency in challenging environments.
- In February 2024, INT joined the SLB Digital Platform Partner Program, integrating its IVAAP advanced data visualization platform with Schlumberger's DELFI digital E&P platform to enhance subsurface data management.
- In January 2024, GE Gas Power acquired Nexus Controls from Baker Hughes, emphasizing its lifecycle controls strategy to optimize operations in modern power plants.
Report Scope
Report Features Description Market Value (2023) USD 15.6 Billion Forecast Revenue (2033) USD 31.0 Billion CAGR (2024-2032) 7.3% Base Year for Estimation 2023 Historic Period 2016-2023 Forecast Period 2024-2033 Report Coverage Revenue Forecast, Market Dynamics, COVID-19 Impact, Competitive Landscape, Recent Developments Segments Covered By Wireline Type (Electric line and Slickline), By Service (Completion, Well Intervention, Logging), By Hole Type (Cased-Hole and Open Hole), By Location (Onshore and Offshore) Regional Analysis North America - The US, Canada, Rest of North America, Europe - Germany, France, The UK, Spain, Italy, Russia, Netherlands, Rest of Europe, Asia-Pacific - China, Japan, South Korea, India, New Zealand, Singapore, Thailand, Vietnam, Rest of Asia Pacific, Latin America - Brazil, Mexico, Rest of Latin America, Middle East & Africa - South Africa, Saudi Arabia, UAE, Rest of Middle East & Africa Competitive Landscape Baker Hughes Company(U.S.), Nabors Industries Ltd. (U.S.), Halliburton Company (U.S.), Weatherford International Plc (U.S.), Weir Oil And Gas (U.K.), Pioneer Energy Services Corp.(U.S.), National Oilwell Varco (U.S.), FMC Technologies Inc. (U.S.), Emerson (U.S.), Siemens (Germany), Schneider Electric (France), Petrofac (Jersey), Archer Limited(U.K.), Superior Energy Services, Inc. (U.S.), Schlumberger Limited (U.S.), Cased Hole Solutions (U.S.), Weltec (Denmark) Customization Scope Customization for segments, region/country-level will be provided. Moreover, additional customization can be done based on the requirements. Purchase Options We have three licenses to opt for Single User License, Multi-User License (Up to 5 Users), Corporate Use License (Unlimited User and Printable PDF) -
- 1. Executive Summary
- 1.1. Definition
- 1.2. Taxonomy
- 1.3. Research Scope
- 1.4. Key Analysis
- 1.5. Key Findings by Major Segments
- 1.6. Top strategies by Major Players
- 2. Global Wireline Services Market Overview
- 2.1. Wireline Services Market Dynamics
- 2.1.1. Drivers
- 2.1.2. Opportunities
- 2.1.3. Restraints
- 2.1.4. Challenges
- 2.2. Macro-economic Factors
- 2.3. Regulatory Framework
- 2.4. Market Investment Feasibility Index
- 2.5. PEST Analysis
- 2.6. PORTER’S Five Force Analysis
- 2.7. Drivers & Restraints Impact Analysis
- 2.8. Industry Chain Analysis
- 2.9. Cost Structure Analysis
- 2.10. Marketing Strategy
- 2.11. Russia-Ukraine War Impact Analysis
- 2.12. Opportunity Map Analysis
- 2.13. Market Competition Scenario Analysis
- 2.14. Product Life Cycle Analysis
- 2.15. Opportunity Orbits
- 2.16. Manufacturer Intensity Map
- 2.17. Major Companies sales by Value & Volume
- 2.1. Wireline Services Market Dynamics
- 3. Global Wireline Services Market Analysis, Opportunity and Forecast, 2016-2032
- 3.1. Global Wireline Services Market Analysis, 2016-2021
- 3.2. Global Wireline Services Market Opportunity and Forecast, 2023-2032
- 3.3. Global Wireline Services Market Analysis, Opportunity and Forecast, By Wireline Type, 2016-2032
- 3.3.1. Global Wireline Services Market Analysis by Wireline Type: Introduction
- 3.3.2. Market Size Absolute $ Opportunity Analysis and Forecast, By Wireline Type, 2016-2032
- 3.3.3. Electric line
- 3.3.4. Slickline
- 3.4. Global Wireline Services Market Analysis, Opportunity and Forecast, By Service, 2016-2032
- 3.4.1. Global Wireline Services Market Analysis by Service: Introduction
- 3.4.2. Market Size Absolute $ Opportunity Analysis and Forecast, By Service, 2016-2032
- 3.4.3. Completion
- 3.4.4. Well Intervention
- 3.4.5. Logging
- 3.5. Global Wireline Services Market Analysis, Opportunity and Forecast, By Hole Type, 2016-2032
- 3.5.1. Global Wireline Services Market Analysis by Hole Type: Introduction
- 3.5.2. Market Size Absolute $ Opportunity Analysis and Forecast, By Hole Type, 2016-2032
- 3.5.3. Cased-Hole
- 3.5.4. Open Hole
- 3.6. Global Wireline Services Market Analysis, Opportunity and Forecast, By Location, 2016-2032
- 3.6.1. Global Wireline Services Market Analysis by Location: Introduction
- 3.6.2. Market Size Absolute $ Opportunity Analysis and Forecast, By Location, 2016-2032
- 3.6.3. Onshore
- 3.6.4. Offshore
- 4. North America Wireline Services Market Analysis, Opportunity and Forecast, 2016-2032
- 4.1. North America Wireline Services Market Analysis, 2016-2021
- 4.2. North America Wireline Services Market Opportunity and Forecast, 2023-2032
- 4.3. North America Wireline Services Market Analysis, Opportunity and Forecast, By Wireline Type, 2016-2032
- 4.3.1. North America Wireline Services Market Analysis by Wireline Type: Introduction
- 4.3.2. Market Size Absolute $ Opportunity Analysis and Forecast, By Wireline Type, 2016-2032
- 4.3.3. Electric line
- 4.3.4. Slickline
- 4.4. North America Wireline Services Market Analysis, Opportunity and Forecast, By Service, 2016-2032
- 4.4.1. North America Wireline Services Market Analysis by Service: Introduction
- 4.4.2. Market Size Absolute $ Opportunity Analysis and Forecast, By Service, 2016-2032
- 4.4.3. Completion
- 4.4.4. Well Intervention
- 4.4.5. Logging
- 4.5. North America Wireline Services Market Analysis, Opportunity and Forecast, By Hole Type, 2016-2032
- 4.5.1. North America Wireline Services Market Analysis by Hole Type: Introduction
- 4.5.2. Market Size Absolute $ Opportunity Analysis and Forecast, By Hole Type, 2016-2032
- 4.5.3. Cased-Hole
- 4.5.4. Open Hole
- 4.6. North America Wireline Services Market Analysis, Opportunity and Forecast, By Location, 2016-2032
- 4.6.1. North America Wireline Services Market Analysis by Location: Introduction
- 4.6.2. Market Size Absolute $ Opportunity Analysis and Forecast, By Location, 2016-2032
- 4.6.3. Onshore
- 4.6.4. Offshore
- 4.7. North America Wireline Services Market Analysis, Opportunity and Forecast, By Country , 2016-2032
- 4.7.1. North America Wireline Services Market Analysis by Country : Introduction
- 4.7.2. Market Size Absolute $ Opportunity Analysis and Forecast, Country , 2016-2032
- 4.7.2.1. The US
- 4.7.2.2. Canada
- 4.7.2.3. Mexico
- 5. Western Europe Wireline Services Market Analysis, Opportunity and Forecast, 2016-2032
- 5.1. Western Europe Wireline Services Market Analysis, 2016-2021
- 5.2. Western Europe Wireline Services Market Opportunity and Forecast, 2023-2032
- 5.3. Western Europe Wireline Services Market Analysis, Opportunity and Forecast, By Wireline Type, 2016-2032
- 5.3.1. Western Europe Wireline Services Market Analysis by Wireline Type: Introduction
- 5.3.2. Market Size Absolute $ Opportunity Analysis and Forecast, By Wireline Type, 2016-2032
- 5.3.3. Electric line
- 5.3.4. Slickline
- 5.4. Western Europe Wireline Services Market Analysis, Opportunity and Forecast, By Service, 2016-2032
- 5.4.1. Western Europe Wireline Services Market Analysis by Service: Introduction
- 5.4.2. Market Size Absolute $ Opportunity Analysis and Forecast, By Service, 2016-2032
- 5.4.3. Completion
- 5.4.4. Well Intervention
- 5.4.5. Logging
- 5.5. Western Europe Wireline Services Market Analysis, Opportunity and Forecast, By Hole Type, 2016-2032
- 5.5.1. Western Europe Wireline Services Market Analysis by Hole Type: Introduction
- 5.5.2. Market Size Absolute $ Opportunity Analysis and Forecast, By Hole Type, 2016-2032
- 5.5.3. Cased-Hole
- 5.5.4. Open Hole
- 5.6. Western Europe Wireline Services Market Analysis, Opportunity and Forecast, By Location, 2016-2032
- 5.6.1. Western Europe Wireline Services Market Analysis by Location: Introduction
- 5.6.2. Market Size Absolute $ Opportunity Analysis and Forecast, By Location, 2016-2032
- 5.6.3. Onshore
- 5.6.4. Offshore
- 5.7. Western Europe Wireline Services Market Analysis, Opportunity and Forecast, By Country , 2016-2032
- 5.7.1. Western Europe Wireline Services Market Analysis by Country : Introduction
- 5.7.2. Market Size Absolute $ Opportunity Analysis and Forecast, Country , 2016-2032
- 5.7.2.1. Germany
- 5.7.2.2. France
- 5.7.2.3. The UK
- 5.7.2.4. Spain
- 5.7.2.5. Italy
- 5.7.2.6. Portugal
- 5.7.2.7. Ireland
- 5.7.2.8. Austria
- 5.7.2.9. Switzerland
- 5.7.2.10. Benelux
- 5.7.2.11. Nordic
- 5.7.2.12. Rest of Western Europe
- 6. Eastern Europe Wireline Services Market Analysis, Opportunity and Forecast, 2016-2032
- 6.1. Eastern Europe Wireline Services Market Analysis, 2016-2021
- 6.2. Eastern Europe Wireline Services Market Opportunity and Forecast, 2023-2032
- 6.3. Eastern Europe Wireline Services Market Analysis, Opportunity and Forecast, By Wireline Type, 2016-2032
- 6.3.1. Eastern Europe Wireline Services Market Analysis by Wireline Type: Introduction
- 6.3.2. Market Size Absolute $ Opportunity Analysis and Forecast, By Wireline Type, 2016-2032
- 6.3.3. Electric line
- 6.3.4. Slickline
- 6.4. Eastern Europe Wireline Services Market Analysis, Opportunity and Forecast, By Service, 2016-2032
- 6.4.1. Eastern Europe Wireline Services Market Analysis by Service: Introduction
- 6.4.2. Market Size Absolute $ Opportunity Analysis and Forecast, By Service, 2016-2032
- 6.4.3. Completion
- 6.4.4. Well Intervention
- 6.4.5. Logging
- 6.5. Eastern Europe Wireline Services Market Analysis, Opportunity and Forecast, By Hole Type, 2016-2032
- 6.5.1. Eastern Europe Wireline Services Market Analysis by Hole Type: Introduction
- 6.5.2. Market Size Absolute $ Opportunity Analysis and Forecast, By Hole Type, 2016-2032
- 6.5.3. Cased-Hole
- 6.5.4. Open Hole
- 6.6. Eastern Europe Wireline Services Market Analysis, Opportunity and Forecast, By Location, 2016-2032
- 6.6.1. Eastern Europe Wireline Services Market Analysis by Location: Introduction
- 6.6.2. Market Size Absolute $ Opportunity Analysis and Forecast, By Location, 2016-2032
- 6.6.3. Onshore
- 6.6.4. Offshore
- 6.7. Eastern Europe Wireline Services Market Analysis, Opportunity and Forecast, By Country , 2016-2032
- 6.7.1. Eastern Europe Wireline Services Market Analysis by Country : Introduction
- 6.7.2. Market Size Absolute $ Opportunity Analysis and Forecast, Country , 2016-2032
- 6.7.2.1. Russia
- 6.7.2.2. Poland
- 6.7.2.3. The Czech Republic
- 6.7.2.4. Greece
- 6.7.2.5. Rest of Eastern Europe
- 7. APAC Wireline Services Market Analysis, Opportunity and Forecast, 2016-2032
- 7.1. APAC Wireline Services Market Analysis, 2016-2021
- 7.2. APAC Wireline Services Market Opportunity and Forecast, 2023-2032
- 7.3. APAC Wireline Services Market Analysis, Opportunity and Forecast, By Wireline Type, 2016-2032
- 7.3.1. APAC Wireline Services Market Analysis by Wireline Type: Introduction
- 7.3.2. Market Size Absolute $ Opportunity Analysis and Forecast, By Wireline Type, 2016-2032
- 7.3.3. Electric line
- 7.3.4. Slickline
- 7.4. APAC Wireline Services Market Analysis, Opportunity and Forecast, By Service, 2016-2032
- 7.4.1. APAC Wireline Services Market Analysis by Service: Introduction
- 7.4.2. Market Size Absolute $ Opportunity Analysis and Forecast, By Service, 2016-2032
- 7.4.3. Completion
- 7.4.4. Well Intervention
- 7.4.5. Logging
- 7.5. APAC Wireline Services Market Analysis, Opportunity and Forecast, By Hole Type, 2016-2032
- 7.5.1. APAC Wireline Services Market Analysis by Hole Type: Introduction
- 7.5.2. Market Size Absolute $ Opportunity Analysis and Forecast, By Hole Type, 2016-2032
- 7.5.3. Cased-Hole
- 7.5.4. Open Hole
- 7.6. APAC Wireline Services Market Analysis, Opportunity and Forecast, By Location, 2016-2032
- 7.6.1. APAC Wireline Services Market Analysis by Location: Introduction
- 7.6.2. Market Size Absolute $ Opportunity Analysis and Forecast, By Location, 2016-2032
- 7.6.3. Onshore
- 7.6.4. Offshore
- 7.7. APAC Wireline Services Market Analysis, Opportunity and Forecast, By Country , 2016-2032
- 7.7.1. APAC Wireline Services Market Analysis by Country : Introduction
- 7.7.2. Market Size Absolute $ Opportunity Analysis and Forecast, Country , 2016-2032
- 7.7.2.1. China
- 7.7.2.2. Japan
- 7.7.2.3. South Korea
- 7.7.2.4. India
- 7.7.2.5. Australia & New Zeland
- 7.7.2.6. Indonesia
- 7.7.2.7. Malaysia
- 7.7.2.8. Philippines
- 7.7.2.9. Singapore
- 7.7.2.10. Thailand
- 7.7.2.11. Vietnam
- 7.7.2.12. Rest of APAC
- 8. Latin America Wireline Services Market Analysis, Opportunity and Forecast, 2016-2032
- 8.1. Latin America Wireline Services Market Analysis, 2016-2021
- 8.2. Latin America Wireline Services Market Opportunity and Forecast, 2023-2032
- 8.3. Latin America Wireline Services Market Analysis, Opportunity and Forecast, By Wireline Type, 2016-2032
- 8.3.1. Latin America Wireline Services Market Analysis by Wireline Type: Introduction
- 8.3.2. Market Size Absolute $ Opportunity Analysis and Forecast, By Wireline Type, 2016-2032
- 8.3.3. Electric line
- 8.3.4. Slickline
- 8.4. Latin America Wireline Services Market Analysis, Opportunity and Forecast, By Service, 2016-2032
- 8.4.1. Latin America Wireline Services Market Analysis by Service: Introduction
- 8.4.2. Market Size Absolute $ Opportunity Analysis and Forecast, By Service, 2016-2032
- 8.4.3. Completion
- 8.4.4. Well Intervention
- 8.4.5. Logging
- 8.5. Latin America Wireline Services Market Analysis, Opportunity and Forecast, By Hole Type, 2016-2032
- 8.5.1. Latin America Wireline Services Market Analysis by Hole Type: Introduction
- 8.5.2. Market Size Absolute $ Opportunity Analysis and Forecast, By Hole Type, 2016-2032
- 8.5.3. Cased-Hole
- 8.5.4. Open Hole
- 8.6. Latin America Wireline Services Market Analysis, Opportunity and Forecast, By Location, 2016-2032
- 8.6.1. Latin America Wireline Services Market Analysis by Location: Introduction
- 8.6.2. Market Size Absolute $ Opportunity Analysis and Forecast, By Location, 2016-2032
- 8.6.3. Onshore
- 8.6.4. Offshore
- 8.7. Latin America Wireline Services Market Analysis, Opportunity and Forecast, By Country , 2016-2032
- 8.7.1. Latin America Wireline Services Market Analysis by Country : Introduction
- 8.7.2. Market Size Absolute $ Opportunity Analysis and Forecast, Country , 2016-2032
- 8.7.2.1. Brazil
- 8.7.2.2. Colombia
- 8.7.2.3. Chile
- 8.7.2.4. Argentina
- 8.7.2.5. Costa Rica
- 8.7.2.6. Rest of Latin America
- 9. Middle East & Africa Wireline Services Market Analysis, Opportunity and Forecast, 2016-2032
- 9.1. Middle East & Africa Wireline Services Market Analysis, 2016-2021
- 9.2. Middle East & Africa Wireline Services Market Opportunity and Forecast, 2023-2032
- 9.3. Middle East & Africa Wireline Services Market Analysis, Opportunity and Forecast, By Wireline Type, 2016-2032
- 9.3.1. Middle East & Africa Wireline Services Market Analysis by Wireline Type: Introduction
- 9.3.2. Market Size Absolute $ Opportunity Analysis and Forecast, By Wireline Type, 2016-2032
- 9.3.3. Electric line
- 9.3.4. Slickline
- 9.4. Middle East & Africa Wireline Services Market Analysis, Opportunity and Forecast, By Service, 2016-2032
- 9.4.1. Middle East & Africa Wireline Services Market Analysis by Service: Introduction
- 9.4.2. Market Size Absolute $ Opportunity Analysis and Forecast, By Service, 2016-2032
- 9.4.3. Completion
- 9.4.4. Well Intervention
- 9.4.5. Logging
- 9.5. Middle East & Africa Wireline Services Market Analysis, Opportunity and Forecast, By Hole Type, 2016-2032
- 9.5.1. Middle East & Africa Wireline Services Market Analysis by Hole Type: Introduction
- 9.5.2. Market Size Absolute $ Opportunity Analysis and Forecast, By Hole Type, 2016-2032
- 9.5.3. Cased-Hole
- 9.5.4. Open Hole
- 9.6. Middle East & Africa Wireline Services Market Analysis, Opportunity and Forecast, By Location, 2016-2032
- 9.6.1. Middle East & Africa Wireline Services Market Analysis by Location: Introduction
- 9.6.2. Market Size Absolute $ Opportunity Analysis and Forecast, By Location, 2016-2032
- 9.6.3. Onshore
- 9.6.4. Offshore
- 9.7. Middle East & Africa Wireline Services Market Analysis, Opportunity and Forecast, By Country , 2016-2032
- 9.7.1. Middle East & Africa Wireline Services Market Analysis by Country : Introduction
- 9.7.2. Market Size Absolute $ Opportunity Analysis and Forecast, Country , 2016-2032
- 9.7.2.1. Algeria
- 9.7.2.2. Egypt
- 9.7.2.3. Israel
- 9.7.2.4. Kuwait
- 9.7.2.5. Nigeria
- 9.7.2.6. Saudi Arabia
- 9.7.2.7. South Africa
- 9.7.2.8. Turkey
- 9.7.2.9. The UAE
- 9.7.2.10. Rest of MEA
- 10. Global Wireline Services Market Analysis, Opportunity and Forecast, By Region , 2016-2032
- 10.1. Global Wireline Services Market Analysis by Region : Introduction
- 10.2. Market Size Absolute $ Opportunity Analysis and Forecast, By Region , 2016-2032
- 10.2.1. North America
- 10.2.2. Western Europe
- 10.2.3. Eastern Europe
- 10.2.4. APAC
- 10.2.5. Latin America
- 10.2.6. Middle East & Africa
- 11. Global Wireline Services Market Competitive Landscape, Market Share Analysis, and Company Profiles
- 11.1. Market Share Analysis
- 11.2. Company Profiles
- 11.3. Baker Hughes (U.S.)
- 11.3.1. Company Overview
- 11.3.2. Financial Highlights
- 11.3.3. Product Portfolio
- 11.3.4. SWOT Analysis
- 11.3.5. Key Strategies and Developments
- 11.4. Nabors Industries Ltd. (U.S.)
- 11.4.1. Company Overview
- 11.4.2. Financial Highlights
- 11.4.3. Product Portfolio
- 11.4.4. SWOT Analysis
- 11.4.5. Key Strategies and Developments
- 11.5. Halliburton Company (U.S.)
- 11.5.1. Company Overview
- 11.5.2. Financial Highlights
- 11.5.3. Product Portfolio
- 11.5.4. SWOT Analysis
- 11.5.5. Key Strategies and Developments
- 11.6. Weatherford International Plc (U.S.)
- 11.6.1. Company Overview
- 11.6.2. Financial Highlights
- 11.6.3. Product Portfolio
- 11.6.4. SWOT Analysis
- 11.6.5. Key Strategies and Developments
- 11.7. Weir Oil And Gas (U.K.)
- 11.7.1. Company Overview
- 11.7.2. Financial Highlights
- 11.7.3. Product Portfolio
- 11.7.4. SWOT Analysis
- 11.7.5. Key Strategies and Developments
- 11.8. Pioneer Energy Services (U.S.)
- 11.8.1. Company Overview
- 11.8.2. Financial Highlights
- 11.8.3. Product Portfolio
- 11.8.4. SWOT Analysis
- 11.8.5. Key Strategies and Developments
- 11.9. National Oilwell Varco (U.S.)
- 11.9.1. Company Overview
- 11.9.2. Financial Highlights
- 11.9.3. Product Portfolio
- 11.9.4. SWOT Analysis
- 11.9.5. Key Strategies and Developments
- 11.10. Fmc Technologies (U.S.)
- 11.10.1. Company Overview
- 11.10.2. Financial Highlights
- 11.10.3. Product Portfolio
- 11.10.4. SWOT Analysis
- 11.10.5. Key Strategies and Developments
- 11.11. Emerson (U.S.)
- 11.11.1. Company Overview
- 11.11.2. Financial Highlights
- 11.11.3. Product Portfolio
- 11.11.4. SWOT Analysis
- 11.11.5. Key Strategies and Developments
- 11.12. Siemens (Germany)
- 11.12.1. Company Overview
- 11.12.2. Financial Highlights
- 11.12.3. Product Portfolio
- 11.12.4. SWOT Analysis
- 11.12.5. Key Strategies and Developments
- 11.13.1. Company Overview
- 11.13.2. Financial Highlights
- 11.13.3. Product Portfolio
- 11.13.4. SWOT Analysis
- 11.13.5. Key Strategies and Developments
- 11.14. Schneider Electric (France)
- 11.14.1. Company Overview
- 11.14.2. Financial Highlights
- 11.14.3. Product Portfolio
- 11.14.4. SWOT Analysis
- 11.14.5. Key Strategies and Developments
- 11.15. Archer Limited(U.K.)
- 11.15.1. Company Overview
- 11.15.2. Financial Highlights
- 11.15.3. Product Portfolio
- 11.15.4. SWOT Analysis
- 11.15.5. Key Strategies and Developments
- 11.16. Superior Energy Services (U.S.)
- 11.16.1. Company Overview
- 11.16.2. Financial Highlights
- 11.16.3. Product Portfolio
- 11.16.4. SWOT Analysis
- 11.16.5. Key Strategies and Developments
- 11.17. Schlumberger Limited (U.S.)
- 11.17.1. Company Overview
- 11.17.2. Financial Highlights
- 11.17.3. Product Portfolio
- 11.17.4. SWOT Analysis
- 11.17.5. Key Strategies and Developments
- 11.18. Cased Hole Solutions (U.S.)
- 11.18.1. Company Overview
- 11.18.2. Financial Highlights
- 11.18.3. Product Portfolio
- 11.18.4. SWOT Analysis
- 11.18.5. Key Strategies and Developments
- 11.19. Weltec (Denmark)
- 11.19.1. Company Overview
- 11.19.2. Financial Highlights
- 11.19.3. Product Portfolio
- 11.19.4. SWOT Analysis
- 11.19.5. Key Strategies and Developments
- 12. Assumptions and Acronyms
- 13. Research Methodology
- 14. Contact
"
- List of Figures
- "
- Figure 1: Global Wireline Services Market Revenue (US$ Mn) Market Share by Wireline Type in 2022
- Figure 2: Global Wireline Services Market Market Attractiveness Analysis by Wireline Type, 2016-2032
- Figure 3: Global Wireline Services Market Revenue (US$ Mn) Market Share by Servicein 2022
- Figure 4: Global Wireline Services Market Market Attractiveness Analysis by Service, 2016-2032
- Figure 5: Global Wireline Services Market Revenue (US$ Mn) Market Share by Hole Typein 2022
- Figure 6: Global Wireline Services Market Market Attractiveness Analysis by Hole Type, 2016-2032
- Figure 7: Global Wireline Services Market Revenue (US$ Mn) Market Share by Locationin 2022
- Figure 8: Global Wireline Services Market Market Attractiveness Analysis by Location, 2016-2032
- Figure 9: Global Wireline Services Market Revenue (US$ Mn) Market Share by Region in 2022
- Figure 10: Global Wireline Services Market Market Attractiveness Analysis by Region, 2016-2032
- Figure 11: Global Wireline Services Market Market Revenue (US$ Mn) (2016-2032)
- Figure 12: Global Wireline Services Market Market Revenue (US$ Mn) Comparison by Region (2016-2032)
- Figure 13: Global Wireline Services Market Market Revenue (US$ Mn) Comparison by Wireline Type (2016-2032)
- Figure 14: Global Wireline Services Market Market Revenue (US$ Mn) Comparison by Service (2016-2032)
- Figure 15: Global Wireline Services Market Market Revenue (US$ Mn) Comparison by Hole Type (2016-2032)
- Figure 16: Global Wireline Services Market Market Revenue (US$ Mn) Comparison by Location (2016-2032)
- Figure 17: Global Wireline Services Market Market Y-o-Y Growth Rate Comparison by Region (2016-2032)
- Figure 18: Global Wireline Services Market Market Y-o-Y Growth Rate Comparison by Wireline Type (2016-2032)
- Figure 19: Global Wireline Services Market Market Y-o-Y Growth Rate Comparison by Service (2016-2032)
- Figure 20: Global Wireline Services Market Market Y-o-Y Growth Rate Comparison by Hole Type (2016-2032)
- Figure 21: Global Wireline Services Market Market Y-o-Y Growth Rate Comparison by Location (2016-2032)
- Figure 22: Global Wireline Services Market Market Share Comparison by Region (2016-2032)
- Figure 23: Global Wireline Services Market Market Share Comparison by Wireline Type (2016-2032)
- Figure 24: Global Wireline Services Market Market Share Comparison by Service (2016-2032)
- Figure 25: Global Wireline Services Market Market Share Comparison by Hole Type (2016-2032)
- Figure 26: Global Wireline Services Market Market Share Comparison by Location (2016-2032)
- Figure 27: North America Wireline Services Market Revenue (US$ Mn) Market Share by Wireline Typein 2022
- Figure 28: North America Wireline Services Market Market Attractiveness Analysis by Wireline Type, 2016-2032
- Figure 29: North America Wireline Services Market Revenue (US$ Mn) Market Share by Servicein 2022
- Figure 30: North America Wireline Services Market Market Attractiveness Analysis by Service, 2016-2032
- Figure 31: North America Wireline Services Market Revenue (US$ Mn) Market Share by Hole Typein 2022
- Figure 32: North America Wireline Services Market Market Attractiveness Analysis by Hole Type, 2016-2032
- Figure 33: North America Wireline Services Market Revenue (US$ Mn) Market Share by Locationin 2022
- Figure 34: North America Wireline Services Market Market Attractiveness Analysis by Location, 2016-2032
- Figure 35: North America Wireline Services Market Revenue (US$ Mn) Market Share by Country in 2022
- Figure 36: North America Wireline Services Market Market Attractiveness Analysis by Country, 2016-2032
- Figure 37: North America Wireline Services Market Market Revenue (US$ Mn) (2016-2032)
- Figure 38: North America Wireline Services Market Market Revenue (US$ Mn) Comparison by Country (2016-2032)
- Figure 39: North America Wireline Services Market Market Revenue (US$ Mn) Comparison by Wireline Type (2016-2032)
- Figure 40: North America Wireline Services Market Market Revenue (US$ Mn) Comparison by Service (2016-2032)
- Figure 41: North America Wireline Services Market Market Revenue (US$ Mn) Comparison by Hole Type (2016-2032)
- Figure 42: North America Wireline Services Market Market Revenue (US$ Mn) Comparison by Location (2016-2032)
- Figure 43: North America Wireline Services Market Market Y-o-Y Growth Rate Comparison by Country (2016-2032)
- Figure 44: North America Wireline Services Market Market Y-o-Y Growth Rate Comparison by Wireline Type (2016-2032)
- Figure 45: North America Wireline Services Market Market Y-o-Y Growth Rate Comparison by Service (2016-2032)
- Figure 46: North America Wireline Services Market Market Y-o-Y Growth Rate Comparison by Hole Type (2016-2032)
- Figure 47: North America Wireline Services Market Market Y-o-Y Growth Rate Comparison by Location (2016-2032)
- Figure 48: North America Wireline Services Market Market Share Comparison by Country (2016-2032)
- Figure 49: North America Wireline Services Market Market Share Comparison by Wireline Type (2016-2032)
- Figure 50: North America Wireline Services Market Market Share Comparison by Service (2016-2032)
- Figure 51: North America Wireline Services Market Market Share Comparison by Hole Type (2016-2032)
- Figure 52: North America Wireline Services Market Market Share Comparison by Location (2016-2032)
- Figure 53: Western Europe Wireline Services Market Revenue (US$ Mn) Market Share by Wireline Typein 2022
- Figure 54: Western Europe Wireline Services Market Market Attractiveness Analysis by Wireline Type, 2016-2032
- Figure 55: Western Europe Wireline Services Market Revenue (US$ Mn) Market Share by Servicein 2022
- Figure 56: Western Europe Wireline Services Market Market Attractiveness Analysis by Service, 2016-2032
- Figure 57: Western Europe Wireline Services Market Revenue (US$ Mn) Market Share by Hole Typein 2022
- Figure 58: Western Europe Wireline Services Market Market Attractiveness Analysis by Hole Type, 2016-2032
- Figure 59: Western Europe Wireline Services Market Revenue (US$ Mn) Market Share by Locationin 2022
- Figure 60: Western Europe Wireline Services Market Market Attractiveness Analysis by Location, 2016-2032
- Figure 61: Western Europe Wireline Services Market Revenue (US$ Mn) Market Share by Country in 2022
- Figure 62: Western Europe Wireline Services Market Market Attractiveness Analysis by Country, 2016-2032
- Figure 63: Western Europe Wireline Services Market Market Revenue (US$ Mn) (2016-2032)
- Figure 64: Western Europe Wireline Services Market Market Revenue (US$ Mn) Comparison by Country (2016-2032)
- Figure 65: Western Europe Wireline Services Market Market Revenue (US$ Mn) Comparison by Wireline Type (2016-2032)
- Figure 66: Western Europe Wireline Services Market Market Revenue (US$ Mn) Comparison by Service (2016-2032)
- Figure 67: Western Europe Wireline Services Market Market Revenue (US$ Mn) Comparison by Hole Type (2016-2032)
- Figure 68: Western Europe Wireline Services Market Market Revenue (US$ Mn) Comparison by Location (2016-2032)
- Figure 69: Western Europe Wireline Services Market Market Y-o-Y Growth Rate Comparison by Country (2016-2032)
- Figure 70: Western Europe Wireline Services Market Market Y-o-Y Growth Rate Comparison by Wireline Type (2016-2032)
- Figure 71: Western Europe Wireline Services Market Market Y-o-Y Growth Rate Comparison by Service (2016-2032)
- Figure 72: Western Europe Wireline Services Market Market Y-o-Y Growth Rate Comparison by Hole Type (2016-2032)
- Figure 73: Western Europe Wireline Services Market Market Y-o-Y Growth Rate Comparison by Location (2016-2032)
- Figure 74: Western Europe Wireline Services Market Market Share Comparison by Country (2016-2032)
- Figure 75: Western Europe Wireline Services Market Market Share Comparison by Wireline Type (2016-2032)
- Figure 76: Western Europe Wireline Services Market Market Share Comparison by Service (2016-2032)
- Figure 77: Western Europe Wireline Services Market Market Share Comparison by Hole Type (2016-2032)
- Figure 78: Western Europe Wireline Services Market Market Share Comparison by Location (2016-2032)
- Figure 79: Eastern Europe Wireline Services Market Revenue (US$ Mn) Market Share by Wireline Typein 2022
- Figure 80: Eastern Europe Wireline Services Market Market Attractiveness Analysis by Wireline Type, 2016-2032
- Figure 81: Eastern Europe Wireline Services Market Revenue (US$ Mn) Market Share by Servicein 2022
- Figure 82: Eastern Europe Wireline Services Market Market Attractiveness Analysis by Service, 2016-2032
- Figure 83: Eastern Europe Wireline Services Market Revenue (US$ Mn) Market Share by Hole Typein 2022
- Figure 84: Eastern Europe Wireline Services Market Market Attractiveness Analysis by Hole Type, 2016-2032
- Figure 85: Eastern Europe Wireline Services Market Revenue (US$ Mn) Market Share by Locationin 2022
- Figure 86: Eastern Europe Wireline Services Market Market Attractiveness Analysis by Location, 2016-2032
- Figure 87: Eastern Europe Wireline Services Market Revenue (US$ Mn) Market Share by Country in 2022
- Figure 88: Eastern Europe Wireline Services Market Market Attractiveness Analysis by Country, 2016-2032
- Figure 89: Eastern Europe Wireline Services Market Market Revenue (US$ Mn) (2016-2032)
- Figure 90: Eastern Europe Wireline Services Market Market Revenue (US$ Mn) Comparison by Country (2016-2032)
- Figure 91: Eastern Europe Wireline Services Market Market Revenue (US$ Mn) Comparison by Wireline Type (2016-2032)
- Figure 92: Eastern Europe Wireline Services Market Market Revenue (US$ Mn) Comparison by Service (2016-2032)
- Figure 93: Eastern Europe Wireline Services Market Market Revenue (US$ Mn) Comparison by Hole Type (2016-2032)
- Figure 94: Eastern Europe Wireline Services Market Market Revenue (US$ Mn) Comparison by Location (2016-2032)
- Figure 95: Eastern Europe Wireline Services Market Market Y-o-Y Growth Rate Comparison by Country (2016-2032)
- Figure 96: Eastern Europe Wireline Services Market Market Y-o-Y Growth Rate Comparison by Wireline Type (2016-2032)
- Figure 97: Eastern Europe Wireline Services Market Market Y-o-Y Growth Rate Comparison by Service (2016-2032)
- Figure 98: Eastern Europe Wireline Services Market Market Y-o-Y Growth Rate Comparison by Hole Type (2016-2032)
- Figure 99: Eastern Europe Wireline Services Market Market Y-o-Y Growth Rate Comparison by Location (2016-2032)
- Figure 100: Eastern Europe Wireline Services Market Market Share Comparison by Country (2016-2032)
- Figure 101: Eastern Europe Wireline Services Market Market Share Comparison by Wireline Type (2016-2032)
- Figure 102: Eastern Europe Wireline Services Market Market Share Comparison by Service (2016-2032)
- Figure 103: Eastern Europe Wireline Services Market Market Share Comparison by Hole Type (2016-2032)
- Figure 104: Eastern Europe Wireline Services Market Market Share Comparison by Location (2016-2032)
- Figure 105: APAC Wireline Services Market Revenue (US$ Mn) Market Share by Wireline Typein 2022
- Figure 106: APAC Wireline Services Market Market Attractiveness Analysis by Wireline Type, 2016-2032
- Figure 107: APAC Wireline Services Market Revenue (US$ Mn) Market Share by Servicein 2022
- Figure 108: APAC Wireline Services Market Market Attractiveness Analysis by Service, 2016-2032
- Figure 109: APAC Wireline Services Market Revenue (US$ Mn) Market Share by Hole Typein 2022
- Figure 110: APAC Wireline Services Market Market Attractiveness Analysis by Hole Type, 2016-2032
- Figure 111: APAC Wireline Services Market Revenue (US$ Mn) Market Share by Locationin 2022
- Figure 112: APAC Wireline Services Market Market Attractiveness Analysis by Location, 2016-2032
- Figure 113: APAC Wireline Services Market Revenue (US$ Mn) Market Share by Country in 2022
- Figure 114: APAC Wireline Services Market Market Attractiveness Analysis by Country, 2016-2032
- Figure 115: APAC Wireline Services Market Market Revenue (US$ Mn) (2016-2032)
- Figure 116: APAC Wireline Services Market Market Revenue (US$ Mn) Comparison by Country (2016-2032)
- Figure 117: APAC Wireline Services Market Market Revenue (US$ Mn) Comparison by Wireline Type (2016-2032)
- Figure 118: APAC Wireline Services Market Market Revenue (US$ Mn) Comparison by Service (2016-2032)
- Figure 119: APAC Wireline Services Market Market Revenue (US$ Mn) Comparison by Hole Type (2016-2032)
- Figure 120: APAC Wireline Services Market Market Revenue (US$ Mn) Comparison by Location (2016-2032)
- Figure 121: APAC Wireline Services Market Market Y-o-Y Growth Rate Comparison by Country (2016-2032)
- Figure 122: APAC Wireline Services Market Market Y-o-Y Growth Rate Comparison by Wireline Type (2016-2032)
- Figure 123: APAC Wireline Services Market Market Y-o-Y Growth Rate Comparison by Service (2016-2032)
- Figure 124: APAC Wireline Services Market Market Y-o-Y Growth Rate Comparison by Hole Type (2016-2032)
- Figure 125: APAC Wireline Services Market Market Y-o-Y Growth Rate Comparison by Location (2016-2032)
- Figure 126: APAC Wireline Services Market Market Share Comparison by Country (2016-2032)
- Figure 127: APAC Wireline Services Market Market Share Comparison by Wireline Type (2016-2032)
- Figure 128: APAC Wireline Services Market Market Share Comparison by Service (2016-2032)
- Figure 129: APAC Wireline Services Market Market Share Comparison by Hole Type (2016-2032)
- Figure 130: APAC Wireline Services Market Market Share Comparison by Location (2016-2032)
- Figure 131: Latin America Wireline Services Market Revenue (US$ Mn) Market Share by Wireline Typein 2022
- Figure 132: Latin America Wireline Services Market Market Attractiveness Analysis by Wireline Type, 2016-2032
- Figure 133: Latin America Wireline Services Market Revenue (US$ Mn) Market Share by Servicein 2022
- Figure 134: Latin America Wireline Services Market Market Attractiveness Analysis by Service, 2016-2032
- Figure 135: Latin America Wireline Services Market Revenue (US$ Mn) Market Share by Hole Typein 2022
- Figure 136: Latin America Wireline Services Market Market Attractiveness Analysis by Hole Type, 2016-2032
- Figure 137: Latin America Wireline Services Market Revenue (US$ Mn) Market Share by Locationin 2022
- Figure 138: Latin America Wireline Services Market Market Attractiveness Analysis by Location, 2016-2032
- Figure 139: Latin America Wireline Services Market Revenue (US$ Mn) Market Share by Country in 2022
- Figure 140: Latin America Wireline Services Market Market Attractiveness Analysis by Country, 2016-2032
- Figure 141: Latin America Wireline Services Market Market Revenue (US$ Mn) (2016-2032)
- Figure 142: Latin America Wireline Services Market Market Revenue (US$ Mn) Comparison by Country (2016-2032)
- Figure 143: Latin America Wireline Services Market Market Revenue (US$ Mn) Comparison by Wireline Type (2016-2032)
- Figure 144: Latin America Wireline Services Market Market Revenue (US$ Mn) Comparison by Service (2016-2032)
- Figure 145: Latin America Wireline Services Market Market Revenue (US$ Mn) Comparison by Hole Type (2016-2032)
- Figure 146: Latin America Wireline Services Market Market Revenue (US$ Mn) Comparison by Location (2016-2032)
- Figure 147: Latin America Wireline Services Market Market Y-o-Y Growth Rate Comparison by Country (2016-2032)
- Figure 148: Latin America Wireline Services Market Market Y-o-Y Growth Rate Comparison by Wireline Type (2016-2032)
- Figure 149: Latin America Wireline Services Market Market Y-o-Y Growth Rate Comparison by Service (2016-2032)
- Figure 150: Latin America Wireline Services Market Market Y-o-Y Growth Rate Comparison by Hole Type (2016-2032)
- Figure 151: Latin America Wireline Services Market Market Y-o-Y Growth Rate Comparison by Location (2016-2032)
- Figure 152: Latin America Wireline Services Market Market Share Comparison by Country (2016-2032)
- Figure 153: Latin America Wireline Services Market Market Share Comparison by Wireline Type (2016-2032)
- Figure 154: Latin America Wireline Services Market Market Share Comparison by Service (2016-2032)
- Figure 155: Latin America Wireline Services Market Market Share Comparison by Hole Type (2016-2032)
- Figure 156: Latin America Wireline Services Market Market Share Comparison by Location (2016-2032)
- Figure 157: Middle East & Africa Wireline Services Market Revenue (US$ Mn) Market Share by Wireline Typein 2022
- Figure 158: Middle East & Africa Wireline Services Market Market Attractiveness Analysis by Wireline Type, 2016-2032
- Figure 159: Middle East & Africa Wireline Services Market Revenue (US$ Mn) Market Share by Servicein 2022
- Figure 160: Middle East & Africa Wireline Services Market Market Attractiveness Analysis by Service, 2016-2032
- Figure 161: Middle East & Africa Wireline Services Market Revenue (US$ Mn) Market Share by Hole Typein 2022
- Figure 162: Middle East & Africa Wireline Services Market Market Attractiveness Analysis by Hole Type, 2016-2032
- Figure 163: Middle East & Africa Wireline Services Market Revenue (US$ Mn) Market Share by Locationin 2022
- Figure 164: Middle East & Africa Wireline Services Market Market Attractiveness Analysis by Location, 2016-2032
- Figure 165: Middle East & Africa Wireline Services Market Revenue (US$ Mn) Market Share by Country in 2022
- Figure 166: Middle East & Africa Wireline Services Market Market Attractiveness Analysis by Country, 2016-2032
- Figure 167: Middle East & Africa Wireline Services Market Market Revenue (US$ Mn) (2016-2032)
- Figure 168: Middle East & Africa Wireline Services Market Market Revenue (US$ Mn) Comparison by Country (2016-2032)
- Figure 169: Middle East & Africa Wireline Services Market Market Revenue (US$ Mn) Comparison by Wireline Type (2016-2032)
- Figure 170: Middle East & Africa Wireline Services Market Market Revenue (US$ Mn) Comparison by Service (2016-2032)
- Figure 171: Middle East & Africa Wireline Services Market Market Revenue (US$ Mn) Comparison by Hole Type (2016-2032)
- Figure 172: Middle East & Africa Wireline Services Market Market Revenue (US$ Mn) Comparison by Location (2016-2032)
- Figure 173: Middle East & Africa Wireline Services Market Market Y-o-Y Growth Rate Comparison by Country (2016-2032)
- Figure 174: Middle East & Africa Wireline Services Market Market Y-o-Y Growth Rate Comparison by Wireline Type (2016-2032)
- Figure 175: Middle East & Africa Wireline Services Market Market Y-o-Y Growth Rate Comparison by Service (2016-2032)
- Figure 176: Middle East & Africa Wireline Services Market Market Y-o-Y Growth Rate Comparison by Hole Type (2016-2032)
- Figure 177: Middle East & Africa Wireline Services Market Market Y-o-Y Growth Rate Comparison by Location (2016-2032)
- Figure 178: Middle East & Africa Wireline Services Market Market Share Comparison by Country (2016-2032)
- Figure 179: Middle East & Africa Wireline Services Market Market Share Comparison by Wireline Type (2016-2032)
- Figure 180: Middle East & Africa Wireline Services Market Market Share Comparison by Service (2016-2032)
- Figure 181: Middle East & Africa Wireline Services Market Market Share Comparison by Hole Type (2016-2032)
- Figure 182: Middle East & Africa Wireline Services Market Market Share Comparison by Location (2016-2032)
"
- List of Tables
- "
- Table 1: Global Wireline Services Market Market Comparison by Wireline Type (2016-2032)
- Table 2: Global Wireline Services Market Market Comparison by Service (2016-2032)
- Table 3: Global Wireline Services Market Market Comparison by Hole Type (2016-2032)
- Table 4: Global Wireline Services Market Market Comparison by Location (2016-2032)
- Table 5: Global Wireline Services Market Revenue (US$ Mn) Comparison by Region (2016-2032)
- Table 6: Global Wireline Services Market Market Revenue (US$ Mn) (2016-2032)
- Table 7: Global Wireline Services Market Market Revenue (US$ Mn) Comparison by Region (2016-2032)
- Table 8: Global Wireline Services Market Market Revenue (US$ Mn) Comparison by Wireline Type (2016-2032)
- Table 9: Global Wireline Services Market Market Revenue (US$ Mn) Comparison by Service (2016-2032)
- Table 10: Global Wireline Services Market Market Revenue (US$ Mn) Comparison by Hole Type (2016-2032)
- Table 11: Global Wireline Services Market Market Revenue (US$ Mn) Comparison by Location (2016-2032)
- Table 12: Global Wireline Services Market Market Y-o-Y Growth Rate Comparison by Region (2016-2032)
- Table 13: Global Wireline Services Market Market Y-o-Y Growth Rate Comparison by Wireline Type (2016-2032)
- Table 14: Global Wireline Services Market Market Y-o-Y Growth Rate Comparison by Service (2016-2032)
- Table 15: Global Wireline Services Market Market Y-o-Y Growth Rate Comparison by Hole Type (2016-2032)
- Table 16: Global Wireline Services Market Market Y-o-Y Growth Rate Comparison by Location (2016-2032)
- Table 17: Global Wireline Services Market Market Share Comparison by Region (2016-2032)
- Table 18: Global Wireline Services Market Market Share Comparison by Wireline Type (2016-2032)
- Table 19: Global Wireline Services Market Market Share Comparison by Service (2016-2032)
- Table 20: Global Wireline Services Market Market Share Comparison by Hole Type (2016-2032)
- Table 21: Global Wireline Services Market Market Share Comparison by Location (2016-2032)
- Table 22: North America Wireline Services Market Market Comparison by Service (2016-2032)
- Table 23: North America Wireline Services Market Market Comparison by Hole Type (2016-2032)
- Table 24: North America Wireline Services Market Market Comparison by Location (2016-2032)
- Table 25: North America Wireline Services Market Revenue (US$ Mn) Comparison by Country (2016-2032)
- Table 26: North America Wireline Services Market Market Revenue (US$ Mn) (2016-2032)
- Table 27: North America Wireline Services Market Market Revenue (US$ Mn) Comparison by Country (2016-2032)
- Table 28: North America Wireline Services Market Market Revenue (US$ Mn) Comparison by Wireline Type (2016-2032)
- Table 29: North America Wireline Services Market Market Revenue (US$ Mn) Comparison by Service (2016-2032)
- Table 30: North America Wireline Services Market Market Revenue (US$ Mn) Comparison by Hole Type (2016-2032)
- Table 31: North America Wireline Services Market Market Revenue (US$ Mn) Comparison by Location (2016-2032)
- Table 32: North America Wireline Services Market Market Y-o-Y Growth Rate Comparison by Country (2016-2032)
- Table 33: North America Wireline Services Market Market Y-o-Y Growth Rate Comparison by Wireline Type (2016-2032)
- Table 34: North America Wireline Services Market Market Y-o-Y Growth Rate Comparison by Service (2016-2032)
- Table 35: North America Wireline Services Market Market Y-o-Y Growth Rate Comparison by Hole Type (2016-2032)
- Table 36: North America Wireline Services Market Market Y-o-Y Growth Rate Comparison by Location (2016-2032)
- Table 37: North America Wireline Services Market Market Share Comparison by Country (2016-2032)
- Table 38: North America Wireline Services Market Market Share Comparison by Wireline Type (2016-2032)
- Table 39: North America Wireline Services Market Market Share Comparison by Service (2016-2032)
- Table 40: North America Wireline Services Market Market Share Comparison by Hole Type (2016-2032)
- Table 41: North America Wireline Services Market Market Share Comparison by Location (2016-2032)
- Table 42: Western Europe Wireline Services Market Market Comparison by Wireline Type (2016-2032)
- Table 43: Western Europe Wireline Services Market Market Comparison by Service (2016-2032)
- Table 44: Western Europe Wireline Services Market Market Comparison by Hole Type (2016-2032)
- Table 45: Western Europe Wireline Services Market Market Comparison by Location (2016-2032)
- Table 46: Western Europe Wireline Services Market Revenue (US$ Mn) Comparison by Country (2016-2032)
- Table 47: Western Europe Wireline Services Market Market Revenue (US$ Mn) (2016-2032)
- Table 48: Western Europe Wireline Services Market Market Revenue (US$ Mn) Comparison by Country (2016-2032)
- Table 49: Western Europe Wireline Services Market Market Revenue (US$ Mn) Comparison by Wireline Type (2016-2032)
- Table 50: Western Europe Wireline Services Market Market Revenue (US$ Mn) Comparison by Service (2016-2032)
- Table 51: Western Europe Wireline Services Market Market Revenue (US$ Mn) Comparison by Hole Type (2016-2032)
- Table 52: Western Europe Wireline Services Market Market Revenue (US$ Mn) Comparison by Location (2016-2032)
- Table 53: Western Europe Wireline Services Market Market Y-o-Y Growth Rate Comparison by Country (2016-2032)
- Table 54: Western Europe Wireline Services Market Market Y-o-Y Growth Rate Comparison by Wireline Type (2016-2032)
- Table 55: Western Europe Wireline Services Market Market Y-o-Y Growth Rate Comparison by Service (2016-2032)
- Table 56: Western Europe Wireline Services Market Market Y-o-Y Growth Rate Comparison by Hole Type (2016-2032)
- Table 57: Western Europe Wireline Services Market Market Y-o-Y Growth Rate Comparison by Location (2016-2032)
- Table 58: Western Europe Wireline Services Market Market Share Comparison by Country (2016-2032)
- Table 59: Western Europe Wireline Services Market Market Share Comparison by Wireline Type (2016-2032)
- Table 60: Western Europe Wireline Services Market Market Share Comparison by Service (2016-2032)
- Table 61: Western Europe Wireline Services Market Market Share Comparison by Hole Type (2016-2032)
- Table 62: Western Europe Wireline Services Market Market Share Comparison by Location (2016-2032)
- Table 63: Eastern Europe Wireline Services Market Market Comparison by Wireline Type (2016-2032)
- Table 64: Eastern Europe Wireline Services Market Market Comparison by Service (2016-2032)
- Table 65: Eastern Europe Wireline Services Market Market Comparison by Hole Type (2016-2032)
- Table 66: Eastern Europe Wireline Services Market Market Comparison by Location (2016-2032)
- Table 67: Eastern Europe Wireline Services Market Revenue (US$ Mn) Comparison by Country (2016-2032)
- Table 68: Eastern Europe Wireline Services Market Market Revenue (US$ Mn) (2016-2032)
- Table 69: Eastern Europe Wireline Services Market Market Revenue (US$ Mn) Comparison by Country (2016-2032)
- Table 70: Eastern Europe Wireline Services Market Market Revenue (US$ Mn) Comparison by Wireline Type (2016-2032)
- Table 71: Eastern Europe Wireline Services Market Market Revenue (US$ Mn) Comparison by Service (2016-2032)
- Table 72: Eastern Europe Wireline Services Market Market Revenue (US$ Mn) Comparison by Hole Type (2016-2032)
- Table 73: Eastern Europe Wireline Services Market Market Revenue (US$ Mn) Comparison by Location (2016-2032)
- Table 74: Eastern Europe Wireline Services Market Market Y-o-Y Growth Rate Comparison by Country (2016-2032)
- Table 75: Eastern Europe Wireline Services Market Market Y-o-Y Growth Rate Comparison by Wireline Type (2016-2032)
- Table 76: Eastern Europe Wireline Services Market Market Y-o-Y Growth Rate Comparison by Service (2016-2032)
- Table 77: Eastern Europe Wireline Services Market Market Y-o-Y Growth Rate Comparison by Hole Type (2016-2032)
- Table 78: Eastern Europe Wireline Services Market Market Y-o-Y Growth Rate Comparison by Location (2016-2032)
- Table 79: Eastern Europe Wireline Services Market Market Share Comparison by Country (2016-2032)
- Table 80: Eastern Europe Wireline Services Market Market Share Comparison by Wireline Type (2016-2032)
- Table 81: Eastern Europe Wireline Services Market Market Share Comparison by Service (2016-2032)
- Table 82: Eastern Europe Wireline Services Market Market Share Comparison by Hole Type (2016-2032)
- Table 83: Eastern Europe Wireline Services Market Market Share Comparison by Location (2016-2032)
- Table 84: APAC Wireline Services Market Market Comparison by Wireline Type (2016-2032)
- Table 85: APAC Wireline Services Market Market Comparison by Service (2016-2032)
- Table 86: APAC Wireline Services Market Market Comparison by Hole Type (2016-2032)
- Table 87: APAC Wireline Services Market Market Comparison by Location (2016-2032)
- Table 88: APAC Wireline Services Market Revenue (US$ Mn) Comparison by Country (2016-2032)
- Table 89: APAC Wireline Services Market Market Revenue (US$ Mn) (2016-2032)
- Table 90: APAC Wireline Services Market Market Revenue (US$ Mn) Comparison by Country (2016-2032)
- Table 91: APAC Wireline Services Market Market Revenue (US$ Mn) Comparison by Wireline Type (2016-2032)
- Table 92: APAC Wireline Services Market Market Revenue (US$ Mn) Comparison by Service (2016-2032)
- Table 93: APAC Wireline Services Market Market Revenue (US$ Mn) Comparison by Hole Type (2016-2032)
- Table 94: APAC Wireline Services Market Market Revenue (US$ Mn) Comparison by Location (2016-2032)
- Table 95: APAC Wireline Services Market Market Y-o-Y Growth Rate Comparison by Country (2016-2032)
- Table 96: APAC Wireline Services Market Market Y-o-Y Growth Rate Comparison by Wireline Type (2016-2032)
- Table 97: APAC Wireline Services Market Market Y-o-Y Growth Rate Comparison by Service (2016-2032)
- Table 98: APAC Wireline Services Market Market Y-o-Y Growth Rate Comparison by Hole Type (2016-2032)
- Table 99: APAC Wireline Services Market Market Y-o-Y Growth Rate Comparison by Location (2016-2032)
- Table 100: APAC Wireline Services Market Market Share Comparison by Country (2016-2032)
- Table 101: APAC Wireline Services Market Market Share Comparison by Wireline Type (2016-2032)
- Table 102: APAC Wireline Services Market Market Share Comparison by Service (2016-2032)
- Table 103: APAC Wireline Services Market Market Share Comparison by Hole Type (2016-2032)
- Table 104: APAC Wireline Services Market Market Share Comparison by Location (2016-2032)
- Table 105: Latin America Wireline Services Market Market Comparison by Wireline Type (2016-2032)
- Table 106: Latin America Wireline Services Market Market Comparison by Service (2016-2032)
- Table 107: Latin America Wireline Services Market Market Comparison by Hole Type (2016-2032)
- Table 108: Latin America Wireline Services Market Market Comparison by Location (2016-2032)
- Table 109: Latin America Wireline Services Market Revenue (US$ Mn) Comparison by Country (2016-2032)
- Table 110: Latin America Wireline Services Market Market Revenue (US$ Mn) (2016-2032)
- Table 111: Latin America Wireline Services Market Market Revenue (US$ Mn) Comparison by Country (2016-2032)
- Table 112: Latin America Wireline Services Market Market Revenue (US$ Mn) Comparison by Wireline Type (2016-2032)
- Table 113: Latin America Wireline Services Market Market Revenue (US$ Mn) Comparison by Service (2016-2032)
- Table 114: Latin America Wireline Services Market Market Revenue (US$ Mn) Comparison by Hole Type (2016-2032)
- Table 115: Latin America Wireline Services Market Market Revenue (US$ Mn) Comparison by Location (2016-2032)
- Table 116: Latin America Wireline Services Market Market Y-o-Y Growth Rate Comparison by Country (2016-2032)
- Table 117: Latin America Wireline Services Market Market Y-o-Y Growth Rate Comparison by Wireline Type (2016-2032)
- Table 118: Latin America Wireline Services Market Market Y-o-Y Growth Rate Comparison by Service (2016-2032)
- Table 119: Latin America Wireline Services Market Market Y-o-Y Growth Rate Comparison by Hole Type (2016-2032)
- Table 120: Latin America Wireline Services Market Market Y-o-Y Growth Rate Comparison by Location (2016-2032)
- Table 121: Latin America Wireline Services Market Market Share Comparison by Country (2016-2032)
- Table 122: Latin America Wireline Services Market Market Share Comparison by Wireline Type (2016-2032)
- Table 123: Latin America Wireline Services Market Market Share Comparison by Service (2016-2032)
- Table 124: Latin America Wireline Services Market Market Share Comparison by Hole Type (2016-2032)
- Table 125: Latin America Wireline Services Market Market Share Comparison by Location (2016-2032)
- Table 126: Middle East & Africa Wireline Services Market Market Comparison by Wireline Type (2016-2032)
- Table 127: Middle East & Africa Wireline Services Market Market Comparison by Service (2016-2032)
- Table 128: Middle East & Africa Wireline Services Market Market Comparison by Hole Type (2016-2032)
- Table 129: Middle East & Africa Wireline Services Market Market Comparison by Location (2016-2032)
- Table 130: Middle East & Africa Wireline Services Market Revenue (US$ Mn) Comparison by Country (2016-2032)
- Table 131: Middle East & Africa Wireline Services Market Market Revenue (US$ Mn) (2016-2032)
- Table 132: Middle East & Africa Wireline Services Market Market Revenue (US$ Mn) Comparison by Country (2016-2032)
- Table 133: Middle East & Africa Wireline Services Market Market Revenue (US$ Mn) Comparison by Wireline Type (2016-2032)
- Table 134: Middle East & Africa Wireline Services Market Market Revenue (US$ Mn) Comparison by Service (2016-2032)
- Table 135: Middle East & Africa Wireline Services Market Market Revenue (US$ Mn) Comparison by Hole Type (2016-2032)
- Table 136: Middle East & Africa Wireline Services Market Market Revenue (US$ Mn) Comparison by Location (2016-2032)
- Table 137: Middle East & Africa Wireline Services Market Market Y-o-Y Growth Rate Comparison by Country (2016-2032)
- Table 138: Middle East & Africa Wireline Services Market Market Y-o-Y Growth Rate Comparison by Wireline Type (2016-2032)
- Table 139: Middle East & Africa Wireline Services Market Market Y-o-Y Growth Rate Comparison by Service (2016-2032)
- Table 140: Middle East & Africa Wireline Services Market Market Y-o-Y Growth Rate Comparison by Hole Type (2016-2032)
- Table 141: Middle East & Africa Wireline Services Market Market Y-o-Y Growth Rate Comparison by Location (2016-2032)
- Table 142: Middle East & Africa Wireline Services Market Market Share Comparison by Country (2016-2032)
- Table 143: Middle East & Africa Wireline Services Market Market Share Comparison by Wireline Type (2016-2032)
- Table 144: Middle East & Africa Wireline Services Market Market Share Comparison by Service (2016-2032)
- Table 145: Middle East & Africa Wireline Services Market Market Share Comparison by Hole Type (2016-2032)
- Table 146: Middle East & Africa Wireline Services Market Market Share Comparison by Location (2016-2032)
- 1. Executive Summary
-
- Baker Hughes (U.S.)
- Nabors Industries Ltd. (U.S.)
- Halliburton Company (U.S.)
- Weatherford International Plc (U.S.)
- Weir Oil And Gas (U.K.)
- Pioneer Energy Services (U.S.)
- National Oilwell Varco (U.S.)
- FMC Technologies (U.S.)
- Emerson (U.S.)
- Siemens (Germany)
- Schneider Electric (France)
- Petrofac (Jersey)
- Archer Limited(U.K.)
- Superior Energy Services (U.S.)
- Schlumberger Limited (U.S.)
- Cased Hole Solutions (U.S.)
- Weltec (Denmark)
Our Clients


View Our Licence Options
