
Vitamins market By Type (Vitamin B, Vitamin E, Vitamin D, Vitamin C, Vitamin A, Vitamin K), By Source (Plants, Animals, Synthetic), By Application (Healthcare Products, Pharmaceuticals, Food and Beverages, Animal Feed, Personal Care), By Region And Companies - Industry Segment Outlook, Market Assessment, Competition Scenario, Trends, And Forecast 2024-2033
-
48922
-
July 2024
-
300
-


-
This report was compiled by Trishita Deb Trishita Deb is an experienced market research and consulting professional with over 7 years of expertise across healthcare, consumer goods, and materials, contributing to over 400 healthcare-related reports. Correspondence Team Lead- Healthcare Linkedin | Detailed Market research Methodology Our methodology involves a mix of primary research, including interviews with leading mental health experts, and secondary research from reputable medical journals and databases. View Detailed Methodology Page
-
Quick Navigation
Report Overview
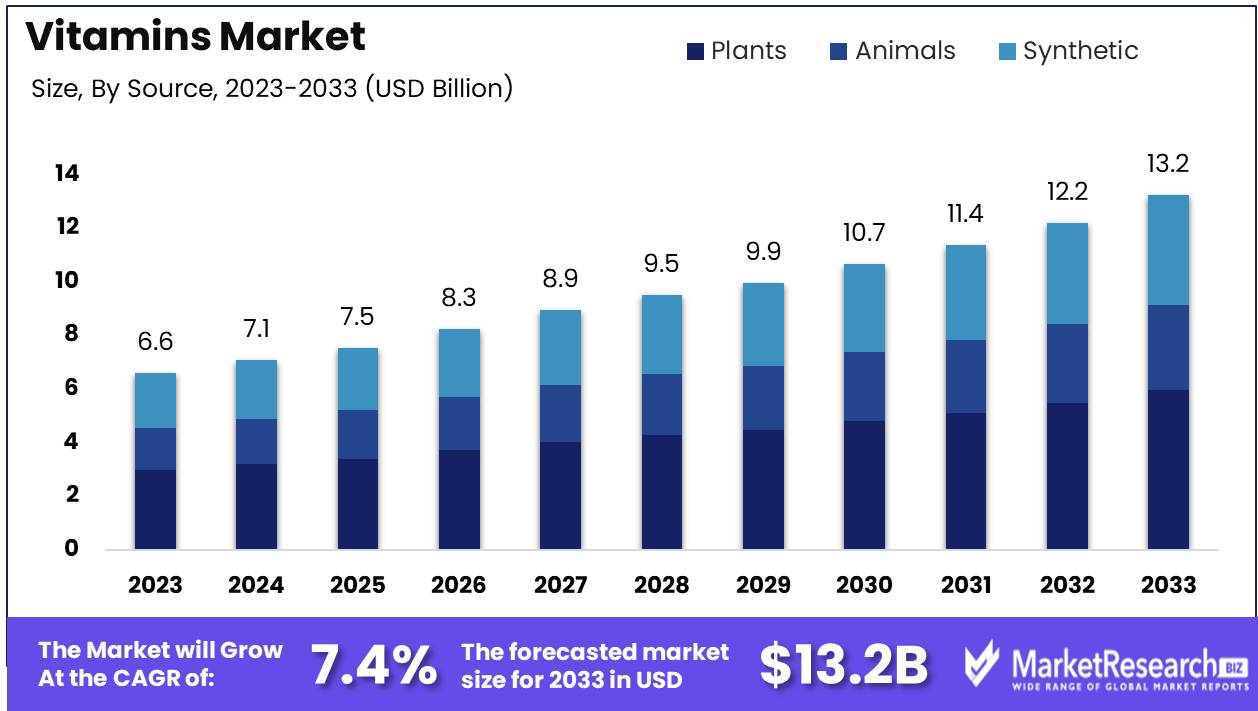
The Vitamins market was valued at USD 6.6 billion in 2023. It is expected to reach USD 13.2 billion by 2033, with a CAGR of 7.4% during the forecast period from 2024 to 2033.
The Vitamins Market encompasses the global trade and consumption of essential micronutrients, including vitamins A, B, C, D, E, and K, crucial for human health and wellness. This market is driven by increasing health awareness, rising incidences of vitamin deficiencies, and the growing popularity of preventive healthcare. Key segments include dietary supplements, fortified foods and beverages, and pharmaceuticals. Technological advancements in vitamin synthesis and increased consumer demand for natural and organic products also contribute to market growth. Major players include pharmaceutical giants, nutraceutical companies, and emerging startups, all competing to innovate and capture market share in this dynamic sector.
The vitamin market is experiencing robust growth, propelled by rising health awareness and an increasing prevalence of vitamin deficiency across global populations. The surge in consumer demand for health supplements, particularly vitamins, is driven by a greater focus on preventative healthcare and overall well-being. Additionally, the ongoing shift towards healthier lifestyles has led to a heightened consumption of vitamins, further fueling market expansion. Innovations in product formulations, including developing vegan and organic vitamins, open new avenues for market players. These trends indicate a strong positive trajectory for the vitamins market, with substantial opportunities for growth and expansion.
However, the market faces notable challenges that could hinder its growth. Regulatory complexities, particularly those related to approving and marketing vitamin supplements, present significant obstacles for manufacturers. Moreover, the risk of overconsumption and potential adverse health effects poses a concern, necessitating stringent regulations and consumer education. Despite these challenges, the market's potential remains promising, driven by continuous innovation and adaptation to consumer preferences. Market players who can navigate regulatory hurdles and capitalize on emerging trends are well-positioned to succeed in this dynamic and rapidly evolving landscape.
The market growth is significantly driven by the rising health awareness and the increasing prevalence of vitamin deficiency among global populations. Regulatory complexities and the risk of overconsumption pose challenges to market growth. Innovations in product formulations, coupled with the growing trend of vegan and organic vitamins, are creating new opportunities for market players.
Key Takeaways
- Market Growth: The Vitamins market was valued at USD 6.6 billion in 2023. It is expected to reach USD 13.2 billion by 2033, with a CAGR of 7.4% during the forecast period from 2024 to 2033.
- By Type: Vitamin B dominates the 2023 Vitamins Market, essential for energy and metabolism.
- By Source: Plant-based vitamins dominated the market, driven by consumer preference for natural products.
- By Application: Healthcare Products dominate the Vitamins Market enhancing overall health significantly.
- Regional Dominance: Asia Pacific leads the vitamins market with a 35% largest market share and robust growth.
- Growth Opportunity: The global vitamins market growth is driven by personalized nutrition and e-commerce advancements.
Driving factors
Increasing Prevalence of Vitamin Deficiencies
The escalating prevalence of vitamin deficiencies globally acts as a fundamental driver for the vitamin market. This condition primarily arises from inadequate dietary intake, lifestyle choices, and certain health conditions that impede nutrient absorption. The global health crisis of vitamin deficiencies particularly of vitamins D, B12, and A spurs a heightened demand for supplements. For instance, it is estimated that about 1 billion people worldwide suffer from vitamin D deficiency, which has been linked to various chronic diseases such as osteoporosis and certain cancers. This widespread deficiency underpins the demand for vitamin D supplements, catalyzing growth across the entire vitamin market. By addressing these deficiencies, the market not only meets a critical health need but also expands its consumer base across regions with varying dietary gaps.
Growing Consumer Awareness About Health and Wellness
In parallel with the rise of vitamin deficiencies, there is a significant surge in consumer awareness regarding health and wellness. This trend is amplified by digital media, through which information about health benefits and the preventive capabilities of vitamins is widely disseminated. As consumers become more knowledgeable about the links between nutrient intake and long-term health outcomes, the demand for vitamin supplements increases. For example, awareness of vitamin C's role in boosting immunity has led to a marked increase in its consumption during seasonal flu peaks and global health crises. This informed consumer base is more likely to invest in dietary supplements as part of a holistic health regimen, fostering a proactive approach to health maintenance. This awareness fuels a sustained growth in the vitamins market, as consumers continue to prioritize health and wellness in their daily lives.
Proactive Health Management Fueling Market Growth
A fundamental shift towards preventive healthcare is reshaping the healthcare landscape, with individuals increasingly taking charge of their health through preventive measures. This paradigm shift includes the proactive use of vitamins to prevent nutrient deficiencies and mitigate health issues before they escalate. Preventive healthcare reduces the long-term costs associated with treating chronic diseases and aligns with the growing trend of health self-management among consumers. As a result, both healthcare providers and consumers are driving the demand for vitamins, recognizing their cost-effectiveness and benefits in maintaining general health and preventing diseases. This trend not only supports the current market growth but also ensures its expansion as preventive health measures become more integrated into routine healthcare practices.
Restraining Factors
Stringent Regulations and Quality Control Standards: Navigating Compliance for Market Stability
The vitamins market, pivotal in health and wellness, is significantly influenced by stringent regulations and quality control standards. These regulatory frameworks ensure product safety, efficacy, and quality, fostering consumer trust and market integrity. For instance, in the United States, the Food and Drug Administration (FDA) mandates rigorous compliance with Good Manufacturing Practices (GMP) for dietary supplements, which includes vitamins. These standards are pivotal in mitigating the risk of contamination and inaccuracies in product labeling, thus assuring consumers of product reliability.
However, these regulations also present challenges. The cost and complexity of compliance can be substantial, especially for new entrants and smaller players in the market. For example, achieving GMP certification involves considerable financial investment in production processes, testing, and quality assurance measures. Despite these challenges, adherence to stringent standards can ultimately serve as a market differentiator, distinguishing high-quality products in a crowded marketplace. Therefore, while these regulations restrain market entry, they simultaneously enhance market stability and growth by ensuring that only high-quality, compliant products reach consumers.
Potential Side Effects and Safety Concerns: A Dual-Edged Sword for Market Dynamics
The potential side effects and safety concerns associated with vitamin consumption play a dual role in the market's dynamics. On one hand, these concerns can act as a deterrent, influencing consumer behavior and potentially slowing market growth. For instance, excessive intake of fat-soluble vitamins such as Vitamin A can lead to toxicity, causing serious health issues such as liver damage and increased pressure on the brain. This risk of side effects can lead to increased consumer caution, impacting the sales of certain vitamin products.
On the other hand, these safety concerns also drive innovation and research within the industry, leading to the development of safer, more effective formulations. The market has seen a rise in the demand for naturally sourced vitamins and those with enhanced bioavailability, which are perceived as safer and more beneficial by consumers. Additionally, the industry has witnessed an increase in personalized vitamin solutions, tailored to individual health needs and reducing the risk of adverse effects.
Moreover, public awareness campaigns and educational initiatives by health organizations about the proper use of vitamins contribute to informed consumer choices, thereby mitigating safety concerns and supporting market growth.
By Type Analysis
Vitamin B dominates the 2023 Vitamins Market, essential for energy and metabolism.
In 2023, Vitamin B held a dominant market position in the "By Type" segment of the Vitamins market, reflecting its crucial role in metabolic processes and energy production. This segment, which includes Vitamin B, E, D, C, A, and K, showcases varied applications across multiple industries, including healthcare and pharmaceuticals, food and beverages, and personal care.
Vitamin E is followed closely, acclaimed for its antioxidant properties and benefits in skin care formulations and dietary supplements. The market demand for Vitamin D surged due to its essential role in bone health and immune system support, intensified by the global increase in awareness about vitamin D deficiency.
Vitamin C maintained a steady market share, driven by its popularity in immune boosting and its pivotal role in collagen synthesis, making it a favorite in both dietary supplements and cosmetics. Vitamin A was highlighted for its benefits in vision health and cell growth, leading to significant use in both medical therapies and fortified foods.
Lastly, Vitamin K has seen growth due to its applications in bone health and blood clotting processes. The expanding research on its benefits beyond clotting is opening new avenues for market expansion, particularly in the nutritional supplements sector. Collectively, these vitamins are integral to a robust health and wellness trend, influencing market dynamics significantly.
By Source Analysis
In 2023, Plant-based vitamins dominated the market, driven by consumer preference for natural products.
In 2023, Plants held a dominant market position in the "By Source" segment of the Vitamins market. This preference for plant-based sources is driven by the growing consumer inclination towards natural and organic products, as they are perceived to be safer and more sustainable compared to their synthetic counterparts. Plants, as a source, accounted for a significant share of the market, owing to these factors combined with the increasing vegan and vegetarian populations globally.
Meanwhile, animal sources also contributed notably to the market. Vitamins derived from animals are essential in catering to specific nutritional needs that are difficult to meet with plant-based vitamins alone, such as Vitamin B12, which is crucial for neurological health and is predominantly found in animal products.
The synthetic segment, while still substantial, has seen a slower growth rate. This trend is largely attributed to rising consumer awareness and skepticism towards synthetic additives in food and health products. However, synthetic vitamins continue to be pivotal in regions where cost-effectiveness and shelf stability are prioritized, providing essential nutrients without the constraints of natural source variability.
By Application Analysis
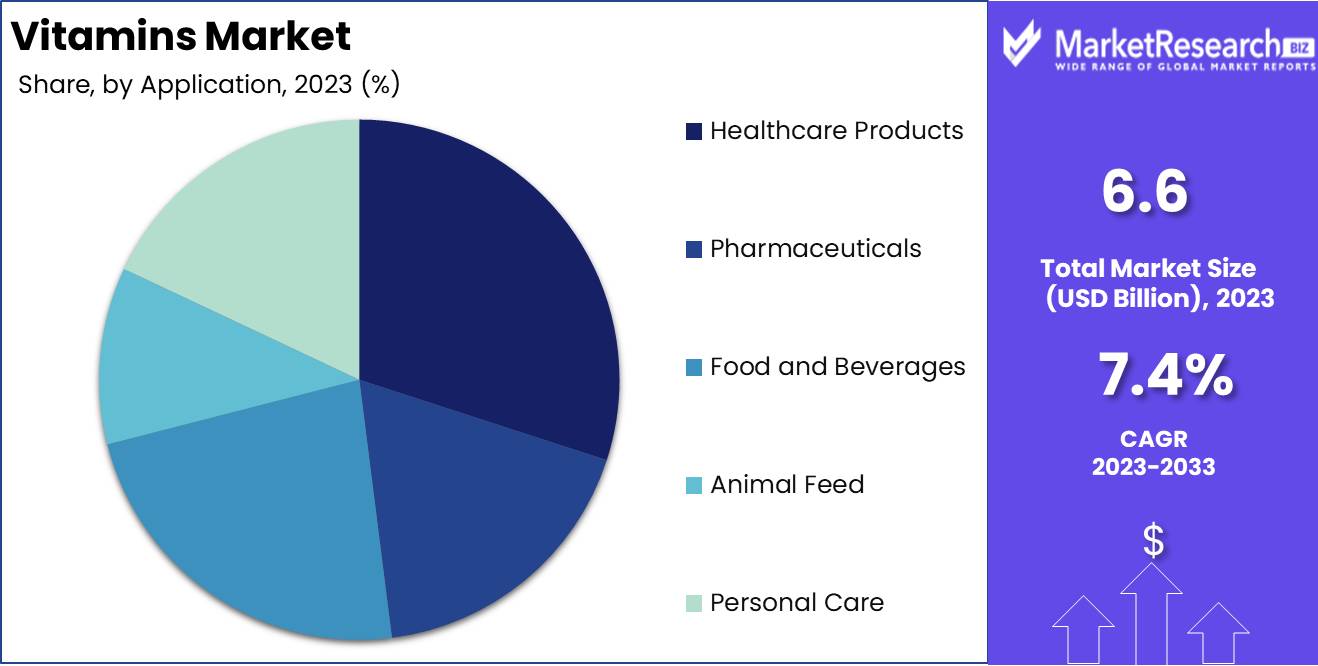
Healthcare Products dominate 2023 Vitamins Market enhancing overall health significantly.
In 2023, Healthcare Products held a dominant market position in the "By Application" segment of the Vitamins market. This segment leverages vitamins to enhance overall health outcomes and reduce the prevalence of chronic diseases. The substantial share held by Healthcare Products can be attributed to increased consumer awareness and growing health concerns, especially in the wake of global health crises.
Following closely, Pharmaceuticals also represent a significant portion of the market, utilizing vitamins in formulations to prevent deficiencies and support medical treatments. The synergy between pharmaceuticals and preventive health measures has fostered a robust growth trajectory in this segment.
The Food and Beverages sector capitalizes on the fortification of everyday consumables with vitamins, addressing public health goals by improving the nutritional quality of diets on a large scale. This segment has seen notable growth, driven by consumer preferences for functional and fortified foods.
Animal Feed is another vital segment, where vitamins are essential for the health and productivity of livestock and pets. This sector emphasizes the importance of nutritional additives to enhance growth, reproduction, and overall health of animals.
Lastly, the Personal Care segment integrates vitamins into products to enhance skin, hair, and nail health, aligning with the rising demand for natural and nutrient-rich personal care products. This trend reflects a broader consumer shift towards more holistic approaches to health and wellness.
Key Market Segments
By Type
- Vitamin B
- Vitamin E
- Vitamin D
- Vitamin C
- Vitamin A
- Vitamin K
By Source
- Plants
- Animals
- Synthetic
By Application
- Healthcare Products
- Pharmaceuticals
- Food and Beverages
- Animal Feed
- Personal Care
Growth Opportunity
Increasing Demand for Personalized Nutrition
The global vitamins market is poised for significant growth, driven by an increasing demand for personalized nutrition. As consumers become more health-conscious, there is a growing preference for tailored vitamin solutions that cater to individual nutritional needs. This trend is bolstered by advancements in technology, enabling companies to offer customized vitamin blends based on genetic, lifestyle, and health data. For instance, personalized vitamin subscription services have gained popularity, providing consumers with convenience and bespoke health solutions. This shift towards personalization is expected to drive market expansion, as it aligns with the broader trend of individualized healthcare.
Leveraging E-commerce and Direct-to-Consumer Sales
E-commerce and direct-to-consumer (DTC) sales channels present significant growth opportunities for the vitamins market. The convenience and accessibility of online shopping have revolutionized the way consumers purchase vitamins, particularly during the COVID-19 pandemic. The digital shift has led to the proliferation of online vitamin retailers and DTC brands, offering competitive pricing, subscription models, and targeted marketing strategies. Companies leveraging e-commerce platforms can reach a wider audience and gather valuable consumer insights to refine their product offerings. The integration of artificial intelligence and data analytics in online platforms further enhances the consumer experience, fostering brand loyalty and repeat purchases.
Latest Trends
Emerging New Supplement Categories: Innovation Driving Consumer Interest and Market Expansion
The vitamins market is witnessing a significant transformation with the emergence of new supplement categories. This trend is driven by increasing consumer awareness and demand for personalized health solutions. As individuals seek tailored options that address specific health concerns, companies are innovating beyond traditional multivitamins to include specialized supplements targeting areas such as cognitive enhancement, gut health, and immune support. This shift not only broadens the market landscape but also invites new entrants, fostering competition and innovation.
Hydration Boosters: Integrating Essential Vitamins for Enhanced Daily Wellness
Another noteworthy trend in the vitamins market is the rise of hydration boosters. These products, which combine essential vitamins with hydration benefits, are becoming increasingly popular among health-conscious consumers. Hydration boosters offer a dual function; they not only help maintain optimal hydration levels but also provide a convenient way to consume vitamins that may be lacking in regular diets. This trend is particularly appealing in the fitness and wellness community, where maintaining hydration is crucial. As a result, these products are expected to see robust growth, influencing market dynamics and consumer purchasing patterns.
Regional Analysis
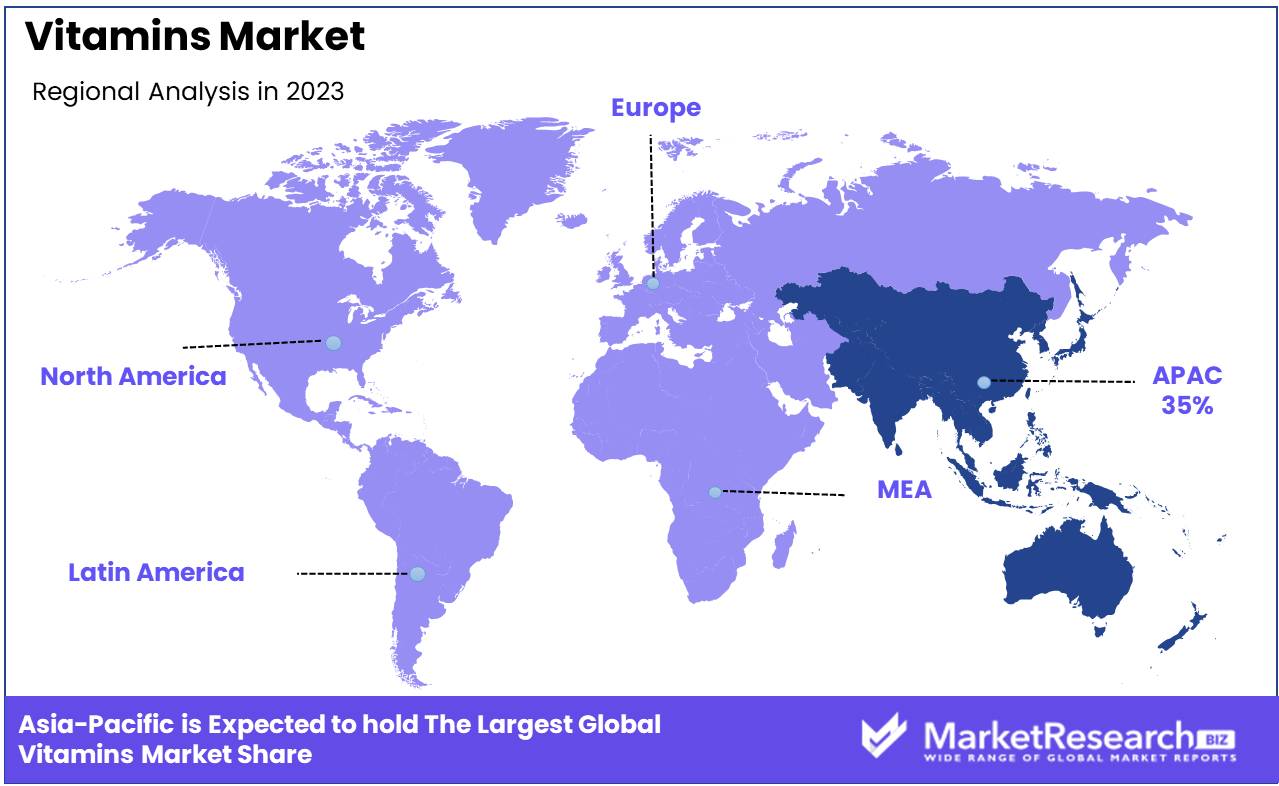
Asia Pacific leads the vitamins market with a 35% share and robust growth.
The global vitamins market exhibits distinct regional dynamics, influenced by dietary habits, health awareness, and economic conditions. In North America, the market is driven by a surge in health-conscious consumers and an aging population, leading to a robust demand for dietary supplements. Europe mirrors this trend, with a strong emphasis on preventative healthcare propelling the consumption of vitamins. The European market benefits from stringent regulations ensuring high product quality, which boosts consumer trust.
Asia Pacific emerges as the dominating region in the vitamins market, accounting for approximately 35% of the global share. This dominance is fueled by increasing disposable incomes, urbanization, and growing awareness about nutritional deficiencies, particularly in countries like China and India. The region's market is expected to expand at a compound annual growth rate (CAGR) of 7.5% through the forecast period.
In contrast, the Middle East & Africa and Latin America markets are developing, with growth driven by improving healthcare infrastructure and rising health awareness among the middle class. These regions are witnessing increased investments from major global players who are tapping into the untapped potential of these markets, albeit from a smaller base compared to Asia Pacific and North America.
Key Regions and Countries
North America
- The US
- Canada
- Rest of North America
Europe
- Germany
- France
- The UK
- Spain
- Netherlands
- Russia
- Italy
- Rest of Europe
Asia-Pacific
- China
- Japan
- Singapore
- Thailand
- South Korea
- Vietnam
- India
- New Zealand
- Rest of Asia Pacific
Latin America
- Mexico
- Brazil
- Rest of Latin America
Middle East & Africa
- Saudi Arabia
- South Africa
- UAE
- Rest of the Middle East & Africa
Key Players Analysis
In the global vitamins market, key players such as BASF SE, DSM, and ADM continue to lead through strategic expansions and innovations. BASF SE and DSM have been prominent in enhancing their product portfolios and strengthening their global supply chains, which is pivotal in maintaining their market dominance. ADM's focus on integrating sustainability in its production processes appeals to the growing consumer demand for environmentally responsible sourcing.
SternVitamin GmbH & Co. KG and Glanbia plc are leveraging their expertise in tailored vitamin blends to cater to specific consumer health needs, thereby securing a competitive edge. The agility of these companies in adapting to consumer preferences aligns with market demands for customized nutrition solutions.
Lonza and Vitablend Nederland BV stand out with their advancements in encapsulation technologies which improve the stability and efficacy of vitamin supplements. This technological edge is crucial in markets where consumer preferences lean towards high-efficacy products.
Emerging players like Zagro and Wright Enrichment Inc. are expanding their geographic footprint, particularly in underserved markets, which could disrupt traditional market dynamics. Similarly, companies like Adisseo and Showa Denko K.K. are investing in R&D to innovate in the synthesis and delivery of vitamins, enhancing their competitive positioning.
Farbest Brands, Jubilant Life Sciences Ltd., and Vertellus Holdings LLC are focusing on regulatory compliance and high-quality manufacturing processes to maintain trust and reliability among consumers, which is essential in retaining market share in a highly regulated environment.
Market Key Players
- BASF SE
- DSM
- ADM
- SternVitamin GmbH & Co. KG
- Glanbia plc
- Lonza
- Vitablend Nederland BV
- Zagro.
- Wright Enrichment Inc.
- Adisseo
- Showa Denko K.K.
- Farbest Brands
- Jubilant Life Sciences Ltd.
- Vertellus Holdings LLC
Recent Development
- In June 2024, GNC Holdings announced a breakthrough in the development of a new formula that enhances the absorption of vitamins D and K. This innovation aims to improve bone health and cardiovascular health, addressing deficiencies more effectively.
- In April 2024, Pfizer Inc. acquired Bionutrients Ltd., a leading innovator in natural and organic vitamin solutions. This acquisition is part of Pfizer's strategy to expand its footprint in the natural supplements market.
- In March 2024, BASF SE announced the expansion of its vitamin A and E production facilities in Ludwigshafen, Germany. The expansion is aimed at increasing the company's production capacity to meet the growing global demand for vitamin supplements.
Report Scope
Report Features Description Market Value (2023) USD 6.6 Billion Forecast Revenue (2033) USD 13.2 Billion CAGR (2024-2032) 7.4% Base Year for Estimation 2023 Historic Period 2016-2023 Forecast Period 2024-2033 Report Coverage Revenue Forecast, Market Dynamics, COVID-19 Impact, Competitive Landscape, Recent Developments Segments Covered By Type (Vitamin B, Vitamin E, Vitamin D, Vitamin C, Vitamin A, Vitamin K), By Source (Plants, Animals, Synthetic), By Application (Healthcare Products, Pharmaceuticals, Food and Beverages, Animal Feed, Personal Care) Regional Analysis North America - The US, Canada, Rest of North America, Europe - Germany, France, The UK, Spain, Italy, Russia, Netherlands, Rest of Europe, Asia-Pacific - China, Japan, South Korea, India, New Zealand, Singapore, Thailand, Vietnam, Rest of Asia Pacific, Latin America - Brazil, Mexico, Rest of Latin America, Middle East & Africa - South Africa, Saudi Arabia, UAE, Rest of Middle East & Africa Competitive Landscape BASF SE, DSM, ADM, SternVitamin GmbH & Co. KG, Glanbia plc, Lonza, Vitablend Nederland BV, Zagro, Wright Enrichment Inc., Adisseo, Showa Denko K.K., Farbest Brands, Jubilant Life Sciences Ltd., Vertellus Holdings LLC Customization Scope Customization for segments, region/country-level will be provided. Moreover, additional customization can be done based on the requirements. Purchase Options We have three licenses to opt for Single User License, Multi-User License (Up to 5 Users), Corporate Use License (Unlimited User and Printable PDF) -
- 1. Executive Summary
- 1.1. Definition
- 1.2. Taxonomy
- 1.3. Research Scope
- 1.4. Key Analysis
- 1.5. Key Findings by Major Segments
- 1.6. Top strategies by Major Players
- 2. Global Vitamins market Overview
- 2.1. Vitamins market Dynamics
- 2.1.1. Drivers
- 2.1.2. Opportunities
- 2.1.3. Restraints
- 2.1.4. Challenges
- 2.2. Macro-economic Factors
- 2.3. Regulatory Framework
- 2.4. Market Investment Feasibility Index
- 2.5. PEST Analysis
- 2.6. PORTER’S Five Force Analysis
- 2.7. Drivers & Restraints Impact Analysis
- 2.8. Industry Chain Analysis
- 2.9. Cost Structure Analysis
- 2.10. Marketing Strategy
- 2.11. Russia-Ukraine War Impact Analysis
- 2.12. Opportunity Map Analysis
- 2.13. Market Competition Scenario Analysis
- 2.14. Product Life Cycle Analysis
- 2.15. Opportunity Orbits
- 2.16. Manufacturer Intensity Map
- 2.17. Major Companies sales by Value & Volume
- 2.1. Vitamins market Dynamics
- 3. Global Vitamins market Analysis, Opportunity and Forecast, 2016-2032
- 3.1. Global Vitamins market Analysis, 2016-2021
- 3.2. Global Vitamins market Opportunity and Forecast, 2023-2032
- 3.3. Global Vitamins market Analysis, Opportunity and Forecast, By Type, 2016-2032
- 3.3.1. Global Vitamins market Analysis by Type: Introduction
- 3.3.2. Market Size Absolute $ Opportunity Analysis and Forecast, By Type, 2016-2032
- 3.3.3. Vitamin B
- 3.3.4. Vitamin E
- 3.3.5. Vitamin D
- 3.3.6. Vitamin C
- 3.3.7. Vitamin A
- 3.3.8. Vitamin K
- 3.4. Global Vitamins market Analysis, Opportunity and Forecast, By Source, 2016-2032
- 3.4.1. Global Vitamins market Analysis by Source: Introduction
- 3.4.2. Market Size Absolute $ Opportunity Analysis and Forecast, By Source, 2016-2032
- 3.4.3. Plants
- 3.4.4. Animals
- 3.4.5. Synthetic
- 3.5. Global Vitamins market Analysis, Opportunity and Forecast, By Application, 2016-2032
- 3.5.1. Global Vitamins market Analysis by Application: Introduction
- 3.5.2. Market Size Absolute $ Opportunity Analysis and Forecast, By Application, 2016-2032
- 3.5.3. Healthcare Products
- 3.5.4. Pharmaceuticals
- 3.5.5. Food and Beverages
- 3.5.6. Animal Feed
- 3.5.7. Personal Care
- 4. North America Vitamins market Analysis, Opportunity and Forecast, 2016-2032
- 4.1. North America Vitamins market Analysis, 2016-2021
- 4.2. North America Vitamins market Opportunity and Forecast, 2023-2032
- 4.3. North America Vitamins market Analysis, Opportunity and Forecast, By Type, 2016-2032
- 4.3.1. North America Vitamins market Analysis by Type: Introduction
- 4.3.2. Market Size Absolute $ Opportunity Analysis and Forecast, By Type, 2016-2032
- 4.3.3. Vitamin B
- 4.3.4. Vitamin E
- 4.3.5. Vitamin D
- 4.3.6. Vitamin C
- 4.3.7. Vitamin A
- 4.3.8. Vitamin K
- 4.4. North America Vitamins market Analysis, Opportunity and Forecast, By Source, 2016-2032
- 4.4.1. North America Vitamins market Analysis by Source: Introduction
- 4.4.2. Market Size Absolute $ Opportunity Analysis and Forecast, By Source, 2016-2032
- 4.4.3. Plants
- 4.4.4. Animals
- 4.4.5. Synthetic
- 4.5. North America Vitamins market Analysis, Opportunity and Forecast, By Application, 2016-2032
- 4.5.1. North America Vitamins market Analysis by Application: Introduction
- 4.5.2. Market Size Absolute $ Opportunity Analysis and Forecast, By Application, 2016-2032
- 4.5.3. Healthcare Products
- 4.5.4. Pharmaceuticals
- 4.5.5. Food and Beverages
- 4.5.6. Animal Feed
- 4.5.7. Personal Care
- 4.6. North America Vitamins market Analysis, Opportunity and Forecast, By Country , 2016-2032
- 4.6.1. North America Vitamins market Analysis by Country : Introduction
- 4.6.2. Market Size Absolute $ Opportunity Analysis and Forecast, Country , 2016-2032
- 4.6.2.1. The US
- 4.6.2.2. Canada
- 4.6.2.3. Mexico
- 5. Western Europe Vitamins market Analysis, Opportunity and Forecast, 2016-2032
- 5.1. Western Europe Vitamins market Analysis, 2016-2021
- 5.2. Western Europe Vitamins market Opportunity and Forecast, 2023-2032
- 5.3. Western Europe Vitamins market Analysis, Opportunity and Forecast, By Type, 2016-2032
- 5.3.1. Western Europe Vitamins market Analysis by Type: Introduction
- 5.3.2. Market Size Absolute $ Opportunity Analysis and Forecast, By Type, 2016-2032
- 5.3.3. Vitamin B
- 5.3.4. Vitamin E
- 5.3.5. Vitamin D
- 5.3.6. Vitamin C
- 5.3.7. Vitamin A
- 5.3.8. Vitamin K
- 5.4. Western Europe Vitamins market Analysis, Opportunity and Forecast, By Source, 2016-2032
- 5.4.1. Western Europe Vitamins market Analysis by Source: Introduction
- 5.4.2. Market Size Absolute $ Opportunity Analysis and Forecast, By Source, 2016-2032
- 5.4.3. Plants
- 5.4.4. Animals
- 5.4.5. Synthetic
- 5.5. Western Europe Vitamins market Analysis, Opportunity and Forecast, By Application, 2016-2032
- 5.5.1. Western Europe Vitamins market Analysis by Application: Introduction
- 5.5.2. Market Size Absolute $ Opportunity Analysis and Forecast, By Application, 2016-2032
- 5.5.3. Healthcare Products
- 5.5.4. Pharmaceuticals
- 5.5.5. Food and Beverages
- 5.5.6. Animal Feed
- 5.5.7. Personal Care
- 5.6. Western Europe Vitamins market Analysis, Opportunity and Forecast, By Country , 2016-2032
- 5.6.1. Western Europe Vitamins market Analysis by Country : Introduction
- 5.6.2. Market Size Absolute $ Opportunity Analysis and Forecast, Country , 2016-2032
- 5.6.2.1. Germany
- 5.6.2.2. France
- 5.6.2.3. The UK
- 5.6.2.4. Spain
- 5.6.2.5. Italy
- 5.6.2.6. Portugal
- 5.6.2.7. Ireland
- 5.6.2.8. Austria
- 5.6.2.9. Switzerland
- 5.6.2.10. Benelux
- 5.6.2.11. Nordic
- 5.6.2.12. Rest of Western Europe
- 6. Eastern Europe Vitamins market Analysis, Opportunity and Forecast, 2016-2032
- 6.1. Eastern Europe Vitamins market Analysis, 2016-2021
- 6.2. Eastern Europe Vitamins market Opportunity and Forecast, 2023-2032
- 6.3. Eastern Europe Vitamins market Analysis, Opportunity and Forecast, By Type, 2016-2032
- 6.3.1. Eastern Europe Vitamins market Analysis by Type: Introduction
- 6.3.2. Market Size Absolute $ Opportunity Analysis and Forecast, By Type, 2016-2032
- 6.3.3. Vitamin B
- 6.3.4. Vitamin E
- 6.3.5. Vitamin D
- 6.3.6. Vitamin C
- 6.3.7. Vitamin A
- 6.3.8. Vitamin K
- 6.4. Eastern Europe Vitamins market Analysis, Opportunity and Forecast, By Source, 2016-2032
- 6.4.1. Eastern Europe Vitamins market Analysis by Source: Introduction
- 6.4.2. Market Size Absolute $ Opportunity Analysis and Forecast, By Source, 2016-2032
- 6.4.3. Plants
- 6.4.4. Animals
- 6.4.5. Synthetic
- 6.5. Eastern Europe Vitamins market Analysis, Opportunity and Forecast, By Application, 2016-2032
- 6.5.1. Eastern Europe Vitamins market Analysis by Application: Introduction
- 6.5.2. Market Size Absolute $ Opportunity Analysis and Forecast, By Application, 2016-2032
- 6.5.3. Healthcare Products
- 6.5.4. Pharmaceuticals
- 6.5.5. Food and Beverages
- 6.5.6. Animal Feed
- 6.5.7. Personal Care
- 6.6. Eastern Europe Vitamins market Analysis, Opportunity and Forecast, By Country , 2016-2032
- 6.6.1. Eastern Europe Vitamins market Analysis by Country : Introduction
- 6.6.2. Market Size Absolute $ Opportunity Analysis and Forecast, Country , 2016-2032
- 6.6.2.1. Russia
- 6.6.2.2. Poland
- 6.6.2.3. The Czech Republic
- 6.6.2.4. Greece
- 6.6.2.5. Rest of Eastern Europe
- 7. APAC Vitamins market Analysis, Opportunity and Forecast, 2016-2032
- 7.1. APAC Vitamins market Analysis, 2016-2021
- 7.2. APAC Vitamins market Opportunity and Forecast, 2023-2032
- 7.3. APAC Vitamins market Analysis, Opportunity and Forecast, By Type, 2016-2032
- 7.3.1. APAC Vitamins market Analysis by Type: Introduction
- 7.3.2. Market Size Absolute $ Opportunity Analysis and Forecast, By Type, 2016-2032
- 7.3.3. Vitamin B
- 7.3.4. Vitamin E
- 7.3.5. Vitamin D
- 7.3.6. Vitamin C
- 7.3.7. Vitamin A
- 7.3.8. Vitamin K
- 7.4. APAC Vitamins market Analysis, Opportunity and Forecast, By Source, 2016-2032
- 7.4.1. APAC Vitamins market Analysis by Source: Introduction
- 7.4.2. Market Size Absolute $ Opportunity Analysis and Forecast, By Source, 2016-2032
- 7.4.3. Plants
- 7.4.4. Animals
- 7.4.5. Synthetic
- 7.5. APAC Vitamins market Analysis, Opportunity and Forecast, By Application, 2016-2032
- 7.5.1. APAC Vitamins market Analysis by Application: Introduction
- 7.5.2. Market Size Absolute $ Opportunity Analysis and Forecast, By Application, 2016-2032
- 7.5.3. Healthcare Products
- 7.5.4. Pharmaceuticals
- 7.5.5. Food and Beverages
- 7.5.6. Animal Feed
- 7.5.7. Personal Care
- 7.6. APAC Vitamins market Analysis, Opportunity and Forecast, By Country , 2016-2032
- 7.6.1. APAC Vitamins market Analysis by Country : Introduction
- 7.6.2. Market Size Absolute $ Opportunity Analysis and Forecast, Country , 2016-2032
- 7.6.2.1. China
- 7.6.2.2. Japan
- 7.6.2.3. South Korea
- 7.6.2.4. India
- 7.6.2.5. Australia & New Zeland
- 7.6.2.6. Indonesia
- 7.6.2.7. Malaysia
- 7.6.2.8. Philippines
- 7.6.2.9. Singapore
- 7.6.2.10. Thailand
- 7.6.2.11. Vietnam
- 7.6.2.12. Rest of APAC
- 8. Latin America Vitamins market Analysis, Opportunity and Forecast, 2016-2032
- 8.1. Latin America Vitamins market Analysis, 2016-2021
- 8.2. Latin America Vitamins market Opportunity and Forecast, 2023-2032
- 8.3. Latin America Vitamins market Analysis, Opportunity and Forecast, By Type, 2016-2032
- 8.3.1. Latin America Vitamins market Analysis by Type: Introduction
- 8.3.2. Market Size Absolute $ Opportunity Analysis and Forecast, By Type, 2016-2032
- 8.3.3. Vitamin B
- 8.3.4. Vitamin E
- 8.3.5. Vitamin D
- 8.3.6. Vitamin C
- 8.3.7. Vitamin A
- 8.3.8. Vitamin K
- 8.4. Latin America Vitamins market Analysis, Opportunity and Forecast, By Source, 2016-2032
- 8.4.1. Latin America Vitamins market Analysis by Source: Introduction
- 8.4.2. Market Size Absolute $ Opportunity Analysis and Forecast, By Source, 2016-2032
- 8.4.3. Plants
- 8.4.4. Animals
- 8.4.5. Synthetic
- 8.5. Latin America Vitamins market Analysis, Opportunity and Forecast, By Application, 2016-2032
- 8.5.1. Latin America Vitamins market Analysis by Application: Introduction
- 8.5.2. Market Size Absolute $ Opportunity Analysis and Forecast, By Application, 2016-2032
- 8.5.3. Healthcare Products
- 8.5.4. Pharmaceuticals
- 8.5.5. Food and Beverages
- 8.5.6. Animal Feed
- 8.5.7. Personal Care
- 8.6. Latin America Vitamins market Analysis, Opportunity and Forecast, By Country , 2016-2032
- 8.6.1. Latin America Vitamins market Analysis by Country : Introduction
- 8.6.2. Market Size Absolute $ Opportunity Analysis and Forecast, Country , 2016-2032
- 8.6.2.1. Brazil
- 8.6.2.2. Colombia
- 8.6.2.3. Chile
- 8.6.2.4. Argentina
- 8.6.2.5. Costa Rica
- 8.6.2.6. Rest of Latin America
- 9. Middle East & Africa Vitamins market Analysis, Opportunity and Forecast, 2016-2032
- 9.1. Middle East & Africa Vitamins market Analysis, 2016-2021
- 9.2. Middle East & Africa Vitamins market Opportunity and Forecast, 2023-2032
- 9.3. Middle East & Africa Vitamins market Analysis, Opportunity and Forecast, By Type, 2016-2032
- 9.3.1. Middle East & Africa Vitamins market Analysis by Type: Introduction
- 9.3.2. Market Size Absolute $ Opportunity Analysis and Forecast, By Type, 2016-2032
- 9.3.3. Vitamin B
- 9.3.4. Vitamin E
- 9.3.5. Vitamin D
- 9.3.6. Vitamin C
- 9.3.7. Vitamin A
- 9.3.8. Vitamin K
- 9.4. Middle East & Africa Vitamins market Analysis, Opportunity and Forecast, By Source, 2016-2032
- 9.4.1. Middle East & Africa Vitamins market Analysis by Source: Introduction
- 9.4.2. Market Size Absolute $ Opportunity Analysis and Forecast, By Source, 2016-2032
- 9.4.3. Plants
- 9.4.4. Animals
- 9.4.5. Synthetic
- 9.5. Middle East & Africa Vitamins market Analysis, Opportunity and Forecast, By Application, 2016-2032
- 9.5.1. Middle East & Africa Vitamins market Analysis by Application: Introduction
- 9.5.2. Market Size Absolute $ Opportunity Analysis and Forecast, By Application, 2016-2032
- 9.5.3. Healthcare Products
- 9.5.4. Pharmaceuticals
- 9.5.5. Food and Beverages
- 9.5.6. Animal Feed
- 9.5.7. Personal Care
- 9.6. Middle East & Africa Vitamins market Analysis, Opportunity and Forecast, By Country , 2016-2032
- 9.6.1. Middle East & Africa Vitamins market Analysis by Country : Introduction
- 9.6.2. Market Size Absolute $ Opportunity Analysis and Forecast, Country , 2016-2032
- 9.6.2.1. Algeria
- 9.6.2.2. Egypt
- 9.6.2.3. Israel
- 9.6.2.4. Kuwait
- 9.6.2.5. Nigeria
- 9.6.2.6. Saudi Arabia
- 9.6.2.7. South Africa
- 9.6.2.8. Turkey
- 9.6.2.9. The UAE
- 9.6.2.10. Rest of MEA
- 10. Global Vitamins market Analysis, Opportunity and Forecast, By Region , 2016-2032
- 10.1. Global Vitamins market Analysis by Region : Introduction
- 10.2. Market Size Absolute $ Opportunity Analysis and Forecast, By Region , 2016-2032
- 10.2.1. North America
- 10.2.2. Western Europe
- 10.2.3. Eastern Europe
- 10.2.4. APAC
- 10.2.5. Latin America
- 10.2.6. Middle East & Africa
- 11. Global Vitamins market Competitive Landscape, Market Share Analysis, and Company Profiles
- 11.1. Market Share Analysis
- 11.2. Company Profiles
- 11.3. BASF SE
- 11.3.1. Company Overview
- 11.3.2. Financial Highlights
- 11.3.3. Product Portfolio
- 11.3.4. SWOT Analysis
- 11.3.5. Key Strategies and Developments
- 11.4. DSM
- 11.4.1. Company Overview
- 11.4.2. Financial Highlights
- 11.4.3. Product Portfolio
- 11.4.4. SWOT Analysis
- 11.4.5. Key Strategies and Developments
- 11.5. ADM
- 11.5.1. Company Overview
- 11.5.2. Financial Highlights
- 11.5.3. Product Portfolio
- 11.5.4. SWOT Analysis
- 11.5.5. Key Strategies and Developments
- 11.6. SternVitamin GmbH & Co. KG
- 11.6.1. Company Overview
- 11.6.2. Financial Highlights
- 11.6.3. Product Portfolio
- 11.6.4. SWOT Analysis
- 11.6.5. Key Strategies and Developments
- 11.7. Glanbia plc
- 11.7.1. Company Overview
- 11.7.2. Financial Highlights
- 11.7.3. Product Portfolio
- 11.7.4. SWOT Analysis
- 11.7.5. Key Strategies and Developments
- 11.8. Lonza
- 11.8.1. Company Overview
- 11.8.2. Financial Highlights
- 11.8.3. Product Portfolio
- 11.8.4. SWOT Analysis
- 11.8.5. Key Strategies and Developments
- 11.9. Vitablend Nederland BV
- 11.9.1. Company Overview
- 11.9.2. Financial Highlights
- 11.9.3. Product Portfolio
- 11.9.4. SWOT Analysis
- 11.9.5. Key Strategies and Developments
- 11.10. Zagro.
- 11.10.1. Company Overview
- 11.10.2. Financial Highlights
- 11.10.3. Product Portfolio
- 11.10.4. SWOT Analysis
- 11.10.5. Key Strategies and Developments
- 11.11. Wright Enrichment Inc.
- 11.11.1. Company Overview
- 11.11.2. Financial Highlights
- 11.11.3. Product Portfolio
- 11.11.4. SWOT Analysis
- 11.11.5. Key Strategies and Developments
- 11.12. Adisseo
- 11.12.1. Company Overview
- 11.12.2. Financial Highlights
- 11.12.3. Product Portfolio
- 11.12.4. SWOT Analysis
- 11.12.5. Key Strategies and Developments
- 11.13.1. Company Overview
- 11.13.2. Financial Highlights
- 11.13.3. Product Portfolio
- 11.13.4. SWOT Analysis
- 11.13.5. Key Strategies and Developments
- 11.14. Showa Denko K.K.
- 11.14.1. Company Overview
- 11.14.2. Financial Highlights
- 11.14.3. Product Portfolio
- 11.14.4. SWOT Analysis
- 11.14.5. Key Strategies and Developments
- 11.15. Jubilant Life Sciences Ltd.
- 11.15.1. Company Overview
- 11.15.2. Financial Highlights
- 11.15.3. Product Portfolio
- 11.15.4. SWOT Analysis
- 11.15.5. Key Strategies and Developments
- 11.16. Vertellus Holdings LLC
- 11.16.1. Company Overview
- 11.16.2. Financial Highlights
- 11.16.3. Product Portfolio
- 11.16.4. SWOT Analysis
- 11.16.5. Key Strategies and Developments
- 12. Assumptions and Acronyms
- 13. Research Methodology
- 14. Contact
"
- List of Figures
- "
- Figure 1: Global Vitamins market Revenue (US$ Mn) Market Share by Type in 2022
- Figure 2: Global Vitamins market Market Attractiveness Analysis by Type, 2016-2032
- Figure 3: Global Vitamins market Revenue (US$ Mn) Market Share by Sourcein 2022
- Figure 4: Global Vitamins market Market Attractiveness Analysis by Source, 2016-2032
- Figure 5: Global Vitamins market Revenue (US$ Mn) Market Share by Applicationin 2022
- Figure 6: Global Vitamins market Market Attractiveness Analysis by Application, 2016-2032
- Figure 7: Global Vitamins market Revenue (US$ Mn) Market Share by Region in 2022
- Figure 8: Global Vitamins market Market Attractiveness Analysis by Region, 2016-2032
- Figure 9: Global Vitamins market Market Revenue (US$ Mn) (2016-2032)
- Figure 10: Global Vitamins market Market Revenue (US$ Mn) Comparison by Region (2016-2032)
- Figure 11: Global Vitamins market Market Revenue (US$ Mn) Comparison by Type (2016-2032)
- Figure 12: Global Vitamins market Market Revenue (US$ Mn) Comparison by Source (2016-2032)
- Figure 13: Global Vitamins market Market Revenue (US$ Mn) Comparison by Application (2016-2032)
- Figure 14: Global Vitamins market Market Y-o-Y Growth Rate Comparison by Region (2016-2032)
- Figure 15: Global Vitamins market Market Y-o-Y Growth Rate Comparison by Type (2016-2032)
- Figure 16: Global Vitamins market Market Y-o-Y Growth Rate Comparison by Source (2016-2032)
- Figure 17: Global Vitamins market Market Y-o-Y Growth Rate Comparison by Application (2016-2032)
- Figure 18: Global Vitamins market Market Share Comparison by Region (2016-2032)
- Figure 19: Global Vitamins market Market Share Comparison by Type (2016-2032)
- Figure 20: Global Vitamins market Market Share Comparison by Source (2016-2032)
- Figure 21: Global Vitamins market Market Share Comparison by Application (2016-2032)
- Figure 22: North America Vitamins market Revenue (US$ Mn) Market Share by Typein 2022
- Figure 23: North America Vitamins market Market Attractiveness Analysis by Type, 2016-2032
- Figure 24: North America Vitamins market Revenue (US$ Mn) Market Share by Sourcein 2022
- Figure 25: North America Vitamins market Market Attractiveness Analysis by Source, 2016-2032
- Figure 26: North America Vitamins market Revenue (US$ Mn) Market Share by Applicationin 2022
- Figure 27: North America Vitamins market Market Attractiveness Analysis by Application, 2016-2032
- Figure 28: North America Vitamins market Revenue (US$ Mn) Market Share by Country in 2022
- Figure 29: North America Vitamins market Market Attractiveness Analysis by Country, 2016-2032
- Figure 30: North America Vitamins market Market Revenue (US$ Mn) (2016-2032)
- Figure 31: North America Vitamins market Market Revenue (US$ Mn) Comparison by Country (2016-2032)
- Figure 32: North America Vitamins market Market Revenue (US$ Mn) Comparison by Type (2016-2032)
- Figure 33: North America Vitamins market Market Revenue (US$ Mn) Comparison by Source (2016-2032)
- Figure 34: North America Vitamins market Market Revenue (US$ Mn) Comparison by Application (2016-2032)
- Figure 35: North America Vitamins market Market Y-o-Y Growth Rate Comparison by Country (2016-2032)
- Figure 36: North America Vitamins market Market Y-o-Y Growth Rate Comparison by Type (2016-2032)
- Figure 37: North America Vitamins market Market Y-o-Y Growth Rate Comparison by Source (2016-2032)
- Figure 38: North America Vitamins market Market Y-o-Y Growth Rate Comparison by Application (2016-2032)
- Figure 39: North America Vitamins market Market Share Comparison by Country (2016-2032)
- Figure 40: North America Vitamins market Market Share Comparison by Type (2016-2032)
- Figure 41: North America Vitamins market Market Share Comparison by Source (2016-2032)
- Figure 42: North America Vitamins market Market Share Comparison by Application (2016-2032)
- Figure 43: Western Europe Vitamins market Revenue (US$ Mn) Market Share by Typein 2022
- Figure 44: Western Europe Vitamins market Market Attractiveness Analysis by Type, 2016-2032
- Figure 45: Western Europe Vitamins market Revenue (US$ Mn) Market Share by Sourcein 2022
- Figure 46: Western Europe Vitamins market Market Attractiveness Analysis by Source, 2016-2032
- Figure 47: Western Europe Vitamins market Revenue (US$ Mn) Market Share by Applicationin 2022
- Figure 48: Western Europe Vitamins market Market Attractiveness Analysis by Application, 2016-2032
- Figure 49: Western Europe Vitamins market Revenue (US$ Mn) Market Share by Country in 2022
- Figure 50: Western Europe Vitamins market Market Attractiveness Analysis by Country, 2016-2032
- Figure 51: Western Europe Vitamins market Market Revenue (US$ Mn) (2016-2032)
- Figure 52: Western Europe Vitamins market Market Revenue (US$ Mn) Comparison by Country (2016-2032)
- Figure 53: Western Europe Vitamins market Market Revenue (US$ Mn) Comparison by Type (2016-2032)
- Figure 54: Western Europe Vitamins market Market Revenue (US$ Mn) Comparison by Source (2016-2032)
- Figure 55: Western Europe Vitamins market Market Revenue (US$ Mn) Comparison by Application (2016-2032)
- Figure 56: Western Europe Vitamins market Market Y-o-Y Growth Rate Comparison by Country (2016-2032)
- Figure 57: Western Europe Vitamins market Market Y-o-Y Growth Rate Comparison by Type (2016-2032)
- Figure 58: Western Europe Vitamins market Market Y-o-Y Growth Rate Comparison by Source (2016-2032)
- Figure 59: Western Europe Vitamins market Market Y-o-Y Growth Rate Comparison by Application (2016-2032)
- Figure 60: Western Europe Vitamins market Market Share Comparison by Country (2016-2032)
- Figure 61: Western Europe Vitamins market Market Share Comparison by Type (2016-2032)
- Figure 62: Western Europe Vitamins market Market Share Comparison by Source (2016-2032)
- Figure 63: Western Europe Vitamins market Market Share Comparison by Application (2016-2032)
- Figure 64: Eastern Europe Vitamins market Revenue (US$ Mn) Market Share by Typein 2022
- Figure 65: Eastern Europe Vitamins market Market Attractiveness Analysis by Type, 2016-2032
- Figure 66: Eastern Europe Vitamins market Revenue (US$ Mn) Market Share by Sourcein 2022
- Figure 67: Eastern Europe Vitamins market Market Attractiveness Analysis by Source, 2016-2032
- Figure 68: Eastern Europe Vitamins market Revenue (US$ Mn) Market Share by Applicationin 2022
- Figure 69: Eastern Europe Vitamins market Market Attractiveness Analysis by Application, 2016-2032
- Figure 70: Eastern Europe Vitamins market Revenue (US$ Mn) Market Share by Country in 2022
- Figure 71: Eastern Europe Vitamins market Market Attractiveness Analysis by Country, 2016-2032
- Figure 72: Eastern Europe Vitamins market Market Revenue (US$ Mn) (2016-2032)
- Figure 73: Eastern Europe Vitamins market Market Revenue (US$ Mn) Comparison by Country (2016-2032)
- Figure 74: Eastern Europe Vitamins market Market Revenue (US$ Mn) Comparison by Type (2016-2032)
- Figure 75: Eastern Europe Vitamins market Market Revenue (US$ Mn) Comparison by Source (2016-2032)
- Figure 76: Eastern Europe Vitamins market Market Revenue (US$ Mn) Comparison by Application (2016-2032)
- Figure 77: Eastern Europe Vitamins market Market Y-o-Y Growth Rate Comparison by Country (2016-2032)
- Figure 78: Eastern Europe Vitamins market Market Y-o-Y Growth Rate Comparison by Type (2016-2032)
- Figure 79: Eastern Europe Vitamins market Market Y-o-Y Growth Rate Comparison by Source (2016-2032)
- Figure 80: Eastern Europe Vitamins market Market Y-o-Y Growth Rate Comparison by Application (2016-2032)
- Figure 81: Eastern Europe Vitamins market Market Share Comparison by Country (2016-2032)
- Figure 82: Eastern Europe Vitamins market Market Share Comparison by Type (2016-2032)
- Figure 83: Eastern Europe Vitamins market Market Share Comparison by Source (2016-2032)
- Figure 84: Eastern Europe Vitamins market Market Share Comparison by Application (2016-2032)
- Figure 85: APAC Vitamins market Revenue (US$ Mn) Market Share by Typein 2022
- Figure 86: APAC Vitamins market Market Attractiveness Analysis by Type, 2016-2032
- Figure 87: APAC Vitamins market Revenue (US$ Mn) Market Share by Sourcein 2022
- Figure 88: APAC Vitamins market Market Attractiveness Analysis by Source, 2016-2032
- Figure 89: APAC Vitamins market Revenue (US$ Mn) Market Share by Applicationin 2022
- Figure 90: APAC Vitamins market Market Attractiveness Analysis by Application, 2016-2032
- Figure 91: APAC Vitamins market Revenue (US$ Mn) Market Share by Country in 2022
- Figure 92: APAC Vitamins market Market Attractiveness Analysis by Country, 2016-2032
- Figure 93: APAC Vitamins market Market Revenue (US$ Mn) (2016-2032)
- Figure 94: APAC Vitamins market Market Revenue (US$ Mn) Comparison by Country (2016-2032)
- Figure 95: APAC Vitamins market Market Revenue (US$ Mn) Comparison by Type (2016-2032)
- Figure 96: APAC Vitamins market Market Revenue (US$ Mn) Comparison by Source (2016-2032)
- Figure 97: APAC Vitamins market Market Revenue (US$ Mn) Comparison by Application (2016-2032)
- Figure 98: APAC Vitamins market Market Y-o-Y Growth Rate Comparison by Country (2016-2032)
- Figure 99: APAC Vitamins market Market Y-o-Y Growth Rate Comparison by Type (2016-2032)
- Figure 100: APAC Vitamins market Market Y-o-Y Growth Rate Comparison by Source (2016-2032)
- Figure 101: APAC Vitamins market Market Y-o-Y Growth Rate Comparison by Application (2016-2032)
- Figure 102: APAC Vitamins market Market Share Comparison by Country (2016-2032)
- Figure 103: APAC Vitamins market Market Share Comparison by Type (2016-2032)
- Figure 104: APAC Vitamins market Market Share Comparison by Source (2016-2032)
- Figure 105: APAC Vitamins market Market Share Comparison by Application (2016-2032)
- Figure 106: Latin America Vitamins market Revenue (US$ Mn) Market Share by Typein 2022
- Figure 107: Latin America Vitamins market Market Attractiveness Analysis by Type, 2016-2032
- Figure 108: Latin America Vitamins market Revenue (US$ Mn) Market Share by Sourcein 2022
- Figure 109: Latin America Vitamins market Market Attractiveness Analysis by Source, 2016-2032
- Figure 110: Latin America Vitamins market Revenue (US$ Mn) Market Share by Applicationin 2022
- Figure 111: Latin America Vitamins market Market Attractiveness Analysis by Application, 2016-2032
- Figure 112: Latin America Vitamins market Revenue (US$ Mn) Market Share by Country in 2022
- Figure 113: Latin America Vitamins market Market Attractiveness Analysis by Country, 2016-2032
- Figure 114: Latin America Vitamins market Market Revenue (US$ Mn) (2016-2032)
- Figure 115: Latin America Vitamins market Market Revenue (US$ Mn) Comparison by Country (2016-2032)
- Figure 116: Latin America Vitamins market Market Revenue (US$ Mn) Comparison by Type (2016-2032)
- Figure 117: Latin America Vitamins market Market Revenue (US$ Mn) Comparison by Source (2016-2032)
- Figure 118: Latin America Vitamins market Market Revenue (US$ Mn) Comparison by Application (2016-2032)
- Figure 119: Latin America Vitamins market Market Y-o-Y Growth Rate Comparison by Country (2016-2032)
- Figure 120: Latin America Vitamins market Market Y-o-Y Growth Rate Comparison by Type (2016-2032)
- Figure 121: Latin America Vitamins market Market Y-o-Y Growth Rate Comparison by Source (2016-2032)
- Figure 122: Latin America Vitamins market Market Y-o-Y Growth Rate Comparison by Application (2016-2032)
- Figure 123: Latin America Vitamins market Market Share Comparison by Country (2016-2032)
- Figure 124: Latin America Vitamins market Market Share Comparison by Type (2016-2032)
- Figure 125: Latin America Vitamins market Market Share Comparison by Source (2016-2032)
- Figure 126: Latin America Vitamins market Market Share Comparison by Application (2016-2032)
- Figure 127: Middle East & Africa Vitamins market Revenue (US$ Mn) Market Share by Typein 2022
- Figure 128: Middle East & Africa Vitamins market Market Attractiveness Analysis by Type, 2016-2032
- Figure 129: Middle East & Africa Vitamins market Revenue (US$ Mn) Market Share by Sourcein 2022
- Figure 130: Middle East & Africa Vitamins market Market Attractiveness Analysis by Source, 2016-2032
- Figure 131: Middle East & Africa Vitamins market Revenue (US$ Mn) Market Share by Applicationin 2022
- Figure 132: Middle East & Africa Vitamins market Market Attractiveness Analysis by Application, 2016-2032
- Figure 133: Middle East & Africa Vitamins market Revenue (US$ Mn) Market Share by Country in 2022
- Figure 134: Middle East & Africa Vitamins market Market Attractiveness Analysis by Country, 2016-2032
- Figure 135: Middle East & Africa Vitamins market Market Revenue (US$ Mn) (2016-2032)
- Figure 136: Middle East & Africa Vitamins market Market Revenue (US$ Mn) Comparison by Country (2016-2032)
- Figure 137: Middle East & Africa Vitamins market Market Revenue (US$ Mn) Comparison by Type (2016-2032)
- Figure 138: Middle East & Africa Vitamins market Market Revenue (US$ Mn) Comparison by Source (2016-2032)
- Figure 139: Middle East & Africa Vitamins market Market Revenue (US$ Mn) Comparison by Application (2016-2032)
- Figure 140: Middle East & Africa Vitamins market Market Y-o-Y Growth Rate Comparison by Country (2016-2032)
- Figure 141: Middle East & Africa Vitamins market Market Y-o-Y Growth Rate Comparison by Type (2016-2032)
- Figure 142: Middle East & Africa Vitamins market Market Y-o-Y Growth Rate Comparison by Source (2016-2032)
- Figure 143: Middle East & Africa Vitamins market Market Y-o-Y Growth Rate Comparison by Application (2016-2032)
- Figure 144: Middle East & Africa Vitamins market Market Share Comparison by Country (2016-2032)
- Figure 145: Middle East & Africa Vitamins market Market Share Comparison by Type (2016-2032)
- Figure 146: Middle East & Africa Vitamins market Market Share Comparison by Source (2016-2032)
- Figure 147: Middle East & Africa Vitamins market Market Share Comparison by Application (2016-2032)
"
- List of Tables
- "
- Table 1: Global Vitamins market Market Comparison by Type (2016-2032)
- Table 2: Global Vitamins market Market Comparison by Source (2016-2032)
- Table 3: Global Vitamins market Market Comparison by Application (2016-2032)
- Table 4: Global Vitamins market Revenue (US$ Mn) Comparison by Region (2016-2032)
- Table 5: Global Vitamins market Market Revenue (US$ Mn) (2016-2032)
- Table 6: Global Vitamins market Market Revenue (US$ Mn) Comparison by Region (2016-2032)
- Table 7: Global Vitamins market Market Revenue (US$ Mn) Comparison by Type (2016-2032)
- Table 8: Global Vitamins market Market Revenue (US$ Mn) Comparison by Source (2016-2032)
- Table 9: Global Vitamins market Market Revenue (US$ Mn) Comparison by Application (2016-2032)
- Table 10: Global Vitamins market Market Y-o-Y Growth Rate Comparison by Region (2016-2032)
- Table 11: Global Vitamins market Market Y-o-Y Growth Rate Comparison by Type (2016-2032)
- Table 12: Global Vitamins market Market Y-o-Y Growth Rate Comparison by Source (2016-2032)
- Table 13: Global Vitamins market Market Y-o-Y Growth Rate Comparison by Application (2016-2032)
- Table 14: Global Vitamins market Market Share Comparison by Region (2016-2032)
- Table 15: Global Vitamins market Market Share Comparison by Type (2016-2032)
- Table 16: Global Vitamins market Market Share Comparison by Source (2016-2032)
- Table 17: Global Vitamins market Market Share Comparison by Application (2016-2032)
- Table 18: North America Vitamins market Market Comparison by Source (2016-2032)
- Table 19: North America Vitamins market Market Comparison by Application (2016-2032)
- Table 20: North America Vitamins market Revenue (US$ Mn) Comparison by Country (2016-2032)
- Table 21: North America Vitamins market Market Revenue (US$ Mn) (2016-2032)
- Table 22: North America Vitamins market Market Revenue (US$ Mn) Comparison by Country (2016-2032)
- Table 23: North America Vitamins market Market Revenue (US$ Mn) Comparison by Type (2016-2032)
- Table 24: North America Vitamins market Market Revenue (US$ Mn) Comparison by Source (2016-2032)
- Table 25: North America Vitamins market Market Revenue (US$ Mn) Comparison by Application (2016-2032)
- Table 26: North America Vitamins market Market Y-o-Y Growth Rate Comparison by Country (2016-2032)
- Table 27: North America Vitamins market Market Y-o-Y Growth Rate Comparison by Type (2016-2032)
- Table 28: North America Vitamins market Market Y-o-Y Growth Rate Comparison by Source (2016-2032)
- Table 29: North America Vitamins market Market Y-o-Y Growth Rate Comparison by Application (2016-2032)
- Table 30: North America Vitamins market Market Share Comparison by Country (2016-2032)
- Table 31: North America Vitamins market Market Share Comparison by Type (2016-2032)
- Table 32: North America Vitamins market Market Share Comparison by Source (2016-2032)
- Table 33: North America Vitamins market Market Share Comparison by Application (2016-2032)
- Table 34: Western Europe Vitamins market Market Comparison by Type (2016-2032)
- Table 35: Western Europe Vitamins market Market Comparison by Source (2016-2032)
- Table 36: Western Europe Vitamins market Market Comparison by Application (2016-2032)
- Table 37: Western Europe Vitamins market Revenue (US$ Mn) Comparison by Country (2016-2032)
- Table 38: Western Europe Vitamins market Market Revenue (US$ Mn) (2016-2032)
- Table 39: Western Europe Vitamins market Market Revenue (US$ Mn) Comparison by Country (2016-2032)
- Table 40: Western Europe Vitamins market Market Revenue (US$ Mn) Comparison by Type (2016-2032)
- Table 41: Western Europe Vitamins market Market Revenue (US$ Mn) Comparison by Source (2016-2032)
- Table 42: Western Europe Vitamins market Market Revenue (US$ Mn) Comparison by Application (2016-2032)
- Table 43: Western Europe Vitamins market Market Y-o-Y Growth Rate Comparison by Country (2016-2032)
- Table 44: Western Europe Vitamins market Market Y-o-Y Growth Rate Comparison by Type (2016-2032)
- Table 45: Western Europe Vitamins market Market Y-o-Y Growth Rate Comparison by Source (2016-2032)
- Table 46: Western Europe Vitamins market Market Y-o-Y Growth Rate Comparison by Application (2016-2032)
- Table 47: Western Europe Vitamins market Market Share Comparison by Country (2016-2032)
- Table 48: Western Europe Vitamins market Market Share Comparison by Type (2016-2032)
- Table 49: Western Europe Vitamins market Market Share Comparison by Source (2016-2032)
- Table 50: Western Europe Vitamins market Market Share Comparison by Application (2016-2032)
- Table 51: Eastern Europe Vitamins market Market Comparison by Type (2016-2032)
- Table 52: Eastern Europe Vitamins market Market Comparison by Source (2016-2032)
- Table 53: Eastern Europe Vitamins market Market Comparison by Application (2016-2032)
- Table 54: Eastern Europe Vitamins market Revenue (US$ Mn) Comparison by Country (2016-2032)
- Table 55: Eastern Europe Vitamins market Market Revenue (US$ Mn) (2016-2032)
- Table 56: Eastern Europe Vitamins market Market Revenue (US$ Mn) Comparison by Country (2016-2032)
- Table 57: Eastern Europe Vitamins market Market Revenue (US$ Mn) Comparison by Type (2016-2032)
- Table 58: Eastern Europe Vitamins market Market Revenue (US$ Mn) Comparison by Source (2016-2032)
- Table 59: Eastern Europe Vitamins market Market Revenue (US$ Mn) Comparison by Application (2016-2032)
- Table 60: Eastern Europe Vitamins market Market Y-o-Y Growth Rate Comparison by Country (2016-2032)
- Table 61: Eastern Europe Vitamins market Market Y-o-Y Growth Rate Comparison by Type (2016-2032)
- Table 62: Eastern Europe Vitamins market Market Y-o-Y Growth Rate Comparison by Source (2016-2032)
- Table 63: Eastern Europe Vitamins market Market Y-o-Y Growth Rate Comparison by Application (2016-2032)
- Table 64: Eastern Europe Vitamins market Market Share Comparison by Country (2016-2032)
- Table 65: Eastern Europe Vitamins market Market Share Comparison by Type (2016-2032)
- Table 66: Eastern Europe Vitamins market Market Share Comparison by Source (2016-2032)
- Table 67: Eastern Europe Vitamins market Market Share Comparison by Application (2016-2032)
- Table 68: APAC Vitamins market Market Comparison by Type (2016-2032)
- Table 69: APAC Vitamins market Market Comparison by Source (2016-2032)
- Table 70: APAC Vitamins market Market Comparison by Application (2016-2032)
- Table 71: APAC Vitamins market Revenue (US$ Mn) Comparison by Country (2016-2032)
- Table 72: APAC Vitamins market Market Revenue (US$ Mn) (2016-2032)
- Table 73: APAC Vitamins market Market Revenue (US$ Mn) Comparison by Country (2016-2032)
- Table 74: APAC Vitamins market Market Revenue (US$ Mn) Comparison by Type (2016-2032)
- Table 75: APAC Vitamins market Market Revenue (US$ Mn) Comparison by Source (2016-2032)
- Table 76: APAC Vitamins market Market Revenue (US$ Mn) Comparison by Application (2016-2032)
- Table 77: APAC Vitamins market Market Y-o-Y Growth Rate Comparison by Country (2016-2032)
- Table 78: APAC Vitamins market Market Y-o-Y Growth Rate Comparison by Type (2016-2032)
- Table 79: APAC Vitamins market Market Y-o-Y Growth Rate Comparison by Source (2016-2032)
- Table 80: APAC Vitamins market Market Y-o-Y Growth Rate Comparison by Application (2016-2032)
- Table 81: APAC Vitamins market Market Share Comparison by Country (2016-2032)
- Table 82: APAC Vitamins market Market Share Comparison by Type (2016-2032)
- Table 83: APAC Vitamins market Market Share Comparison by Source (2016-2032)
- Table 84: APAC Vitamins market Market Share Comparison by Application (2016-2032)
- Table 85: Latin America Vitamins market Market Comparison by Type (2016-2032)
- Table 86: Latin America Vitamins market Market Comparison by Source (2016-2032)
- Table 87: Latin America Vitamins market Market Comparison by Application (2016-2032)
- Table 88: Latin America Vitamins market Revenue (US$ Mn) Comparison by Country (2016-2032)
- Table 89: Latin America Vitamins market Market Revenue (US$ Mn) (2016-2032)
- Table 90: Latin America Vitamins market Market Revenue (US$ Mn) Comparison by Country (2016-2032)
- Table 91: Latin America Vitamins market Market Revenue (US$ Mn) Comparison by Type (2016-2032)
- Table 92: Latin America Vitamins market Market Revenue (US$ Mn) Comparison by Source (2016-2032)
- Table 93: Latin America Vitamins market Market Revenue (US$ Mn) Comparison by Application (2016-2032)
- Table 94: Latin America Vitamins market Market Y-o-Y Growth Rate Comparison by Country (2016-2032)
- Table 95: Latin America Vitamins market Market Y-o-Y Growth Rate Comparison by Type (2016-2032)
- Table 96: Latin America Vitamins market Market Y-o-Y Growth Rate Comparison by Source (2016-2032)
- Table 97: Latin America Vitamins market Market Y-o-Y Growth Rate Comparison by Application (2016-2032)
- Table 98: Latin America Vitamins market Market Share Comparison by Country (2016-2032)
- Table 99: Latin America Vitamins market Market Share Comparison by Type (2016-2032)
- Table 100: Latin America Vitamins market Market Share Comparison by Source (2016-2032)
- Table 101: Latin America Vitamins market Market Share Comparison by Application (2016-2032)
- Table 102: Middle East & Africa Vitamins market Market Comparison by Type (2016-2032)
- Table 103: Middle East & Africa Vitamins market Market Comparison by Source (2016-2032)
- Table 104: Middle East & Africa Vitamins market Market Comparison by Application (2016-2032)
- Table 105: Middle East & Africa Vitamins market Revenue (US$ Mn) Comparison by Country (2016-2032)
- Table 106: Middle East & Africa Vitamins market Market Revenue (US$ Mn) (2016-2032)
- Table 107: Middle East & Africa Vitamins market Market Revenue (US$ Mn) Comparison by Country (2016-2032)
- Table 108: Middle East & Africa Vitamins market Market Revenue (US$ Mn) Comparison by Type (2016-2032)
- Table 109: Middle East & Africa Vitamins market Market Revenue (US$ Mn) Comparison by Source (2016-2032)
- Table 110: Middle East & Africa Vitamins market Market Revenue (US$ Mn) Comparison by Application (2016-2032)
- Table 111: Middle East & Africa Vitamins market Market Y-o-Y Growth Rate Comparison by Country (2016-2032)
- Table 112: Middle East & Africa Vitamins market Market Y-o-Y Growth Rate Comparison by Type (2016-2032)
- Table 113: Middle East & Africa Vitamins market Market Y-o-Y Growth Rate Comparison by Source (2016-2032)
- Table 114: Middle East & Africa Vitamins market Market Y-o-Y Growth Rate Comparison by Application (2016-2032)
- Table 115: Middle East & Africa Vitamins market Market Share Comparison by Country (2016-2032)
- Table 116: Middle East & Africa Vitamins market Market Share Comparison by Type (2016-2032)
- Table 117: Middle East & Africa Vitamins market Market Share Comparison by Source (2016-2032)
- Table 118: Middle East & Africa Vitamins market Market Share Comparison by Application (2016-2032)
- 1. Executive Summary
-
- BASF SE
- DSM
- ADM
- SternVitamin GmbH & Co. KG
- Glanbia plc
- Lonza
- Vitablend Nederland BV
- Zagro.
- Wright Enrichment Inc.
- Adisseo
- Showa Denko K.K.
- Farbest Brands
- Jubilant Life Sciences Ltd.
- Vertellus Holdings LLC
Our Clients


View Our Licence Options
