
Global Vitamin D3 Market By Form Type(Powder, Oil, Crystallized), By Application(Pharmaceuticals Industry, Food Industry, Feed Industry), By Region And Companies - Industry Segment Outlook, Market Assessment, Competition Scenario, Trends, And Forecast 2024-2033
-
17635
-
April 2024
-
300
-


-
This report was compiled by Trishita Deb Trishita Deb is an experienced market research and consulting professional with over 7 years of expertise across healthcare, consumer goods, and materials, contributing to over 400 healthcare-related reports. Correspondence Team Lead- Healthcare Linkedin | Detailed Market research Methodology Our methodology involves a mix of primary research, including interviews with leading mental health experts, and secondary research from reputable medical journals and databases. View Detailed Methodology Page
-
Quick Navigation
Report Overview
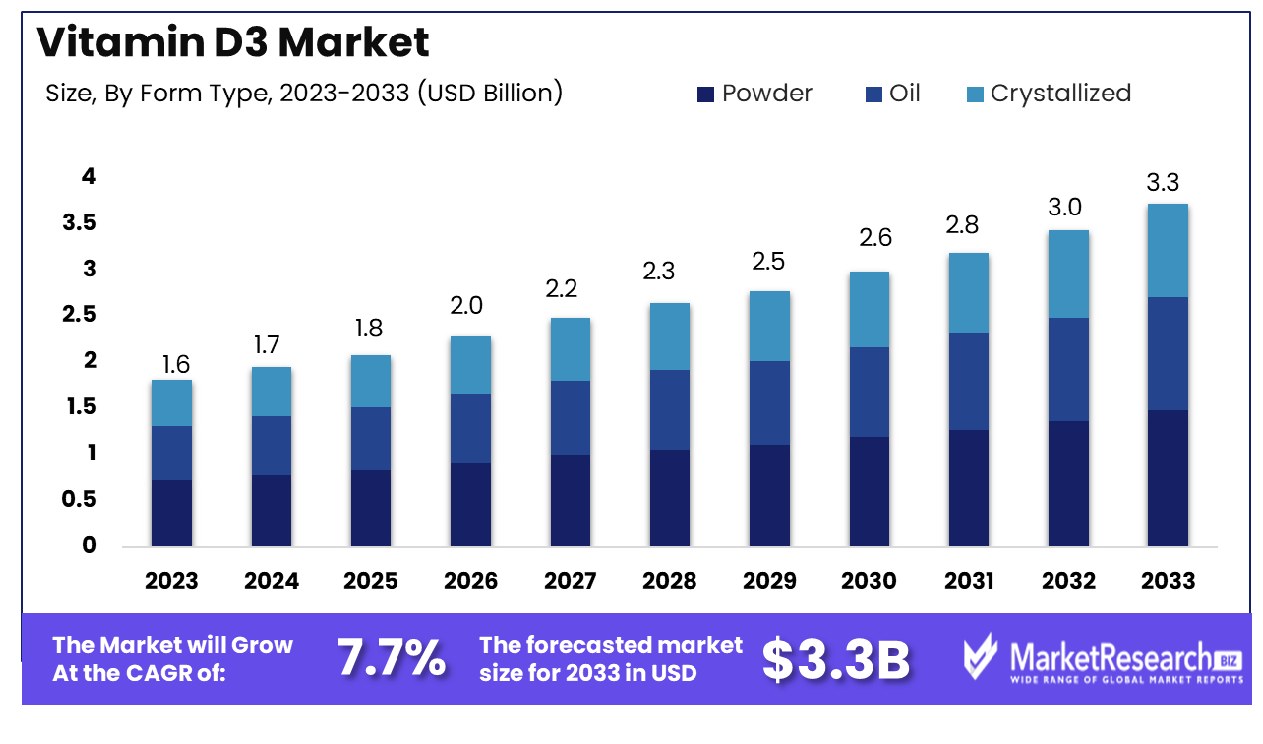
The Global Vitamin D3 Market was valued at USD 1.6 billion in 2023. It is expected to reach USD 3.3 billion by 2033, with a CAGR of 7.7% during the forecast period from 2024 to 2033.
The sudden rise in awareness regarding the importance of vitamin D3 and various other disorders related to vitamin D3 are some of the main driving factors for the vitamin D3 market expansion. Vitamin D3 is a soluble fat vitamin that is essential for bone health. It helps the body to consume calcium from food. It also controls the intake of calcium in the blood system and strengthens the skeleton.
Vitamin D3 is also called cholecalciferol. It is used as a food supplement in people who do not get ample amounts of vitamin D3 in their daily food to maintain suitable health. It is also known as a sunshine vitamin due to the D3 type that can naturally generated inside the body following direct contact with the sun. D3 is also found in animal foods and diet supplements.
Vitamin D3 has an important role in controlling the consumption of calcium from the food that is intake. It also helps with the function of the hormones and nervous system regulation. It is also essential for bone development and strength, growth of the cells, and maintaining a healthy immune system. Vitamin D3 directly comes from exposure to UV radiation from the sun.
Australian people require vitamin D3 from the sun but they mostly consume it in the form of UVB rays. Besides exposure to sunlight, there are also other ways to get vitamin D3. Vitamin D3 can be generally seen in fatty fish and seafood. They are among the rich natural food sources of vitamin D3. Vitamin D3 can be taken in the form of food such as mushrooms are a good source of vitamin D3 for vegetarians. Egg yolks can be added to the daily routine diet as they are an ideal source of vitamin D3.
Generally, vitamin D3 deficiency impacts the bones and muscles of the body. It particularly affects individuals with age above 65 years and people with dark skin tones, but this can be treated and prevented as well. According to the National Centre of Biotechnology Information in June 2022, there was the occurrence of osteoporosis, a type of bone disorder caused due to vitamin D3 deficiency in various countries such as 4.1 in the Netherlands, 52% in Turkey, 8% in Oceania, and 26.9% in Africa.
This vitamin D3 deficiency can be treated by following a proper diet with rich vitamin D3 food intake, supplements, exposure to sunlight, and regular healthcare consultation. The demand for vitamin D3 will increase due to its requirement in daily food products and its advantages towards health, this will help in market expansion in the forecast period.
Key Takeaways
- Market Growth: The Global Vitamin D3 Market was valued at USD 1.6 billion in 2023. It is expected to reach USD 3.3 billion by 2033, with a CAGR of 7.7% during the forecast period from 2024 to 2033.
- By Form Type: Powder form led with 55% market share dominance.
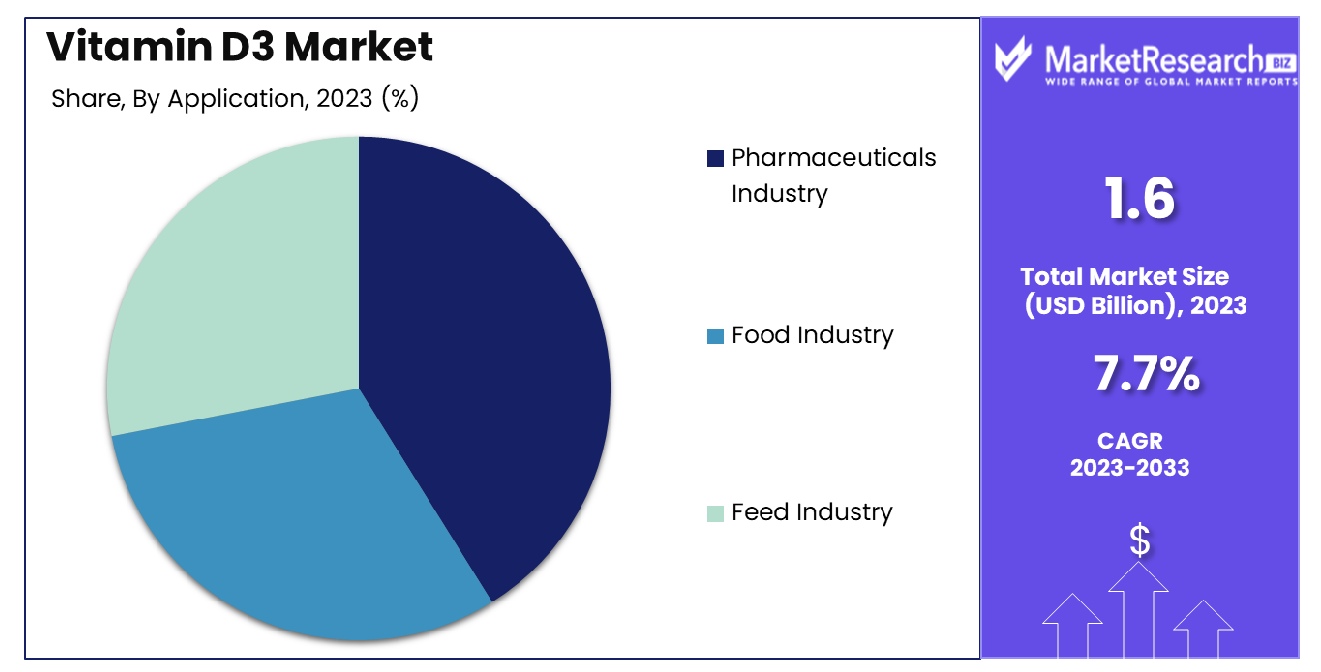
- By Application: Pharmaceuticals commanded 60% application sector.
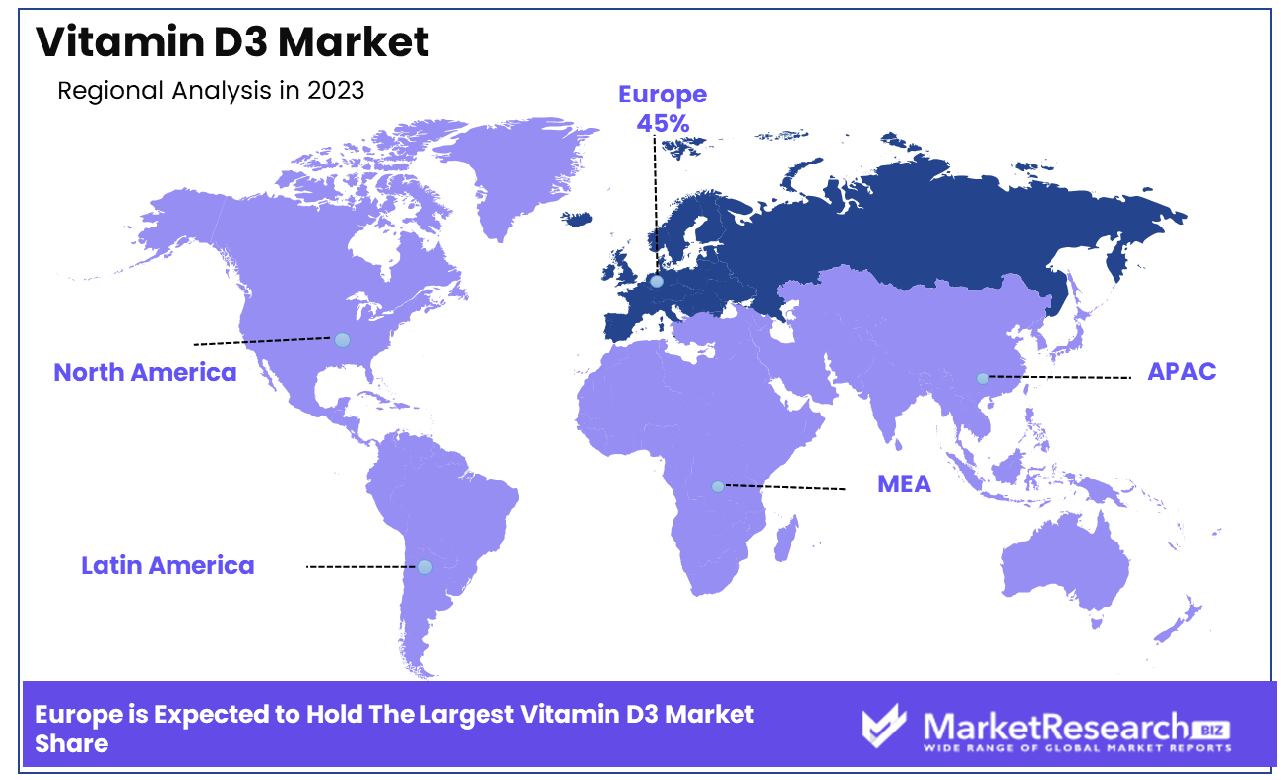
- Regional Dominance: Europe holds a 45% share of the global Vitamin D3 market.
- Growth Opportunity: The global Vitamin D3 market is growing, driven by heightened environmental sustainability awareness and advancements in energy storage, which promote sustainable sourcing and production practices.
Driving factors
Increasing Prevalence of Vitamin D Deficiency
The growing incidence of Vitamin D deficiency globally serves as a fundamental catalyst for the expansion of the Vitamin D3 market. Studies indicate that a significant portion of the population in both developed and developing countries shows insufficient levels of Vitamin D, largely due to modern indoor lifestyles and inadequate sun exposure.
This deficiency is linked to various health issues, including bone disorders and weakened immune systems. As public awareness of these health risks increases, so does the demand for Vitamin D3 supplements, providing a direct boost to the market.
Health Benefits of Vitamin D3
Vitamin D3 is acclaimed for its extensive health benefits, which include enhancing bone health, supporting cardiovascular function, and bolstering the immune system. The vitamin's role in calcium absorption is critical for maintaining strong bones and preventing osteoporosis. Moreover, emerging research suggests potential benefits in reducing the risk of chronic diseases such as type 2 diabetes and multiple sclerosis.
These health advantages are well-communicated through medical communities and media, leading to heightened consumer sector interest and increased consumption of Vitamin D3 supplements and fortified foods.
Rising Health and Wellness Trends
The surge in health and wellness consciousness among consumers is significantly propelling the Vitamin D3 market. This trend is evidenced by increasing investments in health-enhancing products and a shift towards preventive healthcare measures. The market has seen a corresponding rise in the availability and variety of Vitamin D3-enriched products, including dairy products, cereals, and juices, as well as direct supplements.
This trend is not only a response to the growing demand but also fuels it by making Vitamin D3 more accessible and appealing to health-conscious consumer values.
Restraining Factors
Impact of Kidney Disorders on Market Growth
Excessive intake of Vitamin D3 can lead to serious health complications such as kidney disorders and the formation of calcium stones, which pose significant restraints on the market's growth. High levels of Vitamin D increase calcium absorption in the body, which, if unchecked, can result in hypercalcemia—excess calcium in the bloodstream.
This condition is linked to kidney stone formation and other renal issues, which can deter potential consumers concerned about the adverse effects of overconsumption. The awareness of these risks, often highlighted by health professionals and regulatory bodies, can lead to cautious consumer behavior, thereby slowing down market expansion.
Challenges of Raw Material Availability and Price Volatility
The availability of raw materials necessary for Vitamin D3 production significantly influences market stability and growth. Factors such as climatic changes, geopolitical issues, and economic instability can lead to fluctuations in the availability and cost of these raw materials, causing price volatility in the Vitamin D3 market.
Such instability can deter manufacturers from scaling production and may lead to higher retail prices, affecting consumer sector purchasing decisions and potentially slowing market growth.
By Form Type Analysis
The powder form dominated the market, accounting for 55% of total sales in the industry.
In 2023, the Vitamin D3 market witnessed a significant stratification within the "By Form Type" segment, where Powder, Oil, and Crystallized forms were key delineations. Of these, Powder held a dominant market position, capturing more than 55% of the market share. This form's prevalence is attributed to its widespread application across various industries, including pharmaceuticals, food and beverages, and animal feed, where its ease of integration into diverse product matrices offers considerable utility.
Oil-based Vitamin D3, while holding a smaller share, is noted for its high bioavailability and preferred use in dietary supplements and clinical nutrition products. The Oil form’s market traction is primarily driven by the consumer shift towards preventive healthcare measures and an increased awareness of wellness-focused lifestyles.
The Crystallized form, although the least common, is essential in niche applications that require precise dosages and high purity, such as in certain pharmaceutical formulations. Its market presence, while modest, is supported by stringent regulatory standards and high-quality requirements in medical applications.
Overall, the segmentation of the Vitamin D3 market by form reveals diversified consumer preferences and application-specific demands. The dominance of the Powder form can be largely ascribed to its versatility and compatibility with a broad range of products, underpinning its substantial market share.
Moving forward, the dynamics within this segment are expected to evolve, driven by technological advancements and shifting consumer preferences towards more efficacious and convenient product forms.
By Application Analysis
In application distribution, the pharmaceuticals sector led with a 60% share of the market.
In 2023, the Vitamin D3 market was distinctly segmented by application into the Pharmaceuticals Industry, Food Industry, and Feed Industry. Within these, the pharmaceutical industry held a dominant market position, capturing more than 60% of the segment share. This substantial share is underpinned by the critical role of Vitamin D3 in medical treatments and preventive health care, reflecting its extensive utilization in formulations aimed at combating vitamin D deficiency, enhancing bone health, and supporting immune function.
The Food Industry also leverages Vitamin D3 to fortify various food products, including dairy, cereals, and juices, which cater to the growing consumer demand for nutrient-enriched foods. This industry's share, while smaller, is driven by increasing health awareness and consumer preferences for fortified dietary sources choices that support overall wellness.
Meanwhile, the Feed Industry incorporates Vitamin D3 to enhance the nutritional quality of animal feed, thereby improving animal health and productivity. This application is essential for the production of high-quality poultry, dairy, and meat products, aligning with the global increase in protein consumption and sustainable animal farming practices.
Overall, the dominance of the pharmaceutical industry in the Vitamin D3 market can be attributed to the high value placed on health-enhancing ingredients in medical and health maintenance applications. The segment's robust performance is anticipated to continue as the research unfolds more benefits of Vitamin D3, potentially expanding its applications across the pharmaceutical spectrum. This evolution underscores a dynamic market environment where consumer health priorities and regulatory approvals guide market trajectories.
Key Market Segments
By Form Type
- Powder
- Oil
- Crystallized
By Application
- Pharmaceuticals Industry
- Food Industry
- Feed Industry
Growth Opportunity
Growing Awareness of Environmental Sustainability
The global Vitamin D3 market has experienced considerable growth, driven predominantly by an increasing awareness of environmental sustainability. This awareness has notably influenced consumer behaviors and preferences, thereby steering demand towards more sustainably sourced and produced Vitamin D3 supplements. As consumers become more conscious of the environmental impact of their purchases, they are increasingly opting for products that align with sustainable practices.
This shift is not only reshaping consumer choices but also compelling manufacturers to adopt greener production technologies and sourcing methods. The move towards environmentally friendly processes can be attributed to a broader market trend where sustainability is becoming a critical factor in the purchasing decisions of health-conscious consumers. This trend is expected to continue to catalyze the growth of the Vitamin D3 products market, as the emphasis on sustainable living becomes more pronounced.
Expansion of Energy Storage Solutions
Parallel to the rise in sustainability concerns, there is an expanding interest in energy storage solutions which indirectly supports the Vitamin D3 market. This expansion can be linked to the increased use of renewable energy sources, which require reliable storage to manage supply and demand effectively. Vitamin D3, often sourced from lanolin—a byproduct of wool processing—benefits from advancements in energy storage as these technologies often involve materials and processes that align with sustainable energy practices.
As the energy sector continues to innovate and invest in environmentally sound energy storage solutions, the Vitamin D3 market stands to gain from the related advancements in bio-based industries and circular economies. The convergence of these sectors highlights a unique growth opportunity for Vitamin D3, leveraging technological integration between different industries.
Latest Trends
Remote Patient Monitoring Technologies and the Global Vitamin D3 Market
In 2023, remote patient monitoring (RPM) technologies have increasingly influenced the global Vitamin D3 market. The integration of RPM has enabled healthcare providers to monitor patients' vitamin D levels more efficiently, particularly in populations at high risk for deficiencies, such as the elderly or those with limited sun exposure.
The advancements in RPM technologies have facilitated real-time data collection, empowering healthcare professionals to tailor the market for vitamin supplementation more accurately. This personalized approach can be attributed to the heightened demand for Vitamin D3, as it ensures optimal levels are maintained to support bone health and immune function.
Augmented Reality (AR) in Gaming and the Global Vitamin D3 Market
The intersection of Augmented Reality (AR) in gaming and the global Vitamin D3 market is an emerging trend in vitamins, focusing on promoting health and wellness through interactive technology. AR applications in gaming are being developed to encourage outdoor activity, indirectly promoting sunlight exposure which is crucial for the natural trend of Vitamin D synthesis.
In 2023, game developers have begun collaborating with health advocacy groups to create AR experiences that incentivize players to spend more time outdoors, thereby potentially reducing Vitamin D deficiency in the general population. This innovative approach is expected to complement traditional Vitamin D3 supplements, offering a dual strategy that combines entertainment with health benefits, potentially expanding the market's consumer base.
Regional Analysis
The Vitamin D3 market in Europe constitutes 45% of the global market share in 2023.
The global Vitamin D3 market is segmented into several key regions: North America, Europe, Asia Pacific, Middle East & Africa, and Latin America, each demonstrating unique market dynamics and growth opportunities.
Europe emerges as the dominating region, holding a substantial 45% share of the global market. The high prevalence of Vitamin D deficiency among populations in countries with limited sunlight exposure, such as the Nordic countries, drives the demand for Vitamin D3 supplements. Moreover, heightened awareness and government initiatives promoting health supplementation support the market's robust presence in this region.
North America also represents a significant segment, propelled by increasing health consciousness and the prevalence of lifestyle diseases linked to Vitamin D deficiency. The U.S. and Canada are at the forefront, with advanced healthcare infrastructure and widespread availability of fortified foods and dietary supplements, supporting market penetration and consumer adoption.
In the Asia Pacific region, rapid urbanization and changing lifestyles have led to increased indoor living, reducing sun exposure and thereby increasing the incidence of Vitamin D deficiencies. This factor, coupled with rising disposable incomes and growing awareness about preventive healthcare, is likely to boost the demand for Vitamin D3 supplements significantly in this region.
The Middle East & Africa, and Latin America regions, though smaller in comparison, are experiencing gradual growth in the Vitamin D3 market. Increasing urbanization, economic development, and the expanding retail sector contribute to the growing accessibility and awareness of Vitamin D3's health benefits in these regions.
Key Regions and Countries
North America
- The US
- Canada
- Rest of North America
Europe
- Germany
- France
- The UK
- Spain
- Netherlands
- Russia
- Italy
- Rest of Europe
Asia-Pacific
- China
- Japan
- Singapore
- Thailand
- South Korea
- Vietnam
- India
- New Zealand
- Rest of Asia Pacific
Latin America
- Mexico
- Brazil
- Rest of Latin America
Middle East & Africa
- Saudi Arabia
- South Africa
- UAE
- Rest of Middle East & Africa
Key Players Analysis
In 2023, the global Vitamin D3 market is significantly shaped by the strategic activities of key players such as BASF SE, Zhejiang NHU Company Ltd., and Koninklijke DSM N.V., among others. These companies are pivotal in driving both technological advancements and the expansion of the market footprint globally.
BASF SE, with its robust R&D capabilities and extensive distribution network, continues to lead in innovation, focusing on sustainable and efficient Vitamin D3 synthesis methods that appeal to environmentally conscious consumers. The company’s global presence and established brand reputation facilitate its dominance in both developed and emerging markets.
Zhejiang NHU Company Ltd. has capitalized on its strategic location in Asia to maximize production efficiencies and cost competitiveness. This advantage is crucial as the demand for dietary supplements surges across the Asia Pacific region. Their focus on quality and compliance has helped them maintain a strong position in the market despite intense regional competition.
Koninklijke DSM N.V. leverages its expertise in life sciences and material sciences to enhance its product offerings, focusing on the fortification of foods and beverages as a method of addressing micronutrient deficiencies globally. Their commitment to health through nutrition positions them as a leader in both innovation and market reach.
Other notable companies such as Zhejiang Garden Bio-chemical High-tech Co. Ltd., Xiamen Kingdomway Group Company, and Fermenta Biotech Limited focus on expanding their market presence through strategic partnerships and increasing their production capacities to meet the growing global demand.
Market Key Players
- BASF SE
- Zhejiang NHU Company Ltd.
- Koninklijke DSM N.V.
- Zhejiang Garden Bio-chemical High-tech Co. Ltd.
- Xiamen Kingdomway Group Company
- Zhejiang Xianju Pharmaceutical Co. Ltd.
- Zhejiang Medicine Co. Ltd.
- Fermenta Biotech Limited
- Dishman Carbogen Amcis Limited
- Teva Pharmaceutical Industries Limited
- LycoRed Ltd.
Recent Development
- In April 2024, Plentisoft's Rejuve+ unveils Focus and Calming Chewable Tablets, addressing mental health needs with science-backed formulations. Sustainable packaging and global distribution highlight their commitment to well-being.
- In March 2024, Nutrex Hawaii launches vegan, sugar-free BioAstin with Hawaiian microalgae, promoting sustainability and purity. Each gummy includes 25mcg of vitamin D3, tapping into trends in vegan dietary requirements supplements and natural ingredient cultivation.
- In March 2024, INNOBIO introduces LocVita® D3, offering tailored formulas and beadlet solutions for vegan vitamin D3. Innovations enhance stability and efficacy in tablet applications, catering to health-focused markets.
Report Scope
Report Features Description Market Value (2023) USD 1.6 Billion Forecast Revenue (2033) USD 3.3 Billion CAGR (2024-2032) 7.7% Base Year for Estimation 2023 Historic Period 2016-2023 Forecast Period 2024-2033 Report Coverage Revenue Forecast, Market Dynamics, COVID-19 Impact, Competitive Landscape, Recent Developments Segments Covered By Form Type(Powder, Oil, Crystallized), By Application(Pharmaceuticals Industry, Food Industry, Feed Industry) Regional Analysis North America - The US, Canada, Rest of North America, Europe - Germany, France, The UK, Spain, Italy, Russia, Netherlands, Rest of Europe, Asia-Pacific - China, Japan, South Korea, India, New Zealand, Singapore, Thailand, Vietnam, Rest of Asia Pacific, Latin America - Brazil, Mexico, Rest of Latin America, Middle East & Africa - South Africa, Saudi Arabia, UAE, Rest of Middle East & Africa Competitive Landscape BASF SE, Zhejiang NHU Company Ltd., Koninklijke DSM N.V., Zhejiang Garden Bio-chemical High-tech Co. Ltd., Xiamen Kingdomway Group Company, Zhejiang Xianju Pharmaceutical Co. Ltd., Zhejiang Medicine Co. Ltd., Fermenta Biotech Limited, Dishman Carbogen Amcis Limited, Teva Pharmaceutical Industries Limited, LycoRed Ltd. Customization Scope Customization for segments, region/country-level will be provided. Moreover, additional customization can be done based on the requirements. Purchase Options We have three licenses to opt for Single User License, Multi-User License (Up to 5 Users), Corporate Use License (Unlimited User and Printable PDF) -
- 1. Executive Summary
- 1.1. Definition
- 1.2. Taxonomy
- 1.3. Research Scope
- 1.4. Key Analysis
- 1.5. Key Findings by Major Segments
- 1.6. Top strategies by Major Players
- 2. Global Vitamin D3 Market Overview
- 2.1. Vitamin D3 Market Dynamics
- 2.1.1. Drivers
- 2.1.2. Opportunities
- 2.1.3. Restraints
- 2.1.4. Challenges
- 2.2. Macro-economic Factors
- 2.3. Regulatory Framework
- 2.4. Market Investment Feasibility Index
- 2.5. PEST Analysis
- 2.6. PORTER’S Five Force Analysis
- 2.7. Drivers & Restraints Impact Analysis
- 2.8. Industry Chain Analysis
- 2.9. Cost Structure Analysis
- 2.10. Marketing Strategy
- 2.11. Russia-Ukraine War Impact Analysis
- 2.12. Opportunity Map Analysis
- 2.13. Market Competition Scenario Analysis
- 2.14. Product Life Cycle Analysis
- 2.15. Opportunity Orbits
- 2.16. Manufacturer Intensity Map
- 2.17. Major Companies sales by Value & Volume
- 2.1. Vitamin D3 Market Dynamics
- 3. Global Vitamin D3 Market Analysis, Opportunity and Forecast, 2016-2032
- 3.1. Global Vitamin D3 Market Analysis, 2016-2021
- 3.2. Global Vitamin D3 Market Opportunity and Forecast, 2023-2032
- 3.3. Global Vitamin D3 Market Analysis, Opportunity and Forecast, By By Form Type, 2016-2032
- 3.3.1. Global Vitamin D3 Market Analysis by By Form Type: Introduction
- 3.3.2. Market Size Absolute $ Opportunity Analysis and Forecast, By By Form Type, 2016-2032
- 3.3.3. Powder
- 3.3.4. Oil
- 3.3.5. Crystallized
- 3.4. Global Vitamin D3 Market Analysis, Opportunity and Forecast, By By Application, 2016-2032
- 3.4.1. Global Vitamin D3 Market Analysis by By Application: Introduction
- 3.4.2. Market Size Absolute $ Opportunity Analysis and Forecast, By By Application, 2016-2032
- 3.4.3. Pharmaceuticals Industry
- 3.4.4. Food Industry
- 3.4.5. Feed Industry
- 4. North America Vitamin D3 Market Analysis, Opportunity and Forecast, 2016-2032
- 4.1. North America Vitamin D3 Market Analysis, 2016-2021
- 4.2. North America Vitamin D3 Market Opportunity and Forecast, 2023-2032
- 4.3. North America Vitamin D3 Market Analysis, Opportunity and Forecast, By By Form Type, 2016-2032
- 4.3.1. North America Vitamin D3 Market Analysis by By Form Type: Introduction
- 4.3.2. Market Size Absolute $ Opportunity Analysis and Forecast, By By Form Type, 2016-2032
- 4.3.3. Powder
- 4.3.4. Oil
- 4.3.5. Crystallized
- 4.4. North America Vitamin D3 Market Analysis, Opportunity and Forecast, By By Application, 2016-2032
- 4.4.1. North America Vitamin D3 Market Analysis by By Application: Introduction
- 4.4.2. Market Size Absolute $ Opportunity Analysis and Forecast, By By Application, 2016-2032
- 4.4.3. Pharmaceuticals Industry
- 4.4.4. Food Industry
- 4.4.5. Feed Industry
- 4.5. North America Vitamin D3 Market Analysis, Opportunity and Forecast, By Country , 2016-2032
- 4.5.1. North America Vitamin D3 Market Analysis by Country : Introduction
- 4.5.2. Market Size Absolute $ Opportunity Analysis and Forecast, Country , 2016-2032
- 4.5.2.1. The US
- 4.5.2.2. Canada
- 4.5.2.3. Mexico
- 5. Western Europe Vitamin D3 Market Analysis, Opportunity and Forecast, 2016-2032
- 5.1. Western Europe Vitamin D3 Market Analysis, 2016-2021
- 5.2. Western Europe Vitamin D3 Market Opportunity and Forecast, 2023-2032
- 5.3. Western Europe Vitamin D3 Market Analysis, Opportunity and Forecast, By By Form Type, 2016-2032
- 5.3.1. Western Europe Vitamin D3 Market Analysis by By Form Type: Introduction
- 5.3.2. Market Size Absolute $ Opportunity Analysis and Forecast, By By Form Type, 2016-2032
- 5.3.3. Powder
- 5.3.4. Oil
- 5.3.5. Crystallized
- 5.4. Western Europe Vitamin D3 Market Analysis, Opportunity and Forecast, By By Application, 2016-2032
- 5.4.1. Western Europe Vitamin D3 Market Analysis by By Application: Introduction
- 5.4.2. Market Size Absolute $ Opportunity Analysis and Forecast, By By Application, 2016-2032
- 5.4.3. Pharmaceuticals Industry
- 5.4.4. Food Industry
- 5.4.5. Feed Industry
- 5.5. Western Europe Vitamin D3 Market Analysis, Opportunity and Forecast, By Country , 2016-2032
- 5.5.1. Western Europe Vitamin D3 Market Analysis by Country : Introduction
- 5.5.2. Market Size Absolute $ Opportunity Analysis and Forecast, Country , 2016-2032
- 5.5.2.1. Germany
- 5.5.2.2. France
- 5.5.2.3. The UK
- 5.5.2.4. Spain
- 5.5.2.5. Italy
- 5.5.2.6. Portugal
- 5.5.2.7. Ireland
- 5.5.2.8. Austria
- 5.5.2.9. Switzerland
- 5.5.2.10. Benelux
- 5.5.2.11. Nordic
- 5.5.2.12. Rest of Western Europe
- 6. Eastern Europe Vitamin D3 Market Analysis, Opportunity and Forecast, 2016-2032
- 6.1. Eastern Europe Vitamin D3 Market Analysis, 2016-2021
- 6.2. Eastern Europe Vitamin D3 Market Opportunity and Forecast, 2023-2032
- 6.3. Eastern Europe Vitamin D3 Market Analysis, Opportunity and Forecast, By By Form Type, 2016-2032
- 6.3.1. Eastern Europe Vitamin D3 Market Analysis by By Form Type: Introduction
- 6.3.2. Market Size Absolute $ Opportunity Analysis and Forecast, By By Form Type, 2016-2032
- 6.3.3. Powder
- 6.3.4. Oil
- 6.3.5. Crystallized
- 6.4. Eastern Europe Vitamin D3 Market Analysis, Opportunity and Forecast, By By Application, 2016-2032
- 6.4.1. Eastern Europe Vitamin D3 Market Analysis by By Application: Introduction
- 6.4.2. Market Size Absolute $ Opportunity Analysis and Forecast, By By Application, 2016-2032
- 6.4.3. Pharmaceuticals Industry
- 6.4.4. Food Industry
- 6.4.5. Feed Industry
- 6.5. Eastern Europe Vitamin D3 Market Analysis, Opportunity and Forecast, By Country , 2016-2032
- 6.5.1. Eastern Europe Vitamin D3 Market Analysis by Country : Introduction
- 6.5.2. Market Size Absolute $ Opportunity Analysis and Forecast, Country , 2016-2032
- 6.5.2.1. Russia
- 6.5.2.2. Poland
- 6.5.2.3. The Czech Republic
- 6.5.2.4. Greece
- 6.5.2.5. Rest of Eastern Europe
- 7. APAC Vitamin D3 Market Analysis, Opportunity and Forecast, 2016-2032
- 7.1. APAC Vitamin D3 Market Analysis, 2016-2021
- 7.2. APAC Vitamin D3 Market Opportunity and Forecast, 2023-2032
- 7.3. APAC Vitamin D3 Market Analysis, Opportunity and Forecast, By By Form Type, 2016-2032
- 7.3.1. APAC Vitamin D3 Market Analysis by By Form Type: Introduction
- 7.3.2. Market Size Absolute $ Opportunity Analysis and Forecast, By By Form Type, 2016-2032
- 7.3.3. Powder
- 7.3.4. Oil
- 7.3.5. Crystallized
- 7.4. APAC Vitamin D3 Market Analysis, Opportunity and Forecast, By By Application, 2016-2032
- 7.4.1. APAC Vitamin D3 Market Analysis by By Application: Introduction
- 7.4.2. Market Size Absolute $ Opportunity Analysis and Forecast, By By Application, 2016-2032
- 7.4.3. Pharmaceuticals Industry
- 7.4.4. Food Industry
- 7.4.5. Feed Industry
- 7.5. APAC Vitamin D3 Market Analysis, Opportunity and Forecast, By Country , 2016-2032
- 7.5.1. APAC Vitamin D3 Market Analysis by Country : Introduction
- 7.5.2. Market Size Absolute $ Opportunity Analysis and Forecast, Country , 2016-2032
- 7.5.2.1. China
- 7.5.2.2. Japan
- 7.5.2.3. South Korea
- 7.5.2.4. India
- 7.5.2.5. Australia & New Zeland
- 7.5.2.6. Indonesia
- 7.5.2.7. Malaysia
- 7.5.2.8. Philippines
- 7.5.2.9. Singapore
- 7.5.2.10. Thailand
- 7.5.2.11. Vietnam
- 7.5.2.12. Rest of APAC
- 8. Latin America Vitamin D3 Market Analysis, Opportunity and Forecast, 2016-2032
- 8.1. Latin America Vitamin D3 Market Analysis, 2016-2021
- 8.2. Latin America Vitamin D3 Market Opportunity and Forecast, 2023-2032
- 8.3. Latin America Vitamin D3 Market Analysis, Opportunity and Forecast, By By Form Type, 2016-2032
- 8.3.1. Latin America Vitamin D3 Market Analysis by By Form Type: Introduction
- 8.3.2. Market Size Absolute $ Opportunity Analysis and Forecast, By By Form Type, 2016-2032
- 8.3.3. Powder
- 8.3.4. Oil
- 8.3.5. Crystallized
- 8.4. Latin America Vitamin D3 Market Analysis, Opportunity and Forecast, By By Application, 2016-2032
- 8.4.1. Latin America Vitamin D3 Market Analysis by By Application: Introduction
- 8.4.2. Market Size Absolute $ Opportunity Analysis and Forecast, By By Application, 2016-2032
- 8.4.3. Pharmaceuticals Industry
- 8.4.4. Food Industry
- 8.4.5. Feed Industry
- 8.5. Latin America Vitamin D3 Market Analysis, Opportunity and Forecast, By Country , 2016-2032
- 8.5.1. Latin America Vitamin D3 Market Analysis by Country : Introduction
- 8.5.2. Market Size Absolute $ Opportunity Analysis and Forecast, Country , 2016-2032
- 8.5.2.1. Brazil
- 8.5.2.2. Colombia
- 8.5.2.3. Chile
- 8.5.2.4. Argentina
- 8.5.2.5. Costa Rica
- 8.5.2.6. Rest of Latin America
- 9. Middle East & Africa Vitamin D3 Market Analysis, Opportunity and Forecast, 2016-2032
- 9.1. Middle East & Africa Vitamin D3 Market Analysis, 2016-2021
- 9.2. Middle East & Africa Vitamin D3 Market Opportunity and Forecast, 2023-2032
- 9.3. Middle East & Africa Vitamin D3 Market Analysis, Opportunity and Forecast, By By Form Type, 2016-2032
- 9.3.1. Middle East & Africa Vitamin D3 Market Analysis by By Form Type: Introduction
- 9.3.2. Market Size Absolute $ Opportunity Analysis and Forecast, By By Form Type, 2016-2032
- 9.3.3. Powder
- 9.3.4. Oil
- 9.3.5. Crystallized
- 9.4. Middle East & Africa Vitamin D3 Market Analysis, Opportunity and Forecast, By By Application, 2016-2032
- 9.4.1. Middle East & Africa Vitamin D3 Market Analysis by By Application: Introduction
- 9.4.2. Market Size Absolute $ Opportunity Analysis and Forecast, By By Application, 2016-2032
- 9.4.3. Pharmaceuticals Industry
- 9.4.4. Food Industry
- 9.4.5. Feed Industry
- 9.5. Middle East & Africa Vitamin D3 Market Analysis, Opportunity and Forecast, By Country , 2016-2032
- 9.5.1. Middle East & Africa Vitamin D3 Market Analysis by Country : Introduction
- 9.5.2. Market Size Absolute $ Opportunity Analysis and Forecast, Country , 2016-2032
- 9.5.2.1. Algeria
- 9.5.2.2. Egypt
- 9.5.2.3. Israel
- 9.5.2.4. Kuwait
- 9.5.2.5. Nigeria
- 9.5.2.6. Saudi Arabia
- 9.5.2.7. South Africa
- 9.5.2.8. Turkey
- 9.5.2.9. The UAE
- 9.5.2.10. Rest of MEA
- 10. Global Vitamin D3 Market Analysis, Opportunity and Forecast, By Region , 2016-2032
- 10.1. Global Vitamin D3 Market Analysis by Region : Introduction
- 10.2. Market Size Absolute $ Opportunity Analysis and Forecast, By Region , 2016-2032
- 10.2.1. North America
- 10.2.2. Western Europe
- 10.2.3. Eastern Europe
- 10.2.4. APAC
- 10.2.5. Latin America
- 10.2.6. Middle East & Africa
- 11. Global Vitamin D3 Market Competitive Landscape, Market Share Analysis, and Company Profiles
- 11.1. Market Share Analysis
- 11.2. Company Profiles
- 11.3. BASF SE
- 11.3.1. Company Overview
- 11.3.2. Financial Highlights
- 11.3.3. Product Portfolio
- 11.3.4. SWOT Analysis
- 11.3.5. Key Strategies and Developments
- 11.4. Zhejiang NHU Company Ltd.
- 11.4.1. Company Overview
- 11.4.2. Financial Highlights
- 11.4.3. Product Portfolio
- 11.4.4. SWOT Analysis
- 11.4.5. Key Strategies and Developments
- 11.5. Koninklijke DSM N.V.
- 11.5.1. Company Overview
- 11.5.2. Financial Highlights
- 11.5.3. Product Portfolio
- 11.5.4. SWOT Analysis
- 11.5.5. Key Strategies and Developments
- 11.6. Zhejiang Garden Bio-chemical High-tech Co. Ltd.
- 11.6.1. Company Overview
- 11.6.2. Financial Highlights
- 11.6.3. Product Portfolio
- 11.6.4. SWOT Analysis
- 11.6.5. Key Strategies and Developments
- 11.7. Xiamen Kingdomway Group Company
- 11.7.1. Company Overview
- 11.7.2. Financial Highlights
- 11.7.3. Product Portfolio
- 11.7.4. SWOT Analysis
- 11.7.5. Key Strategies and Developments
- 11.8. Zhejiang Xianju Pharmaceutical Co. Ltd.
- 11.8.1. Company Overview
- 11.8.2. Financial Highlights
- 11.8.3. Product Portfolio
- 11.8.4. SWOT Analysis
- 11.8.5. Key Strategies and Developments
- 11.9. Zhejiang Medicine Co. Ltd.
- 11.9.1. Company Overview
- 11.9.2. Financial Highlights
- 11.9.3. Product Portfolio
- 11.9.4. SWOT Analysis
- 11.9.5. Key Strategies and Developments
- 11.10. Fermenta Biotech Limited
- 11.10.1. Company Overview
- 11.10.2. Financial Highlights
- 11.10.3. Product Portfolio
- 11.10.4. SWOT Analysis
- 11.10.5. Key Strategies and Developments
- 11.11. Dishman Carbogen Amcis Limited
- 11.11.1. Company Overview
- 11.11.2. Financial Highlights
- 11.11.3. Product Portfolio
- 11.11.4. SWOT Analysis
- 11.11.5. Key Strategies and Developments
- 11.12. Teva Pharmaceutical Industries Limited
- 11.12.1. Company Overview
- 11.12.2. Financial Highlights
- 11.12.3. Product Portfolio
- 11.12.4. SWOT Analysis
- 11.12.5. Key Strategies and Developments
- 11.13.1. Company Overview
- 11.13.2. Financial Highlights
- 11.13.3. Product Portfolio
- 11.13.4. SWOT Analysis
- 11.13.5. Key Strategies and Developments
- 11.14. LycoRed Ltd.
- 11.14.1. Company Overview
- 11.14.2. Financial Highlights
- 11.14.3. Product Portfolio
- 11.14.4. SWOT Analysis
- 11.14.5. Key Strategies and Developments
- 12. Assumptions and Acronyms
- 13. Research Methodology
- 14. Contact
"
- List of Figures
- "
- Figure 1: Global Vitamin D3 Market Revenue (US$ Mn) Market Share by By Form Type in 2022
- Figure 2: Global Vitamin D3 Market Market Attractiveness Analysis by By Form Type, 2016-2032
- Figure 3: Global Vitamin D3 Market Revenue (US$ Mn) Market Share by By Applicationin 2022
- Figure 4: Global Vitamin D3 Market Market Attractiveness Analysis by By Application, 2016-2032
- Figure 5: Global Vitamin D3 Market Revenue (US$ Mn) Market Share by Region in 2022
- Figure 6: Global Vitamin D3 Market Market Attractiveness Analysis by Region, 2016-2032
- Figure 7: Global Vitamin D3 Market Market Revenue (US$ Mn) (2016-2032)
- Figure 8: Global Vitamin D3 Market Market Revenue (US$ Mn) Comparison by Region (2016-2032)
- Figure 9: Global Vitamin D3 Market Market Revenue (US$ Mn) Comparison by By Form Type (2016-2032)
- Figure 10: Global Vitamin D3 Market Market Revenue (US$ Mn) Comparison by By Application (2016-2032)
- Figure 11: Global Vitamin D3 Market Market Y-o-Y Growth Rate Comparison by Region (2016-2032)
- Figure 12: Global Vitamin D3 Market Market Y-o-Y Growth Rate Comparison by By Form Type (2016-2032)
- Figure 13: Global Vitamin D3 Market Market Y-o-Y Growth Rate Comparison by By Application (2016-2032)
- Figure 14: Global Vitamin D3 Market Market Share Comparison by Region (2016-2032)
- Figure 15: Global Vitamin D3 Market Market Share Comparison by By Form Type (2016-2032)
- Figure 16: Global Vitamin D3 Market Market Share Comparison by By Application (2016-2032)
- Figure 17: North America Vitamin D3 Market Revenue (US$ Mn) Market Share by By Form Typein 2022
- Figure 18: North America Vitamin D3 Market Market Attractiveness Analysis by By Form Type, 2016-2032
- Figure 19: North America Vitamin D3 Market Revenue (US$ Mn) Market Share by By Applicationin 2022
- Figure 20: North America Vitamin D3 Market Market Attractiveness Analysis by By Application, 2016-2032
- Figure 21: North America Vitamin D3 Market Revenue (US$ Mn) Market Share by Country in 2022
- Figure 22: North America Vitamin D3 Market Market Attractiveness Analysis by Country, 2016-2032
- Figure 23: North America Vitamin D3 Market Market Revenue (US$ Mn) (2016-2032)
- Figure 24: North America Vitamin D3 Market Market Revenue (US$ Mn) Comparison by Country (2016-2032)
- Figure 25: North America Vitamin D3 Market Market Revenue (US$ Mn) Comparison by By Form Type (2016-2032)
- Figure 26: North America Vitamin D3 Market Market Revenue (US$ Mn) Comparison by By Application (2016-2032)
- Figure 27: North America Vitamin D3 Market Market Y-o-Y Growth Rate Comparison by Country (2016-2032)
- Figure 28: North America Vitamin D3 Market Market Y-o-Y Growth Rate Comparison by By Form Type (2016-2032)
- Figure 29: North America Vitamin D3 Market Market Y-o-Y Growth Rate Comparison by By Application (2016-2032)
- Figure 30: North America Vitamin D3 Market Market Share Comparison by Country (2016-2032)
- Figure 31: North America Vitamin D3 Market Market Share Comparison by By Form Type (2016-2032)
- Figure 32: North America Vitamin D3 Market Market Share Comparison by By Application (2016-2032)
- Figure 33: Western Europe Vitamin D3 Market Revenue (US$ Mn) Market Share by By Form Typein 2022
- Figure 34: Western Europe Vitamin D3 Market Market Attractiveness Analysis by By Form Type, 2016-2032
- Figure 35: Western Europe Vitamin D3 Market Revenue (US$ Mn) Market Share by By Applicationin 2022
- Figure 36: Western Europe Vitamin D3 Market Market Attractiveness Analysis by By Application, 2016-2032
- Figure 37: Western Europe Vitamin D3 Market Revenue (US$ Mn) Market Share by Country in 2022
- Figure 38: Western Europe Vitamin D3 Market Market Attractiveness Analysis by Country, 2016-2032
- Figure 39: Western Europe Vitamin D3 Market Market Revenue (US$ Mn) (2016-2032)
- Figure 40: Western Europe Vitamin D3 Market Market Revenue (US$ Mn) Comparison by Country (2016-2032)
- Figure 41: Western Europe Vitamin D3 Market Market Revenue (US$ Mn) Comparison by By Form Type (2016-2032)
- Figure 42: Western Europe Vitamin D3 Market Market Revenue (US$ Mn) Comparison by By Application (2016-2032)
- Figure 43: Western Europe Vitamin D3 Market Market Y-o-Y Growth Rate Comparison by Country (2016-2032)
- Figure 44: Western Europe Vitamin D3 Market Market Y-o-Y Growth Rate Comparison by By Form Type (2016-2032)
- Figure 45: Western Europe Vitamin D3 Market Market Y-o-Y Growth Rate Comparison by By Application (2016-2032)
- Figure 46: Western Europe Vitamin D3 Market Market Share Comparison by Country (2016-2032)
- Figure 47: Western Europe Vitamin D3 Market Market Share Comparison by By Form Type (2016-2032)
- Figure 48: Western Europe Vitamin D3 Market Market Share Comparison by By Application (2016-2032)
- Figure 49: Eastern Europe Vitamin D3 Market Revenue (US$ Mn) Market Share by By Form Typein 2022
- Figure 50: Eastern Europe Vitamin D3 Market Market Attractiveness Analysis by By Form Type, 2016-2032
- Figure 51: Eastern Europe Vitamin D3 Market Revenue (US$ Mn) Market Share by By Applicationin 2022
- Figure 52: Eastern Europe Vitamin D3 Market Market Attractiveness Analysis by By Application, 2016-2032
- Figure 53: Eastern Europe Vitamin D3 Market Revenue (US$ Mn) Market Share by Country in 2022
- Figure 54: Eastern Europe Vitamin D3 Market Market Attractiveness Analysis by Country, 2016-2032
- Figure 55: Eastern Europe Vitamin D3 Market Market Revenue (US$ Mn) (2016-2032)
- Figure 56: Eastern Europe Vitamin D3 Market Market Revenue (US$ Mn) Comparison by Country (2016-2032)
- Figure 57: Eastern Europe Vitamin D3 Market Market Revenue (US$ Mn) Comparison by By Form Type (2016-2032)
- Figure 58: Eastern Europe Vitamin D3 Market Market Revenue (US$ Mn) Comparison by By Application (2016-2032)
- Figure 59: Eastern Europe Vitamin D3 Market Market Y-o-Y Growth Rate Comparison by Country (2016-2032)
- Figure 60: Eastern Europe Vitamin D3 Market Market Y-o-Y Growth Rate Comparison by By Form Type (2016-2032)
- Figure 61: Eastern Europe Vitamin D3 Market Market Y-o-Y Growth Rate Comparison by By Application (2016-2032)
- Figure 62: Eastern Europe Vitamin D3 Market Market Share Comparison by Country (2016-2032)
- Figure 63: Eastern Europe Vitamin D3 Market Market Share Comparison by By Form Type (2016-2032)
- Figure 64: Eastern Europe Vitamin D3 Market Market Share Comparison by By Application (2016-2032)
- Figure 65: APAC Vitamin D3 Market Revenue (US$ Mn) Market Share by By Form Typein 2022
- Figure 66: APAC Vitamin D3 Market Market Attractiveness Analysis by By Form Type, 2016-2032
- Figure 67: APAC Vitamin D3 Market Revenue (US$ Mn) Market Share by By Applicationin 2022
- Figure 68: APAC Vitamin D3 Market Market Attractiveness Analysis by By Application, 2016-2032
- Figure 69: APAC Vitamin D3 Market Revenue (US$ Mn) Market Share by Country in 2022
- Figure 70: APAC Vitamin D3 Market Market Attractiveness Analysis by Country, 2016-2032
- Figure 71: APAC Vitamin D3 Market Market Revenue (US$ Mn) (2016-2032)
- Figure 72: APAC Vitamin D3 Market Market Revenue (US$ Mn) Comparison by Country (2016-2032)
- Figure 73: APAC Vitamin D3 Market Market Revenue (US$ Mn) Comparison by By Form Type (2016-2032)
- Figure 74: APAC Vitamin D3 Market Market Revenue (US$ Mn) Comparison by By Application (2016-2032)
- Figure 75: APAC Vitamin D3 Market Market Y-o-Y Growth Rate Comparison by Country (2016-2032)
- Figure 76: APAC Vitamin D3 Market Market Y-o-Y Growth Rate Comparison by By Form Type (2016-2032)
- Figure 77: APAC Vitamin D3 Market Market Y-o-Y Growth Rate Comparison by By Application (2016-2032)
- Figure 78: APAC Vitamin D3 Market Market Share Comparison by Country (2016-2032)
- Figure 79: APAC Vitamin D3 Market Market Share Comparison by By Form Type (2016-2032)
- Figure 80: APAC Vitamin D3 Market Market Share Comparison by By Application (2016-2032)
- Figure 81: Latin America Vitamin D3 Market Revenue (US$ Mn) Market Share by By Form Typein 2022
- Figure 82: Latin America Vitamin D3 Market Market Attractiveness Analysis by By Form Type, 2016-2032
- Figure 83: Latin America Vitamin D3 Market Revenue (US$ Mn) Market Share by By Applicationin 2022
- Figure 84: Latin America Vitamin D3 Market Market Attractiveness Analysis by By Application, 2016-2032
- Figure 85: Latin America Vitamin D3 Market Revenue (US$ Mn) Market Share by Country in 2022
- Figure 86: Latin America Vitamin D3 Market Market Attractiveness Analysis by Country, 2016-2032
- Figure 87: Latin America Vitamin D3 Market Market Revenue (US$ Mn) (2016-2032)
- Figure 88: Latin America Vitamin D3 Market Market Revenue (US$ Mn) Comparison by Country (2016-2032)
- Figure 89: Latin America Vitamin D3 Market Market Revenue (US$ Mn) Comparison by By Form Type (2016-2032)
- Figure 90: Latin America Vitamin D3 Market Market Revenue (US$ Mn) Comparison by By Application (2016-2032)
- Figure 91: Latin America Vitamin D3 Market Market Y-o-Y Growth Rate Comparison by Country (2016-2032)
- Figure 92: Latin America Vitamin D3 Market Market Y-o-Y Growth Rate Comparison by By Form Type (2016-2032)
- Figure 93: Latin America Vitamin D3 Market Market Y-o-Y Growth Rate Comparison by By Application (2016-2032)
- Figure 94: Latin America Vitamin D3 Market Market Share Comparison by Country (2016-2032)
- Figure 95: Latin America Vitamin D3 Market Market Share Comparison by By Form Type (2016-2032)
- Figure 96: Latin America Vitamin D3 Market Market Share Comparison by By Application (2016-2032)
- Figure 97: Middle East & Africa Vitamin D3 Market Revenue (US$ Mn) Market Share by By Form Typein 2022
- Figure 98: Middle East & Africa Vitamin D3 Market Market Attractiveness Analysis by By Form Type, 2016-2032
- Figure 99: Middle East & Africa Vitamin D3 Market Revenue (US$ Mn) Market Share by By Applicationin 2022
- Figure 100: Middle East & Africa Vitamin D3 Market Market Attractiveness Analysis by By Application, 2016-2032
- Figure 101: Middle East & Africa Vitamin D3 Market Revenue (US$ Mn) Market Share by Country in 2022
- Figure 102: Middle East & Africa Vitamin D3 Market Market Attractiveness Analysis by Country, 2016-2032
- Figure 103: Middle East & Africa Vitamin D3 Market Market Revenue (US$ Mn) (2016-2032)
- Figure 104: Middle East & Africa Vitamin D3 Market Market Revenue (US$ Mn) Comparison by Country (2016-2032)
- Figure 105: Middle East & Africa Vitamin D3 Market Market Revenue (US$ Mn) Comparison by By Form Type (2016-2032)
- Figure 106: Middle East & Africa Vitamin D3 Market Market Revenue (US$ Mn) Comparison by By Application (2016-2032)
- Figure 107: Middle East & Africa Vitamin D3 Market Market Y-o-Y Growth Rate Comparison by Country (2016-2032)
- Figure 108: Middle East & Africa Vitamin D3 Market Market Y-o-Y Growth Rate Comparison by By Form Type (2016-2032)
- Figure 109: Middle East & Africa Vitamin D3 Market Market Y-o-Y Growth Rate Comparison by By Application (2016-2032)
- Figure 110: Middle East & Africa Vitamin D3 Market Market Share Comparison by Country (2016-2032)
- Figure 111: Middle East & Africa Vitamin D3 Market Market Share Comparison by By Form Type (2016-2032)
- Figure 112: Middle East & Africa Vitamin D3 Market Market Share Comparison by By Application (2016-2032)
"
- List of Tables
- "
- Table 1: Global Vitamin D3 Market Market Comparison by By Form Type (2016-2032)
- Table 2: Global Vitamin D3 Market Market Comparison by By Application (2016-2032)
- Table 3: Global Vitamin D3 Market Revenue (US$ Mn) Comparison by Region (2016-2032)
- Table 4: Global Vitamin D3 Market Market Revenue (US$ Mn) (2016-2032)
- Table 5: Global Vitamin D3 Market Market Revenue (US$ Mn) Comparison by Region (2016-2032)
- Table 6: Global Vitamin D3 Market Market Revenue (US$ Mn) Comparison by By Form Type (2016-2032)
- Table 7: Global Vitamin D3 Market Market Revenue (US$ Mn) Comparison by By Application (2016-2032)
- Table 8: Global Vitamin D3 Market Market Y-o-Y Growth Rate Comparison by Region (2016-2032)
- Table 9: Global Vitamin D3 Market Market Y-o-Y Growth Rate Comparison by By Form Type (2016-2032)
- Table 10: Global Vitamin D3 Market Market Y-o-Y Growth Rate Comparison by By Application (2016-2032)
- Table 11: Global Vitamin D3 Market Market Share Comparison by Region (2016-2032)
- Table 12: Global Vitamin D3 Market Market Share Comparison by By Form Type (2016-2032)
- Table 13: Global Vitamin D3 Market Market Share Comparison by By Application (2016-2032)
- Table 14: North America Vitamin D3 Market Market Comparison by By Application (2016-2032)
- Table 15: North America Vitamin D3 Market Revenue (US$ Mn) Comparison by Country (2016-2032)
- Table 16: North America Vitamin D3 Market Market Revenue (US$ Mn) (2016-2032)
- Table 17: North America Vitamin D3 Market Market Revenue (US$ Mn) Comparison by Country (2016-2032)
- Table 18: North America Vitamin D3 Market Market Revenue (US$ Mn) Comparison by By Form Type (2016-2032)
- Table 19: North America Vitamin D3 Market Market Revenue (US$ Mn) Comparison by By Application (2016-2032)
- Table 20: North America Vitamin D3 Market Market Y-o-Y Growth Rate Comparison by Country (2016-2032)
- Table 21: North America Vitamin D3 Market Market Y-o-Y Growth Rate Comparison by By Form Type (2016-2032)
- Table 22: North America Vitamin D3 Market Market Y-o-Y Growth Rate Comparison by By Application (2016-2032)
- Table 23: North America Vitamin D3 Market Market Share Comparison by Country (2016-2032)
- Table 24: North America Vitamin D3 Market Market Share Comparison by By Form Type (2016-2032)
- Table 25: North America Vitamin D3 Market Market Share Comparison by By Application (2016-2032)
- Table 26: Western Europe Vitamin D3 Market Market Comparison by By Form Type (2016-2032)
- Table 27: Western Europe Vitamin D3 Market Market Comparison by By Application (2016-2032)
- Table 28: Western Europe Vitamin D3 Market Revenue (US$ Mn) Comparison by Country (2016-2032)
- Table 29: Western Europe Vitamin D3 Market Market Revenue (US$ Mn) (2016-2032)
- Table 30: Western Europe Vitamin D3 Market Market Revenue (US$ Mn) Comparison by Country (2016-2032)
- Table 31: Western Europe Vitamin D3 Market Market Revenue (US$ Mn) Comparison by By Form Type (2016-2032)
- Table 32: Western Europe Vitamin D3 Market Market Revenue (US$ Mn) Comparison by By Application (2016-2032)
- Table 33: Western Europe Vitamin D3 Market Market Y-o-Y Growth Rate Comparison by Country (2016-2032)
- Table 34: Western Europe Vitamin D3 Market Market Y-o-Y Growth Rate Comparison by By Form Type (2016-2032)
- Table 35: Western Europe Vitamin D3 Market Market Y-o-Y Growth Rate Comparison by By Application (2016-2032)
- Table 36: Western Europe Vitamin D3 Market Market Share Comparison by Country (2016-2032)
- Table 37: Western Europe Vitamin D3 Market Market Share Comparison by By Form Type (2016-2032)
- Table 38: Western Europe Vitamin D3 Market Market Share Comparison by By Application (2016-2032)
- Table 39: Eastern Europe Vitamin D3 Market Market Comparison by By Form Type (2016-2032)
- Table 40: Eastern Europe Vitamin D3 Market Market Comparison by By Application (2016-2032)
- Table 41: Eastern Europe Vitamin D3 Market Revenue (US$ Mn) Comparison by Country (2016-2032)
- Table 42: Eastern Europe Vitamin D3 Market Market Revenue (US$ Mn) (2016-2032)
- Table 43: Eastern Europe Vitamin D3 Market Market Revenue (US$ Mn) Comparison by Country (2016-2032)
- Table 44: Eastern Europe Vitamin D3 Market Market Revenue (US$ Mn) Comparison by By Form Type (2016-2032)
- Table 45: Eastern Europe Vitamin D3 Market Market Revenue (US$ Mn) Comparison by By Application (2016-2032)
- Table 46: Eastern Europe Vitamin D3 Market Market Y-o-Y Growth Rate Comparison by Country (2016-2032)
- Table 47: Eastern Europe Vitamin D3 Market Market Y-o-Y Growth Rate Comparison by By Form Type (2016-2032)
- Table 48: Eastern Europe Vitamin D3 Market Market Y-o-Y Growth Rate Comparison by By Application (2016-2032)
- Table 49: Eastern Europe Vitamin D3 Market Market Share Comparison by Country (2016-2032)
- Table 50: Eastern Europe Vitamin D3 Market Market Share Comparison by By Form Type (2016-2032)
- Table 51: Eastern Europe Vitamin D3 Market Market Share Comparison by By Application (2016-2032)
- Table 52: APAC Vitamin D3 Market Market Comparison by By Form Type (2016-2032)
- Table 53: APAC Vitamin D3 Market Market Comparison by By Application (2016-2032)
- Table 54: APAC Vitamin D3 Market Revenue (US$ Mn) Comparison by Country (2016-2032)
- Table 55: APAC Vitamin D3 Market Market Revenue (US$ Mn) (2016-2032)
- Table 56: APAC Vitamin D3 Market Market Revenue (US$ Mn) Comparison by Country (2016-2032)
- Table 57: APAC Vitamin D3 Market Market Revenue (US$ Mn) Comparison by By Form Type (2016-2032)
- Table 58: APAC Vitamin D3 Market Market Revenue (US$ Mn) Comparison by By Application (2016-2032)
- Table 59: APAC Vitamin D3 Market Market Y-o-Y Growth Rate Comparison by Country (2016-2032)
- Table 60: APAC Vitamin D3 Market Market Y-o-Y Growth Rate Comparison by By Form Type (2016-2032)
- Table 61: APAC Vitamin D3 Market Market Y-o-Y Growth Rate Comparison by By Application (2016-2032)
- Table 62: APAC Vitamin D3 Market Market Share Comparison by Country (2016-2032)
- Table 63: APAC Vitamin D3 Market Market Share Comparison by By Form Type (2016-2032)
- Table 64: APAC Vitamin D3 Market Market Share Comparison by By Application (2016-2032)
- Table 65: Latin America Vitamin D3 Market Market Comparison by By Form Type (2016-2032)
- Table 66: Latin America Vitamin D3 Market Market Comparison by By Application (2016-2032)
- Table 67: Latin America Vitamin D3 Market Revenue (US$ Mn) Comparison by Country (2016-2032)
- Table 68: Latin America Vitamin D3 Market Market Revenue (US$ Mn) (2016-2032)
- Table 69: Latin America Vitamin D3 Market Market Revenue (US$ Mn) Comparison by Country (2016-2032)
- Table 70: Latin America Vitamin D3 Market Market Revenue (US$ Mn) Comparison by By Form Type (2016-2032)
- Table 71: Latin America Vitamin D3 Market Market Revenue (US$ Mn) Comparison by By Application (2016-2032)
- Table 72: Latin America Vitamin D3 Market Market Y-o-Y Growth Rate Comparison by Country (2016-2032)
- Table 73: Latin America Vitamin D3 Market Market Y-o-Y Growth Rate Comparison by By Form Type (2016-2032)
- Table 74: Latin America Vitamin D3 Market Market Y-o-Y Growth Rate Comparison by By Application (2016-2032)
- Table 75: Latin America Vitamin D3 Market Market Share Comparison by Country (2016-2032)
- Table 76: Latin America Vitamin D3 Market Market Share Comparison by By Form Type (2016-2032)
- Table 77: Latin America Vitamin D3 Market Market Share Comparison by By Application (2016-2032)
- Table 78: Middle East & Africa Vitamin D3 Market Market Comparison by By Form Type (2016-2032)
- Table 79: Middle East & Africa Vitamin D3 Market Market Comparison by By Application (2016-2032)
- Table 80: Middle East & Africa Vitamin D3 Market Revenue (US$ Mn) Comparison by Country (2016-2032)
- Table 81: Middle East & Africa Vitamin D3 Market Market Revenue (US$ Mn) (2016-2032)
- Table 82: Middle East & Africa Vitamin D3 Market Market Revenue (US$ Mn) Comparison by Country (2016-2032)
- Table 83: Middle East & Africa Vitamin D3 Market Market Revenue (US$ Mn) Comparison by By Form Type (2016-2032)
- Table 84: Middle East & Africa Vitamin D3 Market Market Revenue (US$ Mn) Comparison by By Application (2016-2032)
- Table 85: Middle East & Africa Vitamin D3 Market Market Y-o-Y Growth Rate Comparison by Country (2016-2032)
- Table 86: Middle East & Africa Vitamin D3 Market Market Y-o-Y Growth Rate Comparison by By Form Type (2016-2032)
- Table 87: Middle East & Africa Vitamin D3 Market Market Y-o-Y Growth Rate Comparison by By Application (2016-2032)
- Table 88: Middle East & Africa Vitamin D3 Market Market Share Comparison by Country (2016-2032)
- Table 89: Middle East & Africa Vitamin D3 Market Market Share Comparison by By Form Type (2016-2032)
- Table 90: Middle East & Africa Vitamin D3 Market Market Share Comparison by By Application (2016-2032)
- 1. Executive Summary
-
- BASF SE
- Zhejiang NHU Company Ltd.
- Koninklijke DSM N.V.
- Zhejiang Garden Bio-chemical High-tech Co. Ltd.
- Xiamen Kingdomway Group Company
- Zhejiang Xianju Pharmaceutical Co. Ltd.
- Zhejiang Medicine Co. Ltd.
- Fermenta Biotech Limited
- Dishman Carbogen Amcis Limited
- Teva Pharmaceutical Industries Limited
- LycoRed Ltd.
Our Clients


View Our Licence Options
