
Triple Negative Breast Cancer Market By Treatment Type (Immunotherapy, Targeted Therapy, Chemotherapy, Hormone Therapy, Other), By Drug Type (Doxorubicin, Cyclophosphamide, Paclitaxel, Other Drug Types), By Distribution Channel (Hospital Pharmacies, Specialty Cancer Clinics), By Region And Companies - Industry Segment Outlook, Market Assessment, Competition Scenario, Trends, And Forecast 2023-2032
-
39540
-
July 2023
-
137
-


-
This report was compiled by Correspondence Linkedin | Detailed Market research Methodology Our methodology involves a mix of primary research, including interviews with leading mental health experts, and secondary research from reputable medical journals and databases. View Detailed Methodology Page
-
Quick Navigation
Report Overview
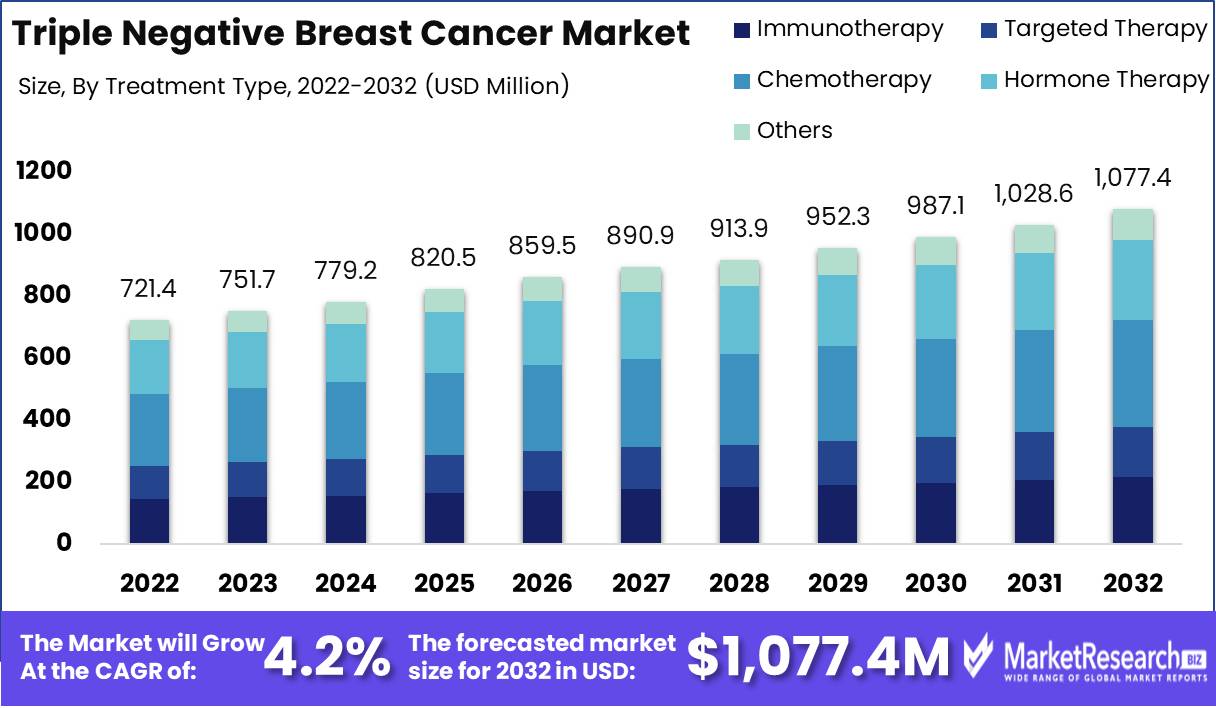
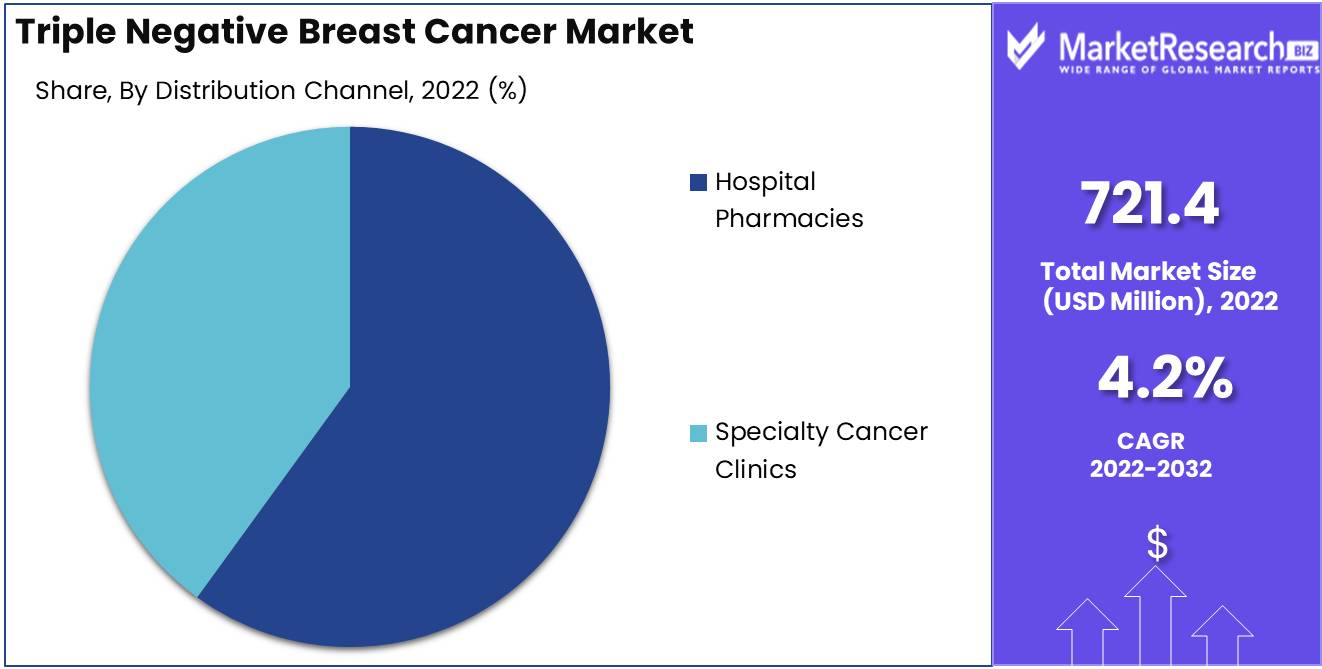
Triple Negative Breast Cancer Market size is expected to be worth around USD 1,077.4 Mn by 2032 from USD 721.4 Mn in 2022, growing at a CAGR of 4.2% during the forecast period from 2023 to 2032.
Triple Negative Breast Cancer Market is an aggressive form of breast cancer that lacks three essential receptors: estrogen receptors (ER), progesterone receptors (PR), and human epidermal growth factor 2 (HER2). These receptors play a crucial part in the progression and development of the vast majority of breast malignancies. TNBC accounts for approximately 15 to 20% of all breast cancer diagnoses, making it a significant concern for the healthcare industry.
The objective of the market for triple-negative breast cancer is to develop and implement effective treatment options for patients with this specific form of breast cancer. The objective of researchers and medical professionals is to identify the mechanisms underlying the resistance to conventional therapies and to develop more effective drugs and treatments for TNBC.
The triple negative breast cancer market is significant due to the limited treatment options for this subtype of breast cancer compared to other subtypes. In TNBC, conventional hormone therapies and targeted therapies like Herceptin have demonstrated little efficacy. Consequently, there is an imperative need to invest in research and development in order to discover new treatments and enhance patient outcomes.
Significant investments in the market for triple-negative breast cancer have enabled the incorporation of these innovations into products and services. Pharmaceutical and biotechnology companies are actively investing in R&D to introduce novel therapeutics to market. Collaborations between academic institutions, private companies, and government agencies also facilitate the application of research findings to clinical practice.
The triple negative breast cancer market's expansion and applications extend beyond the healthcare industry. Biotechnology, pharmaceuticals, medical devices, and diagnostics are among the industries investing heavily in TNBC research and technology. This market expansion not only facilitates the development of new treatment options, but also promotes economic expansion and job creation.
Driving factors
Growing incidence of triple-negative breast cancer
In recent years, the prevalence of TNBC has increased significantly worldwide. TNBC is diagnosed more frequently in younger women, particularly those of African-American or Hispanic descent, despite representing only a minor proportion of all breast cancer cases. This increasing prevalence highlights the need for increased research and the development of better diagnostic and treatment methods.
Diagnostic Procedures and Therapeutic Options
In recent years, tremendous strides have been made in the detection and treatment of TNBC. Diagnostic techniques such as molecular profiling and next-generation sequencing have aided in the identification of the distinct characteristics of TNBC tumors, allowing healthcare professionals to tailor treatment strategies based on the individual patient profiles. In addition, the development of targeted therapies, immunotherapies, and combination treatment approaches has demonstrated promise for enhancing the treatment outcomes of TNBC patients.
Increasing Awareness and Efforts for Early Detection
In the healthcare community, efforts to raise awareness about TNBC and encourage early detection have gained momentum. Public education campaigns, awareness initiatives, and community outreach programs have played an essential role in informing women about the risks, symptoms, and significance of early screening for TNBC. Detection at an early stage substantially increases the likelihood of successful treatment and improved patient outcomes.
Increasing Research and Development Efforts
The triple negative breast cancer market has witnessed an increase in research and development activities aimed at a deeper comprehension of TNBC's underlying mechanisms and the creation of innovative treatment approaches. Innovative discoveries and the development of novel therapeutics that target TNBC-specific markers and pathways have resulted from collaborations between pharmaceutical companies, academic institutions, and research organizations.
Greater emphasis on personalized medicine
In recent years, personalized medicine has acquired momentum, and TNBC is no exception. With a greater comprehension of the genetic and molecular methods of triple-negative breast cancer (TNBC), researchers have been able to identify specific biomarkers and molecular targets that can guide treatment decisions and individualize therapies for patients. For TNBC patients, personalized medicine has enormous potential for enhancing treatment outcomes and reducing the toxicities associated with aggressive treatment regimens.
Restraining Factors
Aggressive and Complex Nature
The absence of estrogen receptors (ER), progesterone receptors (PR), and human epidermal growth factor receptor 2 (HER2) characterizes Triple Negative Breast Cancer Market. This distinct molecular profile makes TNBC more aggressive and difficult to treat than other subtypes of breast cancer.
The complex and aggressive nature of TNBC presents substantial obstacles to the development of effective treatment strategies. This subtype is characterized by rapid growth and a high risk of metastasis to adjacent lymph nodes and distal organs. In addition, TNBC is associated with a higher recurrence rate and lower survival rates overall.
Restricted Therapeutic Options
The lack of specific receptor targets in TNBC restricts the available treatment options for patients. TNBC necessitates alternative treatment strategies, in contrast to other forms of breast cancer for which hormonal therapy and HER2-targeted drugs are efficacious.
Chemotherapy continues to be the most common systemic treatment option for TNBC. Although it can effectively diminish tumors and reduce the risk of recurrence, it is frequently accompanied by difficult side effects and may not provide enduring benefits. In the absence of TNBC-specific targeted therapies, patients and healthcare providers have limited options for managing this aggressive subtype.
Challenges in the Development of Targeted Therapies
Developing targeted therapeutics for TNBC presents numerous obstacles. TNBC tumors' observable molecular heterogeneity is one of the main obstacles. This heterogeneity suggests that each tumor may possess unique genetic characteristics, making it difficult to identify common therapeutic targets.
In addition, the aggressiveness of TNBC frequently necessitates prompt treatment decisions. Developing targeted therapies requires time-consuming research and clinical trials, which may not correlate with the immediate requirements of patients with TNBC. In order to effectively manage TNBC, it is crucial to strike a balance between the urgency of initiating treatment and the time required for therapeutic development.
Cost and Reimbursement Concerns
Reimbursement and cost concerns are also a significant factor impeding the growth of the TNBC market. Innovative targeted therapies and personalized treatment approaches are frequently more expensive than standard chemotherapy. Due to financial constraints, patients may have difficulty gaining access to these potentially life-saving interventions.
In addition, reimbursement policies and guidelines may not always align with the particular requirements of TNBC patients, resulting in access restrictions to certain treatments or services. These reimbursement challenges may restrict the treatment options available to both patients and healthcare providers, thereby impacting the overall management of TNBC.
Variations in Patient Reaction to Therapy
The variable treatment response observed in TNBC patients further complicates the management of this subtype. Some patients may respond favorably to a particular treatment, while others may exhibit resistance or derive limited benefits. This individual variation makes it difficult to determine the most effective treatment for every patient.
Understanding the factors contributing to these differences in treatment response is crucial for the development of personalized treatment approaches. Mutations in genes, the microenvironment of the tumor, and immune system dynamics all play a role in determining a patient's response to TNBC treatment.
Treatment Analysis
The triple negative breast cancer market is dominated by the chemotherapy segment, which plays a crucial role in the treatment of this aggressive form of cancer. Chemotherapy involves the use of drugs to kill cancer cells and is often the first line of treatment for triple negative breast cancer. The dominance of the chemotherapy segment can be attributed to its effectiveness in shrinking tumors and reducing the risk of cancer recurrence.
Consumer trends and behavior towards the chemotherapy segment in the triple negative breast cancer market have also played a crucial role in its dominance. Patients and healthcare professionals have recognized the effectiveness of chemotherapy in reducing tumor size and improving survival rates. This has led to a higher acceptance and preference for chemotherapy as a treatment option among patients, contributing to the segment's dominance.
Drug Type Analysis
The paclitaxel segment has emerged as the dominant drug type in the triple negative breast cancer market. Paclitaxel belongs to the taxane class of chemotherapy drugs and is widely used in the treatment of various cancers, including triple negative breast cancer. The effectiveness of paclitaxel in inhibiting cell division and promoting cancer cell death has made it a preferred choice for oncologists.
Consumer trends and behavior towards the paclitaxel segment have also influenced its dominance in the triple negative breast cancer market. Patients and healthcare professionals have recognized the efficacy of paclitaxel in shrinking tumors and improving overall survival. This has led to a higher preference for paclitaxel as a treatment option, further driving its market dominance.
Distribution Channel Analysis
Hospital pharmacies have emerged as the dominant distribution channel in the triple negative breast cancer market. Hospital pharmacies play a crucial role in providing easy access to chemotherapy drugs and other treatments to patients. They are often equipped with specialized facilities and trained staff to handle and dispense complex medications, making them an essential part of the treatment process.
Consumer trends and behavior have also contributed to the dominance of hospital pharmacies in the triple negative breast cancer market. Patients and healthcare professionals prefer to obtain chemotherapy drugs from hospital pharmacies due to the assurance of quality and safety. Additionally, the presence of oncologists and specialized medical staff in hospitals increases patient trust and confidence in the medications provided.
Key Market Segments
By Treatment Type
- Immunotherapy
- Targeted Therapy
- Chemotherapy
- Hormone Therapy
- Other Treatment Types
By Drug Type
- Doxorubicin
- Cyclophosphamide
- Paclitaxel
- Docetaxel
- Cisplatin/Carboplatin
- Other Drug Types
By Distribution Channel
- Hospital Pharmacies
- Specialty Cancer Clinics
Growth Opportunity
Personalized Medicine: Optimizing Treatment
Precision medicine offers TNBC market development potential. Genomic profiling and molecular diagnostics can help doctors find TNBC cancers' genetic changes and biomarkers. Targeted medicines targeting particular pathways and molecular abnormalities increase treatment results and decrease adverse effects. Targeted medicines in research or clinical studies show promise. These medicines, which disrupt TNBC progression proteins or pathways, might transform treatment and meet TNBC patients' unmet medical requirements. Precision medicine can help doctors handle TNBC more effectively and personally.
Big Data and AI for Innovation
Big data analytics and AI provide TNBC market growth. AI's computational power and massive patient data can reveal patterns, correlations, and treatment responses that improve our understanding of TNBC and guide therapy decisions. AI systems can uncover TNBC subtype, genetic mutation, and treatment response connections by evaluating massive datasets. This crucial understanding can help researchers design new therapy techniques and biomarkers. AI-powered prediction models enhance prognosis and therapy choices, improving patient outcomes.
Telemedicine Integration
Telemedicine integration offers TNBC market growth as we expand into developing areas with expanding healthcare infrastructure. Telemedicine lets doctors diagnose and treat patients remotely. Underserved individuals can receive specialist cancer care via real-time video consultations and remote monitoring. Telemedicine allows healthcare practitioners to reach more patients and give effective TNBC therapy to those without access. This improves patient outcomes and gives pharmaceutical firms additional markets to boost the TNBC market.
Triple Negative Breast Cancer Market: Capitalizing
Researchers, pharmaceutical firms, and healthcare providers are interested in the triple negative breast cancer market's development potential. TNBC management looks promising with novel targeted therapies and immunotherapies, expansion into emerging markets, collaboration with research institutions and cancer centers, precision medicine approaches, and patient education and support programs. Precision medicine, using individualized treatment methods, can help defeat TNBC. Healthcare professionals can improve patient outcomes by detecting molecular changes and treating TNBC progression pathways.
Latest Trends
Immunotherapy and Immune Checkpoint Inhibitors Growth
Oncology has made great strides in treating Triple Negative Breast Cancer Market, an aggressive and difficult subtype of breast cancer. Immunotherapy and immune checkpoint inhibitors are game-changing market developments. TNBC treatment is promising with immunotherapy, which uses the immune system to attack cancer. Immunotherapy targets cancer cells by activating the body's defenses, improving patient outcomes. Immunotherapy's immune checkpoint inhibitors disrupt signals that hinder immune cells from detecting and destroying cancer cells.
Combination therapy and targeted agent demand
Targeted and combined TNBC treatments are also in demand. Researchers and physicians are investigating the synergistic effects of different therapy methods due to this disease's complexity. This technique improves patient survival by increasing therapeutic efficacy and overcoming medication resistance. PARP drugs work well in TNBC individuals with certain genetic alterations. Targeted treatments target the molecular defects that drive cancer cell proliferation, allowing for more customized treatment with fewer side effects.
Patient Stratification Using Biomarkers
Biomarker testing for patient classification is another development influencing TNBC therapy. Biomarkers help identify people who will respond to certain medicines. Healthcare practitioners can improve patient outcomes and avoid ineffective medications by using biomarker testing. PD-L1 expression and BRCA mutations are important indicators for TNBC therapy selection, according to new study. These biomarkers allow for more tailored and accurate treatments, increasing therapeutic effectiveness.
Liquid Biopsy and Circulating Tumor DNA Analysis Rise
Liquid biopsy and ctDNA analysis have changed cancer diagnosis, including TNBC. Liquid biopsy, a non-invasive approach for tumor-related blood sample analysis, has various advantages over tissue biopsies. It allows real-time illness progression tracking, early treatment resistance diagnosis, and targeted therapy mutant identification. Liquid biopsy's circulating tumor DNA analysis can improve TNBC treatment. Clinicians can study the tumor's genetic profile without intrusive procedures by examining ctDNA genetic changes. This technique dynamically monitors treatment response and resistance mutations, enabling rapid therapeutic adjustments.
Clinical Trials and Research Partnerships
Clinical trials and research collaborations are crucial to TNBC research. Evidence-based medicine relies on clinical studies to evaluate new treatments. TNBC patients must be included in research studies to increase treatment alternatives and regulatory clearances. TNBC research has advanced through academic, corporate, and patient advocacy collaborations. These collaborations enhance innovation and disease knowledge by sharing resources, expertise, and data. Collaboration accelerates breakthrough medications and improves patient outcomes.
Regional Analysis
The Triple Negative Breast Cancer Market is dominated by North America. In terms of breast cancer research and treatment, one subtype, Triple Negative Breast Cancer Market, has captured the attention of researchers and medical professionals. This aggressive subtype of breast cancer accounts for roughly 15 to 20% of all breast cancer cases. It is distinguished by the absence of three important receptors: the estrogen receptor (ER), the progesterone receptor (PR), and the human epidermal growth factor receptor 2 (HER2). TNBC presents a significant challenge for clinicians and patients due to its unique molecular profile, necessitating targeted and individualized treatment approaches.
When analyzing the global market for TNBC therapeutics, the North American region arises as the distinct leader. This expansive region, which includes the United States and Canada, is distinguished by its robust healthcare infrastructure, cutting-edge research facilities, and advanced regulatory framework. These factors have contributed to the region's ability to influence the TNBC market significantly.
Over the years, North America has witnessed remarkable advances in TNBC research and treatment. Academic institutions, such as renowned medical centers and universities, have pioneered innovative research in this field. Their unrelenting pursuit of knowledge and substantial funding have resulted in the development of innovative therapies and diagnostic instruments that have revolutionized the treatment of TNBC.
In addition, the regulatory environment in North America is renowned for its rigorous evaluation procedures and adherence to stringent safety and efficacy standards. Before obtaining market approval, regulatory authorities such as the Food and Drug Administration (FDA) and Health Canada ensure that TNBC therapies undergo rigorous testing and evaluation. This comprehensive evaluation procedure ensures that patients have access to high-quality, evidence-based treatments that satisfy the strictest standards for safety and efficacy.
Due to its large population and high incidence rate of breast cancer, North America dominates the global TNBC market in terms of market size. In addition, the region's well-established healthcare infrastructure enables simple access to screening, diagnosis, and treatment services, allowing for early detection and intervention.

Key Regions and Countries
North America
- US
- Canada
- Mexico
Western Europe
- Germany
- France
- The UK
- Spain
- Italy
- Portugal
- Ireland
- Austria
- Switzerland
- Benelux
- Nordic
- Rest of Western Europe
Eastern Europe
- Russia
- Poland
- The Czech Republic
- Greece
- Rest of Eastern Europe
APAC
- China
- Japan
- South Korea
- India
- Australia & New Zealand
- Indonesia
- Malaysia
- Philippines
- Singapore
- Thailand
- Vietnam
- Rest of APAC
Latin America
- Brazil
- Colombia
- Chile
- Argentina
- Costa Rica
- Rest of Latin America
Middle East & Africa
- Algeria
- Egypt
- Israel
- Kuwait
- Nigeria
- Saudi Arabia
- South Africa
- Turkey
- United Arab Emirates
- Rest of MEA
Key Players Analysis
Johnson & Johnson, a leading pharmaceutical business, has pioneered TNBC treatments. Johnson & Johnson pursues research and development to enhance patient outcomes and survival rates. TNBC research has advanced with targeted and immunotherapies. Their new pharmacological pipeline inhibits TNBC development and metastatic routes, boosting therapy effectiveness and lowering side effects.
Cipla, a pharmaceutical giant, has worked hard to make TNBC treatments inexpensive and accessible. Cipla bridges treatment accessibility and price through their knowledge and efficient manufacture. The business develops cost-efficient, safe, and effective medicines. They aggressively research new TNBC-targeting medication formulations and combination treatments to maximize patient benefit.
Abbott, a leading healthcare business, is advancing precision medicine for TNBC patients. Abbott develops diagnostics and tailored treatments to improve therapeutic results and reduce adverse effects. Precision medicine requires genetic profiling and molecular diagnostics to find patient-specific medicines. Abbott's therapeutic recommendations and individualized care improve TNBC patient outcomes.
AbbVie, a major biopharmaceutical business, has developed new TNBC treatments. They study TNBC biology to find new targets and treatments. AbbVie's commitment to immuno-oncology has led to immunotherapies that preferentially target TNBC. Their research and clinical trials promise better treatments and patient results.
Merck KGaA's groundbreaking study advances TNBC research. Merck KGaA develops targeted treatments and immunotherapeutics to meet unmet patient needs. The firm also develops diagnostics and companion diagnostics. Merck KGaA hopes to improve treatment efficacy and personalize care by combining diagnostics and treatments.
Leading Indian pharmaceutical business Sun Pharmaceutical Industries Ltd. leverages innovation and collaboration to improve TNBC therapy availability. They develop safe, cost-effective medicines. Sun Pharmaceutical Industries Ltd.'s comprehensive product line makes TNBC treatment accessible to patients worldwide. Their affordable and accessible approach helps more TNBC patients obtain timely and successful therapy.
Top Key Players in Triple Negative Breast Cancer Market
- Johnson & Johnson Private Limited (U.S.)
- Cipla Inc. (U.S.)
- Abbott (U.S.)
- AbbVie Inc. (U.S.)
- Merck KGaA (Germany)
- Sun Pharmaceutical Industries Ltd. (India)
- Aurobindo Pharma (India)
- Lupin (India)
- Hikma Pharmaceuticals PLC (U.K.)
- Amneal Pharmaceuticals LLC. (U.S.)
- Pfizer Inc (U.S.)
- Mylan N.V. (U.S.)
- Novartis AG (Switzerland)
- Bristol-Myers Squibb Company (U.S.)
- GSK plc. (U.K.)
- Bayer AG (Germany)
Recent Development
- In 2023, Genentech launches a new drug for the treatment of triple negative breast cancer. The drug's development represents a significant milestone in the fight against this challenging form of breast cancer.
- In 2022, Daiichi Sankyo expands its research into new drugs for triple negative breast cancer. By dedicating additional resources and expertise towards this critical area, Daiichi Sankyo aims to identify and develop innovative drugs that can potentially revolutionize the treatment landscape.
- In 2021, Bristol Myers Squibb and Merck & Co. collaborate to develop a novel treatment for triple negative breast cancer. This unique partnership capitalizes on the strengths of both companies, combining their research prowess and resources toward the shared goal of advancing patient care and treatment outcomes.
- In 2020, Roche acquires Ignyta to enhance its triple negative breast cancer therapies. This strategic move allows Roche to leverage Ignyta's innovative research and development pipeline, fostering the creation of potentially life-changing treatment options for patients battling triple negative breast cancer.
Report Scope:
Report Features Description Market Value (2022) USD 721.4 Mn Forecast Revenue (2032) USD 1,077.4 Mn CAGR (2023-2032) 4.2% Base Year for Estimation 2022 Historic Period 2016-2022 Forecast Period 2023-2032 Report Coverage Revenue Forecast, Market Dynamics, COVID-19 Impact, Competitive Landscape, Recent Developments Segments Covered By Treatment Type (Immunotherapy, Targeted Therapy, Chemotherapy, Hormone Therapy, Other Treatment Types)
By Drug Type (Doxorubicin, Cyclophosphamide, Paclitaxel, Docetaxel, Cisplatin/Carboplatin, Other Drug Types)
By Distribution Channel (Hospital Pharmacies, Specialty Cancer ClinicsRegional Analysis North America – The US, Canada, & Mexico; Western Europe – Germany, France, The UK, Spain, Italy, Portugal, Ireland, Austria, Switzerland, Benelux, Nordic, & Rest of Western Europe; Eastern Europe – Russia, Poland, The Czech Republic, Greece, & Rest of Eastern Europe; APAC – China, Japan, South Korea, India, Australia & New Zealand, Indonesia, Malaysia, Philippines, Singapore, Thailand, Vietnam, & Rest of APAC; Latin America – Brazil, Colombia, Chile, Argentina, Costa Rica, & Rest of Latin America; Middle East & Africa – Algeria, Egypt, Israel, Kuwait, Nigeria, Saudi Arabia, South Africa, Turkey, United Arab Emirates, & Rest of MEA Competitive Landscape Johnson & Johnson Private Limited (U.S.), Cipla Inc. (U.S.), Abbott (U.S.), AbbVie Inc. (U.S.), Merck KGaA (Germany), Sun Pharmaceutical Industries Ltd. (India), Aurobindo Pharma (India), Lupin (India), Hikma Pharmaceuticals PLC (U.K.), Amneal Pharmaceuticals LLC. (U.S.), Pfizer Inc (U.S.), Mylan N.V. (U.S.), Novartis AG (Switzerland), Bristol-Myers Squibb Company (U.S.), GSK plc. (U.K.), Bayer AG (Germany) Customization Scope Customization for segments, region/country-level will be provided. Moreover, additional customization can be done based on the requirements. Purchase Options We have three licenses to opt for: Single User License, Multi-User License (Up to 5 Users), Corporate Use License (Unlimited User and Printable PDF) -
- 1. Executive Summary
- 1.1. Definition
- 1.2. Taxonomy
- 1.3. Research Scope
- 1.4. Key Analysis
- 1.5. Key Findings by Major Segments
- 1.6. Top strategies by Major Players
- 2. Global Triple Negative Breast Cancer Market Overview
- 2.1. Triple Negative Breast Cancer Market Dynamics
- 2.1.1. Drivers
- 2.1.2. Opportunities
- 2.1.3. Restraints
- 2.1.4. Challenges
- 2.2. Macro-economic Factors
- 2.3. Regulatory Framework
- 2.4. Market Investment Feasibility Index
- 2.5. PEST Analysis
- 2.6. PORTER’S Five Force Analysis
- 2.7. Drivers & Restraints Impact Analysis
- 2.8. Industry Chain Analysis
- 2.9. Cost Structure Analysis
- 2.10. Marketing Strategy
- 2.11. Russia-Ukraine War Impact Analysis
- 2.12. Opportunity Map Analysis
- 2.13. Market Competition Scenario Analysis
- 2.14. Product Life Cycle Analysis
- 2.15. Opportunity Orbits
- 2.16. Manufacturer Intensity Map
- 2.17. Major Companies sales by Value & Volume
- 2.1. Triple Negative Breast Cancer Market Dynamics
- 3. Global Triple Negative Breast Cancer Market Analysis, Opportunity and Forecast, 2016-2032
- 3.1. Global Triple Negative Breast Cancer Market Analysis, 2016-2021
- 3.2. Global Triple Negative Breast Cancer Market Opportunity and Forecast, 2023-2032
- 3.3. Global Triple Negative Breast Cancer Market Analysis, Opportunity and Forecast, By By Treatment Type, 2016-2032
- 3.3.1. Global Triple Negative Breast Cancer Market Analysis by By Treatment Type: Introduction
- 3.3.2. Market Size Absolute $ Opportunity Analysis and Forecast, By By Treatment Type, 2016-2032
- 3.3.3. Immunotherapy
- 3.3.4. Targeted Therapy
- 3.3.5. Chemotherapy
- 3.3.6. Hormone Therapy
- 3.3.7. Other Treatment Types
- 3.4. Global Triple Negative Breast Cancer Market Analysis, Opportunity and Forecast, By By Drug Type, 2016-2032
- 3.4.1. Global Triple Negative Breast Cancer Market Analysis by By Drug Type: Introduction
- 3.4.2. Market Size Absolute $ Opportunity Analysis and Forecast, By By Drug Type, 2016-2032
- 3.4.3. Doxorubicin
- 3.4.4. Cyclophosphamide
- 3.4.5. Paclitaxel
- 3.4.6. Docetaxel
- 3.4.7. Cisplatin/Carboplatin
- 3.4.8. Other Drug Types
- 3.5. Global Triple Negative Breast Cancer Market Analysis, Opportunity and Forecast, By By Distribution Channel, 2016-2032
- 3.5.1. Global Triple Negative Breast Cancer Market Analysis by By Distribution Channel: Introduction
- 3.5.2. Market Size Absolute $ Opportunity Analysis and Forecast, By By Distribution Channel, 2016-2032
- 3.5.3. Hospital Pharmacies
- 3.5.4. Specialty Cancer Clinics
- 4. North America Triple Negative Breast Cancer Market Analysis, Opportunity and Forecast, 2016-2032
- 4.1. North America Triple Negative Breast Cancer Market Analysis, 2016-2021
- 4.2. North America Triple Negative Breast Cancer Market Opportunity and Forecast, 2023-2032
- 4.3. North America Triple Negative Breast Cancer Market Analysis, Opportunity and Forecast, By By Treatment Type, 2016-2032
- 4.3.1. North America Triple Negative Breast Cancer Market Analysis by By Treatment Type: Introduction
- 4.3.2. Market Size Absolute $ Opportunity Analysis and Forecast, By By Treatment Type, 2016-2032
- 4.3.3. Immunotherapy
- 4.3.4. Targeted Therapy
- 4.3.5. Chemotherapy
- 4.3.6. Hormone Therapy
- 4.3.7. Other Treatment Types
- 4.4. North America Triple Negative Breast Cancer Market Analysis, Opportunity and Forecast, By By Drug Type, 2016-2032
- 4.4.1. North America Triple Negative Breast Cancer Market Analysis by By Drug Type: Introduction
- 4.4.2. Market Size Absolute $ Opportunity Analysis and Forecast, By By Drug Type, 2016-2032
- 4.4.3. Doxorubicin
- 4.4.4. Cyclophosphamide
- 4.4.5. Paclitaxel
- 4.4.6. Docetaxel
- 4.4.7. Cisplatin/Carboplatin
- 4.4.8. Other Drug Types
- 4.5. North America Triple Negative Breast Cancer Market Analysis, Opportunity and Forecast, By By Distribution Channel, 2016-2032
- 4.5.1. North America Triple Negative Breast Cancer Market Analysis by By Distribution Channel: Introduction
- 4.5.2. Market Size Absolute $ Opportunity Analysis and Forecast, By By Distribution Channel, 2016-2032
- 4.5.3. Hospital Pharmacies
- 4.5.4. Specialty Cancer Clinics
- 4.6. North America Triple Negative Breast Cancer Market Analysis, Opportunity and Forecast, By Country , 2016-2032
- 4.6.1. North America Triple Negative Breast Cancer Market Analysis by Country : Introduction
- 4.6.2. Market Size Absolute $ Opportunity Analysis and Forecast, Country , 2016-2032
- 4.6.2.1. The US
- 4.6.2.2. Canada
- 4.6.2.3. Mexico
- 5. Western Europe Triple Negative Breast Cancer Market Analysis, Opportunity and Forecast, 2016-2032
- 5.1. Western Europe Triple Negative Breast Cancer Market Analysis, 2016-2021
- 5.2. Western Europe Triple Negative Breast Cancer Market Opportunity and Forecast, 2023-2032
- 5.3. Western Europe Triple Negative Breast Cancer Market Analysis, Opportunity and Forecast, By By Treatment Type, 2016-2032
- 5.3.1. Western Europe Triple Negative Breast Cancer Market Analysis by By Treatment Type: Introduction
- 5.3.2. Market Size Absolute $ Opportunity Analysis and Forecast, By By Treatment Type, 2016-2032
- 5.3.3. Immunotherapy
- 5.3.4. Targeted Therapy
- 5.3.5. Chemotherapy
- 5.3.6. Hormone Therapy
- 5.3.7. Other Treatment Types
- 5.4. Western Europe Triple Negative Breast Cancer Market Analysis, Opportunity and Forecast, By By Drug Type, 2016-2032
- 5.4.1. Western Europe Triple Negative Breast Cancer Market Analysis by By Drug Type: Introduction
- 5.4.2. Market Size Absolute $ Opportunity Analysis and Forecast, By By Drug Type, 2016-2032
- 5.4.3. Doxorubicin
- 5.4.4. Cyclophosphamide
- 5.4.5. Paclitaxel
- 5.4.6. Docetaxel
- 5.4.7. Cisplatin/Carboplatin
- 5.4.8. Other Drug Types
- 5.5. Western Europe Triple Negative Breast Cancer Market Analysis, Opportunity and Forecast, By By Distribution Channel, 2016-2032
- 5.5.1. Western Europe Triple Negative Breast Cancer Market Analysis by By Distribution Channel: Introduction
- 5.5.2. Market Size Absolute $ Opportunity Analysis and Forecast, By By Distribution Channel, 2016-2032
- 5.5.3. Hospital Pharmacies
- 5.5.4. Specialty Cancer Clinics
- 5.6. Western Europe Triple Negative Breast Cancer Market Analysis, Opportunity and Forecast, By Country , 2016-2032
- 5.6.1. Western Europe Triple Negative Breast Cancer Market Analysis by Country : Introduction
- 5.6.2. Market Size Absolute $ Opportunity Analysis and Forecast, Country , 2016-2032
- 5.6.2.1. Germany
- 5.6.2.2. France
- 5.6.2.3. The UK
- 5.6.2.4. Spain
- 5.6.2.5. Italy
- 5.6.2.6. Portugal
- 5.6.2.7. Ireland
- 5.6.2.8. Austria
- 5.6.2.9. Switzerland
- 5.6.2.10. Benelux
- 5.6.2.11. Nordic
- 5.6.2.12. Rest of Western Europe
- 6. Eastern Europe Triple Negative Breast Cancer Market Analysis, Opportunity and Forecast, 2016-2032
- 6.1. Eastern Europe Triple Negative Breast Cancer Market Analysis, 2016-2021
- 6.2. Eastern Europe Triple Negative Breast Cancer Market Opportunity and Forecast, 2023-2032
- 6.3. Eastern Europe Triple Negative Breast Cancer Market Analysis, Opportunity and Forecast, By By Treatment Type, 2016-2032
- 6.3.1. Eastern Europe Triple Negative Breast Cancer Market Analysis by By Treatment Type: Introduction
- 6.3.2. Market Size Absolute $ Opportunity Analysis and Forecast, By By Treatment Type, 2016-2032
- 6.3.3. Immunotherapy
- 6.3.4. Targeted Therapy
- 6.3.5. Chemotherapy
- 6.3.6. Hormone Therapy
- 6.3.7. Other Treatment Types
- 6.4. Eastern Europe Triple Negative Breast Cancer Market Analysis, Opportunity and Forecast, By By Drug Type, 2016-2032
- 6.4.1. Eastern Europe Triple Negative Breast Cancer Market Analysis by By Drug Type: Introduction
- 6.4.2. Market Size Absolute $ Opportunity Analysis and Forecast, By By Drug Type, 2016-2032
- 6.4.3. Doxorubicin
- 6.4.4. Cyclophosphamide
- 6.4.5. Paclitaxel
- 6.4.6. Docetaxel
- 6.4.7. Cisplatin/Carboplatin
- 6.4.8. Other Drug Types
- 6.5. Eastern Europe Triple Negative Breast Cancer Market Analysis, Opportunity and Forecast, By By Distribution Channel, 2016-2032
- 6.5.1. Eastern Europe Triple Negative Breast Cancer Market Analysis by By Distribution Channel: Introduction
- 6.5.2. Market Size Absolute $ Opportunity Analysis and Forecast, By By Distribution Channel, 2016-2032
- 6.5.3. Hospital Pharmacies
- 6.5.4. Specialty Cancer Clinics
- 6.6. Eastern Europe Triple Negative Breast Cancer Market Analysis, Opportunity and Forecast, By Country , 2016-2032
- 6.6.1. Eastern Europe Triple Negative Breast Cancer Market Analysis by Country : Introduction
- 6.6.2. Market Size Absolute $ Opportunity Analysis and Forecast, Country , 2016-2032
- 6.6.2.1. Russia
- 6.6.2.2. Poland
- 6.6.2.3. The Czech Republic
- 6.6.2.4. Greece
- 6.6.2.5. Rest of Eastern Europe
- 7. APAC Triple Negative Breast Cancer Market Analysis, Opportunity and Forecast, 2016-2032
- 7.1. APAC Triple Negative Breast Cancer Market Analysis, 2016-2021
- 7.2. APAC Triple Negative Breast Cancer Market Opportunity and Forecast, 2023-2032
- 7.3. APAC Triple Negative Breast Cancer Market Analysis, Opportunity and Forecast, By By Treatment Type, 2016-2032
- 7.3.1. APAC Triple Negative Breast Cancer Market Analysis by By Treatment Type: Introduction
- 7.3.2. Market Size Absolute $ Opportunity Analysis and Forecast, By By Treatment Type, 2016-2032
- 7.3.3. Immunotherapy
- 7.3.4. Targeted Therapy
- 7.3.5. Chemotherapy
- 7.3.6. Hormone Therapy
- 7.3.7. Other Treatment Types
- 7.4. APAC Triple Negative Breast Cancer Market Analysis, Opportunity and Forecast, By By Drug Type, 2016-2032
- 7.4.1. APAC Triple Negative Breast Cancer Market Analysis by By Drug Type: Introduction
- 7.4.2. Market Size Absolute $ Opportunity Analysis and Forecast, By By Drug Type, 2016-2032
- 7.4.3. Doxorubicin
- 7.4.4. Cyclophosphamide
- 7.4.5. Paclitaxel
- 7.4.6. Docetaxel
- 7.4.7. Cisplatin/Carboplatin
- 7.4.8. Other Drug Types
- 7.5. APAC Triple Negative Breast Cancer Market Analysis, Opportunity and Forecast, By By Distribution Channel, 2016-2032
- 7.5.1. APAC Triple Negative Breast Cancer Market Analysis by By Distribution Channel: Introduction
- 7.5.2. Market Size Absolute $ Opportunity Analysis and Forecast, By By Distribution Channel, 2016-2032
- 7.5.3. Hospital Pharmacies
- 7.5.4. Specialty Cancer Clinics
- 7.6. APAC Triple Negative Breast Cancer Market Analysis, Opportunity and Forecast, By Country , 2016-2032
- 7.6.1. APAC Triple Negative Breast Cancer Market Analysis by Country : Introduction
- 7.6.2. Market Size Absolute $ Opportunity Analysis and Forecast, Country , 2016-2032
- 7.6.2.1. China
- 7.6.2.2. Japan
- 7.6.2.3. South Korea
- 7.6.2.4. India
- 7.6.2.5. Australia & New Zeland
- 7.6.2.6. Indonesia
- 7.6.2.7. Malaysia
- 7.6.2.8. Philippines
- 7.6.2.9. Singapore
- 7.6.2.10. Thailand
- 7.6.2.11. Vietnam
- 7.6.2.12. Rest of APAC
- 8. Latin America Triple Negative Breast Cancer Market Analysis, Opportunity and Forecast, 2016-2032
- 8.1. Latin America Triple Negative Breast Cancer Market Analysis, 2016-2021
- 8.2. Latin America Triple Negative Breast Cancer Market Opportunity and Forecast, 2023-2032
- 8.3. Latin America Triple Negative Breast Cancer Market Analysis, Opportunity and Forecast, By By Treatment Type, 2016-2032
- 8.3.1. Latin America Triple Negative Breast Cancer Market Analysis by By Treatment Type: Introduction
- 8.3.2. Market Size Absolute $ Opportunity Analysis and Forecast, By By Treatment Type, 2016-2032
- 8.3.3. Immunotherapy
- 8.3.4. Targeted Therapy
- 8.3.5. Chemotherapy
- 8.3.6. Hormone Therapy
- 8.3.7. Other Treatment Types
- 8.4. Latin America Triple Negative Breast Cancer Market Analysis, Opportunity and Forecast, By By Drug Type, 2016-2032
- 8.4.1. Latin America Triple Negative Breast Cancer Market Analysis by By Drug Type: Introduction
- 8.4.2. Market Size Absolute $ Opportunity Analysis and Forecast, By By Drug Type, 2016-2032
- 8.4.3. Doxorubicin
- 8.4.4. Cyclophosphamide
- 8.4.5. Paclitaxel
- 8.4.6. Docetaxel
- 8.4.7. Cisplatin/Carboplatin
- 8.4.8. Other Drug Types
- 8.5. Latin America Triple Negative Breast Cancer Market Analysis, Opportunity and Forecast, By By Distribution Channel, 2016-2032
- 8.5.1. Latin America Triple Negative Breast Cancer Market Analysis by By Distribution Channel: Introduction
- 8.5.2. Market Size Absolute $ Opportunity Analysis and Forecast, By By Distribution Channel, 2016-2032
- 8.5.3. Hospital Pharmacies
- 8.5.4. Specialty Cancer Clinics
- 8.6. Latin America Triple Negative Breast Cancer Market Analysis, Opportunity and Forecast, By Country , 2016-2032
- 8.6.1. Latin America Triple Negative Breast Cancer Market Analysis by Country : Introduction
- 8.6.2. Market Size Absolute $ Opportunity Analysis and Forecast, Country , 2016-2032
- 8.6.2.1. Brazil
- 8.6.2.2. Colombia
- 8.6.2.3. Chile
- 8.6.2.4. Argentina
- 8.6.2.5. Costa Rica
- 8.6.2.6. Rest of Latin America
- 9. Middle East & Africa Triple Negative Breast Cancer Market Analysis, Opportunity and Forecast, 2016-2032
- 9.1. Middle East & Africa Triple Negative Breast Cancer Market Analysis, 2016-2021
- 9.2. Middle East & Africa Triple Negative Breast Cancer Market Opportunity and Forecast, 2023-2032
- 9.3. Middle East & Africa Triple Negative Breast Cancer Market Analysis, Opportunity and Forecast, By By Treatment Type, 2016-2032
- 9.3.1. Middle East & Africa Triple Negative Breast Cancer Market Analysis by By Treatment Type: Introduction
- 9.3.2. Market Size Absolute $ Opportunity Analysis and Forecast, By By Treatment Type, 2016-2032
- 9.3.3. Immunotherapy
- 9.3.4. Targeted Therapy
- 9.3.5. Chemotherapy
- 9.3.6. Hormone Therapy
- 9.3.7. Other Treatment Types
- 9.4. Middle East & Africa Triple Negative Breast Cancer Market Analysis, Opportunity and Forecast, By By Drug Type, 2016-2032
- 9.4.1. Middle East & Africa Triple Negative Breast Cancer Market Analysis by By Drug Type: Introduction
- 9.4.2. Market Size Absolute $ Opportunity Analysis and Forecast, By By Drug Type, 2016-2032
- 9.4.3. Doxorubicin
- 9.4.4. Cyclophosphamide
- 9.4.5. Paclitaxel
- 9.4.6. Docetaxel
- 9.4.7. Cisplatin/Carboplatin
- 9.4.8. Other Drug Types
- 9.5. Middle East & Africa Triple Negative Breast Cancer Market Analysis, Opportunity and Forecast, By By Distribution Channel, 2016-2032
- 9.5.1. Middle East & Africa Triple Negative Breast Cancer Market Analysis by By Distribution Channel: Introduction
- 9.5.2. Market Size Absolute $ Opportunity Analysis and Forecast, By By Distribution Channel, 2016-2032
- 9.5.3. Hospital Pharmacies
- 9.5.4. Specialty Cancer Clinics
- 9.6. Middle East & Africa Triple Negative Breast Cancer Market Analysis, Opportunity and Forecast, By Country , 2016-2032
- 9.6.1. Middle East & Africa Triple Negative Breast Cancer Market Analysis by Country : Introduction
- 9.6.2. Market Size Absolute $ Opportunity Analysis and Forecast, Country , 2016-2032
- 9.6.2.1. Algeria
- 9.6.2.2. Egypt
- 9.6.2.3. Israel
- 9.6.2.4. Kuwait
- 9.6.2.5. Nigeria
- 9.6.2.6. Saudi Arabia
- 9.6.2.7. South Africa
- 9.6.2.8. Turkey
- 9.6.2.9. The UAE
- 9.6.2.10. Rest of MEA
- 10. Global Triple Negative Breast Cancer Market Analysis, Opportunity and Forecast, By Region , 2016-2032
- 10.1. Global Triple Negative Breast Cancer Market Analysis by Region : Introduction
- 10.2. Market Size Absolute $ Opportunity Analysis and Forecast, By Region , 2016-2032
- 10.2.1. North America
- 10.2.2. Western Europe
- 10.2.3. Eastern Europe
- 10.2.4. APAC
- 10.2.5. Latin America
- 10.2.6. Middle East & Africa
- 11. Global Triple Negative Breast Cancer Market Competitive Landscape, Market Share Analysis, and Company Profiles
- 11.1. Market Share Analysis
- 11.2. Company Profiles
- 11.3. Johnson & Johnson Private Limited (U.S.)
- 11.3.1. Company Overview
- 11.3.2. Financial Highlights
- 11.3.3. Product Portfolio
- 11.3.4. SWOT Analysis
- 11.3.5. Key Strategies and Developments
- 11.4. Cipla Inc. (U.S.)
- 11.4.1. Company Overview
- 11.4.2. Financial Highlights
- 11.4.3. Product Portfolio
- 11.4.4. SWOT Analysis
- 11.4.5. Key Strategies and Developments
- 11.5. Abbott (U.S.)
- 11.5.1. Company Overview
- 11.5.2. Financial Highlights
- 11.5.3. Product Portfolio
- 11.5.4. SWOT Analysis
- 11.5.5. Key Strategies and Developments
- 11.6. AbbVie Inc. (U.S.)
- 11.6.1. Company Overview
- 11.6.2. Financial Highlights
- 11.6.3. Product Portfolio
- 11.6.4. SWOT Analysis
- 11.6.5. Key Strategies and Developments
- 11.7. Merck KGaA (Germany)
- 11.7.1. Company Overview
- 11.7.2. Financial Highlights
- 11.7.3. Product Portfolio
- 11.7.4. SWOT Analysis
- 11.7.5. Key Strategies and Developments
- 11.8. Sun Pharmaceutical Industries Ltd. (India)
- 11.8.1. Company Overview
- 11.8.2. Financial Highlights
- 11.8.3. Product Portfolio
- 11.8.4. SWOT Analysis
- 11.8.5. Key Strategies and Developments
- 11.9. Aurobindo Pharma (India)
- 11.9.1. Company Overview
- 11.9.2. Financial Highlights
- 11.9.3. Product Portfolio
- 11.9.4. SWOT Analysis
- 11.9.5. Key Strategies and Developments
- 11.10. Lupin (India)
- 11.10.1. Company Overview
- 11.10.2. Financial Highlights
- 11.10.3. Product Portfolio
- 11.10.4. SWOT Analysis
- 11.10.5. Key Strategies and Developments
- 11.11. Hikma Pharmaceuticals PLC (U.K.)
- 11.11.1. Company Overview
- 11.11.2. Financial Highlights
- 11.11.3. Product Portfolio
- 11.11.4. SWOT Analysis
- 11.11.5. Key Strategies and Developments
- 11.12. Amneal Pharmaceuticals LLC. (U.S.)
- 11.12.1. Company Overview
- 11.12.2. Financial Highlights
- 11.12.3. Product Portfolio
- 11.12.4. SWOT Analysis
- 11.12.5. Key Strategies and Developments
- 11.13. Pfizer Inc (U.S.)
- 11.13.1. Company Overview
- 11.13.2. Financial Highlights
- 11.13.3. Product Portfolio
- 11.13.4. SWOT Analysis
- 11.13.5. Key Strategies and Developments
- 11.14. Mylan N.V. (U.S.)
- 11.14.1. Company Overview
- 11.14.2. Financial Highlights
- 11.14.3. Product Portfolio
- 11.14.4. SWOT Analysis
- 11.14.5. Key Strategies and Developments
- 11.15. Novartis AG (Switzerland)
- 11.15.1. Company Overview
- 11.15.2. Financial Highlights
- 11.15.3. Product Portfolio
- 11.15.4. SWOT Analysis
- 11.15.5. Key Strategies and Developments
- 11.16. Bristol-Myers Squibb Company (U.S.)
- 11.16.1. Company Overview
- 11.16.2. Financial Highlights
- 11.16.3. Product Portfolio
- 11.16.4. SWOT Analysis
- 11.16.5. Key Strategies and Developments
- 11.17. GSK plc. (U.K.)
- 11.17.1. Company Overview
- 11.17.2. Financial Highlights
- 11.17.3. Product Portfolio
- 11.17.4. SWOT Analysis
- 11.17.5. Key Strategies and Developments
- 11.18. Bayer AG (Germany)
- 11.18.1. Company Overview
- 11.18.2. Financial Highlights
- 11.18.3. Product Portfolio
- 11.18.4. SWOT Analysis
- 11.18.5. Key Strategies and Developments
- 12. Assumptions and Acronyms
- 13. Research Methodology
- 14. Contact
- List of Figures
- Figure 1: Global Triple Negative Breast Cancer Market Revenue (US$ Mn) Market Share by By Treatment Type in 2022
- Figure 2: Global Triple Negative Breast Cancer Market Attractiveness Analysis by By Treatment Type, 2016-2032
- Figure 3: Global Triple Negative Breast Cancer Market Revenue (US$ Mn) Market Share by By Drug Typein 2022
- Figure 4: Global Triple Negative Breast Cancer Market Attractiveness Analysis by By Drug Type, 2016-2032
- Figure 5: Global Triple Negative Breast Cancer Market Revenue (US$ Mn) Market Share by By Distribution Channelin 2022
- Figure 6: Global Triple Negative Breast Cancer Market Attractiveness Analysis by By Distribution Channel, 2016-2032
- Figure 7: Global Triple Negative Breast Cancer Market Revenue (US$ Mn) Market Share by Region in 2022
- Figure 8: Global Triple Negative Breast Cancer Market Attractiveness Analysis by Region, 2016-2032
- Figure 9: Global Triple Negative Breast Cancer Market Revenue (US$ Mn) (2016-2032)
- Figure 10: Global Triple Negative Breast Cancer Market Revenue (US$ Mn) Comparison by Region (2016-2032)
- Figure 11: Global Triple Negative Breast Cancer Market Revenue (US$ Mn) Comparison by By Treatment Type (2016-2032)
- Figure 12: Global Triple Negative Breast Cancer Market Revenue (US$ Mn) Comparison by By Drug Type (2016-2032)
- Figure 13: Global Triple Negative Breast Cancer Market Revenue (US$ Mn) Comparison by By Distribution Channel (2016-2032)
- Figure 14: Global Triple Negative Breast Cancer Market Y-o-Y Growth Rate Comparison by Region (2016-2032)
- Figure 15: Global Triple Negative Breast Cancer Market Y-o-Y Growth Rate Comparison by By Treatment Type (2016-2032)
- Figure 16: Global Triple Negative Breast Cancer Market Y-o-Y Growth Rate Comparison by By Drug Type (2016-2032)
- Figure 17: Global Triple Negative Breast Cancer Market Y-o-Y Growth Rate Comparison by By Distribution Channel (2016-2032)
- Figure 18: Global Triple Negative Breast Cancer Market Share Comparison by Region (2016-2032)
- Figure 19: Global Triple Negative Breast Cancer Market Share Comparison by By Treatment Type (2016-2032)
- Figure 20: Global Triple Negative Breast Cancer Market Share Comparison by By Drug Type (2016-2032)
- Figure 21: Global Triple Negative Breast Cancer Market Share Comparison by By Distribution Channel (2016-2032)
- Figure 22: North America Triple Negative Breast Cancer Market Revenue (US$ Mn) Market Share by By Treatment Typein 2022
- Figure 23: North America Triple Negative Breast Cancer Market Attractiveness Analysis by By Treatment Type, 2016-2032
- Figure 24: North America Triple Negative Breast Cancer Market Revenue (US$ Mn) Market Share by By Drug Typein 2022
- Figure 25: North America Triple Negative Breast Cancer Market Attractiveness Analysis by By Drug Type, 2016-2032
- Figure 26: North America Triple Negative Breast Cancer Market Revenue (US$ Mn) Market Share by By Distribution Channelin 2022
- Figure 27: North America Triple Negative Breast Cancer Market Attractiveness Analysis by By Distribution Channel, 2016-2032
- Figure 28: North America Triple Negative Breast Cancer Market Revenue (US$ Mn) Market Share by Country in 2022
- Figure 29: North America Triple Negative Breast Cancer Market Attractiveness Analysis by Country, 2016-2032
- Figure 30: North America Triple Negative Breast Cancer Market Revenue (US$ Mn) (2016-2032)
- Figure 31: North America Triple Negative Breast Cancer Market Revenue (US$ Mn) Comparison by Country (2016-2032)
- Figure 32: North America Triple Negative Breast Cancer Market Revenue (US$ Mn) Comparison by By Treatment Type (2016-2032)
- Figure 33: North America Triple Negative Breast Cancer Market Revenue (US$ Mn) Comparison by By Drug Type (2016-2032)
- Figure 34: North America Triple Negative Breast Cancer Market Revenue (US$ Mn) Comparison by By Distribution Channel (2016-2032)
- Figure 35: North America Triple Negative Breast Cancer Market Y-o-Y Growth Rate Comparison by Country (2016-2032)
- Figure 36: North America Triple Negative Breast Cancer Market Y-o-Y Growth Rate Comparison by By Treatment Type (2016-2032)
- Figure 37: North America Triple Negative Breast Cancer Market Y-o-Y Growth Rate Comparison by By Drug Type (2016-2032)
- Figure 38: North America Triple Negative Breast Cancer Market Y-o-Y Growth Rate Comparison by By Distribution Channel (2016-2032)
- Figure 39: North America Triple Negative Breast Cancer Market Share Comparison by Country (2016-2032)
- Figure 40: North America Triple Negative Breast Cancer Market Share Comparison by By Treatment Type (2016-2032)
- Figure 41: North America Triple Negative Breast Cancer Market Share Comparison by By Drug Type (2016-2032)
- Figure 42: North America Triple Negative Breast Cancer Market Share Comparison by By Distribution Channel (2016-2032)
- Figure 43: Western Europe Triple Negative Breast Cancer Market Revenue (US$ Mn) Market Share by By Treatment Typein 2022
- Figure 44: Western Europe Triple Negative Breast Cancer Market Attractiveness Analysis by By Treatment Type, 2016-2032
- Figure 45: Western Europe Triple Negative Breast Cancer Market Revenue (US$ Mn) Market Share by By Drug Typein 2022
- Figure 46: Western Europe Triple Negative Breast Cancer Market Attractiveness Analysis by By Drug Type, 2016-2032
- Figure 47: Western Europe Triple Negative Breast Cancer Market Revenue (US$ Mn) Market Share by By Distribution Channelin 2022
- Figure 48: Western Europe Triple Negative Breast Cancer Market Attractiveness Analysis by By Distribution Channel, 2016-2032
- Figure 49: Western Europe Triple Negative Breast Cancer Market Revenue (US$ Mn) Market Share by Country in 2022
- Figure 50: Western Europe Triple Negative Breast Cancer Market Attractiveness Analysis by Country, 2016-2032
- Figure 51: Western Europe Triple Negative Breast Cancer Market Revenue (US$ Mn) (2016-2032)
- Figure 52: Western Europe Triple Negative Breast Cancer Market Revenue (US$ Mn) Comparison by Country (2016-2032)
- Figure 53: Western Europe Triple Negative Breast Cancer Market Revenue (US$ Mn) Comparison by By Treatment Type (2016-2032)
- Figure 54: Western Europe Triple Negative Breast Cancer Market Revenue (US$ Mn) Comparison by By Drug Type (2016-2032)
- Figure 55: Western Europe Triple Negative Breast Cancer Market Revenue (US$ Mn) Comparison by By Distribution Channel (2016-2032)
- Figure 56: Western Europe Triple Negative Breast Cancer Market Y-o-Y Growth Rate Comparison by Country (2016-2032)
- Figure 57: Western Europe Triple Negative Breast Cancer Market Y-o-Y Growth Rate Comparison by By Treatment Type (2016-2032)
- Figure 58: Western Europe Triple Negative Breast Cancer Market Y-o-Y Growth Rate Comparison by By Drug Type (2016-2032)
- Figure 59: Western Europe Triple Negative Breast Cancer Market Y-o-Y Growth Rate Comparison by By Distribution Channel (2016-2032)
- Figure 60: Western Europe Triple Negative Breast Cancer Market Share Comparison by Country (2016-2032)
- Figure 61: Western Europe Triple Negative Breast Cancer Market Share Comparison by By Treatment Type (2016-2032)
- Figure 62: Western Europe Triple Negative Breast Cancer Market Share Comparison by By Drug Type (2016-2032)
- Figure 63: Western Europe Triple Negative Breast Cancer Market Share Comparison by By Distribution Channel (2016-2032)
- Figure 64: Eastern Europe Triple Negative Breast Cancer Market Revenue (US$ Mn) Market Share by By Treatment Typein 2022
- Figure 65: Eastern Europe Triple Negative Breast Cancer Market Attractiveness Analysis by By Treatment Type, 2016-2032
- Figure 66: Eastern Europe Triple Negative Breast Cancer Market Revenue (US$ Mn) Market Share by By Drug Typein 2022
- Figure 67: Eastern Europe Triple Negative Breast Cancer Market Attractiveness Analysis by By Drug Type, 2016-2032
- Figure 68: Eastern Europe Triple Negative Breast Cancer Market Revenue (US$ Mn) Market Share by By Distribution Channelin 2022
- Figure 69: Eastern Europe Triple Negative Breast Cancer Market Attractiveness Analysis by By Distribution Channel, 2016-2032
- Figure 70: Eastern Europe Triple Negative Breast Cancer Market Revenue (US$ Mn) Market Share by Country in 2022
- Figure 71: Eastern Europe Triple Negative Breast Cancer Market Attractiveness Analysis by Country, 2016-2032
- Figure 72: Eastern Europe Triple Negative Breast Cancer Market Revenue (US$ Mn) (2016-2032)
- Figure 73: Eastern Europe Triple Negative Breast Cancer Market Revenue (US$ Mn) Comparison by Country (2016-2032)
- Figure 74: Eastern Europe Triple Negative Breast Cancer Market Revenue (US$ Mn) Comparison by By Treatment Type (2016-2032)
- Figure 75: Eastern Europe Triple Negative Breast Cancer Market Revenue (US$ Mn) Comparison by By Drug Type (2016-2032)
- Figure 76: Eastern Europe Triple Negative Breast Cancer Market Revenue (US$ Mn) Comparison by By Distribution Channel (2016-2032)
- Figure 77: Eastern Europe Triple Negative Breast Cancer Market Y-o-Y Growth Rate Comparison by Country (2016-2032)
- Figure 78: Eastern Europe Triple Negative Breast Cancer Market Y-o-Y Growth Rate Comparison by By Treatment Type (2016-2032)
- Figure 79: Eastern Europe Triple Negative Breast Cancer Market Y-o-Y Growth Rate Comparison by By Drug Type (2016-2032)
- Figure 80: Eastern Europe Triple Negative Breast Cancer Market Y-o-Y Growth Rate Comparison by By Distribution Channel (2016-2032)
- Figure 81: Eastern Europe Triple Negative Breast Cancer Market Share Comparison by Country (2016-2032)
- Figure 82: Eastern Europe Triple Negative Breast Cancer Market Share Comparison by By Treatment Type (2016-2032)
- Figure 83: Eastern Europe Triple Negative Breast Cancer Market Share Comparison by By Drug Type (2016-2032)
- Figure 84: Eastern Europe Triple Negative Breast Cancer Market Share Comparison by By Distribution Channel (2016-2032)
- Figure 85: APAC Triple Negative Breast Cancer Market Revenue (US$ Mn) Market Share by By Treatment Typein 2022
- Figure 86: APAC Triple Negative Breast Cancer Market Attractiveness Analysis by By Treatment Type, 2016-2032
- Figure 87: APAC Triple Negative Breast Cancer Market Revenue (US$ Mn) Market Share by By Drug Typein 2022
- Figure 88: APAC Triple Negative Breast Cancer Market Attractiveness Analysis by By Drug Type, 2016-2032
- Figure 89: APAC Triple Negative Breast Cancer Market Revenue (US$ Mn) Market Share by By Distribution Channelin 2022
- Figure 90: APAC Triple Negative Breast Cancer Market Attractiveness Analysis by By Distribution Channel, 2016-2032
- Figure 91: APAC Triple Negative Breast Cancer Market Revenue (US$ Mn) Market Share by Country in 2022
- Figure 92: APAC Triple Negative Breast Cancer Market Attractiveness Analysis by Country, 2016-2032
- Figure 93: APAC Triple Negative Breast Cancer Market Revenue (US$ Mn) (2016-2032)
- Figure 94: APAC Triple Negative Breast Cancer Market Revenue (US$ Mn) Comparison by Country (2016-2032)
- Figure 95: APAC Triple Negative Breast Cancer Market Revenue (US$ Mn) Comparison by By Treatment Type (2016-2032)
- Figure 96: APAC Triple Negative Breast Cancer Market Revenue (US$ Mn) Comparison by By Drug Type (2016-2032)
- Figure 97: APAC Triple Negative Breast Cancer Market Revenue (US$ Mn) Comparison by By Distribution Channel (2016-2032)
- Figure 98: APAC Triple Negative Breast Cancer Market Y-o-Y Growth Rate Comparison by Country (2016-2032)
- Figure 99: APAC Triple Negative Breast Cancer Market Y-o-Y Growth Rate Comparison by By Treatment Type (2016-2032)
- Figure 100: APAC Triple Negative Breast Cancer Market Y-o-Y Growth Rate Comparison by By Drug Type (2016-2032)
- Figure 101: APAC Triple Negative Breast Cancer Market Y-o-Y Growth Rate Comparison by By Distribution Channel (2016-2032)
- Figure 102: APAC Triple Negative Breast Cancer Market Share Comparison by Country (2016-2032)
- Figure 103: APAC Triple Negative Breast Cancer Market Share Comparison by By Treatment Type (2016-2032)
- Figure 104: APAC Triple Negative Breast Cancer Market Share Comparison by By Drug Type (2016-2032)
- Figure 105: APAC Triple Negative Breast Cancer Market Share Comparison by By Distribution Channel (2016-2032)
- Figure 106: Latin America Triple Negative Breast Cancer Market Revenue (US$ Mn) Market Share by By Treatment Typein 2022
- Figure 107: Latin America Triple Negative Breast Cancer Market Attractiveness Analysis by By Treatment Type, 2016-2032
- Figure 108: Latin America Triple Negative Breast Cancer Market Revenue (US$ Mn) Market Share by By Drug Typein 2022
- Figure 109: Latin America Triple Negative Breast Cancer Market Attractiveness Analysis by By Drug Type, 2016-2032
- Figure 110: Latin America Triple Negative Breast Cancer Market Revenue (US$ Mn) Market Share by By Distribution Channelin 2022
- Figure 111: Latin America Triple Negative Breast Cancer Market Attractiveness Analysis by By Distribution Channel, 2016-2032
- Figure 112: Latin America Triple Negative Breast Cancer Market Revenue (US$ Mn) Market Share by Country in 2022
- Figure 113: Latin America Triple Negative Breast Cancer Market Attractiveness Analysis by Country, 2016-2032
- Figure 114: Latin America Triple Negative Breast Cancer Market Revenue (US$ Mn) (2016-2032)
- Figure 115: Latin America Triple Negative Breast Cancer Market Revenue (US$ Mn) Comparison by Country (2016-2032)
- Figure 116: Latin America Triple Negative Breast Cancer Market Revenue (US$ Mn) Comparison by By Treatment Type (2016-2032)
- Figure 117: Latin America Triple Negative Breast Cancer Market Revenue (US$ Mn) Comparison by By Drug Type (2016-2032)
- Figure 118: Latin America Triple Negative Breast Cancer Market Revenue (US$ Mn) Comparison by By Distribution Channel (2016-2032)
- Figure 119: Latin America Triple Negative Breast Cancer Market Y-o-Y Growth Rate Comparison by Country (2016-2032)
- Figure 120: Latin America Triple Negative Breast Cancer Market Y-o-Y Growth Rate Comparison by By Treatment Type (2016-2032)
- Figure 121: Latin America Triple Negative Breast Cancer Market Y-o-Y Growth Rate Comparison by By Drug Type (2016-2032)
- Figure 122: Latin America Triple Negative Breast Cancer Market Y-o-Y Growth Rate Comparison by By Distribution Channel (2016-2032)
- Figure 123: Latin America Triple Negative Breast Cancer Market Share Comparison by Country (2016-2032)
- Figure 124: Latin America Triple Negative Breast Cancer Market Share Comparison by By Treatment Type (2016-2032)
- Figure 125: Latin America Triple Negative Breast Cancer Market Share Comparison by By Drug Type (2016-2032)
- Figure 126: Latin America Triple Negative Breast Cancer Market Share Comparison by By Distribution Channel (2016-2032)
- Figure 127: Middle East & Africa Triple Negative Breast Cancer Market Revenue (US$ Mn) Market Share by By Treatment Typein 2022
- Figure 128: Middle East & Africa Triple Negative Breast Cancer Market Attractiveness Analysis by By Treatment Type, 2016-2032
- Figure 129: Middle East & Africa Triple Negative Breast Cancer Market Revenue (US$ Mn) Market Share by By Drug Typein 2022
- Figure 130: Middle East & Africa Triple Negative Breast Cancer Market Attractiveness Analysis by By Drug Type, 2016-2032
- Figure 131: Middle East & Africa Triple Negative Breast Cancer Market Revenue (US$ Mn) Market Share by By Distribution Channelin 2022
- Figure 132: Middle East & Africa Triple Negative Breast Cancer Market Attractiveness Analysis by By Distribution Channel, 2016-2032
- Figure 133: Middle East & Africa Triple Negative Breast Cancer Market Revenue (US$ Mn) Market Share by Country in 2022
- Figure 134: Middle East & Africa Triple Negative Breast Cancer Market Attractiveness Analysis by Country, 2016-2032
- Figure 135: Middle East & Africa Triple Negative Breast Cancer Market Revenue (US$ Mn) (2016-2032)
- Figure 136: Middle East & Africa Triple Negative Breast Cancer Market Revenue (US$ Mn) Comparison by Country (2016-2032)
- Figure 137: Middle East & Africa Triple Negative Breast Cancer Market Revenue (US$ Mn) Comparison by By Treatment Type (2016-2032)
- Figure 138: Middle East & Africa Triple Negative Breast Cancer Market Revenue (US$ Mn) Comparison by By Drug Type (2016-2032)
- Figure 139: Middle East & Africa Triple Negative Breast Cancer Market Revenue (US$ Mn) Comparison by By Distribution Channel (2016-2032)
- Figure 140: Middle East & Africa Triple Negative Breast Cancer Market Y-o-Y Growth Rate Comparison by Country (2016-2032)
- Figure 141: Middle East & Africa Triple Negative Breast Cancer Market Y-o-Y Growth Rate Comparison by By Treatment Type (2016-2032)
- Figure 142: Middle East & Africa Triple Negative Breast Cancer Market Y-o-Y Growth Rate Comparison by By Drug Type (2016-2032)
- Figure 143: Middle East & Africa Triple Negative Breast Cancer Market Y-o-Y Growth Rate Comparison by By Distribution Channel (2016-2032)
- Figure 144: Middle East & Africa Triple Negative Breast Cancer Market Share Comparison by Country (2016-2032)
- Figure 145: Middle East & Africa Triple Negative Breast Cancer Market Share Comparison by By Treatment Type (2016-2032)
- Figure 146: Middle East & Africa Triple Negative Breast Cancer Market Share Comparison by By Drug Type (2016-2032)
- Figure 147: Middle East & Africa Triple Negative Breast Cancer Market Share Comparison by By Distribution Channel (2016-2032)
- List of Tables
- Table 1: Global Triple Negative Breast Cancer Market Comparison by By Treatment Type (2016-2032)
- Table 2: Global Triple Negative Breast Cancer Market Comparison by By Drug Type (2016-2032)
- Table 3: Global Triple Negative Breast Cancer Market Comparison by By Distribution Channel (2016-2032)
- Table 4: Global Triple Negative Breast Cancer Market Revenue (US$ Mn) Comparison by Region (2016-2032)
- Table 5: Global Triple Negative Breast Cancer Market Revenue (US$ Mn) (2016-2032)
- Table 6: Global Triple Negative Breast Cancer Market Revenue (US$ Mn) Comparison by Region (2016-2032)
- Table 7: Global Triple Negative Breast Cancer Market Revenue (US$ Mn) Comparison by By Treatment Type (2016-2032)
- Table 8: Global Triple Negative Breast Cancer Market Revenue (US$ Mn) Comparison by By Drug Type (2016-2032)
- Table 9: Global Triple Negative Breast Cancer Market Revenue (US$ Mn) Comparison by By Distribution Channel (2016-2032)
- Table 10: Global Triple Negative Breast Cancer Market Y-o-Y Growth Rate Comparison by Region (2016-2032)
- Table 11: Global Triple Negative Breast Cancer Market Y-o-Y Growth Rate Comparison by By Treatment Type (2016-2032)
- Table 12: Global Triple Negative Breast Cancer Market Y-o-Y Growth Rate Comparison by By Drug Type (2016-2032)
- Table 13: Global Triple Negative Breast Cancer Market Y-o-Y Growth Rate Comparison by By Distribution Channel (2016-2032)
- Table 14: Global Triple Negative Breast Cancer Market Share Comparison by Region (2016-2032)
- Table 15: Global Triple Negative Breast Cancer Market Share Comparison by By Treatment Type (2016-2032)
- Table 16: Global Triple Negative Breast Cancer Market Share Comparison by By Drug Type (2016-2032)
- Table 17: Global Triple Negative Breast Cancer Market Share Comparison by By Distribution Channel (2016-2032)
- Table 18: North America Triple Negative Breast Cancer Market Comparison by By Drug Type (2016-2032)
- Table 19: North America Triple Negative Breast Cancer Market Comparison by By Distribution Channel (2016-2032)
- Table 20: North America Triple Negative Breast Cancer Market Revenue (US$ Mn) Comparison by Country (2016-2032)
- Table 21: North America Triple Negative Breast Cancer Market Revenue (US$ Mn) (2016-2032)
- Table 22: North America Triple Negative Breast Cancer Market Revenue (US$ Mn) Comparison by Country (2016-2032)
- Table 23: North America Triple Negative Breast Cancer Market Revenue (US$ Mn) Comparison by By Treatment Type (2016-2032)
- Table 24: North America Triple Negative Breast Cancer Market Revenue (US$ Mn) Comparison by By Drug Type (2016-2032)
- Table 25: North America Triple Negative Breast Cancer Market Revenue (US$ Mn) Comparison by By Distribution Channel (2016-2032)
- Table 26: North America Triple Negative Breast Cancer Market Y-o-Y Growth Rate Comparison by Country (2016-2032)
- Table 27: North America Triple Negative Breast Cancer Market Y-o-Y Growth Rate Comparison by By Treatment Type (2016-2032)
- Table 28: North America Triple Negative Breast Cancer Market Y-o-Y Growth Rate Comparison by By Drug Type (2016-2032)
- Table 29: North America Triple Negative Breast Cancer Market Y-o-Y Growth Rate Comparison by By Distribution Channel (2016-2032)
- Table 30: North America Triple Negative Breast Cancer Market Share Comparison by Country (2016-2032)
- Table 31: North America Triple Negative Breast Cancer Market Share Comparison by By Treatment Type (2016-2032)
- Table 32: North America Triple Negative Breast Cancer Market Share Comparison by By Drug Type (2016-2032)
- Table 33: North America Triple Negative Breast Cancer Market Share Comparison by By Distribution Channel (2016-2032)
- Table 34: Western Europe Triple Negative Breast Cancer Market Comparison by By Treatment Type (2016-2032)
- Table 35: Western Europe Triple Negative Breast Cancer Market Comparison by By Drug Type (2016-2032)
- Table 36: Western Europe Triple Negative Breast Cancer Market Comparison by By Distribution Channel (2016-2032)
- Table 37: Western Europe Triple Negative Breast Cancer Market Revenue (US$ Mn) Comparison by Country (2016-2032)
- Table 38: Western Europe Triple Negative Breast Cancer Market Revenue (US$ Mn) (2016-2032)
- Table 39: Western Europe Triple Negative Breast Cancer Market Revenue (US$ Mn) Comparison by Country (2016-2032)
- Table 40: Western Europe Triple Negative Breast Cancer Market Revenue (US$ Mn) Comparison by By Treatment Type (2016-2032)
- Table 41: Western Europe Triple Negative Breast Cancer Market Revenue (US$ Mn) Comparison by By Drug Type (2016-2032)
- Table 42: Western Europe Triple Negative Breast Cancer Market Revenue (US$ Mn) Comparison by By Distribution Channel (2016-2032)
- Table 43: Western Europe Triple Negative Breast Cancer Market Y-o-Y Growth Rate Comparison by Country (2016-2032)
- Table 44: Western Europe Triple Negative Breast Cancer Market Y-o-Y Growth Rate Comparison by By Treatment Type (2016-2032)
- Table 45: Western Europe Triple Negative Breast Cancer Market Y-o-Y Growth Rate Comparison by By Drug Type (2016-2032)
- Table 46: Western Europe Triple Negative Breast Cancer Market Y-o-Y Growth Rate Comparison by By Distribution Channel (2016-2032)
- Table 47: Western Europe Triple Negative Breast Cancer Market Share Comparison by Country (2016-2032)
- Table 48: Western Europe Triple Negative Breast Cancer Market Share Comparison by By Treatment Type (2016-2032)
- Table 49: Western Europe Triple Negative Breast Cancer Market Share Comparison by By Drug Type (2016-2032)
- Table 50: Western Europe Triple Negative Breast Cancer Market Share Comparison by By Distribution Channel (2016-2032)
- Table 51: Eastern Europe Triple Negative Breast Cancer Market Comparison by By Treatment Type (2016-2032)
- Table 52: Eastern Europe Triple Negative Breast Cancer Market Comparison by By Drug Type (2016-2032)
- Table 53: Eastern Europe Triple Negative Breast Cancer Market Comparison by By Distribution Channel (2016-2032)
- Table 54: Eastern Europe Triple Negative Breast Cancer Market Revenue (US$ Mn) Comparison by Country (2016-2032)
- Table 55: Eastern Europe Triple Negative Breast Cancer Market Revenue (US$ Mn) (2016-2032)
- Table 56: Eastern Europe Triple Negative Breast Cancer Market Revenue (US$ Mn) Comparison by Country (2016-2032)
- Table 57: Eastern Europe Triple Negative Breast Cancer Market Revenue (US$ Mn) Comparison by By Treatment Type (2016-2032)
- Table 58: Eastern Europe Triple Negative Breast Cancer Market Revenue (US$ Mn) Comparison by By Drug Type (2016-2032)
- Table 59: Eastern Europe Triple Negative Breast Cancer Market Revenue (US$ Mn) Comparison by By Distribution Channel (2016-2032)
- Table 60: Eastern Europe Triple Negative Breast Cancer Market Y-o-Y Growth Rate Comparison by Country (2016-2032)
- Table 61: Eastern Europe Triple Negative Breast Cancer Market Y-o-Y Growth Rate Comparison by By Treatment Type (2016-2032)
- Table 62: Eastern Europe Triple Negative Breast Cancer Market Y-o-Y Growth Rate Comparison by By Drug Type (2016-2032)
- Table 63: Eastern Europe Triple Negative Breast Cancer Market Y-o-Y Growth Rate Comparison by By Distribution Channel (2016-2032)
- Table 64: Eastern Europe Triple Negative Breast Cancer Market Share Comparison by Country (2016-2032)
- Table 65: Eastern Europe Triple Negative Breast Cancer Market Share Comparison by By Treatment Type (2016-2032)
- Table 66: Eastern Europe Triple Negative Breast Cancer Market Share Comparison by By Drug Type (2016-2032)
- Table 67: Eastern Europe Triple Negative Breast Cancer Market Share Comparison by By Distribution Channel (2016-2032)
- Table 68: APAC Triple Negative Breast Cancer Market Comparison by By Treatment Type (2016-2032)
- Table 69: APAC Triple Negative Breast Cancer Market Comparison by By Drug Type (2016-2032)
- Table 70: APAC Triple Negative Breast Cancer Market Comparison by By Distribution Channel (2016-2032)
- Table 71: APAC Triple Negative Breast Cancer Market Revenue (US$ Mn) Comparison by Country (2016-2032)
- Table 72: APAC Triple Negative Breast Cancer Market Revenue (US$ Mn) (2016-2032)
- Table 73: APAC Triple Negative Breast Cancer Market Revenue (US$ Mn) Comparison by Country (2016-2032)
- Table 74: APAC Triple Negative Breast Cancer Market Revenue (US$ Mn) Comparison by By Treatment Type (2016-2032)
- Table 75: APAC Triple Negative Breast Cancer Market Revenue (US$ Mn) Comparison by By Drug Type (2016-2032)
- Table 76: APAC Triple Negative Breast Cancer Market Revenue (US$ Mn) Comparison by By Distribution Channel (2016-2032)
- Table 77: APAC Triple Negative Breast Cancer Market Y-o-Y Growth Rate Comparison by Country (2016-2032)
- Table 78: APAC Triple Negative Breast Cancer Market Y-o-Y Growth Rate Comparison by By Treatment Type (2016-2032)
- Table 79: APAC Triple Negative Breast Cancer Market Y-o-Y Growth Rate Comparison by By Drug Type (2016-2032)
- Table 80: APAC Triple Negative Breast Cancer Market Y-o-Y Growth Rate Comparison by By Distribution Channel (2016-2032)
- Table 81: APAC Triple Negative Breast Cancer Market Share Comparison by Country (2016-2032)
- Table 82: APAC Triple Negative Breast Cancer Market Share Comparison by By Treatment Type (2016-2032)
- Table 83: APAC Triple Negative Breast Cancer Market Share Comparison by By Drug Type (2016-2032)
- Table 84: APAC Triple Negative Breast Cancer Market Share Comparison by By Distribution Channel (2016-2032)
- Table 85: Latin America Triple Negative Breast Cancer Market Comparison by By Treatment Type (2016-2032)
- Table 86: Latin America Triple Negative Breast Cancer Market Comparison by By Drug Type (2016-2032)
- Table 87: Latin America Triple Negative Breast Cancer Market Comparison by By Distribution Channel (2016-2032)
- Table 88: Latin America Triple Negative Breast Cancer Market Revenue (US$ Mn) Comparison by Country (2016-2032)
- Table 89: Latin America Triple Negative Breast Cancer Market Revenue (US$ Mn) (2016-2032)
- Table 90: Latin America Triple Negative Breast Cancer Market Revenue (US$ Mn) Comparison by Country (2016-2032)
- Table 91: Latin America Triple Negative Breast Cancer Market Revenue (US$ Mn) Comparison by By Treatment Type (2016-2032)
- Table 92: Latin America Triple Negative Breast Cancer Market Revenue (US$ Mn) Comparison by By Drug Type (2016-2032)
- Table 93: Latin America Triple Negative Breast Cancer Market Revenue (US$ Mn) Comparison by By Distribution Channel (2016-2032)
- Table 94: Latin America Triple Negative Breast Cancer Market Y-o-Y Growth Rate Comparison by Country (2016-2032)
- Table 95: Latin America Triple Negative Breast Cancer Market Y-o-Y Growth Rate Comparison by By Treatment Type (2016-2032)
- Table 96: Latin America Triple Negative Breast Cancer Market Y-o-Y Growth Rate Comparison by By Drug Type (2016-2032)
- Table 97: Latin America Triple Negative Breast Cancer Market Y-o-Y Growth Rate Comparison by By Distribution Channel (2016-2032)
- Table 98: Latin America Triple Negative Breast Cancer Market Share Comparison by Country (2016-2032)
- Table 99: Latin America Triple Negative Breast Cancer Market Share Comparison by By Treatment Type (2016-2032)
- Table 100: Latin America Triple Negative Breast Cancer Market Share Comparison by By Drug Type (2016-2032)
- Table 101: Latin America Triple Negative Breast Cancer Market Share Comparison by By Distribution Channel (2016-2032)
- Table 102: Middle East & Africa Triple Negative Breast Cancer Market Comparison by By Treatment Type (2016-2032)
- Table 103: Middle East & Africa Triple Negative Breast Cancer Market Comparison by By Drug Type (2016-2032)
- Table 104: Middle East & Africa Triple Negative Breast Cancer Market Comparison by By Distribution Channel (2016-2032)
- Table 105: Middle East & Africa Triple Negative Breast Cancer Market Revenue (US$ Mn) Comparison by Country (2016-2032)
- Table 106: Middle East & Africa Triple Negative Breast Cancer Market Revenue (US$ Mn) (2016-2032)
- Table 107: Middle East & Africa Triple Negative Breast Cancer Market Revenue (US$ Mn) Comparison by Country (2016-2032)
- Table 108: Middle East & Africa Triple Negative Breast Cancer Market Revenue (US$ Mn) Comparison by By Treatment Type (2016-2032)
- Table 109: Middle East & Africa Triple Negative Breast Cancer Market Revenue (US$ Mn) Comparison by By Drug Type (2016-2032)
- Table 110: Middle East & Africa Triple Negative Breast Cancer Market Revenue (US$ Mn) Comparison by By Distribution Channel (2016-2032)
- Table 111: Middle East & Africa Triple Negative Breast Cancer Market Y-o-Y Growth Rate Comparison by Country (2016-2032)
- Table 112: Middle East & Africa Triple Negative Breast Cancer Market Y-o-Y Growth Rate Comparison by By Treatment Type (2016-2032)
- Table 113: Middle East & Africa Triple Negative Breast Cancer Market Y-o-Y Growth Rate Comparison by By Drug Type (2016-2032)
- Table 114: Middle East & Africa Triple Negative Breast Cancer Market Y-o-Y Growth Rate Comparison by By Distribution Channel (2016-2032)
- Table 115: Middle East & Africa Triple Negative Breast Cancer Market Share Comparison by Country (2016-2032)
- Table 116: Middle East & Africa Triple Negative Breast Cancer Market Share Comparison by By Treatment Type (2016-2032)
- Table 117: Middle East & Africa Triple Negative Breast Cancer Market Share Comparison by By Drug Type (2016-2032)
- Table 118: Middle East & Africa Triple Negative Breast Cancer Market Share Comparison by By Distribution Channel (2016-2032)
- 1. Executive Summary
-
- Johnson & Johnson Private Limited (U.S.)
- Cipla Inc. (U.S.)
- Abbott (U.S.)
- AbbVie Inc. (U.S.)
- Merck KGaA (Germany)
- Sun Pharmaceutical Industries Ltd. (India)
- Aurobindo Pharma (India)
- Lupin (India)
- Hikma Pharmaceuticals PLC (U.K.)
- Amneal Pharmaceuticals LLC. (U.S.)
- Pfizer Inc (U.S.)
- Mylan N.V. (U.S.)
- Novartis AG (Switzerland)
- Bristol-Myers Squibb Company (U.S.)
- GSK plc. (U.K.)
- Bayer AG (Germany)
Our Clients


View Our Licence Options
