
Thermoelectric Generator Market By Source Temperature Analysis (Low Temperature , Medium Temperature , High Temperature ), By Wattage Analysis (Low Power , Medium Power, High Power) , By Material Analysis (BiTe, PbTe), By End-User Analysis (Automotive, Aerospace, Defense, Industrial, Consumer Electronics), By Region And Companies - Industry Segment Outlook, Market Assessment, Competition Scenario, Trends, And Forecast 2023-2032
-
26769
-
Aug 2023
-
158
-


-
This report was compiled by Vishwa Gaul Vishwa is an experienced market research and consulting professional with over 8 years of expertise in the ICT industry, contributing to over 700 reports across telecommunications, software, hardware, and digital solutions. Correspondence Team Lead- ICT Linkedin | Detailed Market research Methodology Our methodology involves a mix of primary research, including interviews with leading mental health experts, and secondary research from reputable medical journals and databases. View Detailed Methodology Page
-
Quick Navigation
Report Overview
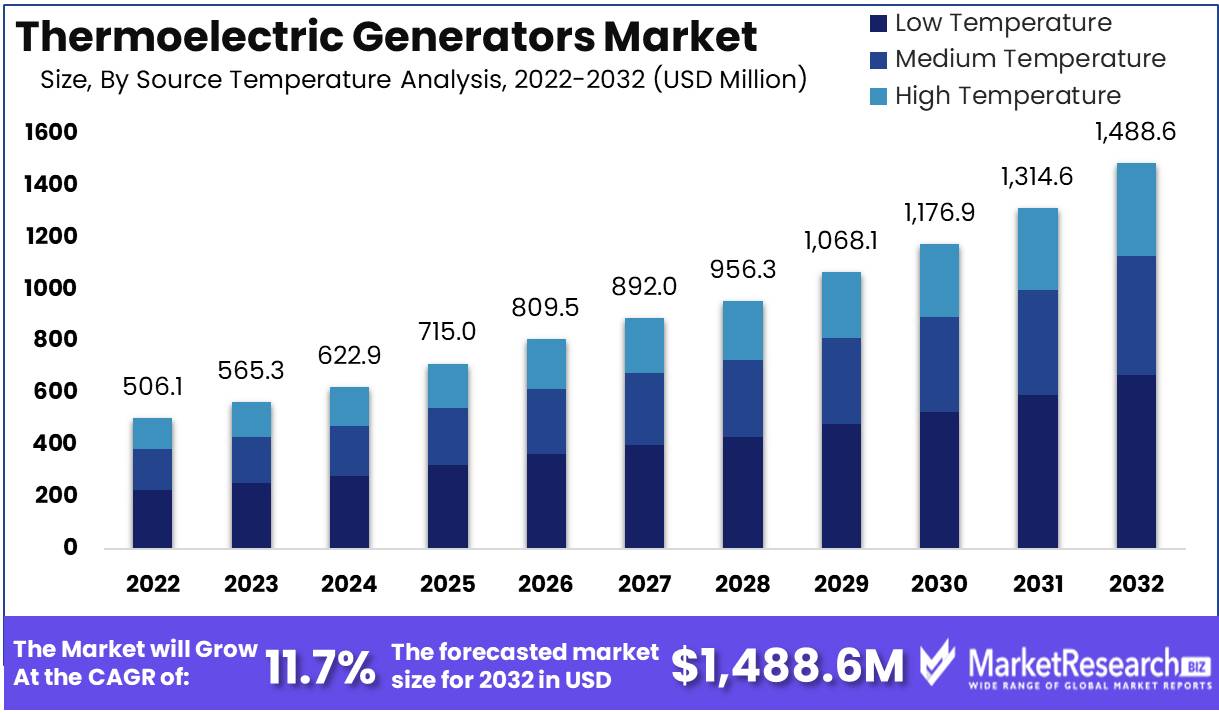
The Thermoelectric Generator Market size is expected to be worth around USD 1488.6 Mn by 2032 from USD 506.1 Mn in 2022, growing at a CAGR of 11.7% during the forecast period from 2023 to 2032.
Thermoelectric generators, miracles of modern technology, have the extraordinary ability to convert heat into electricity by means of the mysterious Seebeck effect. This hypnotic effect occurs when a temperature difference between two dissimilar metals or semiconductors generates a mysterious electric current. Due to its numerous advantages over conventional power generation mechanisms, the ever-expanding thermoelectric generator market has become an enticing industry.
Exceptionally low maintenance costs, the serenity of silent operation, and the unrivaled ability to generate electricity even in the harshest environments are among the many factors that have propelled this market's exponential growth.
Intriguingly, a spate of recent innovations has woven a tapestry of increased efficiency, steadfast dependability, and lengthened lifespan within the realm of thermoelectric generators. The deployment of thermoelectric materials with unprecedented levels of efficiency, exquisitely refined heat sinks, and a captivating combination of cutting-edge materials and manufacturing techniques are all included in these remarkable advancements.
The introduction of hybrid thermoelectric generators, which harmoniously combine the benefits of traditional thermal and thermoelectric power generation, is a noteworthy development in this fascinating field.
Thermoelectric generator have captivated interest and attracted substantial investments from both government agencies and private investors, demonstrating their meteoric rise. These investments have spawned an array of applications and services that incorporate the majesty of thermoelectric generators. The development of thermoelectric generator continues to advance, whether it be through the coordination of power generation in remote locations, the synchronization of waste heat recovery systems, or the development of portable electric generator for outdoor excursions.
Diverse industries, cognizant of the crucial role thermoelectric generator play, have devoted substantial resources to their development, thereby facilitating their ascent to prominence. The aerospace, automotive, military, and power generation industries have seamlessly integrated thermoelectric generator into their array of applications after witnessing their astounding potential. Whether propelling spacecraft traversing the cosmos, fueling the veins of automobiles on earthly highways, fortifying military apparatuses, or infusing life into enormous power plants, the reach of these generator is limitless.
Nonetheless, as with any developing technology, ethical dilemmas emerge, casting doubt over the thermoelectric generators' dominance. Relevant concerns include the environmental repercussions of the materials employed in their construction, as well as the potential military misuse of these generators. Thus, the responsible use of thermoelectric generator becomes an imperative objective, necessitating an unwavering commitment to transparency, elucidation, and accountability throughout their development, production, and operation.
Thermoelectric generator demonstrate their value as indispensable allies by revealing a captivating array of electric applications in the business world. These prodigious entities endow data centers and other vital infrastructure with resilience by serving as reliable secondary power sources. In the realm of remote areas, they provide an oasis of electricity while concurrently reducing energy costs by recovering waste heat from industrial processes.
Driving factors
Rising Demand Fuels TEG Market Growth
In order to reduce carbon emissions, the rising demand for alternative energy sources is one of the most important factors. Thermoelectric generator (TEGs) are a clean and efficient method to generate electricity from heat, making them an attractive option for industries seeking to reduce their carbon footprint. Moreover, the increasing demand for TEGs in the automotive industry for waste heat recovery and in the aerospace and defense sectors for remote sensing applications is propelling the growth of this market.
Enhancements Driven TEG Productivity
The efficiency and durability of TEGs are also being improved by advances in thermoelectric materials and technologies, making them more dependable and affordable. This, along with the growing use of TEGs in wearable and IoT devices, is generating new opportunities for this technology in a variety of industries.
Government Aid Increases TEG Adoption
Government policies and incentives that encourage the use of TEGs also contribute to the growth of this market. The healthcare industry is incorporating TEGs for temperature control and monitoring applications, while the construction industry is increasingly employing TEGs for energy efficiency in buildings. Also embracing TEGs for waste heat recovery and energy conservation is the industrial sector.
TEGs Will Grow Across Industries
As regulations surrounding clean energy and emissions reduction continue to evolve, there may be additional opportunities for the expansion of TEGs in various industries. Emerging technologies such as nanotechnology and advanced materials have the potential to improve the efficiency and performance of TEGs, enabling even wider adoption.
Positive Outlook for TEG Market
Even though there are prospective factors that could alter the competitive landscape of the TEG market, the overall outlook for this technology remains optimistic. As consumer awareness of the benefits of clean energy and the need for sustainable practices increases, it is anticipated that the demand for TEGs will continue to rise.
Restraining Factors
Difficulties Facing the TEG Market
In recent years, thermoelectric generator (TEGs) have attracted considerable interest as a possible renewable energy source. TEGs are devices that directly convert heat to electricity, making them excellent for waste heat recovery in industrial processes and electricity generation from exhaust gases. However, a number of limiting factors have prevented the widespread adoption of TEGs in the energy sector.
Constraints on Costs in the TEG Industry
The high production costs associated with TEGs are one of the primary factors inhibiting market growth. TEGs are comprised of semiconducting materials that are costly to produce. In addition, the manufacturing process of TEGs is time-consuming and requires skilled labor. These factors increase the production cost of TEGs, making them less affordable than other renewable energy sources.
Efficiency Concerns Regarding TEGs
TEGs are not as efficient as other renewable energy sources such as solar or wind power, despite being a promising renewable energy source. TEGs typically have a conversion efficiency between 5 and 8 percent, which is significantly lower than the efficiency of photovoltaic cells used in solar panels or wind turbines. The low efficiency of TEGs necessitates the use of substantial quantities of waste heat to generate a substantial amount of electricity.
Increased TEG Awareness
The limited awareness of the benefits of TEGs among end-users is an additional factor restraining the TEG market. Many individuals are still oblivious to TEGs' potential as a source of renewable energy. The market consequently lacks demand for TEGs. Creating a demand for TEGs and promoting their adoption in the energy industry can be aided by education and outreach initiatives that raise public awareness.
Skilled Labor Shortage for TEGs
The production and development of TEGs demand specialized knowledge and abilities that are scarce in the labor market. This lack of skilled labor has slowed the development of TEG technology and increased production expenses. The lack of skilled employees also makes it difficult to increase production to meet TEG demand.
Regulatory Hurdles for TEG Commercialization
Before they can be marketed and sold, TEGs must comply with stringent regulations and standards. The purpose of these regulations and standards is to ensure the safety and dependability of TEGs. Complying with these regulations and standards can be a time-consuming and expensive process, which increases the production costs of TEGs.
Source Temperature Analysis
The thermoelectric generator market has many categories that generate energy for different uses. Low-temperature segment dominates the market. This segment converts temperature differential into electrical power. Waste heat recovery, refrigeration, temperature detection, and power generation require low-temperature segments.
The low-temperature segment is growing rapidly in emerging economies. These countries are adopting green technologies to cut carbon emissions and increase energy efficiency as their economies grow. End-users favor the low-temperature segment for its performance and cost. China and India, two of the major rising economies in the Asia Pacific, are driving the low-temperature segment growth.
Consumers worldwide are more environmentally conscious and seeking sustainable solutions to lessen their carbon footprint. Consumers can reduce energy bills and accomplish environmental goals in the low-temperature segment. Automotive, healthcare, and power generation, among others, have recognized the benefits of this segment and adopted it heavily. Consumers promote such technologies in their enterprises and families.
The low-temperature segment will develop quickest in the next years. Low-temperature generator have become popular due to rising demand for energy-efficient products and strict government carbon emission laws. Advanced technology has also increased this segment's growth potential. As more companies seek sustainable energy and environmental solutions, the low-temperature segment is likely to rise.
Wattage Analysis
The low-power segment dominates the thermoelectric generator market. This segment generates low-power power. Waste heat recovery, refrigeration, and compact electronics use low-power segments.
Emerging economies are adopting low-power generators. These countries are adopting green technologies to reduce carbon emissions and increase energy efficiency due to economic growth. End-users that want to cut their energy expenses and help the environment prefer the low-power segment. In Asia Pacific, low-power generator are growing in China, India, and others.
Energy-efficient goods that reduce energy use and carbon footprint are in demand worldwide. End-users seeking sustainable, environmentally friendly solutions are turning to the low-power segment. Automotive, aerospace, and electronics prefer low-power generators. Consumers are encouraging low-power technologies in their industries, growing the segment.
The low-power segment of the thermoelectric generator market is expected to develop the fastest. The segment has grown due to government carbon emission laws and demand for energy-efficient products. Additionally, consumer awareness of energy consumption's environmental impacts has boosted this segment. This segment is predicted to develop because of its ongoing technological advancements.
Material Analysis
The material used in thermoelectric generator is important. Bismuth telluride—a semiconductor alloy of bismuth and tellurium—dominates this generator material segment.
Sustainable technology adoption in emerging economies has boosted materials segment growth. End-users seeking energy savings and environmental benefits select Bismuth telluride. China, India, Brazil, and others have tremendous material segment growth prospects, especially in the Asia Pacific.
Consumers are becoming more aware of how their energy consumption affects the environment. End-users seeking environmentally friendly solutions are turning to bismuth telluride. This material is being used in automotive, aerospace, and electronic device applications, among others.
The bismuth telluride segment of the thermoelectric generator market is expected to increase rapidly. This segment has grown due to the demand for sustainable technologies and rigorous government carbon emission laws. This segment's ongoing technical improvements have increased its growth potential, making it appealing to end-users seeking sustainable solutions.
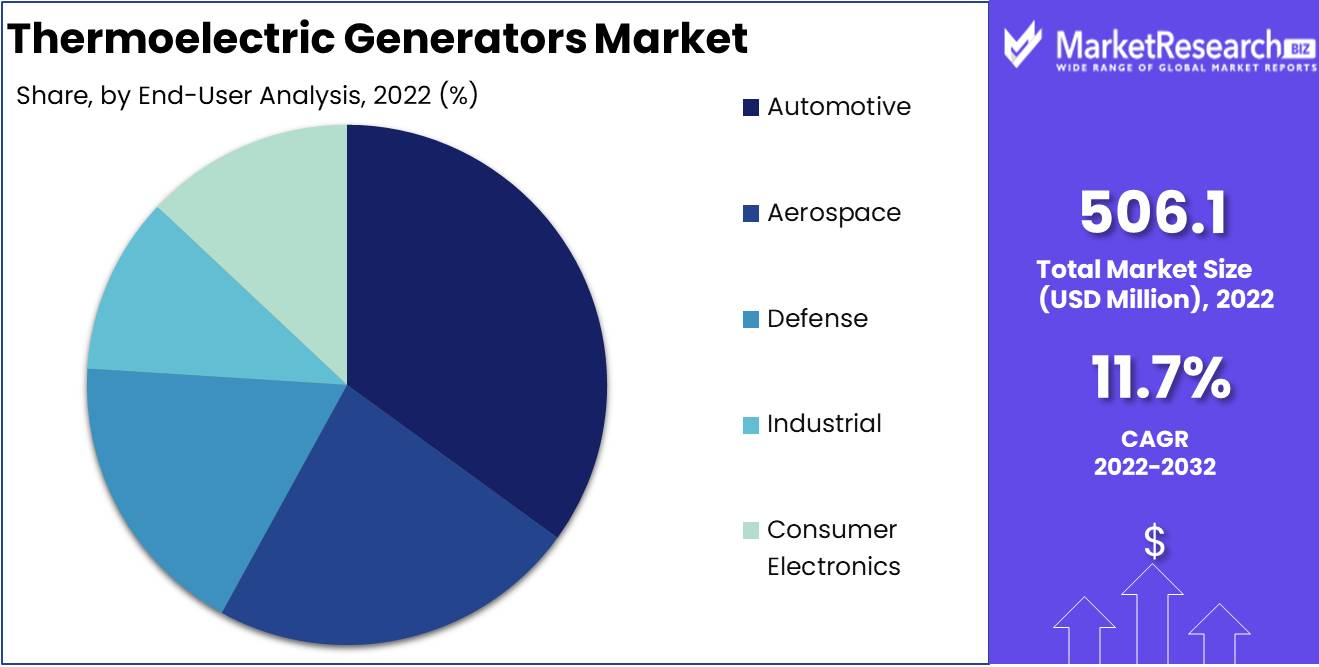
End-User Analysis
End users determine the thermoelectric generator market's growth potential. This market's automotive sector is a major end-user segment.
The adoption of sustainable technologies has boosted the automotive segment's growth in various emerging economies. This segment has development potential due to the demand for fuel-efficient cars and strict government carbon emission laws. China and India have huge growth potential in Asia Pacific.
Global consumers are growing more aware of their energy consumption and carbon footprint. The automotive sector has identified this trend and is actively seeking sustainable ways to minimize carbon emissions while satisfying energy needs. The automotive segment's growth potential is fueled by the demand for fuel-efficient cars, making it appealing to end-users.
The automotive segment of the thermoelectric generator market is expected to grow rapidly. The segment has grown due to government carbon emission laws and demand for fuel-efficient cars. This segment's ongoing technical improvements have increased its growth potential, making it appealing to end-users seeking sustainable solutions.
Key Market Segments
By Source Temperature Analysis
- Low Temperature
- Medium Temperature
- High Temperature
By Wattage Analysis
- Low Power
- Medium Power
- High Power
By Material Analysis
- BiTe
- PbTe
By End-User Analysis
- Automotive
- Aerospace
- Defense
- Industrial
- Consumer Electronics
Growth Opportunity
Increased Industry Demand
The demand for thermoelectric generator is rising due to demand in the automotive and aerospace industries, remote power generation and sensing applications, the construction industry for energy efficiency, and advancements in thermoelectric materials and technologies that improve their efficiency and durability.
Aerospace and Automotive Drive Growth
The automotive and aerospace industries drive thermoelectric generator market growth. Thermoelectric generator power these two industries. The key factors driving the growth of the thermoelectric generator market are the rising demand for electric vehicles from the automotive industry and the requirement for sustainable energy sources in the aerospace industry.
Dependable Power
Remote power and sensing applications use thermoelectric generator also. The significant demand for thermoelectric generator is due to the fact that these applications need energy from sustainable and reliable sources. Remote power sensing applications include pipeline detection, unmanned autonomous vehicles, and off-grid power systems. These applications suit thermoelectric generators' high efficiency and stability.
Increased Efficiency
Thermoelectric generator market growth has also been driven by advances in thermoelectric materials and technologies that improve efficiency and durability. The development of novel materials and technologies that can endure high temperatures and pressures has increased the efficiency and durability of thermoelectric generators.
Energy-Efficient Building
The construction industry uses a lot of thermoelectric generators. In order to generate power from waste heat, thermoelectric generator are employed in energy-efficient building design. Buildings are more sustainable because of the adoption of thermoelectric generators, which have greatly decreased energy demand.
Government Support and Incentives
Through incentives and legislation, governments worldwide are supporting thermoelectric generators. The US government supports the development of efficient thermoelectric technologies through the Thermal Energy Conversion Technologies Program. Companies and individuals using thermoelectric generator receive tax benefits and rebates.
Latest Trends
Demand Rise Thermoelectric Generator Change Industry
The development of thermoelectric materials and technologies has led to a surge in demand for thermoelectric generator (TEGs) in recent years. These materials improve TEG efficiency and durability, making them more appealing for many applications.
Thermoelectric Generator Rule IoT
Flexible and wearable thermoelectric generator in IoT and wearable devices are a TEG market trend. These devices need a compact, efficient, and stable power source, and TEGs, which generate energy from a temperature gradient, are ideal. TEGs power distant and off-grid IoT devices and wearables due to their portability and small weight.
Temperature Innovations TEGs Change Healthcare
The healthcare sector's use of TEGs for temperature management and monitoring is another trend impacting the TEG market. TEGs are being employed in temperature-sensitive medical devices to maintain their temperature for maximum operation. They are also employed in temperature-monitoring wearable devices and drug-transporting containers.
TEGs for Industrial Waste Heat Recovery Save Energy
TEGs are also being used in the industrial sector for waste heat recovery and energy conservation. TEGs may transform industrial waste heat into electricity, saving energy and money. TEGs are increasingly used in industrial sectors like steel, cement, glass, and paper.
Efficiency Enhancements Promote Thermoelectric Generator Market
TEG adoption is also increasing as thermoelectric materials and technologies improve efficiency and durability. TEGs with multi-junction cells are more efficient than regular TEGs thanks to research. Nanostructure and composite materials improve TEG performance and durability.
Beyond Solar and Wind, TEGs Allow Renewable Energy
Last but not least, the renewable energy sector is boosting its adoption of TEGs as a replacement for solar and wind power in some applications. TEGs can generate electricity without sunlight or wind, making them ideal for distant and off-grid places with limited energy sources. They supplement wind and solar power in hybrid renewable energy systems.
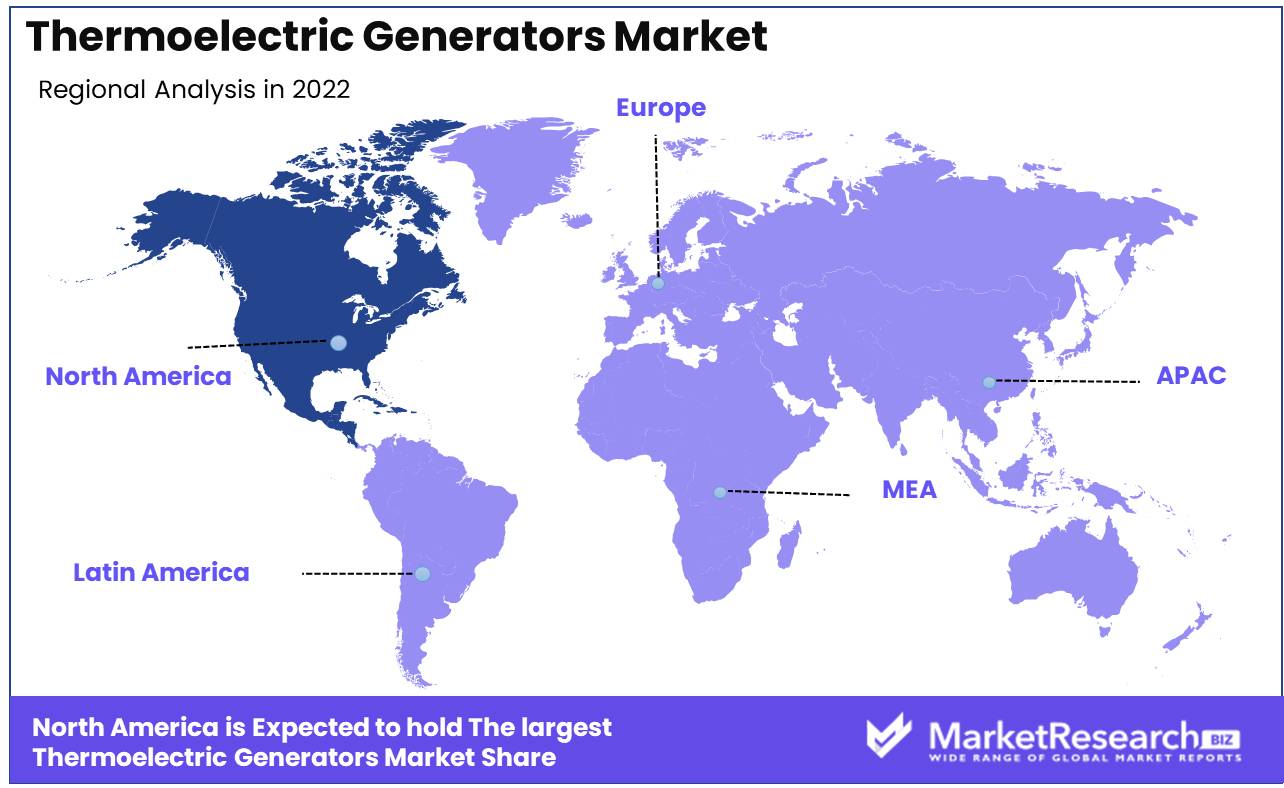
Regional Analysis
In recent years, thermoelectric generator have gained popularity in the automobile, aerospace, and healthcare industries. The North American thermoelectric generator market is expected to dominate due to the presence of significant market players and the growing utilization of this technology in numerous industries.
Through the Seebeck effect, thermoelectric generator turn heat into electricity. This method uses temperature differences to generate an electric current. The technology has been available for a long time, but it has only lately gained popularity due to its many advantages over traditional power generation methods.
Thermoelectric generator create power without moving parts, a major benefit. This makes them more reliable and low-maintenance than other generators. They emit no pollutants and use no fossil fuels, making them more environmentally friendly.
Thermoelectric generator in cars enhance fuel efficiency and minimize pollution. These generator can be fitted into a vehicle's exhaust system to charge the battery while driving. This minimizes engine and alternator load, improving fuel efficiency and pollution.
Thermoelectric generator power satellites and other aerospace vehicles. In space, where traditional power generation methods may not work, these generator are useful. They are more reliable than traditional batteries, which degrade in space.
Thermoelectric generator power medical sensors and gadgets. Body heat powers these generators. This makes them ideal for wearable devices, which must be pleasant and unobtrusive.
The thermoelectric generator market is expected to grow substantially, especially in North America. Major electric players like Gentherm, Alphabet Energy, and Thermonamic Electronics are already participating in this market and will likely invest in research and development to increase the efficiency and reliability of thermo space generators.
Key Regions and Countries
North America
- US
- Canada
- Mexico
Western Europe
- Germany
- France
- The UK
- Spain
- Italy
- Portugal
- Ireland
- Austria
- Switzerland
- Benelux
- Nordic
- Rest of Western Europe
Eastern Europe
- Russia
- Poland
- The Czech Republic
- Greece
- Rest of Eastern Europe
APAC
- China
- Japan
- South Korea
- India
- Australia & New Zealand
- Indonesia
- Malaysia
- Philippines
- Singapore
- Thailand
- Vietnam
- Rest of APAC
Latin America
- Brazil
- Colombia
- Chile
- Argentina
- Costa Rica
- Rest of Latin America
Middle East & Africa
- Algeria
- Egypt
- Israel
- Kuwait
- Nigeria
- Saudi Arabia
- South Africa
- Turkey
- United Arab Emirates
- Rest of MEA
Key Players Analysis
Thermoelectric generator (TEGs) are a promising way to generate energy from waste heat. Demand for efficient and sustainable energy sources is driving global TEG market growth. With technological advances, product developments, and strategic alliances with end-user industries, the leading players in the TEG market are contributing to the market's growth.
Gentherm, Inc., Ferrotec Corporation, II-VI Incorporated, Laird Thermal Systems, Inc., Evident Thermoelectrics, Inc., Komatsu Ltd., TEGPRO Thermoelectric Generator Solutions, TE Technology, Inc., Alphabet Energy, Inc., and Phononic are significant players in the global TEG market. These players are investing heavily in R&D to develop innovative thermoelectric solutions to meet evolving consumer preferences.
Advanced thermoelectric technology solutions from Gentherm, Inc. dominate the market. TEG products include Thermoelectric Modules, Solid State Heat Pumps, Thermoelectric Generators, and Climate Control Systems. Ferrotec Corporation is one of the top players in the global product TEG market. TEG products include Power Generators, Refrigerated Modules, and High-Performance Thermoelectric Modules.
The TEG market is extremely competitive, and top players strive to maintain their market share through product innovation and alliances. TEG market growth is likely to increase in the coming years, generating considerable potential for both current and new players.
Top Key Players in Thermoelectric Generator Market
- Gentherm, Incorporated
- Marlow Industries, Inc.
- Ferrotec Corporation
- Laird PLC
- TE Technology, Inc.
- Kelk Ltd.
- EGPRO Thermoelectric Generator Solutions
- Yamaha Corporation
- Evident Thermoelectrics
- Kryotherm
- Aplhabet Energy, Inc.
- Tellurex Corporation
Recent Development
- In 2022, Hybrid systems that combine thermoelectric generator with other renewable energy sources attracted increased interest.
- In 2022, Material innovation is crucial to improving the efficacy of thermoelectric generators.
- In 2021, Waste heat recovery will be a crucial research topic in a variety of industries.
- In 2020, In recent years, interest in developing flexible and wearable electronics has grown.
- In 2019, Using cutting-edge nanomaterials, researchers have made significant strides toward enhancing the efficiency of thermoelectric generators.
Report Scope:
Report Features Description Market Value (2022) USD 506.1 Mn Forecast Revenue (2032) USD 1488.6 Mn Mn CAGR (2023-2032) 11.7% Base Year for Estimation 2022 Historic Period 2016-2022 Forecast Period 2023-2032 Report Coverage Revenue Forecast, Market Dynamics, COVID-19 Impact, Competitive Landscape, Recent Developments Segments Covered By Source Temperature Analysis (Low Temperature, Medium Temperature, High Temperature ), By Wattage Analysis (Low Power, Medium Power, High Power), By Material Analysis (BiTe, PbTe), By End-User Analysis (Automotive, Aerospace, Defense, Industrial, Consumer Electronics) Regional Analysis North America – The US, Canada, & Mexico; Western Europe – Germany, France, The UK, Spain, Italy, Portugal, Ireland, Austria, Switzerland, Benelux, Nordic, & Rest of Western Europe; Eastern Europe – Russia, Poland, The Czech Republic, Greece, & Rest of Eastern Europe; APAC – China, Japan, South Korea, India, Australia & New Zealand, Indonesia, Malaysia, Philippines, Singapore, Thailand, Vietnam, & Rest of APAC; Latin America – Brazil, Colombia, Chile, Argentina, Costa Rica, & Rest of Latin America; Middle East & Africa – Algeria, Egypt, Israel, Kuwait, Nigeria, Saudi Arabia, South Africa, Turkey, United Arab Emirates, & Rest of MEA Competitive Landscape Gentherm, Incorporated, Marlow Industries, Inc., Ferrotec Corporation, Laird PLC, TE Technology, Inc., Kelk Ltd., EGPRO Thermoelectric Generator Solutions, Yamaha Corporation, Evident Thermoelectrics, Kryotherm, Aplhabet Energy, Inc., Tellurex Corporation Customization Scope Customization for segments, region/country-level will be provided. Moreover, additional customization can be done based on the requirements. Purchase Options We have three licenses to opt for: Single User License, Multi-User License (Up to 5 Users), Corporate Use License (Unlimited User and Printable PDF) -
- 1. Executive Summary
- 1.1. Definition
- 1.2. Taxonomy
- 1.3. Research Scope
- 1.4. Key Analysis
- 1.5. Key Findings by Major Segments
- 1.6. Top strategies by Major Players
- 2. Global Thermoelectric Generator Market Overview
- 2.1. Thermoelectric Generator Market Dynamics
- 2.1.1. Drivers
- 2.1.2. Opportunities
- 2.1.3. Restraints
- 2.1.4. Challenges
- 2.2. Macro-economic Factors
- 2.3. Regulatory Framework
- 2.4. Market Investment Feasibility Index
- 2.5. PEST Analysis
- 2.6. PORTER’S Five Force Analysis
- 2.7. Drivers & Restraints Impact Analysis
- 2.8. Industry Chain Analysis
- 2.9. Cost Structure Analysis
- 2.10. Marketing Strategy
- 2.11. Russia-Ukraine War Impact Analysis
- 2.12. Opportunity Map Analysis
- 2.13. Market Competition Scenario Analysis
- 2.14. Product Life Cycle Analysis
- 2.15. Opportunity Orbits
- 2.16. Manufacturer Intensity Map
- 2.17. Major Companies sales by Value & Volume
- 2.1. Thermoelectric Generator Market Dynamics
- 3. Global Thermoelectric Generator Market Analysis, Opportunity and Forecast, 2016-2032
- 3.1. Global Thermoelectric Generator Market Analysis, 2016-2021
- 3.2. Global Thermoelectric Generator Market Opportunity and Forecast, 2023-2032
- 3.3. Global Thermoelectric Generator Market Analysis, Opportunity and Forecast, By By Source Temperature, 2016-2032
- 3.3.1. Global Thermoelectric Generator Market Analysis By Source Temperature: Introduction
- 3.3.2. Market Size Absolute $ Opportunity Analysis and Forecast, By By Source Temperature, 2016-2032
- 3.3.3. Low Temperature
- 3.3.4. Medium Temperature
- 3.3.5. High Temperature
- 3.4. Global Thermoelectric Generator Market Analysis, Opportunity and Forecast, By By Wattage, 2016-2032
- 3.4.1. Global Thermoelectric Generator Market Analysis By Wattage: Introduction
- 3.4.2. Market Size Absolute $ Opportunity Analysis and Forecast, By By Wattage, 2016-2032
- 3.4.3. Low Power
- 3.4.4. Medium Power
- 3.4.5. High Power
- 3.5. Global Thermoelectric Generator Market Analysis, Opportunity and Forecast, By By Material, 2016-2032
- 3.5.1. Global Thermoelectric Generator Market Analysis By Material: Introduction
- 3.5.2. Market Size Absolute $ Opportunity Analysis and Forecast, By By Material, 2016-2032
- 3.5.3. BiTe
- 3.5.4. PbTe
- 3.6. Global Thermoelectric Generator Market Analysis, Opportunity and Forecast, By By End-User, 2016-2032
- 3.6.1. Global Thermoelectric Generator Market Analysis By End-User: Introduction
- 3.6.2. Market Size Absolute $ Opportunity Analysis and Forecast, By By End-User, 2016-2032
- 3.6.3. Automotive
- 3.6.4. Aerospace
- 3.6.5. Defense
- 3.6.6. Industrial
- 3.6.7. Consumer Electronics
- 4. North America Thermoelectric Generator Market Analysis, Opportunity and Forecast, 2016-2032
- 4.1. North America Thermoelectric Generator Market Analysis, 2016-2021
- 4.2. North America Thermoelectric Generator Market Opportunity and Forecast, 2023-2032
- 4.3. North America Thermoelectric Generator Market Analysis, Opportunity and Forecast, By By Source Temperature, 2016-2032
- 4.3.1. North America Thermoelectric Generator Market Analysis By Source Temperature: Introduction
- 4.3.2. Market Size Absolute $ Opportunity Analysis and Forecast, By By Source Temperature, 2016-2032
- 4.3.3. Low Temperature
- 4.3.4. Medium Temperature
- 4.3.5. High Temperature
- 4.4. North America Thermoelectric Generator Market Analysis, Opportunity and Forecast, By By Wattage, 2016-2032
- 4.4.1. North America Thermoelectric Generator Market Analysis By Wattage: Introduction
- 4.4.2. Market Size Absolute $ Opportunity Analysis and Forecast, By By Wattage, 2016-2032
- 4.4.3. Low Power
- 4.4.4. Medium Power
- 4.4.5. High Power
- 4.5. North America Thermoelectric Generator Market Analysis, Opportunity and Forecast, By By Material, 2016-2032
- 4.5.1. North America Thermoelectric Generator Market Analysis By Material: Introduction
- 4.5.2. Market Size Absolute $ Opportunity Analysis and Forecast, By By Material, 2016-2032
- 4.5.3. BiTe
- 4.5.4. PbTe
- 4.6. North America Thermoelectric Generator Market Analysis, Opportunity and Forecast, By By End-User, 2016-2032
- 4.6.1. North America Thermoelectric Generator Market Analysis By End-User: Introduction
- 4.6.2. Market Size Absolute $ Opportunity Analysis and Forecast, By By End-User, 2016-2032
- 4.6.3. Automotive
- 4.6.4. Aerospace
- 4.6.5. Defense
- 4.6.6. Industrial
- 4.6.7. Consumer Electronics
- 4.7. North America Thermoelectric Generator Market Analysis, Opportunity and Forecast, By Country , 2016-2032
- 4.7.1. North America Thermoelectric Generator Market Analysis by Country : Introduction
- 4.7.2. Market Size Absolute $ Opportunity Analysis and Forecast, Country , 2016-2032
- 4.7.2.1. The US
- 4.7.2.2. Canada
- 4.7.2.3. Mexico
- 5. Western Europe Thermoelectric Generator Market Analysis, Opportunity and Forecast, 2016-2032
- 5.1. Western Europe Thermoelectric Generator Market Analysis, 2016-2021
- 5.2. Western Europe Thermoelectric Generator Market Opportunity and Forecast, 2023-2032
- 5.3. Western Europe Thermoelectric Generator Market Analysis, Opportunity and Forecast, By By Source Temperature, 2016-2032
- 5.3.1. Western Europe Thermoelectric Generator Market Analysis By Source Temperature: Introduction
- 5.3.2. Market Size Absolute $ Opportunity Analysis and Forecast, By By Source Temperature, 2016-2032
- 5.3.3. Low Temperature
- 5.3.4. Medium Temperature
- 5.3.5. High Temperature
- 5.4. Western Europe Thermoelectric Generator Market Analysis, Opportunity and Forecast, By By Wattage, 2016-2032
- 5.4.1. Western Europe Thermoelectric Generator Market Analysis By Wattage: Introduction
- 5.4.2. Market Size Absolute $ Opportunity Analysis and Forecast, By By Wattage, 2016-2032
- 5.4.3. Low Power
- 5.4.4. Medium Power
- 5.4.5. High Power
- 5.5. Western Europe Thermoelectric Generator Market Analysis, Opportunity and Forecast, By By Material, 2016-2032
- 5.5.1. Western Europe Thermoelectric Generator Market Analysis By Material: Introduction
- 5.5.2. Market Size Absolute $ Opportunity Analysis and Forecast, By By Material, 2016-2032
- 5.5.3. BiTe
- 5.5.4. PbTe
- 5.6. Western Europe Thermoelectric Generator Market Analysis, Opportunity and Forecast, By By End-User, 2016-2032
- 5.6.1. Western Europe Thermoelectric Generator Market Analysis By End-User: Introduction
- 5.6.2. Market Size Absolute $ Opportunity Analysis and Forecast, By By End-User, 2016-2032
- 5.6.3. Automotive
- 5.6.4. Aerospace
- 5.6.5. Defense
- 5.6.6. Industrial
- 5.6.7. Consumer Electronics
- 5.7. Western Europe Thermoelectric Generator Market Analysis, Opportunity and Forecast, By Country , 2016-2032
- 5.7.1. Western Europe Thermoelectric Generator Market Analysis by Country : Introduction
- 5.7.2. Market Size Absolute $ Opportunity Analysis and Forecast, Country , 2016-2032
- 5.7.2.1. Germany
- 5.7.2.2. France
- 5.7.2.3. The UK
- 5.7.2.4. Spain
- 5.7.2.5. Italy
- 5.7.2.6. Portugal
- 5.7.2.7. Ireland
- 5.7.2.8. Austria
- 5.7.2.9. Switzerland
- 5.7.2.10. Benelux
- 5.7.2.11. Nordic
- 5.7.2.12. Rest of Western Europe
- 6. Eastern Europe Thermoelectric Generator Market Analysis, Opportunity and Forecast, 2016-2032
- 6.1. Eastern Europe Thermoelectric Generator Market Analysis, 2016-2021
- 6.2. Eastern Europe Thermoelectric Generator Market Opportunity and Forecast, 2023-2032
- 6.3. Eastern Europe Thermoelectric Generator Market Analysis, Opportunity and Forecast, By By Source Temperature, 2016-2032
- 6.3.1. Eastern Europe Thermoelectric Generator Market Analysis By Source Temperature: Introduction
- 6.3.2. Market Size Absolute $ Opportunity Analysis and Forecast, By By Source Temperature, 2016-2032
- 6.3.3. Low Temperature
- 6.3.4. Medium Temperature
- 6.3.5. High Temperature
- 6.4. Eastern Europe Thermoelectric Generator Market Analysis, Opportunity and Forecast, By By Wattage, 2016-2032
- 6.4.1. Eastern Europe Thermoelectric Generator Market Analysis By Wattage: Introduction
- 6.4.2. Market Size Absolute $ Opportunity Analysis and Forecast, By By Wattage, 2016-2032
- 6.4.3. Low Power
- 6.4.4. Medium Power
- 6.4.5. High Power
- 6.5. Eastern Europe Thermoelectric Generator Market Analysis, Opportunity and Forecast, By By Material, 2016-2032
- 6.5.1. Eastern Europe Thermoelectric Generator Market Analysis By Material: Introduction
- 6.5.2. Market Size Absolute $ Opportunity Analysis and Forecast, By By Material, 2016-2032
- 6.5.3. BiTe
- 6.5.4. PbTe
- 6.6. Eastern Europe Thermoelectric Generator Market Analysis, Opportunity and Forecast, By By End-User, 2016-2032
- 6.6.1. Eastern Europe Thermoelectric Generator Market Analysis By End-User: Introduction
- 6.6.2. Market Size Absolute $ Opportunity Analysis and Forecast, By By End-User, 2016-2032
- 6.6.3. Automotive
- 6.6.4. Aerospace
- 6.6.5. Defense
- 6.6.6. Industrial
- 6.6.7. Consumer Electronics
- 6.7. Eastern Europe Thermoelectric Generator Market Analysis, Opportunity and Forecast, By Country , 2016-2032
- 6.7.1. Eastern Europe Thermoelectric Generator Market Analysis by Country : Introduction
- 6.7.2. Market Size Absolute $ Opportunity Analysis and Forecast, Country , 2016-2032
- 6.7.2.1. Russia
- 6.7.2.2. Poland
- 6.7.2.3. The Czech Republic
- 6.7.2.4. Greece
- 6.7.2.5. Rest of Eastern Europe
- 7. APAC Thermoelectric Generator Market Analysis, Opportunity and Forecast, 2016-2032
- 7.1. APAC Thermoelectric Generator Market Analysis, 2016-2021
- 7.2. APAC Thermoelectric Generator Market Opportunity and Forecast, 2023-2032
- 7.3. APAC Thermoelectric Generator Market Analysis, Opportunity and Forecast, By By Source Temperature, 2016-2032
- 7.3.1. APAC Thermoelectric Generator Market Analysis By Source Temperature: Introduction
- 7.3.2. Market Size Absolute $ Opportunity Analysis and Forecast, By By Source Temperature, 2016-2032
- 7.3.3. Low Temperature
- 7.3.4. Medium Temperature
- 7.3.5. High Temperature
- 7.4. APAC Thermoelectric Generator Market Analysis, Opportunity and Forecast, By By Wattage, 2016-2032
- 7.4.1. APAC Thermoelectric Generator Market Analysis By Wattage: Introduction
- 7.4.2. Market Size Absolute $ Opportunity Analysis and Forecast, By By Wattage, 2016-2032
- 7.4.3. Low Power
- 7.4.4. Medium Power
- 7.4.5. High Power
- 7.5. APAC Thermoelectric Generator Market Analysis, Opportunity and Forecast, By By Material, 2016-2032
- 7.5.1. APAC Thermoelectric Generator Market Analysis By Material: Introduction
- 7.5.2. Market Size Absolute $ Opportunity Analysis and Forecast, By By Material, 2016-2032
- 7.5.3. BiTe
- 7.5.4. PbTe
- 7.6. APAC Thermoelectric Generator Market Analysis, Opportunity and Forecast, By By End-User, 2016-2032
- 7.6.1. APAC Thermoelectric Generator Market Analysis By End-User: Introduction
- 7.6.2. Market Size Absolute $ Opportunity Analysis and Forecast, By By End-User, 2016-2032
- 7.6.3. Automotive
- 7.6.4. Aerospace
- 7.6.5. Defense
- 7.6.6. Industrial
- 7.6.7. Consumer Electronics
- 7.7. APAC Thermoelectric Generator Market Analysis, Opportunity and Forecast, By Country , 2016-2032
- 7.7.1. APAC Thermoelectric Generator Market Analysis by Country : Introduction
- 7.7.2. Market Size Absolute $ Opportunity Analysis and Forecast, Country , 2016-2032
- 7.7.2.1. China
- 7.7.2.2. Japan
- 7.7.2.3. South Korea
- 7.7.2.4. India
- 7.7.2.5. Australia & New Zeland
- 7.7.2.6. Indonesia
- 7.7.2.7. Malaysia
- 7.7.2.8. Philippines
- 7.7.2.9. Singapore
- 7.7.2.10. Thailand
- 7.7.2.11. Vietnam
- 7.7.2.12. Rest of APAC
- 8. Latin America Thermoelectric Generator Market Analysis, Opportunity and Forecast, 2016-2032
- 8.1. Latin America Thermoelectric Generator Market Analysis, 2016-2021
- 8.2. Latin America Thermoelectric Generator Market Opportunity and Forecast, 2023-2032
- 8.3. Latin America Thermoelectric Generator Market Analysis, Opportunity and Forecast, By By Source Temperature, 2016-2032
- 8.3.1. Latin America Thermoelectric Generator Market Analysis By Source Temperature: Introduction
- 8.3.2. Market Size Absolute $ Opportunity Analysis and Forecast, By By Source Temperature, 2016-2032
- 8.3.3. Low Temperature
- 8.3.4. Medium Temperature
- 8.3.5. High Temperature
- 8.4. Latin America Thermoelectric Generator Market Analysis, Opportunity and Forecast, By By Wattage, 2016-2032
- 8.4.1. Latin America Thermoelectric Generator Market Analysis By Wattage: Introduction
- 8.4.2. Market Size Absolute $ Opportunity Analysis and Forecast, By By Wattage, 2016-2032
- 8.4.3. Low Power
- 8.4.4. Medium Power
- 8.4.5. High Power
- 8.5. Latin America Thermoelectric Generator Market Analysis, Opportunity and Forecast, By By Material, 2016-2032
- 8.5.1. Latin America Thermoelectric Generator Market Analysis By Material: Introduction
- 8.5.2. Market Size Absolute $ Opportunity Analysis and Forecast, By By Material, 2016-2032
- 8.5.3. BiTe
- 8.5.4. PbTe
- 8.6. Latin America Thermoelectric Generator Market Analysis, Opportunity and Forecast, By By End-User, 2016-2032
- 8.6.1. Latin America Thermoelectric Generator Market Analysis By End-User: Introduction
- 8.6.2. Market Size Absolute $ Opportunity Analysis and Forecast, By By End-User, 2016-2032
- 8.6.3. Automotive
- 8.6.4. Aerospace
- 8.6.5. Defense
- 8.6.6. Industrial
- 8.6.7. Consumer Electronics
- 8.7. Latin America Thermoelectric Generator Market Analysis, Opportunity and Forecast, By Country , 2016-2032
- 8.7.1. Latin America Thermoelectric Generator Market Analysis by Country : Introduction
- 8.7.2. Market Size Absolute $ Opportunity Analysis and Forecast, Country , 2016-2032
- 8.7.2.1. Brazil
- 8.7.2.2. Colombia
- 8.7.2.3. Chile
- 8.7.2.4. Argentina
- 8.7.2.5. Costa Rica
- 8.7.2.6. Rest of Latin America
- 9. Middle East & Africa Thermoelectric Generator Market Analysis, Opportunity and Forecast, 2016-2032
- 9.1. Middle East & Africa Thermoelectric Generator Market Analysis, 2016-2021
- 9.2. Middle East & Africa Thermoelectric Generator Market Opportunity and Forecast, 2023-2032
- 9.3. Middle East & Africa Thermoelectric Generator Market Analysis, Opportunity and Forecast, By By Source Temperature, 2016-2032
- 9.3.1. Middle East & Africa Thermoelectric Generator Market Analysis By Source Temperature: Introduction
- 9.3.2. Market Size Absolute $ Opportunity Analysis and Forecast, By By Source Temperature, 2016-2032
- 9.3.3. Low Temperature
- 9.3.4. Medium Temperature
- 9.3.5. High Temperature
- 9.4. Middle East & Africa Thermoelectric Generator Market Analysis, Opportunity and Forecast, By By Wattage, 2016-2032
- 9.4.1. Middle East & Africa Thermoelectric Generator Market Analysis By Wattage: Introduction
- 9.4.2. Market Size Absolute $ Opportunity Analysis and Forecast, By By Wattage, 2016-2032
- 9.4.3. Low Power
- 9.4.4. Medium Power
- 9.4.5. High Power
- 9.5. Middle East & Africa Thermoelectric Generator Market Analysis, Opportunity and Forecast, By By Material, 2016-2032
- 9.5.1. Middle East & Africa Thermoelectric Generator Market Analysis By Material: Introduction
- 9.5.2. Market Size Absolute $ Opportunity Analysis and Forecast, By By Material, 2016-2032
- 9.5.3. BiTe
- 9.5.4. PbTe
- 9.6. Middle East & Africa Thermoelectric Generator Market Analysis, Opportunity and Forecast, By By End-User, 2016-2032
- 9.6.1. Middle East & Africa Thermoelectric Generator Market Analysis By End-User: Introduction
- 9.6.2. Market Size Absolute $ Opportunity Analysis and Forecast, By By End-User, 2016-2032
- 9.6.3. Automotive
- 9.6.4. Aerospace
- 9.6.5. Defense
- 9.6.6. Industrial
- 9.6.7. Consumer Electronics
- 9.7. Middle East & Africa Thermoelectric Generator Market Analysis, Opportunity and Forecast, By Country , 2016-2032
- 9.7.1. Middle East & Africa Thermoelectric Generator Market Analysis by Country : Introduction
- 9.7.2. Market Size Absolute $ Opportunity Analysis and Forecast, Country , 2016-2032
- 9.7.2.1. Algeria
- 9.7.2.2. Egypt
- 9.7.2.3. Israel
- 9.7.2.4. Kuwait
- 9.7.2.5. Nigeria
- 9.7.2.6. Saudi Arabia
- 9.7.2.7. South Africa
- 9.7.2.8. Turkey
- 9.7.2.9. The UAE
- 9.7.2.10. Rest of MEA
- 10. Global Thermoelectric Generator Market Analysis, Opportunity and Forecast, By Region , 2016-2032
- 10.1. Global Thermoelectric Generator Market Analysis by Region : Introduction
- 10.2. Market Size Absolute $ Opportunity Analysis and Forecast, By Region , 2016-2032
- 10.2.1. North America
- 10.2.2. Western Europe
- 10.2.3. Eastern Europe
- 10.2.4. APAC
- 10.2.5. Latin America
- 10.2.6. Middle East & Africa
- 11. Global Thermoelectric Generator Market Competitive Landscape, Market Share Analysis, and Company Profiles
- 11.1. Market Share Analysis
- 11.2. Company Profiles
- 11.3. Gentherm, Incorporated
- 11.3.1. Company Overview
- 11.3.2. Financial Highlights
- 11.3.3. Product Portfolio
- 11.3.4. SWOT Analysis
- 11.3.5. Key Strategies and Developments
- 11.4. Marlow Industries, Inc.
- 11.4.1. Company Overview
- 11.4.2. Financial Highlights
- 11.4.3. Product Portfolio
- 11.4.4. SWOT Analysis
- 11.4.5. Key Strategies and Developments
- 11.5. Ferrotec Corporation
- 11.5.1. Company Overview
- 11.5.2. Financial Highlights
- 11.5.3. Product Portfolio
- 11.5.4. SWOT Analysis
- 11.5.5. Key Strategies and Developments
- 11.6. Laird PLC
- 11.6.1. Company Overview
- 11.6.2. Financial Highlights
- 11.6.3. Product Portfolio
- 11.6.4. SWOT Analysis
- 11.6.5. Key Strategies and Developments
- 11.7. TE Technology, Inc.
- 11.7.1. Company Overview
- 11.7.2. Financial Highlights
- 11.7.3. Product Portfolio
- 11.7.4. SWOT Analysis
- 11.7.5. Key Strategies and Developments
- 11.8. Kelk Ltd.
- 11.8.1. Company Overview
- 11.8.2. Financial Highlights
- 11.8.3. Product Portfolio
- 11.8.4. SWOT Analysis
- 11.8.5. Key Strategies and Developments
- 11.9. EGPRO Thermoelectric Generator Solutions
- 11.9.1. Company Overview
- 11.9.2. Financial Highlights
- 11.9.3. Product Portfolio
- 11.9.4. SWOT Analysis
- 11.9.5. Key Strategies and Developments
- 11.10. Yamaha Corporation
- 11.10.1. Company Overview
- 11.10.2. Financial Highlights
- 11.10.3. Product Portfolio
- 11.10.4. SWOT Analysis
- 11.10.5. Key Strategies and Developments
- 11.11. Evident Thermoelectrics
- 11.11.1. Company Overview
- 11.11.2. Financial Highlights
- 11.11.3. Product Portfolio
- 11.11.4. SWOT Analysis
- 11.11.5. Key Strategies and Developments
- 11.12. Kryotherm
- 11.12.1. Company Overview
- 11.12.2. Financial Highlights
- 11.12.3. Product Portfolio
- 11.12.4. SWOT Analysis
- 11.12.5. Key Strategies and Developments
- 11.13. Aplhabet Energy, Inc.
- 11.13.1. Company Overview
- 11.13.2. Financial Highlights
- 11.13.3. Product Portfolio
- 11.13.4. SWOT Analysis
- 11.13.5. Key Strategies and Developments
- 11.14. Tellurex Corporation
- 11.14.1. Company Overview
- 11.14.2. Financial Highlights
- 11.14.3. Product Portfolio
- 11.14.4. SWOT Analysis
- 11.14.5. Key Strategies and Developments
- 12. Assumptions and Acronyms
- 13. Research Methodology
- 14. Contact
List of Figures
- Figure 1: Global Thermoelectric Generator Market Revenue (US$ Mn) Market Share By Source Temperature in 2022
- Figure 2: Global Thermoelectric Generator Market Attractiveness Analysis By Source Temperature, 2016-2032
- Figure 3: Global Thermoelectric Generator Market Revenue (US$ Mn) Market Share By Wattagein 2022
- Figure 4: Global Thermoelectric Generator Market Attractiveness Analysis By Wattage, 2016-2032
- Figure 5: Global Thermoelectric Generator Market Revenue (US$ Mn) Market Share By Materialin 2022
- Figure 6: Global Thermoelectric Generator Market Attractiveness Analysis By Material, 2016-2032
- Figure 7: Global Thermoelectric Generator Market Revenue (US$ Mn) Market Share By End-Userin 2022
- Figure 8: Global Thermoelectric Generator Market Attractiveness Analysis By End-User, 2016-2032
- Figure 9: Global Thermoelectric Generator Market Revenue (US$ Mn) Market Share by Region in 2022
- Figure 10: Global Thermoelectric Generator Market Attractiveness Analysis by Region, 2016-2032
- Figure 11: Global Thermoelectric Generator Market Revenue (US$ Mn) (2016-2032)
- Figure 12: Global Thermoelectric Generator Market Revenue (US$ Mn) Comparison by Region (2016-2032)
- Figure 13: Global Thermoelectric Generator Market Revenue (US$ Mn) Comparison By Source Temperature (2016-2032)
- Figure 14: Global Thermoelectric Generator Market Revenue (US$ Mn) Comparison By Wattage (2016-2032)
- Figure 15: Global Thermoelectric Generator Market Revenue (US$ Mn) Comparison By Material (2016-2032)
- Figure 16: Global Thermoelectric Generator Market Revenue (US$ Mn) Comparison By End-User (2016-2032)
- Figure 17: Global Thermoelectric Generator Market Y-o-Y Growth Rate Comparison by Region (2016-2032)
- Figure 18: Global Thermoelectric Generator Market Y-o-Y Growth Rate Comparison By Source Temperature (2016-2032)
- Figure 19: Global Thermoelectric Generator Market Y-o-Y Growth Rate Comparison By Wattage (2016-2032)
- Figure 20: Global Thermoelectric Generator Market Y-o-Y Growth Rate Comparison By Material (2016-2032)
- Figure 21: Global Thermoelectric Generator Market Y-o-Y Growth Rate Comparison By End-User (2016-2032)
- Figure 22: Global Thermoelectric Generator Market Share Comparison by Region (2016-2032)
- Figure 23: Global Thermoelectric Generator Market Share Comparison By Source Temperature (2016-2032)
- Figure 24: Global Thermoelectric Generator Market Share Comparison By Wattage (2016-2032)
- Figure 25: Global Thermoelectric Generator Market Share Comparison By Material (2016-2032)
- Figure 26: Global Thermoelectric Generator Market Share Comparison By End-User (2016-2032)
- Figure 27: North America Thermoelectric Generator Market Revenue (US$ Mn) Market Share By Source Temperaturein 2022
- Figure 28: North America Thermoelectric Generator Market Attractiveness Analysis By Source Temperature, 2016-2032
- Figure 29: North America Thermoelectric Generator Market Revenue (US$ Mn) Market Share By Wattagein 2022
- Figure 30: North America Thermoelectric Generator Market Attractiveness Analysis By Wattage, 2016-2032
- Figure 31: North America Thermoelectric Generator Market Revenue (US$ Mn) Market Share By Materialin 2022
- Figure 32: North America Thermoelectric Generator Market Attractiveness Analysis By Material, 2016-2032
- Figure 33: North America Thermoelectric Generator Market Revenue (US$ Mn) Market Share By End-Userin 2022
- Figure 34: North America Thermoelectric Generator Market Attractiveness Analysis By End-User, 2016-2032
- Figure 35: North America Thermoelectric Generator Market Revenue (US$ Mn) Market Share by Country in 2022
- Figure 36: North America Thermoelectric Generator Market Attractiveness Analysis by Country, 2016-2032
- Figure 37: North America Thermoelectric Generator Market Revenue (US$ Mn) (2016-2032)
- Figure 38: North America Thermoelectric Generator Market Revenue (US$ Mn) Comparison by Country (2016-2032)
- Figure 39: North America Thermoelectric Generator Market Revenue (US$ Mn) Comparison By Source Temperature (2016-2032)
- Figure 40: North America Thermoelectric Generator Market Revenue (US$ Mn) Comparison By Wattage (2016-2032)
- Figure 41: North America Thermoelectric Generator Market Revenue (US$ Mn) Comparison By Material (2016-2032)
- Figure 42: North America Thermoelectric Generator Market Revenue (US$ Mn) Comparison By End-User (2016-2032)
- Figure 43: North America Thermoelectric Generator Market Y-o-Y Growth Rate Comparison by Country (2016-2032)
- Figure 44: North America Thermoelectric Generator Market Y-o-Y Growth Rate Comparison By Source Temperature (2016-2032)
- Figure 45: North America Thermoelectric Generator Market Y-o-Y Growth Rate Comparison By Wattage (2016-2032)
- Figure 46: North America Thermoelectric Generator Market Y-o-Y Growth Rate Comparison By Material (2016-2032)
- Figure 47: North America Thermoelectric Generator Market Y-o-Y Growth Rate Comparison By End-User (2016-2032)
- Figure 48: North America Thermoelectric Generator Market Share Comparison by Country (2016-2032)
- Figure 49: North America Thermoelectric Generator Market Share Comparison By Source Temperature (2016-2032)
- Figure 50: North America Thermoelectric Generator Market Share Comparison By Wattage (2016-2032)
- Figure 51: North America Thermoelectric Generator Market Share Comparison By Material (2016-2032)
- Figure 52: North America Thermoelectric Generator Market Share Comparison By End-User (2016-2032)
- Figure 53: Western Europe Thermoelectric Generator Market Revenue (US$ Mn) Market Share By Source Temperaturein 2022
- Figure 54: Western Europe Thermoelectric Generator Market Attractiveness Analysis By Source Temperature, 2016-2032
- Figure 55: Western Europe Thermoelectric Generator Market Revenue (US$ Mn) Market Share By Wattagein 2022
- Figure 56: Western Europe Thermoelectric Generator Market Attractiveness Analysis By Wattage, 2016-2032
- Figure 57: Western Europe Thermoelectric Generator Market Revenue (US$ Mn) Market Share By Materialin 2022
- Figure 58: Western Europe Thermoelectric Generator Market Attractiveness Analysis By Material, 2016-2032
- Figure 59: Western Europe Thermoelectric Generator Market Revenue (US$ Mn) Market Share By End-Userin 2022
- Figure 60: Western Europe Thermoelectric Generator Market Attractiveness Analysis By End-User, 2016-2032
- Figure 61: Western Europe Thermoelectric Generator Market Revenue (US$ Mn) Market Share by Country in 2022
- Figure 62: Western Europe Thermoelectric Generator Market Attractiveness Analysis by Country, 2016-2032
- Figure 63: Western Europe Thermoelectric Generator Market Revenue (US$ Mn) (2016-2032)
- Figure 64: Western Europe Thermoelectric Generator Market Revenue (US$ Mn) Comparison by Country (2016-2032)
- Figure 65: Western Europe Thermoelectric Generator Market Revenue (US$ Mn) Comparison By Source Temperature (2016-2032)
- Figure 66: Western Europe Thermoelectric Generator Market Revenue (US$ Mn) Comparison By Wattage (2016-2032)
- Figure 67: Western Europe Thermoelectric Generator Market Revenue (US$ Mn) Comparison By Material (2016-2032)
- Figure 68: Western Europe Thermoelectric Generator Market Revenue (US$ Mn) Comparison By End-User (2016-2032)
- Figure 69: Western Europe Thermoelectric Generator Market Y-o-Y Growth Rate Comparison by Country (2016-2032)
- Figure 70: Western Europe Thermoelectric Generator Market Y-o-Y Growth Rate Comparison By Source Temperature (2016-2032)
- Figure 71: Western Europe Thermoelectric Generator Market Y-o-Y Growth Rate Comparison By Wattage (2016-2032)
- Figure 72: Western Europe Thermoelectric Generator Market Y-o-Y Growth Rate Comparison By Material (2016-2032)
- Figure 73: Western Europe Thermoelectric Generator Market Y-o-Y Growth Rate Comparison By End-User (2016-2032)
- Figure 74: Western Europe Thermoelectric Generator Market Share Comparison by Country (2016-2032)
- Figure 75: Western Europe Thermoelectric Generator Market Share Comparison By Source Temperature (2016-2032)
- Figure 76: Western Europe Thermoelectric Generator Market Share Comparison By Wattage (2016-2032)
- Figure 77: Western Europe Thermoelectric Generator Market Share Comparison By Material (2016-2032)
- Figure 78: Western Europe Thermoelectric Generator Market Share Comparison By End-User (2016-2032)
- Figure 79: Eastern Europe Thermoelectric Generator Market Revenue (US$ Mn) Market Share By Source Temperaturein 2022
- Figure 80: Eastern Europe Thermoelectric Generator Market Attractiveness Analysis By Source Temperature, 2016-2032
- Figure 81: Eastern Europe Thermoelectric Generator Market Revenue (US$ Mn) Market Share By Wattagein 2022
- Figure 82: Eastern Europe Thermoelectric Generator Market Attractiveness Analysis By Wattage, 2016-2032
- Figure 83: Eastern Europe Thermoelectric Generator Market Revenue (US$ Mn) Market Share By Materialin 2022
- Figure 84: Eastern Europe Thermoelectric Generator Market Attractiveness Analysis By Material, 2016-2032
- Figure 85: Eastern Europe Thermoelectric Generator Market Revenue (US$ Mn) Market Share By End-Userin 2022
- Figure 86: Eastern Europe Thermoelectric Generator Market Attractiveness Analysis By End-User, 2016-2032
- Figure 87: Eastern Europe Thermoelectric Generator Market Revenue (US$ Mn) Market Share by Country in 2022
- Figure 88: Eastern Europe Thermoelectric Generator Market Attractiveness Analysis by Country, 2016-2032
- Figure 89: Eastern Europe Thermoelectric Generator Market Revenue (US$ Mn) (2016-2032)
- Figure 90: Eastern Europe Thermoelectric Generator Market Revenue (US$ Mn) Comparison by Country (2016-2032)
- Figure 91: Eastern Europe Thermoelectric Generator Market Revenue (US$ Mn) Comparison By Source Temperature (2016-2032)
- Figure 92: Eastern Europe Thermoelectric Generator Market Revenue (US$ Mn) Comparison By Wattage (2016-2032)
- Figure 93: Eastern Europe Thermoelectric Generator Market Revenue (US$ Mn) Comparison By Material (2016-2032)
- Figure 94: Eastern Europe Thermoelectric Generator Market Revenue (US$ Mn) Comparison By End-User (2016-2032)
- Figure 95: Eastern Europe Thermoelectric Generator Market Y-o-Y Growth Rate Comparison by Country (2016-2032)
- Figure 96: Eastern Europe Thermoelectric Generator Market Y-o-Y Growth Rate Comparison By Source Temperature (2016-2032)
- Figure 97: Eastern Europe Thermoelectric Generator Market Y-o-Y Growth Rate Comparison By Wattage (2016-2032)
- Figure 98: Eastern Europe Thermoelectric Generator Market Y-o-Y Growth Rate Comparison By Material (2016-2032)
- Figure 99: Eastern Europe Thermoelectric Generator Market Y-o-Y Growth Rate Comparison By End-User (2016-2032)
- Figure 100: Eastern Europe Thermoelectric Generator Market Share Comparison by Country (2016-2032)
- Figure 101: Eastern Europe Thermoelectric Generator Market Share Comparison By Source Temperature (2016-2032)
- Figure 102: Eastern Europe Thermoelectric Generator Market Share Comparison By Wattage (2016-2032)
- Figure 103: Eastern Europe Thermoelectric Generator Market Share Comparison By Material (2016-2032)
- Figure 104: Eastern Europe Thermoelectric Generator Market Share Comparison By End-User (2016-2032)
- Figure 105: APAC Thermoelectric Generator Market Revenue (US$ Mn) Market Share By Source Temperaturein 2022
- Figure 106: APAC Thermoelectric Generator Market Attractiveness Analysis By Source Temperature, 2016-2032
- Figure 107: APAC Thermoelectric Generator Market Revenue (US$ Mn) Market Share By Wattagein 2022
- Figure 108: APAC Thermoelectric Generator Market Attractiveness Analysis By Wattage, 2016-2032
- Figure 109: APAC Thermoelectric Generator Market Revenue (US$ Mn) Market Share By Materialin 2022
- Figure 110: APAC Thermoelectric Generator Market Attractiveness Analysis By Material, 2016-2032
- Figure 111: APAC Thermoelectric Generator Market Revenue (US$ Mn) Market Share By End-Userin 2022
- Figure 112: APAC Thermoelectric Generator Market Attractiveness Analysis By End-User, 2016-2032
- Figure 113: APAC Thermoelectric Generator Market Revenue (US$ Mn) Market Share by Country in 2022
- Figure 114: APAC Thermoelectric Generator Market Attractiveness Analysis by Country, 2016-2032
- Figure 115: APAC Thermoelectric Generator Market Revenue (US$ Mn) (2016-2032)
- Figure 116: APAC Thermoelectric Generator Market Revenue (US$ Mn) Comparison by Country (2016-2032)
- Figure 117: APAC Thermoelectric Generator Market Revenue (US$ Mn) Comparison By Source Temperature (2016-2032)
- Figure 118: APAC Thermoelectric Generator Market Revenue (US$ Mn) Comparison By Wattage (2016-2032)
- Figure 119: APAC Thermoelectric Generator Market Revenue (US$ Mn) Comparison By Material (2016-2032)
- Figure 120: APAC Thermoelectric Generator Market Revenue (US$ Mn) Comparison By End-User (2016-2032)
- Figure 121: APAC Thermoelectric Generator Market Y-o-Y Growth Rate Comparison by Country (2016-2032)
- Figure 122: APAC Thermoelectric Generator Market Y-o-Y Growth Rate Comparison By Source Temperature (2016-2032)
- Figure 123: APAC Thermoelectric Generator Market Y-o-Y Growth Rate Comparison By Wattage (2016-2032)
- Figure 124: APAC Thermoelectric Generator Market Y-o-Y Growth Rate Comparison By Material (2016-2032)
- Figure 125: APAC Thermoelectric Generator Market Y-o-Y Growth Rate Comparison By End-User (2016-2032)
- Figure 126: APAC Thermoelectric Generator Market Share Comparison by Country (2016-2032)
- Figure 127: APAC Thermoelectric Generator Market Share Comparison By Source Temperature (2016-2032)
- Figure 128: APAC Thermoelectric Generator Market Share Comparison By Wattage (2016-2032)
- Figure 129: APAC Thermoelectric Generator Market Share Comparison By Material (2016-2032)
- Figure 130: APAC Thermoelectric Generator Market Share Comparison By End-User (2016-2032)
- Figure 131: Latin America Thermoelectric Generator Market Revenue (US$ Mn) Market Share By Source Temperaturein 2022
- Figure 132: Latin America Thermoelectric Generator Market Attractiveness Analysis By Source Temperature, 2016-2032
- Figure 133: Latin America Thermoelectric Generator Market Revenue (US$ Mn) Market Share By Wattagein 2022
- Figure 134: Latin America Thermoelectric Generator Market Attractiveness Analysis By Wattage, 2016-2032
- Figure 135: Latin America Thermoelectric Generator Market Revenue (US$ Mn) Market Share By Materialin 2022
- Figure 136: Latin America Thermoelectric Generator Market Attractiveness Analysis By Material, 2016-2032
- Figure 137: Latin America Thermoelectric Generator Market Revenue (US$ Mn) Market Share By End-Userin 2022
- Figure 138: Latin America Thermoelectric Generator Market Attractiveness Analysis By End-User, 2016-2032
- Figure 139: Latin America Thermoelectric Generator Market Revenue (US$ Mn) Market Share by Country in 2022
- Figure 140: Latin America Thermoelectric Generator Market Attractiveness Analysis by Country, 2016-2032
- Figure 141: Latin America Thermoelectric Generator Market Revenue (US$ Mn) (2016-2032)
- Figure 142: Latin America Thermoelectric Generator Market Revenue (US$ Mn) Comparison by Country (2016-2032)
- Figure 143: Latin America Thermoelectric Generator Market Revenue (US$ Mn) Comparison By Source Temperature (2016-2032)
- Figure 144: Latin America Thermoelectric Generator Market Revenue (US$ Mn) Comparison By Wattage (2016-2032)
- Figure 145: Latin America Thermoelectric Generator Market Revenue (US$ Mn) Comparison By Material (2016-2032)
- Figure 146: Latin America Thermoelectric Generator Market Revenue (US$ Mn) Comparison By End-User (2016-2032)
- Figure 147: Latin America Thermoelectric Generator Market Y-o-Y Growth Rate Comparison by Country (2016-2032)
- Figure 148: Latin America Thermoelectric Generator Market Y-o-Y Growth Rate Comparison By Source Temperature (2016-2032)
- Figure 149: Latin America Thermoelectric Generator Market Y-o-Y Growth Rate Comparison By Wattage (2016-2032)
- Figure 150: Latin America Thermoelectric Generator Market Y-o-Y Growth Rate Comparison By Material (2016-2032)
- Figure 151: Latin America Thermoelectric Generator Market Y-o-Y Growth Rate Comparison By End-User (2016-2032)
- Figure 152: Latin America Thermoelectric Generator Market Share Comparison by Country (2016-2032)
- Figure 153: Latin America Thermoelectric Generator Market Share Comparison By Source Temperature (2016-2032)
- Figure 154: Latin America Thermoelectric Generator Market Share Comparison By Wattage (2016-2032)
- Figure 155: Latin America Thermoelectric Generator Market Share Comparison By Material (2016-2032)
- Figure 156: Latin America Thermoelectric Generator Market Share Comparison By End-User (2016-2032)
- Figure 157: Middle East & Africa Thermoelectric Generator Market Revenue (US$ Mn) Market Share By Source Temperaturein 2022
- Figure 158: Middle East & Africa Thermoelectric Generator Market Attractiveness Analysis By Source Temperature, 2016-2032
- Figure 159: Middle East & Africa Thermoelectric Generator Market Revenue (US$ Mn) Market Share By Wattagein 2022
- Figure 160: Middle East & Africa Thermoelectric Generator Market Attractiveness Analysis By Wattage, 2016-2032
- Figure 161: Middle East & Africa Thermoelectric Generator Market Revenue (US$ Mn) Market Share By Materialin 2022
- Figure 162: Middle East & Africa Thermoelectric Generator Market Attractiveness Analysis By Material, 2016-2032
- Figure 163: Middle East & Africa Thermoelectric Generator Market Revenue (US$ Mn) Market Share By End-Userin 2022
- Figure 164: Middle East & Africa Thermoelectric Generator Market Attractiveness Analysis By End-User, 2016-2032
- Figure 165: Middle East & Africa Thermoelectric Generator Market Revenue (US$ Mn) Market Share by Country in 2022
- Figure 166: Middle East & Africa Thermoelectric Generator Market Attractiveness Analysis by Country, 2016-2032
- Figure 167: Middle East & Africa Thermoelectric Generator Market Revenue (US$ Mn) (2016-2032)
- Figure 168: Middle East & Africa Thermoelectric Generator Market Revenue (US$ Mn) Comparison by Country (2016-2032)
- Figure 169: Middle East & Africa Thermoelectric Generator Market Revenue (US$ Mn) Comparison By Source Temperature (2016-2032)
- Figure 170: Middle East & Africa Thermoelectric Generator Market Revenue (US$ Mn) Comparison By Wattage (2016-2032)
- Figure 171: Middle East & Africa Thermoelectric Generator Market Revenue (US$ Mn) Comparison By Material (2016-2032)
- Figure 172: Middle East & Africa Thermoelectric Generator Market Revenue (US$ Mn) Comparison By End-User (2016-2032)
- Figure 173: Middle East & Africa Thermoelectric Generator Market Y-o-Y Growth Rate Comparison by Country (2016-2032)
- Figure 174: Middle East & Africa Thermoelectric Generator Market Y-o-Y Growth Rate Comparison By Source Temperature (2016-2032)
- Figure 175: Middle East & Africa Thermoelectric Generator Market Y-o-Y Growth Rate Comparison By Wattage (2016-2032)
- Figure 176: Middle East & Africa Thermoelectric Generator Market Y-o-Y Growth Rate Comparison By Material (2016-2032)
- Figure 177: Middle East & Africa Thermoelectric Generator Market Y-o-Y Growth Rate Comparison By End-User (2016-2032)
- Figure 178: Middle East & Africa Thermoelectric Generator Market Share Comparison by Country (2016-2032)
- Figure 179: Middle East & Africa Thermoelectric Generator Market Share Comparison By Source Temperature (2016-2032)
- Figure 180: Middle East & Africa Thermoelectric Generator Market Share Comparison By Wattage (2016-2032)
- Figure 181: Middle East & Africa Thermoelectric Generator Market Share Comparison By Material (2016-2032)
- Figure 182: Middle East & Africa Thermoelectric Generator Market Share Comparison By End-User (2016-2032)
List of Tables
- Table 1: Global Thermoelectric Generator Market Comparison By Source Temperature (2016-2032)
- Table 2: Global Thermoelectric Generator Market Comparison By Wattage (2016-2032)
- Table 3: Global Thermoelectric Generator Market Comparison By Material (2016-2032)
- Table 4: Global Thermoelectric Generator Market Comparison By End-User (2016-2032)
- Table 5: Global Thermoelectric Generator Market Revenue (US$ Mn) Comparison by Region (2016-2032)
- Table 6: Global Thermoelectric Generator Market Revenue (US$ Mn) (2016-2032)
- Table 7: Global Thermoelectric Generator Market Revenue (US$ Mn) Comparison by Region (2016-2032)
- Table 8: Global Thermoelectric Generator Market Revenue (US$ Mn) Comparison By Source Temperature (2016-2032)
- Table 9: Global Thermoelectric Generator Market Revenue (US$ Mn) Comparison By Wattage (2016-2032)
- Table 10: Global Thermoelectric Generator Market Revenue (US$ Mn) Comparison By Material (2016-2032)
- Table 11: Global Thermoelectric Generator Market Revenue (US$ Mn) Comparison By End-User (2016-2032)
- Table 12: Global Thermoelectric Generator Market Y-o-Y Growth Rate Comparison by Region (2016-2032)
- Table 13: Global Thermoelectric Generator Market Y-o-Y Growth Rate Comparison By Source Temperature (2016-2032)
- Table 14: Global Thermoelectric Generator Market Y-o-Y Growth Rate Comparison By Wattage (2016-2032)
- Table 15: Global Thermoelectric Generator Market Y-o-Y Growth Rate Comparison By Material (2016-2032)
- Table 16: Global Thermoelectric Generator Market Y-o-Y Growth Rate Comparison By End-User (2016-2032)
- Table 17: Global Thermoelectric Generator Market Share Comparison by Region (2016-2032)
- Table 18: Global Thermoelectric Generator Market Share Comparison By Source Temperature (2016-2032)
- Table 19: Global Thermoelectric Generator Market Share Comparison By Wattage (2016-2032)
- Table 20: Global Thermoelectric Generator Market Share Comparison By Material (2016-2032)
- Table 21: Global Thermoelectric Generator Market Share Comparison By End-User (2016-2032)
- Table 22: North America Thermoelectric Generator Market Comparison By Wattage (2016-2032)
- Table 23: North America Thermoelectric Generator Market Comparison By Material (2016-2032)
- Table 24: North America Thermoelectric Generator Market Comparison By End-User (2016-2032)
- Table 25: North America Thermoelectric Generator Market Revenue (US$ Mn) Comparison by Country (2016-2032)
- Table 26: North America Thermoelectric Generator Market Revenue (US$ Mn) (2016-2032)
- Table 27: North America Thermoelectric Generator Market Revenue (US$ Mn) Comparison by Country (2016-2032)
- Table 28: North America Thermoelectric Generator Market Revenue (US$ Mn) Comparison By Source Temperature (2016-2032)
- Table 29: North America Thermoelectric Generator Market Revenue (US$ Mn) Comparison By Wattage (2016-2032)
- Table 30: North America Thermoelectric Generator Market Revenue (US$ Mn) Comparison By Material (2016-2032)
- Table 31: North America Thermoelectric Generator Market Revenue (US$ Mn) Comparison By End-User (2016-2032)
- Table 32: North America Thermoelectric Generator Market Y-o-Y Growth Rate Comparison by Country (2016-2032)
- Table 33: North America Thermoelectric Generator Market Y-o-Y Growth Rate Comparison By Source Temperature (2016-2032)
- Table 34: North America Thermoelectric Generator Market Y-o-Y Growth Rate Comparison By Wattage (2016-2032)
- Table 35: North America Thermoelectric Generator Market Y-o-Y Growth Rate Comparison By Material (2016-2032)
- Table 36: North America Thermoelectric Generator Market Y-o-Y Growth Rate Comparison By End-User (2016-2032)
- Table 37: North America Thermoelectric Generator Market Share Comparison by Country (2016-2032)
- Table 38: North America Thermoelectric Generator Market Share Comparison By Source Temperature (2016-2032)
- Table 39: North America Thermoelectric Generator Market Share Comparison By Wattage (2016-2032)
- Table 40: North America Thermoelectric Generator Market Share Comparison By Material (2016-2032)
- Table 41: North America Thermoelectric Generator Market Share Comparison By End-User (2016-2032)
- Table 42: Western Europe Thermoelectric Generator Market Comparison By Source Temperature (2016-2032)
- Table 43: Western Europe Thermoelectric Generator Market Comparison By Wattage (2016-2032)
- Table 44: Western Europe Thermoelectric Generator Market Comparison By Material (2016-2032)
- Table 45: Western Europe Thermoelectric Generator Market Comparison By End-User (2016-2032)
- Table 46: Western Europe Thermoelectric Generator Market Revenue (US$ Mn) Comparison by Country (2016-2032)
- Table 47: Western Europe Thermoelectric Generator Market Revenue (US$ Mn) (2016-2032)
- Table 48: Western Europe Thermoelectric Generator Market Revenue (US$ Mn) Comparison by Country (2016-2032)
- Table 49: Western Europe Thermoelectric Generator Market Revenue (US$ Mn) Comparison By Source Temperature (2016-2032)
- Table 50: Western Europe Thermoelectric Generator Market Revenue (US$ Mn) Comparison By Wattage (2016-2032)
- Table 51: Western Europe Thermoelectric Generator Market Revenue (US$ Mn) Comparison By Material (2016-2032)
- Table 52: Western Europe Thermoelectric Generator Market Revenue (US$ Mn) Comparison By End-User (2016-2032)
- Table 53: Western Europe Thermoelectric Generator Market Y-o-Y Growth Rate Comparison by Country (2016-2032)
- Table 54: Western Europe Thermoelectric Generator Market Y-o-Y Growth Rate Comparison By Source Temperature (2016-2032)
- Table 55: Western Europe Thermoelectric Generator Market Y-o-Y Growth Rate Comparison By Wattage (2016-2032)
- Table 56: Western Europe Thermoelectric Generator Market Y-o-Y Growth Rate Comparison By Material (2016-2032)
- Table 57: Western Europe Thermoelectric Generator Market Y-o-Y Growth Rate Comparison By End-User (2016-2032)
- Table 58: Western Europe Thermoelectric Generator Market Share Comparison by Country (2016-2032)
- Table 59: Western Europe Thermoelectric Generator Market Share Comparison By Source Temperature (2016-2032)
- Table 60: Western Europe Thermoelectric Generator Market Share Comparison By Wattage (2016-2032)
- Table 61: Western Europe Thermoelectric Generator Market Share Comparison By Material (2016-2032)
- Table 62: Western Europe Thermoelectric Generator Market Share Comparison By End-User (2016-2032)
- Table 63: Eastern Europe Thermoelectric Generator Market Comparison By Source Temperature (2016-2032)
- Table 64: Eastern Europe Thermoelectric Generator Market Comparison By Wattage (2016-2032)
- Table 65: Eastern Europe Thermoelectric Generator Market Comparison By Material (2016-2032)
- Table 66: Eastern Europe Thermoelectric Generator Market Comparison By End-User (2016-2032)
- Table 67: Eastern Europe Thermoelectric Generator Market Revenue (US$ Mn) Comparison by Country (2016-2032)
- Table 68: Eastern Europe Thermoelectric Generator Market Revenue (US$ Mn) (2016-2032)
- Table 69: Eastern Europe Thermoelectric Generator Market Revenue (US$ Mn) Comparison by Country (2016-2032)
- Table 70: Eastern Europe Thermoelectric Generator Market Revenue (US$ Mn) Comparison By Source Temperature (2016-2032)
- Table 71: Eastern Europe Thermoelectric Generator Market Revenue (US$ Mn) Comparison By Wattage (2016-2032)
- Table 72: Eastern Europe Thermoelectric Generator Market Revenue (US$ Mn) Comparison By Material (2016-2032)
- Table 73: Eastern Europe Thermoelectric Generator Market Revenue (US$ Mn) Comparison By End-User (2016-2032)
- Table 74: Eastern Europe Thermoelectric Generator Market Y-o-Y Growth Rate Comparison by Country (2016-2032)
- Table 75: Eastern Europe Thermoelectric Generator Market Y-o-Y Growth Rate Comparison By Source Temperature (2016-2032)
- Table 76: Eastern Europe Thermoelectric Generator Market Y-o-Y Growth Rate Comparison By Wattage (2016-2032)
- Table 77: Eastern Europe Thermoelectric Generator Market Y-o-Y Growth Rate Comparison By Material (2016-2032)
- Table 78: Eastern Europe Thermoelectric Generator Market Y-o-Y Growth Rate Comparison By End-User (2016-2032)
- Table 79: Eastern Europe Thermoelectric Generator Market Share Comparison by Country (2016-2032)
- Table 80: Eastern Europe Thermoelectric Generator Market Share Comparison By Source Temperature (2016-2032)
- Table 81: Eastern Europe Thermoelectric Generator Market Share Comparison By Wattage (2016-2032)
- Table 82: Eastern Europe Thermoelectric Generator Market Share Comparison By Material (2016-2032)
- Table 83: Eastern Europe Thermoelectric Generator Market Share Comparison By End-User (2016-2032)
- Table 84: APAC Thermoelectric Generator Market Comparison By Source Temperature (2016-2032)
- Table 85: APAC Thermoelectric Generator Market Comparison By Wattage (2016-2032)
- Table 86: APAC Thermoelectric Generator Market Comparison By Material (2016-2032)
- Table 87: APAC Thermoelectric Generator Market Comparison By End-User (2016-2032)
- Table 88: APAC Thermoelectric Generator Market Revenue (US$ Mn) Comparison by Country (2016-2032)
- Table 89: APAC Thermoelectric Generator Market Revenue (US$ Mn) (2016-2032)
- Table 90: APAC Thermoelectric Generator Market Revenue (US$ Mn) Comparison by Country (2016-2032)
- Table 91: APAC Thermoelectric Generator Market Revenue (US$ Mn) Comparison By Source Temperature (2016-2032)
- Table 92: APAC Thermoelectric Generator Market Revenue (US$ Mn) Comparison By Wattage (2016-2032)
- Table 93: APAC Thermoelectric Generator Market Revenue (US$ Mn) Comparison By Material (2016-2032)
- Table 94: APAC Thermoelectric Generator Market Revenue (US$ Mn) Comparison By End-User (2016-2032)
- Table 95: APAC Thermoelectric Generator Market Y-o-Y Growth Rate Comparison by Country (2016-2032)
- Table 96: APAC Thermoelectric Generator Market Y-o-Y Growth Rate Comparison By Source Temperature (2016-2032)
- Table 97: APAC Thermoelectric Generator Market Y-o-Y Growth Rate Comparison By Wattage (2016-2032)
- Table 98: APAC Thermoelectric Generator Market Y-o-Y Growth Rate Comparison By Material (2016-2032)
- Table 99: APAC Thermoelectric Generator Market Y-o-Y Growth Rate Comparison By End-User (2016-2032)
- Table 100: APAC Thermoelectric Generator Market Share Comparison by Country (2016-2032)
- Table 101: APAC Thermoelectric Generator Market Share Comparison By Source Temperature (2016-2032)
- Table 102: APAC Thermoelectric Generator Market Share Comparison By Wattage (2016-2032)
- Table 103: APAC Thermoelectric Generator Market Share Comparison By Material (2016-2032)
- Table 104: APAC Thermoelectric Generator Market Share Comparison By End-User (2016-2032)
- Table 105: Latin America Thermoelectric Generator Market Comparison By Source Temperature (2016-2032)
- Table 106: Latin America Thermoelectric Generator Market Comparison By Wattage (2016-2032)
- Table 107: Latin America Thermoelectric Generator Market Comparison By Material (2016-2032)
- Table 108: Latin America Thermoelectric Generator Market Comparison By End-User (2016-2032)
- Table 109: Latin America Thermoelectric Generator Market Revenue (US$ Mn) Comparison by Country (2016-2032)
- Table 110: Latin America Thermoelectric Generator Market Revenue (US$ Mn) (2016-2032)
- Table 111: Latin America Thermoelectric Generator Market Revenue (US$ Mn) Comparison by Country (2016-2032)
- Table 112: Latin America Thermoelectric Generator Market Revenue (US$ Mn) Comparison By Source Temperature (2016-2032)
- Table 113: Latin America Thermoelectric Generator Market Revenue (US$ Mn) Comparison By Wattage (2016-2032)
- Table 114: Latin America Thermoelectric Generator Market Revenue (US$ Mn) Comparison By Material (2016-2032)
- Table 115: Latin America Thermoelectric Generator Market Revenue (US$ Mn) Comparison By End-User (2016-2032)
- Table 116: Latin America Thermoelectric Generator Market Y-o-Y Growth Rate Comparison by Country (2016-2032)
- Table 117: Latin America Thermoelectric Generator Market Y-o-Y Growth Rate Comparison By Source Temperature (2016-2032)
- Table 118: Latin America Thermoelectric Generator Market Y-o-Y Growth Rate Comparison By Wattage (2016-2032)
- Table 119: Latin America Thermoelectric Generator Market Y-o-Y Growth Rate Comparison By Material (2016-2032)
- Table 120: Latin America Thermoelectric Generator Market Y-o-Y Growth Rate Comparison By End-User (2016-2032)
- Table 121: Latin America Thermoelectric Generator Market Share Comparison by Country (2016-2032)
- Table 122: Latin America Thermoelectric Generator Market Share Comparison By Source Temperature (2016-2032)
- Table 123: Latin America Thermoelectric Generator Market Share Comparison By Wattage (2016-2032)
- Table 124: Latin America Thermoelectric Generator Market Share Comparison By Material (2016-2032)
- Table 125: Latin America Thermoelectric Generator Market Share Comparison By End-User (2016-2032)
- Table 126: Middle East & Africa Thermoelectric Generator Market Comparison By Source Temperature (2016-2032)
- Table 127: Middle East & Africa Thermoelectric Generator Market Comparison By Wattage (2016-2032)
- Table 128: Middle East & Africa Thermoelectric Generator Market Comparison By Material (2016-2032)
- Table 129: Middle East & Africa Thermoelectric Generator Market Comparison By End-User (2016-2032)
- Table 130: Middle East & Africa Thermoelectric Generator Market Revenue (US$ Mn) Comparison by Country (2016-2032)
- Table 131: Middle East & Africa Thermoelectric Generator Market Revenue (US$ Mn) (2016-2032)
- Table 132: Middle East & Africa Thermoelectric Generator Market Revenue (US$ Mn) Comparison by Country (2016-2032)
- Table 133: Middle East & Africa Thermoelectric Generator Market Revenue (US$ Mn) Comparison By Source Temperature (2016-2032)
- Table 134: Middle East & Africa Thermoelectric Generator Market Revenue (US$ Mn) Comparison By Wattage (2016-2032)
- Table 135: Middle East & Africa Thermoelectric Generator Market Revenue (US$ Mn) Comparison By Material (2016-2032)
- Table 136: Middle East & Africa Thermoelectric Generator Market Revenue (US$ Mn) Comparison By End-User (2016-2032)
- Table 137: Middle East & Africa Thermoelectric Generator Market Y-o-Y Growth Rate Comparison by Country (2016-2032)
- Table 138: Middle East & Africa Thermoelectric Generator Market Y-o-Y Growth Rate Comparison By Source Temperature (2016-2032)
- Table 139: Middle East & Africa Thermoelectric Generator Market Y-o-Y Growth Rate Comparison By Wattage (2016-2032)
- Table 140: Middle East & Africa Thermoelectric Generator Market Y-o-Y Growth Rate Comparison By Material (2016-2032)
- Table 141: Middle East & Africa Thermoelectric Generator Market Y-o-Y Growth Rate Comparison By End-User (2016-2032)
- Table 142: Middle East & Africa Thermoelectric Generator Market Share Comparison by Country (2016-2032)
- Table 143: Middle East & Africa Thermoelectric Generator Market Share Comparison By Source Temperature (2016-2032)
- Table 144: Middle East & Africa Thermoelectric Generator Market Share Comparison By Wattage (2016-2032)
- Table 145: Middle East & Africa Thermoelectric Generator Market Share Comparison By Material (2016-2032)
- Table 146: Middle East & Africa Thermoelectric Generator Market Share Comparison By End-User (2016-2032)
- 1. Executive Summary
-
- Gentherm, Incorporated
- Marlow Industries, Inc.
- Ferrotec Corporation
- Laird PLC
- TE Technology, Inc.
- Kelk Ltd.
- EGPRO Thermoelectric Generator Solutions
- Yamaha Corporation
- Evident Thermoelectrics
- Kryotherm
- Aplhabet Energy, Inc.
- Tellurex Corporation
Our Clients


View Our Licence Options
