
TAED Market Forecast, Trend Analysis & Competition Tracking - Global Industry Insights 2015 to 2031
-
26734
-
March 2023
-
150
-


-
This report was compiled by Shreyas Rokade Shreyas Rokade is a seasoned Research Analyst with CMFE, bringing extensive expertise in market research and consulting, with a strong background in Chemical Engineering. Correspondence Team Lead-CMFE Linkedin | Detailed Market research Methodology Our methodology involves a mix of primary research, including interviews with leading mental health experts, and secondary research from reputable medical journals and databases. View Detailed Methodology Page
-
Demand for TAED from 2015 to 2020 Vs. Future Market Projections for 2021-2031
From 2015 to 2020, sales of TAED have increased at a stable rate, expanding over 2.0% CAGR.
Tetraacetylethylenediamine (TAED) is an organic compound majorly used as a bleach activator in laundry and dishwashing detergents and paper manufacturing. It is produced through a two-stage process from ethylenediamine and acetic anhydride. TAED is manufactured by successive acetylation of ethylene diamine, first with acetic acid and then with acetic anhydride. Excess acetic acid and excess acetic anhydride are recovered by distillation, separated and reused within the process. During wash cycles, TAED completely dissolves and undergoes perhydrolysis to provide an efficient bleaching effect at lower washing temperatures.
TAED is a highly preferred detergent additive in several geographies due to its non-toxic and biodegradable nature. It readily dissolves in water and can be easily disposed of through sewage treatment plants. More importantly, it is also not harmful for humans, aquatic life, or the environment. Global production of TAED is estimated at XXX K Tons in 2020.
Global TAED Market Revenue Outlook:
The global TAED market was valued at over US$ 400 Mn in 2020 and is projected to register а САGR of close to 2.0% by 2031.
TAED is mainly consumed for laundry and dishwashing detergents and tablets, but a small amount is also used in industries, including paper, textiles, and chemicals production. Increasing demand for powerful laundry and dishwashing detergents amidst the COVID-19 pandemic is expected to impact the target market growth positively. According to the NCDC (National Centre for Disease Control), washing with household detergents and using standard disinfectant products should be adequate for general precautionary cleaning. It is also advised to use diluted household bleach solutions on some surfaces, as it is one of the best possible ways to remove the novel coronavirus (SARS-CoV-2).
TAED's biodegradable nature allows it to be easily removed during wastewater treatment. TAED is also used as biocides, denture cleaning, and the cold sterilization of medical instruments. Low toxicity and low prices of TAED in disinfectants' manufacturing are expected to support the target market growth further. However, the recent COVID-19 pandemic disrupted the supply chain of several chemicals across various economies. The lockdown resulted in closures of manufacturing plants and restricted trade activities, which led to fluctuating supply of raw materials and end-products and volatility in prices.
Competitive Outlook:
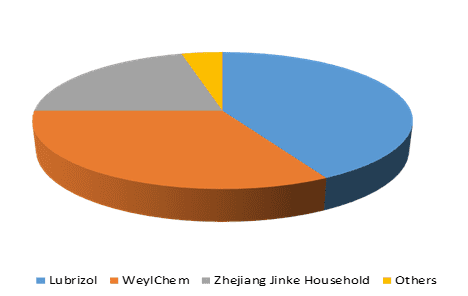
Three players, namely – Lubrizol, Weylchem, and Zhejian Jinke Household, majorly dominate the global TAED market. Till 2014, Warwick Chemicals was a prominent producer of TAED. The company also had acquired International Detergents Chemicals Ltd. (IDC), another major manufacturer of TAED. In 2014, Lubrizol Corp. acquired Warwick and its production plants, which helped Lubrizol expand its product portfolio. Lubrizol now offers Mykon TAED and Warwick TAED.
Similarly, in 2014, Clariant AG sold its detergents business to International Chemical Investors Group (ICIG). ICIG transferred the business segment and employees of Clariant to operate under the Weylchem brand umbrella. Weylchem's offerings include Peractive® line of TAED products.
Annual Capacity (K Tons) of TAED Producers by Company, 2020:
Company Headquarters TAED Capacity (K Tons) Lubrizol The US XXX WeylChem Germany XXX Zhejiang Jinke Household China XXX XXX XXX XXX XXX XXX XXX To learn more about this report, request for sample report
Global TAED Market Share by Company, 2020
To learn more about this report, request for sample report
Import-Export Analysis of Surface-Active Preparations, 2016-2020
The import of Surface-active preparations (HS Code – 340290), which includes TAED, decreased 1.2% in 2020 to reach the value of US$ 6.4 Bn, while the export declined by 1%. Major importing countries in this category include China, accounting for 6.6% of the total global imports. China is followed by Germany, the US, France, and Vietnam. Major exporting countries of surface-active preparations include Germany, the US, China, the UK, and France.
The imports of surface-active preparations fell by 4.1% during the Q2 of 2020 as compared to the previous quarter, due to the trade restrictions imposed to contain the coronavirus. Nonetheless, the imports stabilized in the Q3-2020 increasing by 1.9% and subsequently to 6.2% in Q4-2020. On the other hand, the exports declined by 5.1% in the Q2-2020 from the previous quarter and noted a subsequent growth of 1.5% and 3.2% in Q3-2020 and Q4-2020, respectively.
Regional Analysis:
Europe is anticipated to hold a significant share of the global TAED market. The region is also expected to register the highest growth rates over the forecast period. Increasing demand for detergents and cleaners, coupled with consumer awareness of the energy-saving benefits of low-temperature washing, is expected to boost the target market growth in the region. Moreover, prominent players in the region are also expected to support the market revenue growth.
Competitive Landscape:
The TAED market landscape appears highly consolidated, with a significant chunk of it being dominated by players in the European region.
- Lubrizol Corp.
- WeylChem Group
- Zhejiang Jinke Chemicals
- Hefei TNJ Chemical
- Haihang Group
- Hongye Holding Group
- Acuro Organics
- Idchem
- Shandong Chuang Ying
- SDC Enterprises
- Muby Chemicals
- Other Key Players
Report Scope
- Forecast Period: 2022-2031
- Actual Year: 2021
- Historical Data Available for: 2015-2020
Key Regions Covered
- North America
- Europe
- Asia Pacific
- Latin America
- Middle East & Africa
Key Segments Covered
TAED Market, By Form
- Granular
- Powder
TAED Market, By End-Use
- Household Detergents & Cleaners
- Textiles
- Pulp & Paper
- Other End-Uses
Attribute Report Details Market Size Ask For Market Size Growth Rate Ask For Growth Rate Key Companies Ask For Companies Report Coverage Revenue analysis, Competitive landscape, Key company analysis, Market Trends, Key segments, Distribution Channel, Market Dynamics, COVID-19 Impact Analysis and more… Historical Data Period 2015-2020 Base Year 2022 Forecast Period 2022-2031 Region Scope North America, Europe, Asia-Pacific, South America, Middle East & Africa Country Scope United States, Canada and Mexico, Germany, France, UK, Russia and Italy, China, Japan, Korea, India and Southeast Asia, Brazil, Argentina, Colombia etc.Saudi Arabia, UAE, Egypt, Nigeria and South Africa Revenue in US$ Mn To learn more about this report, request for sample report
-
- Chapter 1 Global TAED Market Outlook
- 1.1 Introduction
- 1.2 Segmentation of TAED Market Based On Form & End-Use, and Region
- 1.3 Drivers
- 1.4 Restraints
- 1.5 Opportunities
- 1.6 Trends
- 1.7 Macro-economic Factors
- 1.8 Regulatory Framework
- 1.9 Global TAED Market Pricing Analysis by Region, 2021
- 1.10 Opportunity Map Analysis
- 1.10.1 Optimistic Scenario
- 1.10.2 Likely Scenario
- 1.10.3 Conservative Scenario
- 1.11 Opportunity Orbits
- 1.12 Market Investment Feasibility Index
- 1.13 PEST Analysis
- 1.14 PORTER’S Five Force Analysis
- 1.15 Drivers & Restraints Impact Analysis
- 1.16 Marketing Strategy
- 1.17 Product Life Cycle Analysis
- 1.18 Value Chain Analysis
- 1.19 Cost Structure Analysis
- 1.20 Regional Market Share and BPS Analysis in TAED Market
- 1.21 COVID-19 Impact Analysis
- Chapter 2 Global TAED Market Overview
- 2.1 Global Market Value & Volume Comparison by Form (2015-2031)
- 2.1.1 Global Market Value & Volume Market Share by Form in 2021
- 2.1.2 Global Attractiveness Analysis by Form, 2015–2022
- 2.2 Global Market Value & Volume Comparison by End-Use (2015-2031)
- 2.2.1 Global Market Value & Volume Market Share by End-Use in 2021
- 2.2.2 Global Attractiveness Analysis by End-Use, 2015–2022
- 2.3 Global Outlook by Region
- 2.3.1 Global Market Value & Volume Comparison by Region (2015-2031)
- 2.3.2 Global Market Value & Volume Market Share by Region in 2021
- 2.3.3 Global Attractiveness Analysis by Region, 2015–2022
- 2.4 Global Outlook (2015-2031)
- 2.4.1 Global Market Value & Volume (2015–2022)
- 2.4.2 Global Market Value & Volume (2023-2031)
- 2.5 Global Market Value & Volume by Regions
- 2.5.1 Global Market Value & Volume Comparison by Region (2015–2022)
- 2.5.2 Global Market Value & Volume Comparison by Region (2023-2031)
- 2.6 Global Market Value & Volume by Form
- 2.6.1 Global Market Value & Volume Comparison by Form (2015–2022)
- 2.6.2 Global Market Value & Volume Comparison by Form (2023-2031)
- 2.7 Global Market Value & Volume by End-Use
- 2.7.1 Global Market Value & Volume Comparison by End-Use (2015–2022)
- 2.7.2 Global Market Value & Volume Comparison by End-Use (2023-2031)
- 2.8 Global Market Y-o-Y Growth Rate Comparison 2016–2031
- 2.8.1 Global Market Y-o-Y Growth Rate by Region
- 2.8.2 Global Market Y-o-Y Growth Rate by Form
- 2.8.3 Global Market Y-o-Y Growth Rate by End-Use
- 2.9 Global Market Share Comparison 2015–2031
- 2.9.1 Global Market Share by Region
- 2.9.2 Global Market Share by Form
- 2.9.3 Global Market Share by End-Use
- 2.1 Global Market Value & Volume Comparison by Form (2015-2031)
- Chapter 3 North America TAED Market Overview
- 3.1 North America by Form
- 3.1.1 North America Market Value & Volume Comparison by Form (2015-2031)
- 3.1.2 North America Market Value & Volume Market Share by Form in 2021
- 3.2 North America Market Value & Volume Comparison by End-Use (2015-2031)
- 3.2.1 North America Market Value & Volume Market Share by End-Use in 2021
- 3.2.2 North America Attractiveness Analysis by End-Use, 2015–2022
- 3.3 North America Outlook by Region
- 3.3.1 North America Market Value & Volume Comparison by Region (2015-2031)
- 3.3.2 North America Market Value & Volume Market Share by Region in 2021
- 3.3.3 North America Attractiveness Analysis by Region, 2015–2022
- 3.4 North America Outlook (2015-2031)
- 3.4.1 North America Market Value & Volume (2015–2022)
- 3.4.2 North America Market Value & Volume (2023-2031)
- 3.5 North America Market Value & Volume by Regions
- 3.5.1 North America Market Value & Volume Comparison by Region (2015–2022)
- 3.5.2 North America Market Value & Volume Comparison by Region (2023-2031)
- 3.6 North America Market Value & Volume by Form
- 3.6.1 North America Market Value & Volume Comparison by Form (2015–2022)
- 3.6.2 North America Market Value & Volume Comparison by Form (2023-2031)
- 3.7 North America Market Value & Volume by End-Use
- 3.7.1 North America Market Value & Volume Comparison by End-Use (2015–2022)
- 3.7.2 North America Market Value & Volume Comparison by End-Use (2023-2031)
- 3.8 North America Market Y-o-Y Growth Rate Comparison 2016–2031
- 3.8.1 North America Market Y-o-Y Growth Rate by Region
- 3.8.2 North America Market Y-o-Y Growth Rate by Form
- 3.8.3 North America Market Y-o-Y Growth Rate by End-Use
- 3.9 North America Market Share Comparison 2015–2031
- 3.9.1 North America Market Share by Region
- 3.9.2 North America Market Share by Form
- 3.9.3 North America Market Share by End-Use
- 3.1 North America by Form
- Chapter 4 Europe TAED Market Overview
- 4.1 Europe by Form
- 4.1.1 Europe Market Value & Volume Comparison by Form (2015-2031)
- 4.1.2 Europe Market Value & Volume Market Share by Form in 2021
- 4.2 Europe Market Value & Volume Comparison by End-Use (2015-2031)
- 4.2.1 Europe Market Value & Volume Market Share by End-Use in 2021
- 4.2.2 Europe Attractiveness Analysis by End-Use, 2015–2022
- 4.3 Europe Outlook by Region
- 4.3.1 Europe Market Value & Volume Comparison by Region (2015-2031)
- 4.3.2 Europe Market Value & Volume Market Share by Region in 2021
- 4.3.3 Europe Attractiveness Analysis by Region, 2015–2022
- 4.4 Europe Outlook (2015-2031)
- 4.4.1 Europe Market Value & Volume (2015–2022)
- 4.4.2 Europe Market Value & Volume (2023-2031)
- 4.5 Europe Market Value & Volume by Regions
- 4.5.1 Europe Market Value & Volume Comparison by Region (2015–2022)
- 4.5.2 Europe Market Value & Volume Comparison by Region (2023-2031)
- 4.6 Europe Market Value & Volume by Form
- 4.6.1 Europe Market Value & Volume Comparison by Form (2015–2022)
- 4.6.2 Europe Market Value & Volume Comparison by Form (2023-2031)
- 4.7 Europe Market Value & Volume by End-Use
- 4.7.1 Europe Market Value & Volume Comparison by End-Use (2015–2022)
- 4.7.2 Europe Market Value & Volume Comparison by End-Use (2023-2031)
- 4.8 Europe Market Y-o-Y Growth Rate Comparison 2016–2031
- 4.8.1 Europe Market Y-o-Y Growth Rate by Region
- 4.8.2 Europe Market Y-o-Y Growth Rate by Form
- 4.8.3 Europe Market Y-o-Y Growth Rate by End-Use
- 4.9 Europe Market Share Comparison 2015–2031
- 4.9.1 Europe Market Share by Region
- 4.9.2 Europe Market Share by Form
- 4.9.3 Europe Market Share by End-Use
- 4.1 Europe by Form
- Chapter 5 Asia-Pacific TAED Market Overview
- 5.1 Asia-Pacific by Form
- 5.1.1 Asia-Pacific Market Value & Volume Comparison by Form (2015-2031)
- 5.1.2 Asia-Pacific Market Value & Volume Market Share by Form in 2021
- 5.2 Asia-Pacific Market Value & Volume Comparison by End-Use (2015-2031)
- 5.2.1 Asia-Pacific Market Value & Volume Market Share by End-Use in 2021
- 5.2.2 Asia-Pacific Attractiveness Analysis by End-Use, 2015–2022
- 5.3 Asia-Pacific Outlook by Region
- 5.3.1 Asia-Pacific Market Value & Volume Comparison by Region (2015-2031)
- 5.3.2 Asia-Pacific Market Value & Volume Market Share by Region in 2021
- 5.3.3 Asia-Pacific Attractiveness Analysis by Region, 2015–2022
- 5.4 Asia-Pacific Outlook (2015-2031)
- 5.4.1 Asia-Pacific Market Value & Volume (2015–2022)
- 5.4.2 Asia-Pacific Market Value & Volume (2023-2031)
- 5.5 Asia-Pacific Market Value & Volume by Regions
- 5.5.1 Asia-Pacific Market Value & Volume Comparison by Region (2015–2022)
- 5.5.2 Asia-Pacific Market Value & Volume Comparison by Region (2023-2031)
- 5.6 Asia-Pacific Market Value & Volume by Form
- 5.6.1 Asia-Pacific Market Value & Volume Comparison by Form (2015–2022)
- 5.6.2 Asia-Pacific Market Value & Volume Comparison by Form (2023-2031)
- 5.7 Asia-Pacific Market Value & Volume by End-Use
- 5.7.1 Asia-Pacific Market Value & Volume Comparison by End-Use (2015–2022)
- 5.7.2 Asia-Pacific Market Value & Volume Comparison by End-Use (2023-2031)
- 5.8 Asia-Pacific Market Y-o-Y Growth Rate Comparison 2016–2031
- 5.8.1 Asia-Pacific Market Y-o-Y Growth Rate by Region
- 5.8.2 Asia-Pacific Market Y-o-Y Growth Rate by Form
- 5.8.3 Asia-Pacific Market Y-o-Y Growth Rate by End-Use
- 5.9 Asia-Pacific Market Share Comparison 2015–2031
- 5.9.1 Asia-Pacific Market Share by Region
- 5.9.2 Asia-Pacific Market Share by Form
- 5.9.3 Asia-Pacific Market Share by End-Use
- 5.1 Asia-Pacific by Form
- Chapter 6 Latin America TAED Market Overview
- 6.1 Latin America by Form
- 6.1.1 Latin America Market Value & Volume Comparison by Form (2015-2031)
- 6.1.2 Latin America Market Value & Volume Market Share by Form in 2021
- 6.2 Latin America Market Value & Volume Comparison by End-Use (2015-2031)
- 6.2.1 Latin America Market Value & Volume Market Share by End-Use in 2021
- 6.2.2 Latin America Attractiveness Analysis by End-Use, 2015–2022
- 6.3 Latin America Outlook by Region
- 6.3.1 Latin America Market Value & Volume Comparison by Region (2015-2031)
- 6.3.2 Latin America Market Value & Volume Market Share by Region in 2021
- 6.3.3 Latin America Attractiveness Analysis by Region, 2015–2022
- 6.4 Latin America Outlook (2015-2031)
- 6.4.1 Latin America Market Value & Volume (2015–2022)
- 6.4.2 Latin America Market Value & Volume (2023-2031)
- 6.5 Latin America Market Value & Volume by Regions
- 6.5.1 Latin America Market Value & Volume Comparison by Region (2015–2022)
- 6.5.2 Latin America Market Value & Volume Comparison by Region (2023-2031)
- 6.6 Latin America Market Value & Volume by Form
- 6.6.1 Latin America Market Value & Volume Comparison by Form (2015–2022)
- 6.6.2 Latin America Market Value & Volume Comparison by Form (2023-2031)
- 6.7 Latin America Market Value & Volume by End-Use
- 6.7.1 Latin America Market Value & Volume Comparison by End-Use (2015–2022)
- 6.7.2 Latin America Market Value & Volume Comparison by End-Use (2023-2031)
- 6.8 Latin America Market Y-o-Y Growth Rate Comparison 2016–2031
- 6.8.1 Latin America Market Y-o-Y Growth Rate by Region
- 6.8.2 Latin America Market Y-o-Y Growth Rate by Form
- 6.8.3 Latin America Market Y-o-Y Growth Rate by End-Use
- 6.9 Latin America Market Share Comparison 2015–2031
- 6.9.1 Latin America Market Share by Region
- 6.9.2 Latin America Market Share by Form
- 6.9.3 Latin America Market Share by End-Use
- 6.1 Latin America by Form
- Chapter 7 MEA TAED Market Overview
- 7.1 MEA by Form
- 7.1.1 MEA Market Value & Volume Comparison by Form (2015-2031)
- 7.1.2 MEA Market Value & Volume Market Share by Form in 2021
- 7.2 MEA Market Value & Volume Comparison by End-Use (2015-2031)
- 7.2.1 MEA Market Value & Volume Market Share by End-Use in 2021
- 7.2.2 MEA Attractiveness Analysis by End-Use, 2015–2022
- 7.3 MEA Outlook by Region
- 7.3.1 MEA Market Value & Volume Comparison by Region (2015-2031)
- 7.3.2 MEA Market Value & Volume Market Share by Region in 2021
- 7.3.3 MEA Attractiveness Analysis by Region, 2015–2022
- 7.4 MEA Outlook (2015-2031)
- 7.4.1 MEA Market Value & Volume (2015–2022)
- 7.4.2 MEA Market Value & Volume (2023-2031)
- 7.5 MEA Market Value & Volume by Regions
- 7.5.1 MEA Market Value & Volume Comparison by Region (2015–2022)
- 7.5.2 MEA Market Value & Volume Comparison by Region (2023-2031)
- 7.6 MEA Market Value & Volume by Form
- 7.6.1 MEA Market Value & Volume Comparison by Form (2015–2022)
- 7.6.2 MEA Market Value & Volume Comparison by Form (2023-2031)
- 7.7 MEA Market Value & Volume by End-Use
- 7.7.1 MEA Market Value & Volume Comparison by End-Use (2015–2022)
- 7.7.2 MEA Market Value & Volume Comparison by End-Use (2023-2031)
- 7.8 MEA Market Y-o-Y Growth Rate Comparison 2016–2031
- 7.8.1 MEA Market Y-o-Y Growth Rate by Region
- 7.8.2 MEA Market Y-o-Y Growth Rate by Form
- 7.8.3 MEA Market Y-o-Y Growth Rate by End-Use
- 7.9 MEA Market Share Comparison 2015–2031
- 7.9.1 MEA Market Share by Region
- 7.9.2 MEA Market Share by Form
- 7.9.3 MEA Market Share by End-Use
- 7.1 MEA by Form
- Chapter 8 Global TAED Market Company Profiles
- 8.1 Market Competition Scenario Analysis, By Company
- 8.2 Competitor Landscape
- 8.3 Company Share Analysis
- 8.4 Company Profiles
- 8.4.1 Lubrizol Corp.
- 8.4.1.1 Company Overview
- 8.4.1.2 Business Description
- 8.4.1.3 Product Portfolio
- 8.4.1.4 Key Financials
- 8.4.1.5 Key Developments
- 8.4.1.6 SWOT Analysis
- 8.4.2 WeylChem Group
- 8.4.2.1 Company Overview
- 8.4.2.2 Business Description
- 8.4.2.3 Product Portfolio
- 8.4.2.4 Key Financials
- 8.4.2.5 Key Developments
- 8.4.2.6 SWOT Analysis
- 8.4.3 Zhejiang Jinke Chemicals
- 8.4.3.1 Company Overview
- 8.4.3.2 Business Description
- 8.4.3.3 Product Portfolio
- 8.4.3.4 Key Financials
- 8.4.3.5 Key Developments
- 8.4.3.6 SWOT Analysis
- 8.4.4 Hefei TNJ Chemical
- 8.4.4.1 Company Overview
- 8.4.4.2 Business Description
- 8.4.4.3 Product Portfolio
- 8.4.4.4 Key Financials
- 8.4.4.5 Key Developments
- 8.4.4.6 SWOT Analysis
- 8.4.5 Haihang Group
- 8.4.5.1 Company Overview
- 8.4.5.2 Business Description
- 8.4.5.3 Product Portfolio
- 8.4.5.4 Key Financials
- 8.4.5.5 Key Developments
- 8.4.5.6 SWOT Analysis
- 8.4.6 Hongye Holding Group
- 8.4.6.1 Company Overview
- 8.4.6.2 Business Description
- 8.4.6.3 Product Portfolio
- 8.4.6.4 Key Financials
- 8.4.6.5 Key Developments
- 8.4.6.6 SWOT Analysis
- 8.4.7 Shandong Chuang Ying
- 8.4.7.1 Company Overview
- 8.4.7.2 Business Description
- 8.4.7.3 Product Portfolio
- 8.4.7.4 Key Financials
- 8.4.7.5 Key Developments
- 8.4.7.6 SWOT Analysis
- 8.4.8 Acuro Organics
- 8.4.8.1 Company Overview
- 8.4.8.2 Business Description
- 8.4.8.3 Product Portfolio
- 8.4.8.4 Key Financials
- 8.4.8.5 Key Developments
- 8.4.8.6 SWOT Analysis
- 8.4.9 Muby Chemicals
- 8.4.9.1 Company Overview
- 8.4.9.2 Business Description
- 8.4.9.3 Product Portfolio
- 8.4.9.4 Key Financials
- 8.4.9.5 Key Developments
- 8.4.9.6 SWOT Analysis
- 8.4.10 SDC Enterprises
- 8.4.10.1 Company Overview
- 8.4.10.2 Business Description
- 8.4.10.3 Product Portfolio
- 8.4.10.4 Key Financials
- 8.4.10.5 Key Developments
- 8.4.10.6 SWOT Analysis
- 8.4.11 Other Key Players
- 8.4.1 Lubrizol Corp.
- Chapter 9 Research Methodology
- 9.1 Research Methodology
- 9.2 Primary Research
- 9.3 Secondary Research
- 9.4 Report Scope
- Chapter 10 About Us
- 10.1 Who we are:
- Chapter 11 Disclaimer
To learn more about this report, request for sample report
- Chapter 1 Global TAED Market Outlook
-
- Lubrizol Corp.
- WeylChem Group
- Zhejiang Jinke Chemicals
- Hefei TNJ Chemical
- Haihang Group
- Hongye Holding Group
- Acuro Organics
- Idchem
- Shandong Chuang Ying
- SDC Enterprises
- Muby Chemicals
- Other Key Players

Our Clients


View Our Licence Options
