
Super Absorbent Polymer Market By Type (Sodium Polyacrylate, Polyacrylamide Copolymer, and Other), By Application (Personal Hygiene, Healthcare, Agriculture, and Other), By Region and Companies - Industry Segment Outlook, Market Assessment, Competition Scenario, Trends, and Forecast 2023-2032
-
5958
-
May 2023
-
156
-


-
This report was compiled by Shreyas Rokade Shreyas Rokade is a seasoned Research Analyst with CMFE, bringing extensive expertise in market research and consulting, with a strong background in Chemical Engineering. Correspondence Team Lead-CMFE Linkedin | Detailed Market research Methodology Our methodology involves a mix of primary research, including interviews with leading mental health experts, and secondary research from reputable medical journals and databases. View Detailed Methodology Page
-
Quick Navigation
Report Overview
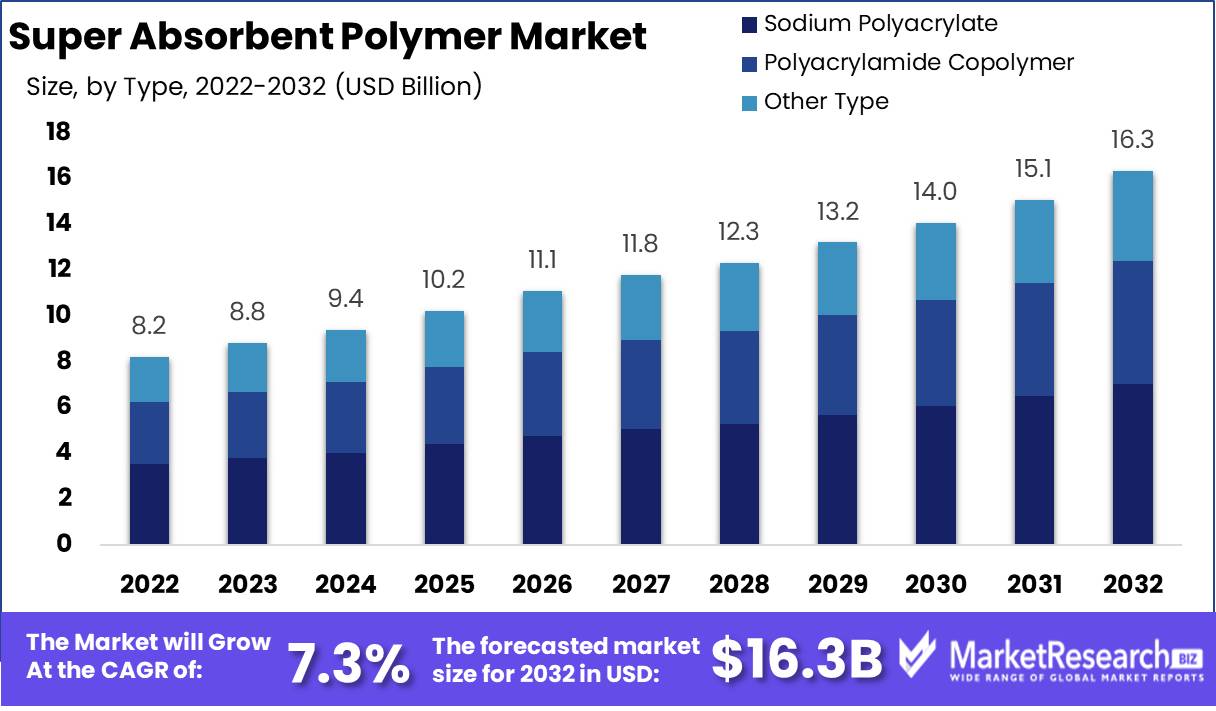
Super Absorbent Polymer Market size is expected to be worth around USD 16.3 Bn by 2032 from USD 8.2 Bn in 2022, growing at a CAGR of 7.3% during the forecast period from 2023 to 2032.
A material known as a Super Absorbent Polymers Market has a high capacity for absorbing liquids. The aqueous solution's ionic concentration determines how well it retains water. It is a structured polymer with cross-links that prevents dissolution. These kinds of polymers can take in up to 100 times their own weight in liquid. As a result, it is utilized in products that require high absorption characteristics, such as incontinence products and child diapers/nappies.
The Super Absorbent Polymers Market will be driven by rising consumer awareness of health and hygiene and rising demand for sanitary napkins and diapers. The rise in infant diaper pants' popularity and ease of use will impact the market's expansion. The market's expansion will also be fueled by the growing use of super-absorbent polymers in agriculture for irrigation water retention.
Driving factors
Rising Demand for Adult and Baby Diapers
The use of Super Absorbent Polymers Market is on the rise as a result of the rising elderly population and public awareness of the benefits and accessibility of adult incontinence products. In order to prioritize the production of incontinence products, governments of various countries are collaborating with producers and medical professionals.
Government programs that encourage the use of adult incontinence products are available in Germany, Australia, the United Kingdom, and the United States. In addition, the substantial elderly population of nations like Finland, Japan, Greece, and Italy, among others, drives adult diaper market penetration and accelerates Super Absorbent Polymers Market expansion.
Restraining Factors
cost of super-absorbent polymer
Acrylic acid is used to make the Super Absorbent Polymers Market, which is a derivative of propylene because polypropylene is made from petroleum resin. The cost of propylene varies greatly. The price of acryl acid has driven up the cost of Super Absorbent Polymers Market, driving up the cost of finished goods.
By Type Analysis
The improved liquid absorption capacity of sodium polyacrylate makes it dominant in the market.
In 2022 The sodium polyacrylate segment dominated the market with 43% of revenue. A Super Absorbent Polymers Market is an illustration of this. It is a cross-linked (network) polymer made of sodium atoms. Non-toxic, non-corrosive, and non-irritating are the major properties of Super Absorbent Polymers Market.
Polyacrylate/polyacrylamide copolymer, sodium polyacrylate, and other types of Super Absorbent Polymer are available on the market. The majority of Super Absorbent Polymer are available in granular or fiber forms and are composed of sodium polyacrylate. The improved liquid absorption capacity of sodium polyacrylate makes it ideal for hygiene applications, which is predicted to drive the segment's growth.
By Application Analysis
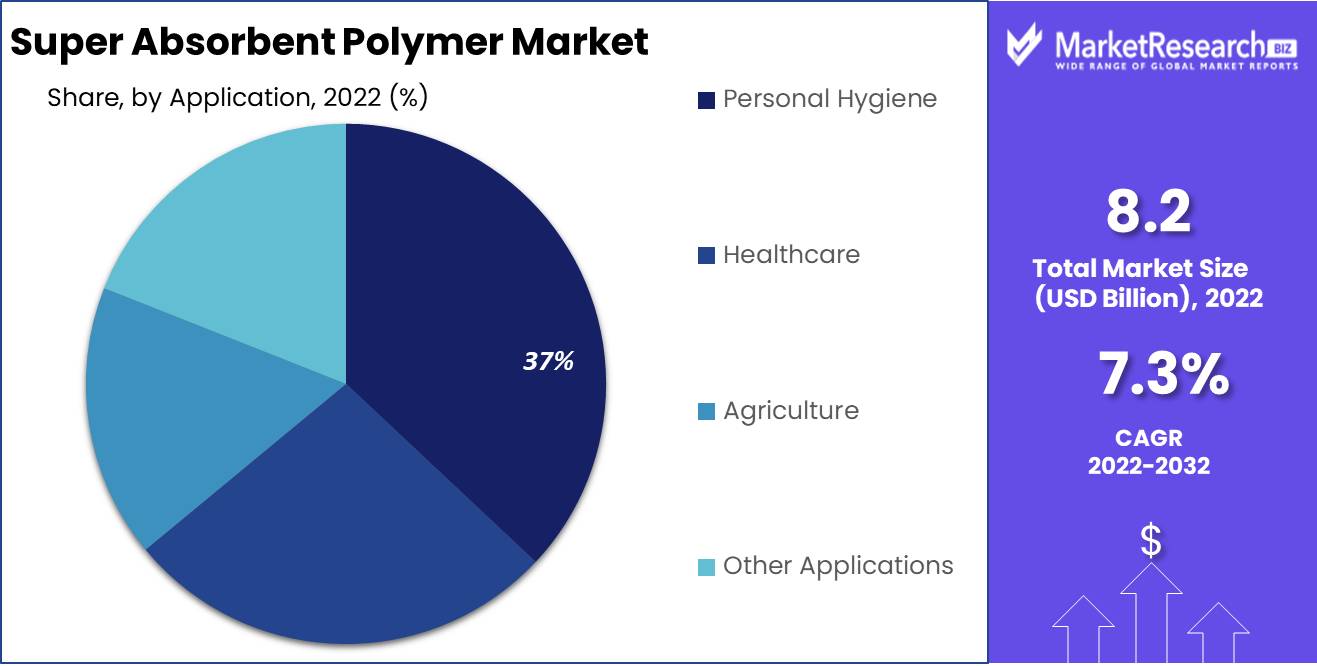
The market is dominated by the personal hygiene segment
In 2022, the personal hygiene sector dominated the application market with 37% market share. Baby diapers, adult incontinence products, and female hygiene products all make use of Super Absorbent Polymer as absorbents. Due to the growing global population of children aged 0 to 14, diapers are one of the main end-use applications for Super Absorbent Polymers Market.
The adult incontinence products market is expected to expand strongly due to the rising geriatric population in North America and Europe. In the coming years, there will likely be a higher demand for female hygiene products due to increased awareness of hygiene issues. It is anticipated that government efforts to promote agricultural applications, particularly in water-scarce regions, will significantly impact the market in the near future.
In addition, Super Absorbent Polymers Market used in agriculture are typically produced by suspension polymerization or solution polymerization of cross-linking agents like potassium or acrylic acids. The polymers created in this manner are referred to as polyacrylates. The swelling capacity and gel modulus of the polymer are significantly influenced by the quantity and type of cross-linker used.
Key Market Segments
Based on Type
- Sodium Polyacrylate
- Polyacrylamide Copolymer
- Other Type
Based on Application
- Personal Hygiene
- Healthcare
- Agriculture
- Other Applications
Growth Opportunity
Innovations in better design of diapers
The gel polymerization (GP) method is currently the most popular method for making super-absorbent polymers from sodium polyacrylate for use in diapers. The Super Absorbent Polymers Market begins as a powder and expands into a gel when exposed to moisture. Because this gel cannot be squeezed dry, it works well for diapers because a baby can sit on it and even sleep for hours wearing a wet diaper. Today's diapers are made with polyacrylic acid. A number of new innovations are being introduced to design better diapers to meet the needs of babies.
Latest Trends
Bio-based super absorbent polymers will create new opportunities
There is a significant contribution to global landfills from today's non-biodegradable, super-absorbent polymers. As a result, it is anticipated that investments in the creation of super-absorbent polymers made from renewable materials will open up new global Super Absorbent Polymers Market opportunities.
Super-absorbent polymers derived from renewable materials serve as alternatives to petrochemical-based polymers like potassium polyacrylate and sodium polyacrylate, which are currently utilized in the absorbent core of disposable diapers and other products for personal hygiene.
Regional Analysis
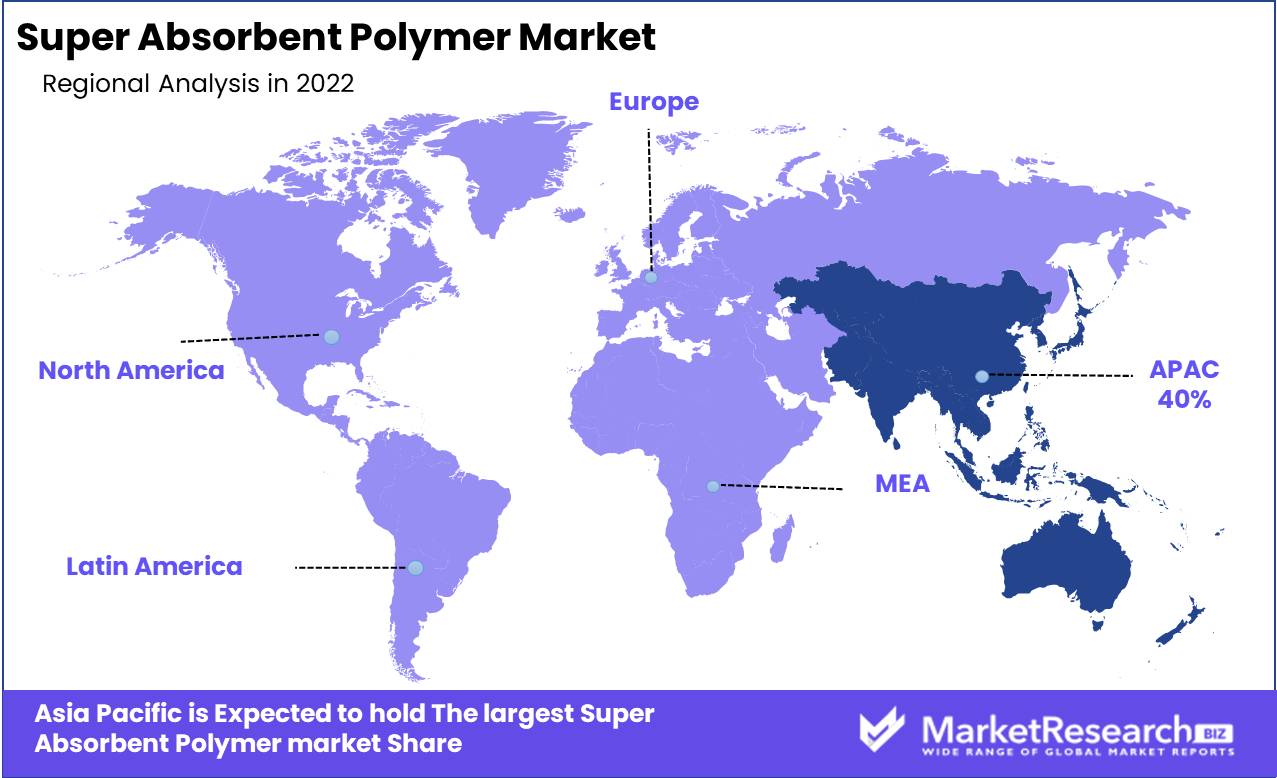
Asia Pacific dominated the market with the help of developing economies like India and China.
Developing economies like India and China dominated the Asia Pacific market in 2022 with a significant share. Diapers and other personal hygiene products are experiencing rapid growth in the region as a result of the region's growing population, rising disposable income, and rising awareness of baby health. In addition, the region's untapped markets for baby diapers, such as Singapore, Vietnam, and Indonesia, are expected to grow, driving demand for super-absorbent polymers.
In 2022, Europe held a sizable market share, accounting for more than a quarter of the total. Due to its high capacity for water absorption and retention, manufacturers of baby diapers are driving the market's expansion. Over the past few years, there has been some growth in the market. The European Super Absorbent Polymers Market is being driven primarily by a shift in lifestyle and an increase in online shopping.
The North American market is expanding due to rising demand from various application segments like agriculture, industrial, personal hygiene, and medical. The primary factors behind the rise in demand for baby diapers, which is expected to propel the market's expansion over the forecast period, are rising awareness of child health and hygiene and high living standards. Over the course of the forecast period, it is anticipated that technological advancements that result in superior product properties, like a low number of diaper-related issues and a high absorption rate, will play a significant role in shaping the regional market.
Key Regions and Countries
North America
- US
- Canada
- Mexico
Western Europe
- Germany
- France
- The UK
- Spain
- Italy
- Portugal
- Ireland
- Austria
- Switzerland
- Benelux
- Nordic
- Rest of Western Europe
Eastern Europe
- Russia
- Poland
- The Czech Republic
- Greece
- Rest of Eastern Europe
APAC
- China
- Japan
- South Korea
- India
- Australia & New Zealand
- Indonesia
- Malaysia
- Philippines
- Singapore
- Thailand
- Vietnam
- Rest of APAC
Latin America
- Brazil
- Colombia
- Chile
- Argentina
- Costa Rica
- Rest of Latin America
Middle East & Africa
- Algeria
- Egypt
- Israel
- Kuwait
- Nigeria
- Saudi Arabia
- South Africa
- Turkey
- United Arab Emirates
- Rest of MEA
Key Players Analysis
Key businesses are exerting significant efforts to expand Super Absorbent Polymers Market share and establish a foothold in developing economies. These measures include developing products with superior qualities, expanding their network, introducing multiple brands, and utilizing fervent marketing strategies to reach customers. Throughout the forecast, the demand for Super Absorbent Polymers Market is anticipated to rise in response to manufacturers' increasing investments in innovation capabilities.
Top Key Players in Super Absorbent Polymer Market
- BASF SE
- Formosa Plastics Corporation
- Sanyo Chemical Industries
- SDP Global Co., Ltd.
- Songwon Industrial Co., Ltd.
- Evonik Industries AG
- KAO Corporation
- Nippon Shokubai Co., Ltd.
- Sumitomo Seika Chemicals Co. Ltd.
- Yixing Danson Technology
- Satellite Science & Technology Co., Ltd.
- Tramfloc Inc.
- SOCO Chemical
- Wanhua
- Other Key Players
Recent Development
- In March 2021, An investment of USD 30.1 million was made by BASF for the development of a new excellence center. To improve innovation capabilities for its super absorbent polymer business, BASF will build a cutting-edge Super absorbents Excellence Center at its Verbund location in Antwerp, Belgium.
- In April 2021, Nippon Shokubai is investing more heavily in the super-absorbents industry as Evonik considers quitting the business. It is combining with Sanyo Chemical, a different polymer manufacturer in Japan, in a deal that they anticipate will be completed.
Report Scope:
Report Features Description Market Value (2022) USD 8.2 Bn Forecast Revenue (2032) USD 16.3 Bn CAGR (2023-2032) 7.3% Base Year for Estimation 2022 Historic Period 2016-2022 Forecast Period 2023-2032 Report Coverage Revenue Forecast, Market Dynamics, COVID-19 Impact, Competitive Landscape, Recent Developments Segments Covered By Type - Sodium Polyacrylate, Polyacrylamide Copolymer and
Other types; Application - Personal Hygiene, Healthcare, Agriculture, Other Applications.Regional Analysis North America – The US, Canada, & Mexico; Western Europe – Germany, France, The UK, Spain, Italy, Portugal, Ireland, Austria, Switzerland, Benelux, Nordic, & Rest of Western Europe; Eastern Europe – Russia, Poland, The Czech Republic, Greece, & Rest of Eastern Europe; APAC – China, Japan, South Korea, India, Australia & New Zealand, Indonesia, Malaysia, Philippines, Singapore, Thailand, Vietnam, & Rest of APAC; Latin America – Brazil, Colombia, Chile, Argentina, Costa Rica, & Rest of Latin America; Middle East & Africa – Algeria, Egypt, Israel, Kuwait, Nigeria, Saudi Arabia, South Africa, Turkey, United Arab Emirates, & Rest of MEA Competitive Landscape BASF SE, Formosa Plastics Corporation, Sanyo Chemical Industries, SDP Global Co., Ltd., Songwon Industrial Co., Ltd., Evonik Industries AG, KAO Customization Scope Customization for segments, region/country-level will be provided. Moreover, additional customization can be done based on the requirements. Purchase Options We have three licenses to opt for: Single User License, Multi-User License (Up to 5 Users), Corporate Use License (Unlimited User and Printable PDF) -
- 1. Executive Summary
- 1.1. Definition
- 1.2. Taxonomy
- 1.3. Research Scope
- 1.4. Key Analysis
- 1.5. Key Findings by Major Segments
- 1.6. Top strategies by Major Players
- 2. Global Specialty Resins Market Overview
- 2.1. Specialty Resins Market Dynamics
- 2.1.1. Drivers
- 2.1.2. Opportunities
- 2.1.3. Restraints
- 2.1.4. Challenges
- 2.2. Macro-economic Factors
- 2.3. Regulatory Framework
- 2.4. Market Investment Feasibility Index
- 2.5. PEST Analysis
- 2.6. PORTER’S Five Force Analysis
- 2.7. Drivers & Restraints Impact Analysis
- 2.8. Industry Chain Analysis
- 2.9. Cost Structure Analysis
- 2.10. Marketing Strategy
- 2.11. Russia-Ukraine War Impact Analysis
- 2.12. Opportunity Map Analysis
- 2.13. Market Competition Scenario Analysis
- 2.14. Product Life Cycle Analysis
- 2.15. Opportunity Orbits
- 2.16. Manufacturer Intensity Map
- 2.17. Major Companies sales by Value & Volume
- 2.1. Specialty Resins Market Dynamics
- 3. Global Specialty Resins Market Analysis, Opportunity and Forecast, 2016-2032
- 3.1. Global Specialty Resins Market Analysis, 2016-2021
- 3.2. Global Specialty Resins Market Opportunity and Forecast, 2023-2032
- 3.3. Global Specialty Resins Market Analysis, Opportunity and Forecast, By Type, 2016-2032
- 3.3.1. Global Specialty Resins Market Analysis by Type : Introduction
- 3.3.2. Market Size Absolute $ Opportunity Analysis and Forecast, By Type, 2016-2032
- 3.3.3. Vinyl
- 3.3.4. Epoxy
- 3.3.5. Polyamides
- 3.3.6. Unsaturated Polyester Resins
- 3.3.7. Other Types
- 3.4. Global Specialty Resins Market Analysis, Opportunity and Forecast, By End-User, 2016-2032
- 3.4.1. Global Specialty Resins Market Analysis by End-User: Introduction
- 3.4.2. Market Size Absolute $ Opportunity Analysis and Forecast, By End-User, 2016-2032
- 3.4.3. Building & Construction
- 3.4.4. Water Treatment
- 3.4.5. Marine
- 3.4.6. Electrical & Electronics
- 3.4.7. Automotive
- 3.4.8. Aerospace
- 3.4.9. Other End-User
- 3.5. Global Specialty Resins Market Analysis, Opportunity and Forecast, By Function, 2016-2032
- 3.5.1. Global Specialty Resins Market Analysis by Function : Introduction
- 3.5.2. Market Size Absolute $ Opportunity Analysis and Forecast, By Function, 2016-2032
- 3.5.3. Protection
- 3.5.4. Insulation
- 4. North America Specialty Resins Market Analysis, Opportunity and Forecast, 2016-2032
- 4.1. North America Specialty Resins Market Analysis, 2016-2021
- 4.2. North America Specialty Resins Market Opportunity and Forecast, 2023-2032
- 4.3. North America Specialty Resins Market Analysis, Opportunity and Forecast, By Type, 2016-2032
- 4.3.1. North America Specialty Resins Market Analysis by Type : Introduction
- 4.3.2. Market Size Absolute $ Opportunity Analysis and Forecast, By Type, 2016-2032
- 4.3.3. Vinyl
- 4.3.4. Epoxy
- 4.3.5. Polyamides
- 4.3.6. Unsaturated Polyester Resins
- 4.3.7. Other Types
- 4.4. North America Specialty Resins Market Analysis, Opportunity and Forecast, By End-User, 2016-2032
- 4.4.1. North America Specialty Resins Market Analysis by End-User: Introduction
- 4.4.2. Market Size Absolute $ Opportunity Analysis and Forecast, By End-User, 2016-2032
- 4.4.3. Building & Construction
- 4.4.4. Water Treatment
- 4.4.5. Marine
- 4.4.6. Electrical & Electronics
- 4.4.7. Automotive
- 4.4.8. Aerospace
- 4.4.9. Other End-User
- 4.5. North America Specialty Resins Market Analysis, Opportunity and Forecast, By Function, 2016-2032
- 4.5.1. North America Specialty Resins Market Analysis by Function : Introduction
- 4.5.2. Market Size Absolute $ Opportunity Analysis and Forecast, By Function, 2016-2032
- 4.5.3. Protection
- 4.5.4. Insulation
- 4.6. North America Specialty Resins Market Analysis, Opportunity and Forecast, By Country , 2016-2032
- 4.6.1. North America Specialty Resins Market Analysis by Country : Introduction
- 4.6.2. Market Size Absolute $ Opportunity Analysis and Forecast, Country , 2016-2032
- 4.6.2.1. The US
- 4.6.2.2. Canada
- 4.6.2.3. Mexico
- 5. Western Europe Specialty Resins Market Analysis, Opportunity and Forecast, 2016-2032
- 5.1. Western Europe Specialty Resins Market Analysis, 2016-2021
- 5.2. Western Europe Specialty Resins Market Opportunity and Forecast, 2023-2032
- 5.3. Western Europe Specialty Resins Market Analysis, Opportunity and Forecast, By Type, 2016-2032
- 5.3.1. Western Europe Specialty Resins Market Analysis by Type : Introduction
- 5.3.2. Market Size Absolute $ Opportunity Analysis and Forecast, By Type, 2016-2032
- 5.3.3. Vinyl
- 5.3.4. Epoxy
- 5.3.5. Polyamides
- 5.3.6. Unsaturated Polyester Resins
- 5.3.7. Other Types
- 5.4. Western Europe Specialty Resins Market Analysis, Opportunity and Forecast, By End-User, 2016-2032
- 5.4.1. Western Europe Specialty Resins Market Analysis by End-User: Introduction
- 5.4.2. Market Size Absolute $ Opportunity Analysis and Forecast, By End-User, 2016-2032
- 5.4.3. Building & Construction
- 5.4.4. Water Treatment
- 5.4.5. Marine
- 5.4.6. Electrical & Electronics
- 5.4.7. Automotive
- 5.4.8. Aerospace
- 5.4.9. Other End-User
- 5.5. Western Europe Specialty Resins Market Analysis, Opportunity and Forecast, By Function, 2016-2032
- 5.5.1. Western Europe Specialty Resins Market Analysis by Function : Introduction
- 5.5.2. Market Size Absolute $ Opportunity Analysis and Forecast, By Function, 2016-2032
- 5.5.3. Protection
- 5.5.4. Insulation
- 5.6. Western Europe Specialty Resins Market Analysis, Opportunity and Forecast, By Country , 2016-2032
- 5.6.1. Western Europe Specialty Resins Market Analysis by Country : Introduction
- 5.6.2. Market Size Absolute $ Opportunity Analysis and Forecast, Country , 2016-2032
- 5.6.2.1. Germany
- 5.6.2.2. France
- 5.6.2.3. The UK
- 5.6.2.4. Spain
- 5.6.2.5. Italy
- 5.6.2.6. Portugal
- 5.6.2.7. Ireland
- 5.6.2.8. Austria
- 5.6.2.9. Switzerland
- 5.6.2.10. Benelux
- 5.6.2.11. Nordic
- 5.6.2.12. Rest of Western Europe
- 6. Eastern Europe Specialty Resins Market Analysis, Opportunity and Forecast, 2016-2032
- 6.1. Eastern Europe Specialty Resins Market Analysis, 2016-2021
- 6.2. Eastern Europe Specialty Resins Market Opportunity and Forecast, 2023-2032
- 6.3. Eastern Europe Specialty Resins Market Analysis, Opportunity and Forecast, By Type, 2016-2032
- 6.3.1. Eastern Europe Specialty Resins Market Analysis by Type : Introduction
- 6.3.2. Market Size Absolute $ Opportunity Analysis and Forecast, By Type, 2016-2032
- 6.3.3. Vinyl
- 6.3.4. Epoxy
- 6.3.5. Polyamides
- 6.3.6. Unsaturated Polyester Resins
- 6.3.7. Other Types
- 6.4. Eastern Europe Specialty Resins Market Analysis, Opportunity and Forecast, By End-User, 2016-2032
- 6.4.1. Eastern Europe Specialty Resins Market Analysis by End-User: Introduction
- 6.4.2. Market Size Absolute $ Opportunity Analysis and Forecast, By End-User, 2016-2032
- 6.4.3. Building & Construction
- 6.4.4. Water Treatment
- 6.4.5. Marine
- 6.4.6. Electrical & Electronics
- 6.4.7. Automotive
- 6.4.8. Aerospace
- 6.4.9. Other End-User
- 6.5. Eastern Europe Specialty Resins Market Analysis, Opportunity and Forecast, By Function, 2016-2032
- 6.5.1. Eastern Europe Specialty Resins Market Analysis by Function : Introduction
- 6.5.2. Market Size Absolute $ Opportunity Analysis and Forecast, By Function, 2016-2032
- 6.5.3. Protection
- 6.5.4. Insulation
- 6.6. Eastern Europe Specialty Resins Market Analysis, Opportunity and Forecast, By Country , 2016-2032
- 6.6.1. Eastern Europe Specialty Resins Market Analysis by Country : Introduction
- 6.6.2. Market Size Absolute $ Opportunity Analysis and Forecast, Country , 2016-2032
- 6.6.2.1. Russia
- 6.6.2.2. Poland
- 6.6.2.3. The Czech Republic
- 6.6.2.4. Greece
- 6.6.2.5. Rest of Eastern Europe
- 7. APAC Specialty Resins Market Analysis, Opportunity and Forecast, 2016-2032
- 7.1. APAC Specialty Resins Market Analysis, 2016-2021
- 7.2. APAC Specialty Resins Market Opportunity and Forecast, 2023-2032
- 7.3. APAC Specialty Resins Market Analysis, Opportunity and Forecast, By Type, 2016-2032
- 7.3.1. APAC Specialty Resins Market Analysis by Type : Introduction
- 7.3.2. Market Size Absolute $ Opportunity Analysis and Forecast, By Type, 2016-2032
- 7.3.3. Vinyl
- 7.3.4. Epoxy
- 7.3.5. Polyamides
- 7.3.6. Unsaturated Polyester Resins
- 7.3.7. Other Types
- 7.4. APAC Specialty Resins Market Analysis, Opportunity and Forecast, By End-User, 2016-2032
- 7.4.1. APAC Specialty Resins Market Analysis by End-User: Introduction
- 7.4.2. Market Size Absolute $ Opportunity Analysis and Forecast, By End-User, 2016-2032
- 7.4.3. Building & Construction
- 7.4.4. Water Treatment
- 7.4.5. Marine
- 7.4.6. Electrical & Electronics
- 7.4.7. Automotive
- 7.4.8. Aerospace
- 7.4.9. Other End-User
- 7.5. APAC Specialty Resins Market Analysis, Opportunity and Forecast, By Function, 2016-2032
- 7.5.1. APAC Specialty Resins Market Analysis by Function : Introduction
- 7.5.2. Market Size Absolute $ Opportunity Analysis and Forecast, By Function, 2016-2032
- 7.5.3. Protection
- 7.5.4. Insulation
- 7.6. APAC Specialty Resins Market Analysis, Opportunity and Forecast, By Country , 2016-2032
- 7.6.1. APAC Specialty Resins Market Analysis by Country : Introduction
- 7.6.2. Market Size Absolute $ Opportunity Analysis and Forecast, Country , 2016-2032
- 7.6.2.1. China
- 7.6.2.2. Japan
- 7.6.2.3. South Korea
- 7.6.2.4. India
- 7.6.2.5. Australia & New Zeland
- 7.6.2.6. Indonesia
- 7.6.2.7. Malaysia
- 7.6.2.8. Philippines
- 7.6.2.9. Singapore
- 7.6.2.10. Thailand
- 7.6.2.11. Vietnam
- 7.6.2.12. Rest of APAC
- 8. Latin America Specialty Resins Market Analysis, Opportunity and Forecast, 2016-2032
- 8.1. Latin America Specialty Resins Market Analysis, 2016-2021
- 8.2. Latin America Specialty Resins Market Opportunity and Forecast, 2023-2032
- 8.3. Latin America Specialty Resins Market Analysis, Opportunity and Forecast, By Type, 2016-2032
- 8.3.1. Latin America Specialty Resins Market Analysis by Type : Introduction
- 8.3.2. Market Size Absolute $ Opportunity Analysis and Forecast, By Type, 2016-2032
- 8.3.3. Vinyl
- 8.3.4. Epoxy
- 8.3.5. Polyamides
- 8.3.6. Unsaturated Polyester Resins
- 8.3.7. Other Types
- 8.4. Latin America Specialty Resins Market Analysis, Opportunity and Forecast, By End-User, 2016-2032
- 8.4.1. Latin America Specialty Resins Market Analysis by End-User: Introduction
- 8.4.2. Market Size Absolute $ Opportunity Analysis and Forecast, By End-User, 2016-2032
- 8.4.3. Building & Construction
- 8.4.4. Water Treatment
- 8.4.5. Marine
- 8.4.6. Electrical & Electronics
- 8.4.7. Automotive
- 8.4.8. Aerospace
- 8.4.9. Other End-User
- 8.5. Latin America Specialty Resins Market Analysis, Opportunity and Forecast, By Function, 2016-2032
- 8.5.1. Latin America Specialty Resins Market Analysis by Function : Introduction
- 8.5.2. Market Size Absolute $ Opportunity Analysis and Forecast, By Function, 2016-2032
- 8.5.3. Protection
- 8.5.4. Insulation
- 8.6. Latin America Specialty Resins Market Analysis, Opportunity and Forecast, By Country , 2016-2032
- 8.6.1. Latin America Specialty Resins Market Analysis by Country : Introduction
- 8.6.2. Market Size Absolute $ Opportunity Analysis and Forecast, Country , 2016-2032
- 8.6.2.1. Brazil
- 8.6.2.2. Colombia
- 8.6.2.3. Chile
- 8.6.2.4. Argentina
- 8.6.2.5. Costa Rica
- 8.6.2.6. Rest of Latin America
- 9. Middle East & Africa Specialty Resins Market Analysis, Opportunity and Forecast, 2016-2032
- 9.1. Middle East & Africa Specialty Resins Market Analysis, 2016-2021
- 9.2. Middle East & Africa Specialty Resins Market Opportunity and Forecast, 2023-2032
- 9.3. Middle East & Africa Specialty Resins Market Analysis, Opportunity and Forecast, By Type, 2016-2032
- 9.3.1. Middle East & Africa Specialty Resins Market Analysis by Type : Introduction
- 9.3.2. Market Size Absolute $ Opportunity Analysis and Forecast, By Type, 2016-2032
- 9.3.3. Vinyl
- 9.3.4. Epoxy
- 9.3.5. Polyamides
- 9.3.6. Unsaturated Polyester Resins
- 9.3.7. Other Types
- 9.4. Middle East & Africa Specialty Resins Market Analysis, Opportunity and Forecast, By End-User, 2016-2032
- 9.4.1. Middle East & Africa Specialty Resins Market Analysis by End-User: Introduction
- 9.4.2. Market Size Absolute $ Opportunity Analysis and Forecast, By End-User, 2016-2032
- 9.4.3. Building & Construction
- 9.4.4. Water Treatment
- 9.4.5. Marine
- 9.4.6. Electrical & Electronics
- 9.4.7. Automotive
- 9.4.8. Aerospace
- 9.4.9. Other End-User
- 9.5. Middle East & Africa Specialty Resins Market Analysis, Opportunity and Forecast, By Function, 2016-2032
- 9.5.1. Middle East & Africa Specialty Resins Market Analysis by Function : Introduction
- 9.5.2. Market Size Absolute $ Opportunity Analysis and Forecast, By Function, 2016-2032
- 9.5.3. Protection
- 9.5.4. Insulation
- 9.6. Middle East & Africa Specialty Resins Market Analysis, Opportunity and Forecast, By Country , 2016-2032
- 9.6.1. Middle East & Africa Specialty Resins Market Analysis by Country : Introduction
- 9.6.2. Market Size Absolute $ Opportunity Analysis and Forecast, Country , 2016-2032
- 9.6.2.1. Algeria
- 9.6.2.2. Egypt
- 9.6.2.3. Israel
- 9.6.2.4. Kuwait
- 9.6.2.5. Nigeria
- 9.6.2.6. Saudi Arabia
- 9.6.2.7. South Africa
- 9.6.2.8. Turkey
- 9.6.2.9. The UAE
- 9.6.2.10. Rest of MEA
- 10. Global Specialty Resins Market Analysis, Opportunity and Forecast, By Region , 2016-2032
- 10.1. Global Specialty Resins Market Analysis by Region : Introduction
- 10.2. Market Size Absolute $ Opportunity Analysis and Forecast, By Region , 2016-2032
- 10.2.1. North America
- 10.2.2. Western Europe
- 10.2.3. Eastern Europe
- 10.2.4. APAC
- 10.2.5. Latin America
- 10.2.6. Middle East & Africa
- 11. Global Specialty Resins Market Competitive Landscape, Market Share Analysis, and Company Profiles
- 11.1. Market Share Analysis
- 11.2. Company Profiles
- 11.3. BASF SE
- 11.3.1. Company Overview
- 11.3.2. Financial Highlights
- 11.3.3. Product Portfolio
- 11.3.4. SWOT Analysis
- 11.3.5. Key Strategies and Developments
- 11.4. Hexion Inc
- 11.4.1. Company Overview
- 11.4.2. Financial Highlights
- 11.4.3. Product Portfolio
- 11.4.4. SWOT Analysis
- 11.4.5. Key Strategies and Developments
- 11.5. SABIC
- 11.5.1. Company Overview
- 11.5.2. Financial Highlights
- 11.5.3. Product Portfolio
- 11.5.4. SWOT Analysis
- 11.5.5. Key Strategies and Developments
- 11.6. Royal DSM
- 11.6.1. Company Overview
- 11.6.2. Financial Highlights
- 11.6.3. Product Portfolio
- 11.6.4. SWOT Analysis
- 11.6.5. Key Strategies and Developments
- 11.7. Arkema
- 11.7.1. Company Overview
- 11.7.2. Financial Highlights
- 11.7.3. Product Portfolio
- 11.7.4. SWOT Analysis
- 11.7.5. Key Strategies and Developments
- 11.8. Mitsubishi Chemical Corporation
- 11.8.1. Company Overview
- 11.8.2. Financial Highlights
- 11.8.3. Product Portfolio
- 11.8.4. SWOT Analysis
- 11.8.5. Key Strategies and Developments
- 11.9. The Dow Chemical Company
- 11.9.1. Company Overview
- 11.9.2. Financial Highlights
- 11.9.3. Product Portfolio
- 11.9.4. SWOT Analysis
- 11.9.5. Key Strategies and Developments
- 11.10. Huntsman International LLC
- 11.10.1. Company Overview
- 11.10.2. Financial Highlights
- 11.10.3. Product Portfolio
- 11.10.4. SWOT Analysis
- 11.10.5. Key Strategies and Developments
- 11.11. Radiant Color NV
- 11.11.1. Company Overview
- 11.11.2. Financial Highlights
- 11.11.3. Product Portfolio
- 11.11.4. SWOT Analysis
- 11.11.5. Key Strategies and Developments
- 11.12. Aldex Chemical Company Limited
- 11.12.1. Company Overview
- 11.12.2. Financial Highlights
- 11.12.3. Product Portfolio
- 11.12.4. SWOT Analysis
- 11.12.5. Key Strategies and Developments
- 11.13. Other Key Players
- 11.13.1. Company Overview
- 11.13.2. Financial Highlights
- 11.13.3. Product Portfolio
- 11.13.4. SWOT Analysis
- 11.13.5. Key Strategies and Developments
- 12. Assumptions and Acronyms
- 13. Research Methodology
- 14. Contact
- List of Figures
- Figure 1: Global Specialty Resins Market Revenue (US$ Mn) Market Share by Type in 2022
- Figure 2: Global Specialty Resins Market Attractiveness Analysis by Type , 2016-2032
- Figure 3: Global Specialty Resins Market Revenue (US$ Mn) Market Share by End-Userin 2022
- Figure 4: Global Specialty Resins Market Attractiveness Analysis by End-User, 2016-2032
- Figure 5: Global Specialty Resins Market Revenue (US$ Mn) Market Share by Function in 2022
- Figure 6: Global Specialty Resins Market Attractiveness Analysis by Function , 2016-2032
- Figure 7: Global Specialty Resins Market Revenue (US$ Mn) Market Share by Region in 2022
- Figure 8: Global Specialty Resins Market Attractiveness Analysis by Region, 2016-2032
- Figure 9: Global Specialty Resins Market Revenue (US$ Mn) (2016-2032)
- Figure 10: Global Specialty Resins Market Revenue (US$ Mn) Comparison by Region (2016-2032)
- Figure 11: Global Specialty Resins Market Revenue (US$ Mn) Comparison by Type (2016-2032)
- Figure 12: Global Specialty Resins Market Revenue (US$ Mn) Comparison by End-User (2016-2032)
- Figure 13: Global Specialty Resins Market Revenue (US$ Mn) Comparison by Function (2016-2032)
- Figure 14: Global Specialty Resins Market Y-o-Y Growth Rate Comparison by Region (2016-2032)
- Figure 15: Global Specialty Resins Market Y-o-Y Growth Rate Comparison by Type (2016-2032)
- Figure 16: Global Specialty Resins Market Y-o-Y Growth Rate Comparison by End-User (2016-2032)
- Figure 17: Global Specialty Resins Market Y-o-Y Growth Rate Comparison by Function (2016-2032)
- Figure 18: Global Specialty Resins Market Share Comparison by Region (2016-2032)
- Figure 19: Global Specialty Resins Market Share Comparison by Type (2016-2032)
- Figure 20: Global Specialty Resins Market Share Comparison by End-User (2016-2032)
- Figure 21: Global Specialty Resins Market Share Comparison by Function (2016-2032)
- Figure 22: North America Specialty Resins Market Revenue (US$ Mn) Market Share by Type in 2022
- Figure 23: North America Specialty Resins Market Attractiveness Analysis by Type , 2016-2032
- Figure 24: North America Specialty Resins Market Revenue (US$ Mn) Market Share by End-Userin 2022
- Figure 25: North America Specialty Resins Market Attractiveness Analysis by End-User, 2016-2032
- Figure 26: North America Specialty Resins Market Revenue (US$ Mn) Market Share by Function in 2022
- Figure 27: North America Specialty Resins Market Attractiveness Analysis by Function , 2016-2032
- Figure 28: North America Specialty Resins Market Revenue (US$ Mn) Market Share by Country in 2022
- Figure 29: North America Specialty Resins Market Attractiveness Analysis by Country, 2016-2032
- Figure 30: North America Specialty Resins Market Revenue (US$ Mn) (2016-2032)
- Figure 31: North America Specialty Resins Market Revenue (US$ Mn) Comparison by Country (2016-2032)
- Figure 32: North America Specialty Resins Market Revenue (US$ Mn) Comparison by Type (2016-2032)
- Figure 33: North America Specialty Resins Market Revenue (US$ Mn) Comparison by End-User (2016-2032)
- Figure 34: North America Specialty Resins Market Revenue (US$ Mn) Comparison by Function (2016-2032)
- Figure 35: North America Specialty Resins Market Y-o-Y Growth Rate Comparison by Country (2016-2032)
- Figure 36: North America Specialty Resins Market Y-o-Y Growth Rate Comparison by Type (2016-2032)
- Figure 37: North America Specialty Resins Market Y-o-Y Growth Rate Comparison by End-User (2016-2032)
- Figure 38: North America Specialty Resins Market Y-o-Y Growth Rate Comparison by Function (2016-2032)
- Figure 39: North America Specialty Resins Market Share Comparison by Country (2016-2032)
- Figure 40: North America Specialty Resins Market Share Comparison by Type (2016-2032)
- Figure 41: North America Specialty Resins Market Share Comparison by End-User (2016-2032)
- Figure 42: North America Specialty Resins Market Share Comparison by Function (2016-2032)
- Figure 43: Western Europe Specialty Resins Market Revenue (US$ Mn) Market Share by Type in 2022
- Figure 44: Western Europe Specialty Resins Market Attractiveness Analysis by Type , 2016-2032
- Figure 45: Western Europe Specialty Resins Market Revenue (US$ Mn) Market Share by End-Userin 2022
- Figure 46: Western Europe Specialty Resins Market Attractiveness Analysis by End-User, 2016-2032
- Figure 47: Western Europe Specialty Resins Market Revenue (US$ Mn) Market Share by Function in 2022
- Figure 48: Western Europe Specialty Resins Market Attractiveness Analysis by Function , 2016-2032
- Figure 49: Western Europe Specialty Resins Market Revenue (US$ Mn) Market Share by Country in 2022
- Figure 50: Western Europe Specialty Resins Market Attractiveness Analysis by Country, 2016-2032
- Figure 51: Western Europe Specialty Resins Market Revenue (US$ Mn) (2016-2032)
- Figure 52: Western Europe Specialty Resins Market Revenue (US$ Mn) Comparison by Country (2016-2032)
- Figure 53: Western Europe Specialty Resins Market Revenue (US$ Mn) Comparison by Type (2016-2032)
- Figure 54: Western Europe Specialty Resins Market Revenue (US$ Mn) Comparison by End-User (2016-2032)
- Figure 55: Western Europe Specialty Resins Market Revenue (US$ Mn) Comparison by Function (2016-2032)
- Figure 56: Western Europe Specialty Resins Market Y-o-Y Growth Rate Comparison by Country (2016-2032)
- Figure 57: Western Europe Specialty Resins Market Y-o-Y Growth Rate Comparison by Type (2016-2032)
- Figure 58: Western Europe Specialty Resins Market Y-o-Y Growth Rate Comparison by End-User (2016-2032)
- Figure 59: Western Europe Specialty Resins Market Y-o-Y Growth Rate Comparison by Function (2016-2032)
- Figure 60: Western Europe Specialty Resins Market Share Comparison by Country (2016-2032)
- Figure 61: Western Europe Specialty Resins Market Share Comparison by Type (2016-2032)
- Figure 62: Western Europe Specialty Resins Market Share Comparison by End-User (2016-2032)
- Figure 63: Western Europe Specialty Resins Market Share Comparison by Function (2016-2032)
- Figure 64: Eastern Europe Specialty Resins Market Revenue (US$ Mn) Market Share by Type in 2022
- Figure 65: Eastern Europe Specialty Resins Market Attractiveness Analysis by Type , 2016-2032
- Figure 66: Eastern Europe Specialty Resins Market Revenue (US$ Mn) Market Share by End-Userin 2022
- Figure 67: Eastern Europe Specialty Resins Market Attractiveness Analysis by End-User, 2016-2032
- Figure 68: Eastern Europe Specialty Resins Market Revenue (US$ Mn) Market Share by Function in 2022
- Figure 69: Eastern Europe Specialty Resins Market Attractiveness Analysis by Function , 2016-2032
- Figure 70: Eastern Europe Specialty Resins Market Revenue (US$ Mn) Market Share by Country in 2022
- Figure 71: Eastern Europe Specialty Resins Market Attractiveness Analysis by Country, 2016-2032
- Figure 72: Eastern Europe Specialty Resins Market Revenue (US$ Mn) (2016-2032)
- Figure 73: Eastern Europe Specialty Resins Market Revenue (US$ Mn) Comparison by Country (2016-2032)
- Figure 74: Eastern Europe Specialty Resins Market Revenue (US$ Mn) Comparison by Type (2016-2032)
- Figure 75: Eastern Europe Specialty Resins Market Revenue (US$ Mn) Comparison by End-User (2016-2032)
- Figure 76: Eastern Europe Specialty Resins Market Revenue (US$ Mn) Comparison by Function (2016-2032)
- Figure 77: Eastern Europe Specialty Resins Market Y-o-Y Growth Rate Comparison by Country (2016-2032)
- Figure 78: Eastern Europe Specialty Resins Market Y-o-Y Growth Rate Comparison by Type (2016-2032)
- Figure 79: Eastern Europe Specialty Resins Market Y-o-Y Growth Rate Comparison by End-User (2016-2032)
- Figure 80: Eastern Europe Specialty Resins Market Y-o-Y Growth Rate Comparison by Function (2016-2032)
- Figure 81: Eastern Europe Specialty Resins Market Share Comparison by Country (2016-2032)
- Figure 82: Eastern Europe Specialty Resins Market Share Comparison by Type (2016-2032)
- Figure 83: Eastern Europe Specialty Resins Market Share Comparison by End-User (2016-2032)
- Figure 84: Eastern Europe Specialty Resins Market Share Comparison by Function (2016-2032)
- Figure 85: APAC Specialty Resins Market Revenue (US$ Mn) Market Share by Type in 2022
- Figure 86: APAC Specialty Resins Market Attractiveness Analysis by Type , 2016-2032
- Figure 87: APAC Specialty Resins Market Revenue (US$ Mn) Market Share by End-Userin 2022
- Figure 88: APAC Specialty Resins Market Attractiveness Analysis by End-User, 2016-2032
- Figure 89: APAC Specialty Resins Market Revenue (US$ Mn) Market Share by Function in 2022
- Figure 90: APAC Specialty Resins Market Attractiveness Analysis by Function , 2016-2032
- Figure 91: APAC Specialty Resins Market Revenue (US$ Mn) Market Share by Country in 2022
- Figure 92: APAC Specialty Resins Market Attractiveness Analysis by Country, 2016-2032
- Figure 93: APAC Specialty Resins Market Revenue (US$ Mn) (2016-2032)
- Figure 94: APAC Specialty Resins Market Revenue (US$ Mn) Comparison by Country (2016-2032)
- Figure 95: APAC Specialty Resins Market Revenue (US$ Mn) Comparison by Type (2016-2032)
- Figure 96: APAC Specialty Resins Market Revenue (US$ Mn) Comparison by End-User (2016-2032)
- Figure 97: APAC Specialty Resins Market Revenue (US$ Mn) Comparison by Function (2016-2032)
- Figure 98: APAC Specialty Resins Market Y-o-Y Growth Rate Comparison by Country (2016-2032)
- Figure 99: APAC Specialty Resins Market Y-o-Y Growth Rate Comparison by Type (2016-2032)
- Figure 100: APAC Specialty Resins Market Y-o-Y Growth Rate Comparison by End-User (2016-2032)
- Figure 101: APAC Specialty Resins Market Y-o-Y Growth Rate Comparison by Function (2016-2032)
- Figure 102: APAC Specialty Resins Market Share Comparison by Country (2016-2032)
- Figure 103: APAC Specialty Resins Market Share Comparison by Type (2016-2032)
- Figure 104: APAC Specialty Resins Market Share Comparison by End-User (2016-2032)
- Figure 105: APAC Specialty Resins Market Share Comparison by Function (2016-2032)
- Figure 106: Latin America Specialty Resins Market Revenue (US$ Mn) Market Share by Type in 2022
- Figure 107: Latin America Specialty Resins Market Attractiveness Analysis by Type , 2016-2032
- Figure 108: Latin America Specialty Resins Market Revenue (US$ Mn) Market Share by End-Userin 2022
- Figure 109: Latin America Specialty Resins Market Attractiveness Analysis by End-User, 2016-2032
- Figure 110: Latin America Specialty Resins Market Revenue (US$ Mn) Market Share by Function in 2022
- Figure 111: Latin America Specialty Resins Market Attractiveness Analysis by Function , 2016-2032
- Figure 112: Latin America Specialty Resins Market Revenue (US$ Mn) Market Share by Country in 2022
- Figure 113: Latin America Specialty Resins Market Attractiveness Analysis by Country, 2016-2032
- Figure 114: Latin America Specialty Resins Market Revenue (US$ Mn) (2016-2032)
- Figure 115: Latin America Specialty Resins Market Revenue (US$ Mn) Comparison by Country (2016-2032)
- Figure 116: Latin America Specialty Resins Market Revenue (US$ Mn) Comparison by Type (2016-2032)
- Figure 117: Latin America Specialty Resins Market Revenue (US$ Mn) Comparison by End-User (2016-2032)
- Figure 118: Latin America Specialty Resins Market Revenue (US$ Mn) Comparison by Function (2016-2032)
- Figure 119: Latin America Specialty Resins Market Y-o-Y Growth Rate Comparison by Country (2016-2032)
- Figure 120: Latin America Specialty Resins Market Y-o-Y Growth Rate Comparison by Type (2016-2032)
- Figure 121: Latin America Specialty Resins Market Y-o-Y Growth Rate Comparison by End-User (2016-2032)
- Figure 122: Latin America Specialty Resins Market Y-o-Y Growth Rate Comparison by Function (2016-2032)
- Figure 123: Latin America Specialty Resins Market Share Comparison by Country (2016-2032)
- Figure 124: Latin America Specialty Resins Market Share Comparison by Type (2016-2032)
- Figure 125: Latin America Specialty Resins Market Share Comparison by End-User (2016-2032)
- Figure 126: Latin America Specialty Resins Market Share Comparison by Function (2016-2032)
- Figure 127: Middle East & Africa Specialty Resins Market Revenue (US$ Mn) Market Share by Type in 2022
- Figure 128: Middle East & Africa Specialty Resins Market Attractiveness Analysis by Type , 2016-2032
- Figure 129: Middle East & Africa Specialty Resins Market Revenue (US$ Mn) Market Share by End-Userin 2022
- Figure 130: Middle East & Africa Specialty Resins Market Attractiveness Analysis by End-User, 2016-2032
- Figure 131: Middle East & Africa Specialty Resins Market Revenue (US$ Mn) Market Share by Function in 2022
- Figure 132: Middle East & Africa Specialty Resins Market Attractiveness Analysis by Function , 2016-2032
- Figure 133: Middle East & Africa Specialty Resins Market Revenue (US$ Mn) Market Share by Country in 2022
- Figure 134: Middle East & Africa Specialty Resins Market Attractiveness Analysis by Country, 2016-2032
- Figure 135: Middle East & Africa Specialty Resins Market Revenue (US$ Mn) (2016-2032)
- Figure 136: Middle East & Africa Specialty Resins Market Revenue (US$ Mn) Comparison by Country (2016-2032)
- Figure 137: Middle East & Africa Specialty Resins Market Revenue (US$ Mn) Comparison by Type (2016-2032)
- Figure 138: Middle East & Africa Specialty Resins Market Revenue (US$ Mn) Comparison by End-User (2016-2032)
- Figure 139: Middle East & Africa Specialty Resins Market Revenue (US$ Mn) Comparison by Function (2016-2032)
- Figure 140: Middle East & Africa Specialty Resins Market Y-o-Y Growth Rate Comparison by Country (2016-2032)
- Figure 141: Middle East & Africa Specialty Resins Market Y-o-Y Growth Rate Comparison by Type (2016-2032)
- Figure 142: Middle East & Africa Specialty Resins Market Y-o-Y Growth Rate Comparison by End-User (2016-2032)
- Figure 143: Middle East & Africa Specialty Resins Market Y-o-Y Growth Rate Comparison by Function (2016-2032)
- Figure 144: Middle East & Africa Specialty Resins Market Share Comparison by Country (2016-2032)
- Figure 145: Middle East & Africa Specialty Resins Market Share Comparison by Type (2016-2032)
- Figure 146: Middle East & Africa Specialty Resins Market Share Comparison by End-User (2016-2032)
- Figure 147: Middle East & Africa Specialty Resins Market Share Comparison by Function (2016-2032)
- List of Tables
- Table 1: Global Specialty Resins Market Comparison by Type (2016-2032)
- Table 2: Global Specialty Resins Market Comparison by End-User (2016-2032)
- Table 3: Global Specialty Resins Market Comparison by Function (2016-2032)
- Table 4: Global Specialty Resins Market Revenue (US$ Mn) Comparison by Region (2016-2032)
- Table 5: Global Specialty Resins Market Revenue (US$ Mn) (2016-2032)
- Table 6: Global Specialty Resins Market Revenue (US$ Mn) Comparison by Region (2016-2032)
- Table 7: Global Specialty Resins Market Revenue (US$ Mn) Comparison by Type (2016-2032)
- Table 8: Global Specialty Resins Market Revenue (US$ Mn) Comparison by End-User (2016-2032)
- Table 9: Global Specialty Resins Market Revenue (US$ Mn) Comparison by Function (2016-2032)
- Table 10: Global Specialty Resins Market Y-o-Y Growth Rate Comparison by Region (2016-2032)
- Table 11: Global Specialty Resins Market Y-o-Y Growth Rate Comparison by Type (2016-2032)
- Table 12: Global Specialty Resins Market Y-o-Y Growth Rate Comparison by End-User (2016-2032)
- Table 13: Global Specialty Resins Market Y-o-Y Growth Rate Comparison by Function (2016-2032)
- Table 14: Global Specialty Resins Market Share Comparison by Region (2016-2032)
- Table 15: Global Specialty Resins Market Share Comparison by Type (2016-2032)
- Table 16: Global Specialty Resins Market Share Comparison by End-User (2016-2032)
- Table 17: Global Specialty Resins Market Share Comparison by Function (2016-2032)
- Table 18: North America Specialty Resins Market Comparison by End-User (2016-2032)
- Table 19: North America Specialty Resins Market Comparison by Function (2016-2032)
- Table 20: North America Specialty Resins Market Revenue (US$ Mn) Comparison by Country (2016-2032)
- Table 21: North America Specialty Resins Market Revenue (US$ Mn) (2016-2032)
- Table 22: North America Specialty Resins Market Revenue (US$ Mn) Comparison by Country (2016-2032)
- Table 23: North America Specialty Resins Market Revenue (US$ Mn) Comparison by Type (2016-2032)
- Table 24: North America Specialty Resins Market Revenue (US$ Mn) Comparison by End-User (2016-2032)
- Table 25: North America Specialty Resins Market Revenue (US$ Mn) Comparison by Function (2016-2032)
- Table 26: North America Specialty Resins Market Y-o-Y Growth Rate Comparison by Country (2016-2032)
- Table 27: North America Specialty Resins Market Y-o-Y Growth Rate Comparison by Type (2016-2032)
- Table 28: North America Specialty Resins Market Y-o-Y Growth Rate Comparison by End-User (2016-2032)
- Table 29: North America Specialty Resins Market Y-o-Y Growth Rate Comparison by Function (2016-2032)
- Table 30: North America Specialty Resins Market Share Comparison by Country (2016-2032)
- Table 31: North America Specialty Resins Market Share Comparison by Type (2016-2032)
- Table 32: North America Specialty Resins Market Share Comparison by End-User (2016-2032)
- Table 33: North America Specialty Resins Market Share Comparison by Function (2016-2032)
- Table 34: Western Europe Specialty Resins Market Comparison by Type (2016-2032)
- Table 35: Western Europe Specialty Resins Market Comparison by End-User (2016-2032)
- Table 36: Western Europe Specialty Resins Market Comparison by Function (2016-2032)
- Table 37: Western Europe Specialty Resins Market Revenue (US$ Mn) Comparison by Country (2016-2032)
- Table 38: Western Europe Specialty Resins Market Revenue (US$ Mn) (2016-2032)
- Table 39: Western Europe Specialty Resins Market Revenue (US$ Mn) Comparison by Country (2016-2032)
- Table 40: Western Europe Specialty Resins Market Revenue (US$ Mn) Comparison by Type (2016-2032)
- Table 41: Western Europe Specialty Resins Market Revenue (US$ Mn) Comparison by End-User (2016-2032)
- Table 42: Western Europe Specialty Resins Market Revenue (US$ Mn) Comparison by Function (2016-2032)
- Table 43: Western Europe Specialty Resins Market Y-o-Y Growth Rate Comparison by Country (2016-2032)
- Table 44: Western Europe Specialty Resins Market Y-o-Y Growth Rate Comparison by Type (2016-2032)
- Table 45: Western Europe Specialty Resins Market Y-o-Y Growth Rate Comparison by End-User (2016-2032)
- Table 46: Western Europe Specialty Resins Market Y-o-Y Growth Rate Comparison by Function (2016-2032)
- Table 47: Western Europe Specialty Resins Market Share Comparison by Country (2016-2032)
- Table 48: Western Europe Specialty Resins Market Share Comparison by Type (2016-2032)
- Table 49: Western Europe Specialty Resins Market Share Comparison by End-User (2016-2032)
- Table 50: Western Europe Specialty Resins Market Share Comparison by Function (2016-2032)
- Table 51: Eastern Europe Specialty Resins Market Comparison by Type (2016-2032)
- Table 52: Eastern Europe Specialty Resins Market Comparison by End-User (2016-2032)
- Table 53: Eastern Europe Specialty Resins Market Comparison by Function (2016-2032)
- Table 54: Eastern Europe Specialty Resins Market Revenue (US$ Mn) Comparison by Country (2016-2032)
- Table 55: Eastern Europe Specialty Resins Market Revenue (US$ Mn) (2016-2032)
- Table 56: Eastern Europe Specialty Resins Market Revenue (US$ Mn) Comparison by Country (2016-2032)
- Table 57: Eastern Europe Specialty Resins Market Revenue (US$ Mn) Comparison by Type (2016-2032)
- Table 58: Eastern Europe Specialty Resins Market Revenue (US$ Mn) Comparison by End-User (2016-2032)
- Table 59: Eastern Europe Specialty Resins Market Revenue (US$ Mn) Comparison by Function (2016-2032)
- Table 60: Eastern Europe Specialty Resins Market Y-o-Y Growth Rate Comparison by Country (2016-2032)
- Table 61: Eastern Europe Specialty Resins Market Y-o-Y Growth Rate Comparison by Type (2016-2032)
- Table 62: Eastern Europe Specialty Resins Market Y-o-Y Growth Rate Comparison by End-User (2016-2032)
- Table 63: Eastern Europe Specialty Resins Market Y-o-Y Growth Rate Comparison by Function (2016-2032)
- Table 64: Eastern Europe Specialty Resins Market Share Comparison by Country (2016-2032)
- Table 65: Eastern Europe Specialty Resins Market Share Comparison by Type (2016-2032)
- Table 66: Eastern Europe Specialty Resins Market Share Comparison by End-User (2016-2032)
- Table 67: Eastern Europe Specialty Resins Market Share Comparison by Function (2016-2032)
- Table 68: APAC Specialty Resins Market Comparison by Type (2016-2032)
- Table 69: APAC Specialty Resins Market Comparison by End-User (2016-2032)
- Table 70: APAC Specialty Resins Market Comparison by Function (2016-2032)
- Table 71: APAC Specialty Resins Market Revenue (US$ Mn) Comparison by Country (2016-2032)
- Table 72: APAC Specialty Resins Market Revenue (US$ Mn) (2016-2032)
- Table 73: APAC Specialty Resins Market Revenue (US$ Mn) Comparison by Country (2016-2032)
- Table 74: APAC Specialty Resins Market Revenue (US$ Mn) Comparison by Type (2016-2032)
- Table 75: APAC Specialty Resins Market Revenue (US$ Mn) Comparison by End-User (2016-2032)
- Table 76: APAC Specialty Resins Market Revenue (US$ Mn) Comparison by Function (2016-2032)
- Table 77: APAC Specialty Resins Market Y-o-Y Growth Rate Comparison by Country (2016-2032)
- Table 78: APAC Specialty Resins Market Y-o-Y Growth Rate Comparison by Type (2016-2032)
- Table 79: APAC Specialty Resins Market Y-o-Y Growth Rate Comparison by End-User (2016-2032)
- Table 80: APAC Specialty Resins Market Y-o-Y Growth Rate Comparison by Function (2016-2032)
- Table 81: APAC Specialty Resins Market Share Comparison by Country (2016-2032)
- Table 82: APAC Specialty Resins Market Share Comparison by Type (2016-2032)
- Table 83: APAC Specialty Resins Market Share Comparison by End-User (2016-2032)
- Table 84: APAC Specialty Resins Market Share Comparison by Function (2016-2032)
- Table 85: Latin America Specialty Resins Market Comparison by Type (2016-2032)
- Table 86: Latin America Specialty Resins Market Comparison by End-User (2016-2032)
- Table 87: Latin America Specialty Resins Market Comparison by Function (2016-2032)
- Table 88: Latin America Specialty Resins Market Revenue (US$ Mn) Comparison by Country (2016-2032)
- Table 89: Latin America Specialty Resins Market Revenue (US$ Mn) (2016-2032)
- Table 90: Latin America Specialty Resins Market Revenue (US$ Mn) Comparison by Country (2016-2032)
- Table 91: Latin America Specialty Resins Market Revenue (US$ Mn) Comparison by Type (2016-2032)
- Table 92: Latin America Specialty Resins Market Revenue (US$ Mn) Comparison by End-User (2016-2032)
- Table 93: Latin America Specialty Resins Market Revenue (US$ Mn) Comparison by Function (2016-2032)
- Table 94: Latin America Specialty Resins Market Y-o-Y Growth Rate Comparison by Country (2016-2032)
- Table 95: Latin America Specialty Resins Market Y-o-Y Growth Rate Comparison by Type (2016-2032)
- Table 96: Latin America Specialty Resins Market Y-o-Y Growth Rate Comparison by End-User (2016-2032)
- Table 97: Latin America Specialty Resins Market Y-o-Y Growth Rate Comparison by Function (2016-2032)
- Table 98: Latin America Specialty Resins Market Share Comparison by Country (2016-2032)
- Table 99: Latin America Specialty Resins Market Share Comparison by Type (2016-2032)
- Table 100: Latin America Specialty Resins Market Share Comparison by End-User (2016-2032)
- Table 101: Latin America Specialty Resins Market Share Comparison by Function (2016-2032)
- Table 102: Middle East & Africa Specialty Resins Market Comparison by Type (2016-2032)
- Table 103: Middle East & Africa Specialty Resins Market Comparison by End-User (2016-2032)
- Table 104: Middle East & Africa Specialty Resins Market Comparison by Function (2016-2032)
- Table 105: Middle East & Africa Specialty Resins Market Revenue (US$ Mn) Comparison by Country (2016-2032)
- Table 106: Middle East & Africa Specialty Resins Market Revenue (US$ Mn) (2016-2032)
- Table 107: Middle East & Africa Specialty Resins Market Revenue (US$ Mn) Comparison by Country (2016-2032)
- Table 108: Middle East & Africa Specialty Resins Market Revenue (US$ Mn) Comparison by Type (2016-2032)
- Table 109: Middle East & Africa Specialty Resins Market Revenue (US$ Mn) Comparison by End-User (2016-2032)
- Table 110: Middle East & Africa Specialty Resins Market Revenue (US$ Mn) Comparison by Function (2016-2032)
- Table 111: Middle East & Africa Specialty Resins Market Y-o-Y Growth Rate Comparison by Country (2016-2032)
- Table 112: Middle East & Africa Specialty Resins Market Y-o-Y Growth Rate Comparison by Type (2016-2032)
- Table 113: Middle East & Africa Specialty Resins Market Y-o-Y Growth Rate Comparison by End-User (2016-2032)
- Table 114: Middle East & Africa Specialty Resins Market Y-o-Y Growth Rate Comparison by Function (2016-2032)
- Table 115: Middle East & Africa Specialty Resins Market Share Comparison by Country (2016-2032)
- Table 116: Middle East & Africa Specialty Resins Market Share Comparison by Type (2016-2032)
- Table 117: Middle East & Africa Specialty Resins Market Share Comparison by End-User (2016-2032)
- Table 118: Middle East & Africa Specialty Resins Market Share Comparison by Function (2016-2032)
- 1. Executive Summary
-
- BASF SE
- Formosa Plastics Corporation
- Sanyo Chemical Industries
- SDP Global Co., Ltd.
- Songwon Industrial Co., Ltd.
- Evonik Industries AG
- KAO Corporation
- Nippon Shokubai Co., Ltd.
- Sumitomo Seika Chemicals Co. Ltd.
- Yixing Danson Technology
- Satellite Science & Technology Co., Ltd.
- Tramfloc Inc.
- SOCO Chemical
- Wanhua
- Other Key Players
Our Clients


View Our Licence Options
