
Global Spices Market By Product(Pepper, Ginger, Cinnamon, Cumin, Turmeric, Cardamom, Coriander), By Form(Powder, Whole, Chopped/Crushed), By Region And Companies - Industry Segment Outlook, Market Assessment, Competition Scenario, Trends, And Forecast 2024-2033
-
1329
-
June 2024
-
300
-


-
This report was compiled by Shreyas Rokade Shreyas Rokade is a seasoned Research Analyst with CMFE, bringing extensive expertise in market research and consulting, with a strong background in Chemical Engineering. Correspondence Team Lead-CMFE Linkedin | Detailed Market research Methodology Our methodology involves a mix of primary research, including interviews with leading mental health experts, and secondary research from reputable medical journals and databases. View Detailed Methodology Page
-
Quick Navigation
Report Overview
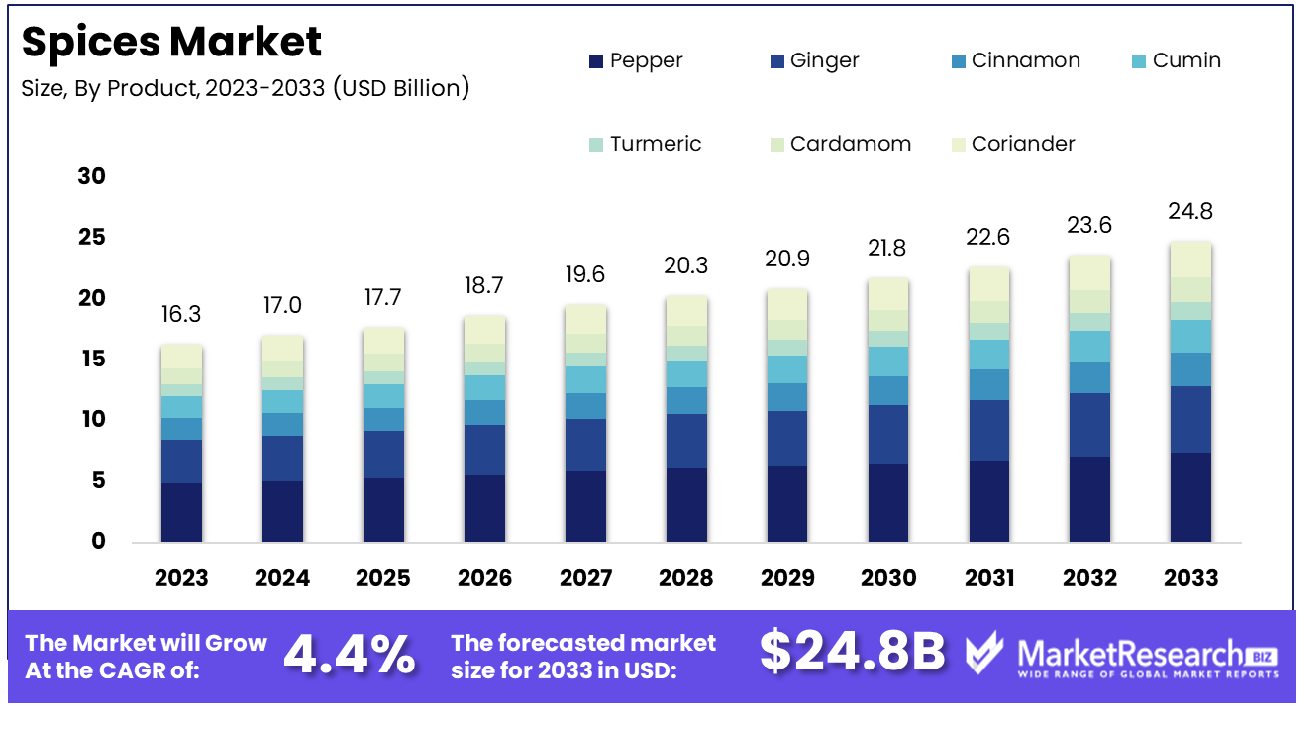
The Global Spices Market was valued at USD 16.3 billion in 2023. It is expected to reach USD 24.8 billion by 2033, with a CAGR of 4.4% during the forecast period from 2024 to 2033.
The Spices Market encompasses the global trade and consumption of various aromatic plant substances used to flavor and preserve food. This market includes a wide range of spices such as pepper, cinnamon, turmeric, and cumin, sourced from diverse geographical regions.
The demand for spices is driven by their essential role in culinary practices, increasing consumer interest in ethnic cuisines, and their applications in health and wellness products. Key players in this market focus on sustainable sourcing, product innovation, and expanding their distribution networks to cater to the growing consumer base and evolving preferences.
The global spices market continues to exhibit robust growth, driven by increasing consumer preference for diverse culinary experiences and the rising popularity of ethnic cuisines. In 2023, the global spices and seasoning export market was valued at $28.06 billion, indicating a healthy demand across international markets.
India, as the leading exporter, maintained a dominant position with exports valued at $3.89 billion in FY23. The growing demand for natural and organic spices further underscores the market's potential, as health-conscious consumers increasingly seek out products with perceived health benefits. Additionally, the food processing industry’s expansion and the rising inclination towards ready-to-eat meals are amplifying the use of spices.
The production outlook for 2022-23 is promising, with expected production increasing to 6.94 lakh tonnes, cultivated over 1.69 lakh hectares, resulting in a productivity rate of 4109 kg/ha. This growth trajectory can be attributed to advancements in agricultural practices and the introduction of high-yield spice varieties. Furthermore, the integration of technology in agriculture, such as precision farming and IoT-based solutions, is anticipated to enhance production efficiency and yield quality.
Despite these positive trends, the market faces challenges such as fluctuating prices and stringent regulatory frameworks governing food safety and quality standards. However, the ongoing innovations in packaging and sustainable farming practices are expected to mitigate these challenges.
The strategic focus on enhancing supply chain efficiencies and expanding distribution networks will play a crucial role in sustaining the market's growth momentum. Overall, the spices market presents lucrative opportunities for stakeholders, underscored by a robust growth outlook and evolving consumer preferences.
Key Takeaways
- Market Growth: The Global Spices Market was valued at USD 16.3 billion in 2023. It is expected to reach USD 24.8 billion by 2033, with a CAGR of 4.4% during the forecast period from 2024 to 2033.
- By Product: Pepper's dominance in the market reaches 20% of the total share.
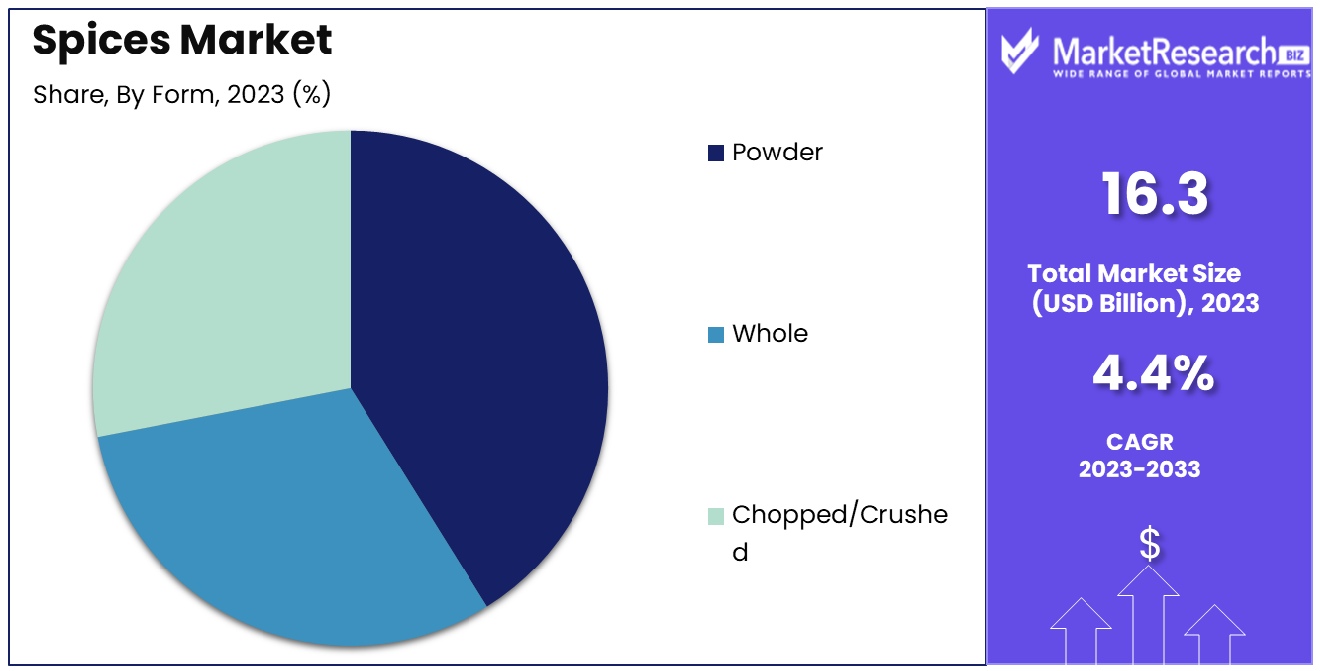
- By Form: Powder form significantly dominates, accounting for 51% of market preference.
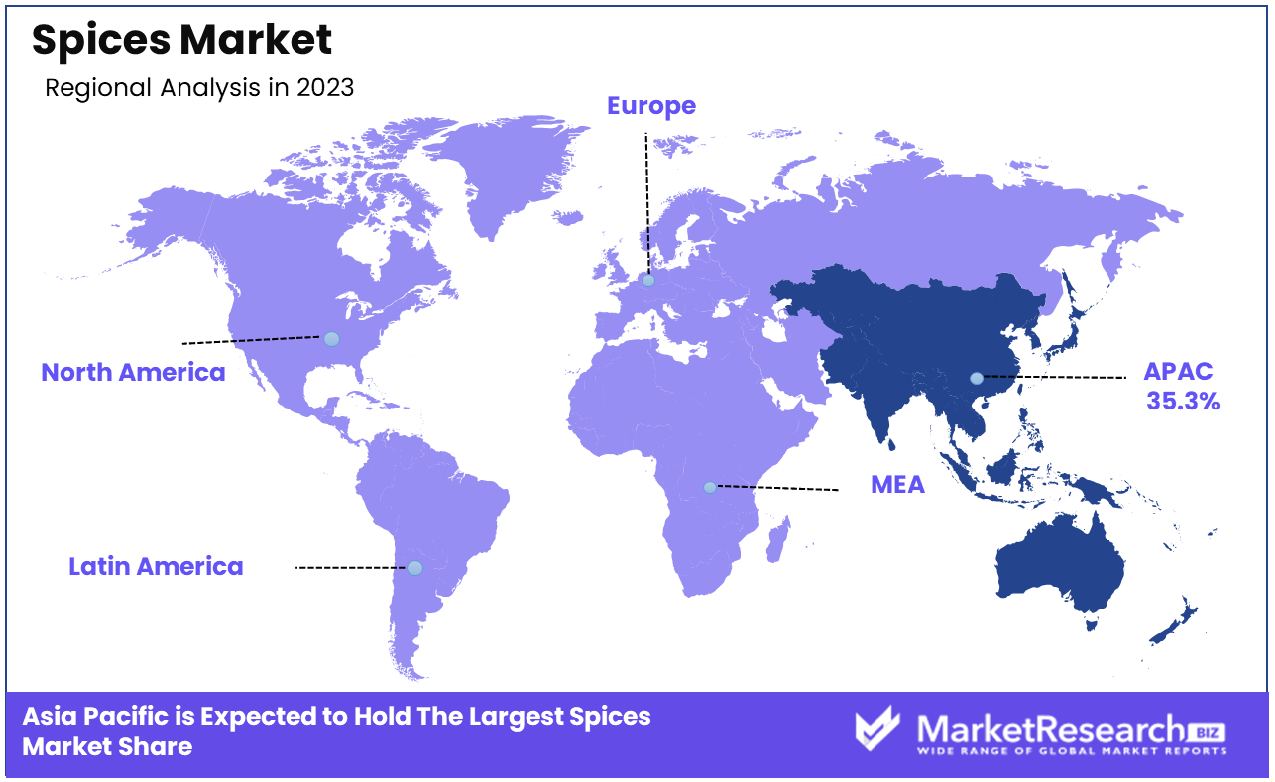
- Regional Dominance: Asia Pacific holds 35.3% of the global spices market.
- Growth Opportunity: In 2023, the global spices market is driven by increased use of convenience foods and innovations in eco-friendly, convenient packaging, enhancing product appeal and meeting consumer demand.
Driving factors
Rising Demand in the Food and Beverages Sector
The growth of the Spices Market is significantly driven by the rising demand within the food and beverages sector. Spices enhance the flavor, color, and aroma of food, making them indispensable in culinary practices worldwide. The global inclination towards diverse and exotic cuisines has led to an increased utilization of spices.
For instance, the increasing popularity of Asian and Middle Eastern cuisines in Western countries has contributed to a surge in demand for spices such as turmeric, cumin, and coriander. This growth is further augmented by the trend towards organic and natural food products, where consumers prefer naturally sourced spices over artificial flavorings.
Widespread Use of Spices for Medicinal Purposes
Spices have long been recognized for their medicinal properties, contributing to the growth of the Spices Market. Traditional medicine systems such as Ayurveda, Traditional Chinese Medicine (TCM), and Unani have utilized spices like turmeric, ginger, and cinnamon for their anti-inflammatory, antioxidant, and antimicrobial properties.
The modern pharmaceutical industry has also acknowledged these benefits, leading to the inclusion of spice-derived compounds in health supplements and functional foods.
High Demand for Spices in the Pharmaceutical Industry
The pharmaceutical industry’s increasing reliance on spices and their derivatives for drug formulation and development is a crucial driver for the Spices Market. Spices contain bioactive compounds that offer therapeutic benefits, making them valuable in creating pharmaceutical products. For instance, the antioxidant properties of spices like cloves and black pepper are harnessed in the development of medications aimed at reducing oxidative stress.
Additionally, the anti-inflammatory properties of spices such as turmeric and ginger are utilized in the formulation of drugs targeting inflammatory conditions. The pharmaceutical sector’s shift towards natural and plant-based ingredients is fueled by the growing consumer preference for holistic and side-effect-free treatments.
Restraining Factors
Competition from Synthetic Flavorings: A Challenge to Natural Spice Market Growth
The growth of the spices market is significantly influenced by competition from synthetic flavorings. Synthetic flavorings are often preferred by food manufacturers due to their lower cost, consistent quality, and longer shelf life compared to natural spices. This preference leads to a reduced demand for natural spices, which can hamper market expansion.
Consumers' growing awareness of food safety and desire for natural ingredients could counterbalance this trend; however, the current dominance of synthetic flavorings remains a considerable restraining factor. To sustain growth, spice producers need to emphasize the unique health benefits and superior flavor profiles of natural spices, leveraging trends toward organic and natural food products.
Limited Availability of Certain Spices: Supply Constraints Affecting Market Dynamics
The limited availability of certain spices poses a significant restraint on the spices market. Spices such as saffron, vanilla, and cardamom are highly susceptible to climatic conditions, geopolitical issues, and labor-intensive harvesting processes. For instance, saffron, often referred to as the "golden spice," requires specific growing conditions and manual harvesting, making it one of the most expensive spices.
The supply of vanilla, primarily grown in Madagascar, can be disrupted by cyclones and fluctuating market prices, affecting its availability and cost. Cardamom production is similarly affected by regional climatic variations, leading to inconsistent supply. These limitations lead to higher prices and reduced availability, deterring potential buyers and limiting market growth.
To address these challenges, efforts to improve cultivation techniques, enhance supply chain resilience, and explore sustainable farming practices are essential. Moreover, increasing investments in research and development can aid in finding more efficient ways to grow and harvest these precious commodities, thereby stabilizing supply and supporting market expansion.
By Product Analysis
The pepper segment dominated the market with a 20% share, showcasing strong consumer preference.
The global spices market witnessed a significant shift in 2023, with Pepper emerging as the leader in the By Product segment. Pepper, accounting for over 20% of the market share, continued to be a staple in both household kitchens and commercial food production. This dominance can be attributed to its extensive use in various cuisines and its perceived health benefits, including its role in aiding digestion and possessing anti-inflammatory properties. The consistent demand for pepper across different regions and its inclusion in a myriad of food products underpin its leading market position.
Ginger followed closely, holding a substantial share of the market. Ginger's growth can be linked to its increasing utilization in health and wellness products, driven by consumer preference for natural and organic ingredients. Its applications range from culinary uses to its inclusion in beverages, supplements, and even cosmetics, thanks to its antioxidant and anti-inflammatory properties.
Cinnamon also showed strong market performance, driven by its widespread use in bakery products, beverages, and traditional medicine. Its sweet flavor and health benefits, such as regulating blood sugar levels and reducing inflammation, make it a popular choice among consumers.
Cumin, Turmeric, Cardamom, and Coriander rounded out the list of top spices, each contributing significantly to the market's overall growth. Cumin's earthy flavor makes it a staple in various cuisines, particularly in Indian and Middle Eastern dishes. Turmeric's popularity surged due to its health benefits, including its anti-inflammatory and antioxidant properties. Cardamom and Coriander, with their unique flavors, continued to see steady demand, especially in the food and beverage industry.
By Form Analysis
The powder segment dominated the market with a 51% share, highlighting its widespread usage.
In 2023, Powder held a dominant market position in the By Form segment of the Spices Market, capturing more than a 51% share. Powdered spices, due to their convenience and ease of use in culinary applications, have seen a significant preference among consumers globally. This dominance can be attributed to the widespread adoption of powdered spices in both traditional cooking and modern food processing industries. The powdered form offers advantages such as easier integration into recipes, longer shelf life, and enhanced flavor dispersion, appealing to a broad spectrum of consumers ranging from households to food service providers.
Whole spices, while retaining a niche market share, appeal primarily to consumers seeking authenticity and superior flavor profiles in their culinary endeavors. The market for whole spices is characterized by demand from gourmet chefs and artisanal food manufacturers who prioritize the authenticity and visual appeal that whole spices provide. This segment has shown steady growth, supported by the premiumization trend in the food industry and the rising popularity of gourmet cooking.
Chopped or crushed spices, occupying a smaller but notable portion of the market, catering to consumers seeking a balance between convenience and sensory experience. This segment benefits from applications in ready-to-cook meals, spice blends, and snack foods where pre-prepared ingredients are favored for their ease of incorporation and consistent flavor delivery.
Overall, the Spices Market's segmentation by form reflects diverse consumer preferences and industry dynamics, with each segment contributing uniquely to the market's overall growth trajectory. As consumer tastes evolve and culinary trends continue to diversify, manufacturers and retailers in the spices industry are expected to innovate further to meet the demand for convenience, authenticity, and quality across all form segments.
Key Market Segments
By Product
- Pepper
- Ginger
- Cinnamon
- Cumin
- Turmeric
- Cardamom
- Coriander
By Form
- Powder
- Whole
- Chopped/Crushed
Growth Opportunity
Adoption of Spices in Convenience Foods
The global spices market in 2023 is poised for significant growth, primarily driven by the increasing adoption of spices in convenience foods. This trend is fueled by the rising demand for ready-to-eat and easy-to-cook meals among consumers with busy lifestyles. Spices are being incorporated into a wide range of convenience foods, including frozen meals, snacks, and instant mixes, to enhance flavor profiles and meet the diverse culinary preferences of consumers.
Additionally, the health benefits associated with various spices, such as anti-inflammatory and antioxidant properties, are attracting health-conscious consumers, further boosting market growth. The proliferation of global cuisines and the influence of multicultural trends are also contributing to the increased use of spices in convenience foods, making them a staple ingredient in this segment.
Innovations in Packaging and Presentation
Innovations in packaging and presentation are playing a crucial role in the expansion of the global spices market. In 2023, companies are increasingly focusing on developing innovative packaging solutions that not only preserve the freshness and quality of spices but also enhance their visual appeal. Sustainable and eco-friendly packaging materials are gaining traction, catering to the growing environmental awareness among consumers.
Furthermore, convenient packaging formats such as resealable pouches, single-serve sachets, and spice blends in compact containers are becoming popular, making it easier for consumers to use and store spices. These advancements in packaging are not only improving the shelf life and usability of spices but are also helping brands differentiate their products in a competitive market. As a result, innovative packaging and presentation strategies are expected to drive the growth of the spices market in 2023, meeting the evolving needs and preferences of consumers.
Latest Trends
Surge in Home Cooking and Gourmet Cooking
The global spices market in 2023 is experiencing robust growth, significantly influenced by the surge in home cooking and gourmet cooking trends. With the pandemic fostering a renewed interest in home-cooked meals, consumers are increasingly experimenting with diverse spices to recreate restaurant-quality dishes at home.
This shift is driving demand for high-quality, exotic spices and spice blends that cater to the sophisticated palates of gourmet cooking enthusiasts. Additionally, the proliferation of cooking shows, social media food influencers, and online cooking classes has further fueled this trend, encouraging consumers to explore and integrate a variety of spices into their culinary repertoire.
The growing popularity of global cuisines has also contributed to this trend, as consumers seek authentic flavors and unique taste experiences in their home-cooked meals. As a result, the home and gourmet cooking surge is a key driver of growth in the spices market.
Heightened Focus on Health Benefits of Spices
In 2023, the global spices market is also witnessing a heightened focus on the health benefits of spices, which is significantly impacting market dynamics. Consumers are increasingly aware of the medicinal and health-promoting properties of various spices, such as turmeric's anti-inflammatory effects, ginger's digestive benefits, and cinnamon's role in regulating blood sugar levels.
This awareness is driving the incorporation of spices into daily diets as functional ingredients, not just flavor enhancers. The trend towards natural and organic products is further amplifying the demand for spices with proven health benefits. Additionally, scientific research and clinical studies validating the health claims of spices are bolstering consumer confidence and expanding the market.
Companies are responding by highlighting the health benefits of their spice products through targeted marketing campaigns and product labeling. This focus on health and wellness is a significant trend shaping the global spices market in 2023, aligning with the broader consumer shift towards healthier and more natural food choices.
Regional Analysis
In 2023, the Asia Pacific region holds a 35.3% share of the global spices market.
The global spices market exhibits significant regional diversity, with notable variations in consumption patterns, production capabilities, and market growth rates across different regions. North America represents a mature market with steady growth, driven by increasing consumer preference for ethnic cuisines and organic spices. The region's market is characterized by a high demand for convenience foods and the rising trend of home cooking. The U.S. dominates the North American spices market, accounting for a substantial share of the regional revenue.
Europe, with its rich culinary heritage and diverse cultural influences, remains a vital market for spices. The region's market growth is fueled by the popularity of international cuisines and a growing inclination towards natural and organic food products. Germany, the UK, and France are the leading consumers of spices in Europe, with significant contributions to the market's revenue.
Asia Pacific stands as the dominant region in the global spices market, commanding a leading share of 35.3%. This dominance is attributed to the region's longstanding tradition of spice consumption, extensive production capabilities, and the presence of major spice-producing countries such as India, China, and Vietnam. The region benefits from a high domestic consumption rate and a robust export market, significantly influencing global spice prices and trends.
The Middle East & Africa region is marked by a profound cultural affinity for spices, integral to its culinary practices. The market growth in this region is bolstered by an increasing population and rising disposable incomes. Countries like Saudi Arabia and the UAE are notable markets within the region, showing substantial demand for a variety of spices.
Latin America, while smaller in comparison, is experiencing a growing spices market driven by the rising popularity of local cuisines globally and an increasing emphasis on healthy eating. Brazil and Mexico are the key contributors to the market in this region, with a burgeoning demand for both traditional and exotic spices.
Key Regions and Countries
North America
- The US
- Canada
- Rest of North America
Europe
- Germany
- France
- The UK
- Spain
- Netherlands
- Russia
- Italy
- Rest of Europe
Asia-Pacific
- China
- Japan
- Singapore
- Thailand
- South Korea
- Vietnam
- India
- New Zealand
- Rest of Asia Pacific
Latin America
- Mexico
- Brazil
- Rest of Latin America
Middle East & Africa
- Saudi Arabia
- South Africa
- UAE
- Rest of Middle East & Africa
Key Players Analysis
The global spices market in 2023 is characterized by significant contributions from several key players, each bringing unique strengths and market strategies that shape the industry's landscape.
Ajinomoto Co., Inc. is leveraging its extensive experience in flavor enhancement to expand its spices portfolio, focusing on innovation and health-conscious products. Their global reach and robust R&D capabilities position them as a formidable player in the market.
Associated British Foods plc maintains a diversified approach, incorporating a wide range of spices into their extensive product lines. Their emphasis on quality and sustainability appeals to the growing consumer demand for ethically sourced products.
ARIAKE JAPAN CO., LTD. specializes in natural seasonings and extracts, catering to the premium segment of the market. Their advanced extraction techniques and focus on natural ingredients align with current consumer trends toward clean-label products.
Baria Pepper stands out with its specialization in black pepper, where it holds a strong market position due to its quality production processes and strategic geographical presence in Vietnam, a key pepper-producing region.
Kerry Group integrates its spices offerings within its broader portfolio of taste and nutrition solutions. Their extensive global network and focus on innovation help them address diverse consumer preferences across various regions.
The Bart Ingredients Co. Ltd. focuses on niche markets with a commitment to organic and high-quality spices. Their ability to cater to specific dietary needs and preferences enhances their market appeal.
DS Group leverages its strong brand presence and extensive distribution network in India, focusing on both domestic and international markets. Their wide variety of spices caters to traditional and contemporary culinary needs.
Everest Spices dominates the Indian spices market, renowned for its extensive product range and deep understanding of local consumer preferences. Their strong brand loyalty and comprehensive distribution network are key strengths.
Dohler Group integrates spices into its broader food and beverage solutions, offering customized products for various applications. Their emphasis on natural ingredients and innovative solutions positions them well in the market.
McCormick & Company, Inc. remains a global leader in the spices market, with a comprehensive product range and strong brand equity. Their continuous focus on innovation, sustainability, and acquisitions ensures they remain at the forefront of the industry.
Market Key Players
- Ajinomoto Co., Inc.
- Associated British Foods plc
- ARIAKE JAPAN CO., LTD.
- Baria Pepper
- Kerry Group
- The Bart Ingredients Co. Ltd.
- DS Group
- Everest Spices
- Dohler Group
- McCormick & Company, Inc.
Recent Developement
- In April 2024, FreshGround Ventures, a Bengaluru startup, secures a patent for spice processing and grinding innovation, enabling fresh grinding of spices to retain taste, color, flavor, and aroma. The decentralized approach aims to revolutionize India's spice industry.
- In August 2023, Recent developments in the sauce industry include Aagrah Foods' tomato-based sauces with ginger and garlic hints, MonBangla's Kasundi sauce with mustard oil base, and the rise of vegan options like sugar-free varieties.
- In March 2023, AnnaMaya at Andaz Delhi unveils 'Flowers & Spices' menu by Chef Pasupathi, featuring authentic South Indian and Coastal flavors. Highlight dishes include Malabar Aattirachi Curry and Vellai Poosani Kootu, offering a culinary journey.
Report Scope
Report Features Description Market Value (2023) USD 16.3 Billion Forecast Revenue (2033) USD 24.8 Billion CAGR (2024-2032) 4.4% Base Year for Estimation 2023 Historic Period 2016-2023 Forecast Period 2024-2033 Report Coverage Revenue Forecast, Market Dynamics, COVID-19 Impact, Competitive Landscape, Recent Developments Segments Covered By Product(Pepper, Ginger, Cinnamon, Cumin, Turmeric, Cardamom, Coriander), By Form(Powder, Whole, Chopped/Crushed) Regional Analysis North America - The US, Canada, Rest of North America, Europe - Germany, France, The UK, Spain, Italy, Russia, Netherlands, Rest of Europe, Asia-Pacific - China, Japan, South Korea, India, New Zealand, Singapore, Thailand, Vietnam, Rest of Asia Pacific, Latin America - Brazil, Mexico, Rest of Latin America, Middle East & Africa - South Africa, Saudi Arabia, UAE, Rest of Middle East & Africa Competitive Landscape Ajinomoto Co., Inc., Associated British Foods plc, ARIAKE JAPAN CO., LTD., Baria Pepper, Kerry Group, The Bart Ingredients Co. Ltd., DS Group, Everest Spices, Dohler Group, McCormick & Company, Inc. Customization Scope Customization for segments, region/country-level will be provided. Moreover, additional customization can be done based on the requirements. Purchase Options We have three licenses to opt for Single User License, Multi-User License (Up to 5 Users), Corporate Use License (Unlimited User and Printable PDF) -
- 1. Executive Summary
- 1.1. Definition
- 1.2. Taxonomy
- 1.3. Research Scope
- 1.4. Key Analysis
- 1.5. Key Findings by Major Segments
- 1.6. Top strategies by Major Players
- 2. Global Spices Market Overview
- 2.1. Spices Market Dynamics
- 2.1.1. Drivers
- 2.1.2. Opportunities
- 2.1.3. Restraints
- 2.1.4. Challenges
- 2.2. Macro-economic Factors
- 2.3. Regulatory Framework
- 2.4. Market Investment Feasibility Index
- 2.5. PEST Analysis
- 2.6. PORTER’S Five Force Analysis
- 2.7. Drivers & Restraints Impact Analysis
- 2.8. Industry Chain Analysis
- 2.9. Cost Structure Analysis
- 2.10. Marketing Strategy
- 2.11. Russia-Ukraine War Impact Analysis
- 2.12. Opportunity Map Analysis
- 2.13. Market Competition Scenario Analysis
- 2.14. Product Life Cycle Analysis
- 2.15. Opportunity Orbits
- 2.16. Manufacturer Intensity Map
- 2.17. Major Companies sales by Value & Volume
- 2.1. Spices Market Dynamics
- 3. Global Spices Market Analysis, Opportunity and Forecast, 2016-2032
- 3.1. Global Spices Market Analysis, 2016-2021
- 3.2. Global Spices Market Opportunity and Forecast, 2023-2032
- 3.3. Global Spices Market Analysis, Opportunity and Forecast, By By Product , 2016-2032
- 3.3.1. Global Spices Market Analysis by By Product : Introduction
- 3.3.2. Market Size Absolute $ Opportunity Analysis and Forecast, By By Product , 2016-2032
- 3.3.3. Pepper
- 3.3.4. Ginger
- 3.3.5. Cinnamon
- 3.3.6. Cumin
- 3.3.7. Turmeric
- 3.3.8. Cardamom
- 3.3.9. Coriander
- 3.4. Global Spices Market Analysis, Opportunity and Forecast, By By Form , 2016-2032
- 3.4.1. Global Spices Market Analysis by By Form : Introduction
- 3.4.2. Market Size Absolute $ Opportunity Analysis and Forecast, By By Form , 2016-2032
- 3.4.3. Powder
- 3.4.4. Whole
- 3.4.5. Chopped/Crushed
- 4. North America Spices Market Analysis, Opportunity and Forecast, 2016-2032
- 4.1. North America Spices Market Analysis, 2016-2021
- 4.2. North America Spices Market Opportunity and Forecast, 2023-2032
- 4.3. North America Spices Market Analysis, Opportunity and Forecast, By By Product , 2016-2032
- 4.3.1. North America Spices Market Analysis by By Product : Introduction
- 4.3.2. Market Size Absolute $ Opportunity Analysis and Forecast, By By Product , 2016-2032
- 4.3.3. Pepper
- 4.3.4. Ginger
- 4.3.5. Cinnamon
- 4.3.6. Cumin
- 4.3.7. Turmeric
- 4.3.8. Cardamom
- 4.3.9. Coriander
- 4.4. North America Spices Market Analysis, Opportunity and Forecast, By By Form , 2016-2032
- 4.4.1. North America Spices Market Analysis by By Form : Introduction
- 4.4.2. Market Size Absolute $ Opportunity Analysis and Forecast, By By Form , 2016-2032
- 4.4.3. Powder
- 4.4.4. Whole
- 4.4.5. Chopped/Crushed
- 4.5. North America Spices Market Analysis, Opportunity and Forecast, By Country , 2016-2032
- 4.5.1. North America Spices Market Analysis by Country : Introduction
- 4.5.2. Market Size Absolute $ Opportunity Analysis and Forecast, Country , 2016-2032
- 4.5.2.1. The US
- 4.5.2.2. Canada
- 4.5.2.3. Mexico
- 5. Western Europe Spices Market Analysis, Opportunity and Forecast, 2016-2032
- 5.1. Western Europe Spices Market Analysis, 2016-2021
- 5.2. Western Europe Spices Market Opportunity and Forecast, 2023-2032
- 5.3. Western Europe Spices Market Analysis, Opportunity and Forecast, By By Product , 2016-2032
- 5.3.1. Western Europe Spices Market Analysis by By Product : Introduction
- 5.3.2. Market Size Absolute $ Opportunity Analysis and Forecast, By By Product , 2016-2032
- 5.3.3. Pepper
- 5.3.4. Ginger
- 5.3.5. Cinnamon
- 5.3.6. Cumin
- 5.3.7. Turmeric
- 5.3.8. Cardamom
- 5.3.9. Coriander
- 5.4. Western Europe Spices Market Analysis, Opportunity and Forecast, By By Form , 2016-2032
- 5.4.1. Western Europe Spices Market Analysis by By Form : Introduction
- 5.4.2. Market Size Absolute $ Opportunity Analysis and Forecast, By By Form , 2016-2032
- 5.4.3. Powder
- 5.4.4. Whole
- 5.4.5. Chopped/Crushed
- 5.5. Western Europe Spices Market Analysis, Opportunity and Forecast, By Country , 2016-2032
- 5.5.1. Western Europe Spices Market Analysis by Country : Introduction
- 5.5.2. Market Size Absolute $ Opportunity Analysis and Forecast, Country , 2016-2032
- 5.5.2.1. Germany
- 5.5.2.2. France
- 5.5.2.3. The UK
- 5.5.2.4. Spain
- 5.5.2.5. Italy
- 5.5.2.6. Portugal
- 5.5.2.7. Ireland
- 5.5.2.8. Austria
- 5.5.2.9. Switzerland
- 5.5.2.10. Benelux
- 5.5.2.11. Nordic
- 5.5.2.12. Rest of Western Europe
- 6. Eastern Europe Spices Market Analysis, Opportunity and Forecast, 2016-2032
- 6.1. Eastern Europe Spices Market Analysis, 2016-2021
- 6.2. Eastern Europe Spices Market Opportunity and Forecast, 2023-2032
- 6.3. Eastern Europe Spices Market Analysis, Opportunity and Forecast, By By Product , 2016-2032
- 6.3.1. Eastern Europe Spices Market Analysis by By Product : Introduction
- 6.3.2. Market Size Absolute $ Opportunity Analysis and Forecast, By By Product , 2016-2032
- 6.3.3. Pepper
- 6.3.4. Ginger
- 6.3.5. Cinnamon
- 6.3.6. Cumin
- 6.3.7. Turmeric
- 6.3.8. Cardamom
- 6.3.9. Coriander
- 6.4. Eastern Europe Spices Market Analysis, Opportunity and Forecast, By By Form , 2016-2032
- 6.4.1. Eastern Europe Spices Market Analysis by By Form : Introduction
- 6.4.2. Market Size Absolute $ Opportunity Analysis and Forecast, By By Form , 2016-2032
- 6.4.3. Powder
- 6.4.4. Whole
- 6.4.5. Chopped/Crushed
- 6.5. Eastern Europe Spices Market Analysis, Opportunity and Forecast, By Country , 2016-2032
- 6.5.1. Eastern Europe Spices Market Analysis by Country : Introduction
- 6.5.2. Market Size Absolute $ Opportunity Analysis and Forecast, Country , 2016-2032
- 6.5.2.1. Russia
- 6.5.2.2. Poland
- 6.5.2.3. The Czech Republic
- 6.5.2.4. Greece
- 6.5.2.5. Rest of Eastern Europe
- 7. APAC Spices Market Analysis, Opportunity and Forecast, 2016-2032
- 7.1. APAC Spices Market Analysis, 2016-2021
- 7.2. APAC Spices Market Opportunity and Forecast, 2023-2032
- 7.3. APAC Spices Market Analysis, Opportunity and Forecast, By By Product , 2016-2032
- 7.3.1. APAC Spices Market Analysis by By Product : Introduction
- 7.3.2. Market Size Absolute $ Opportunity Analysis and Forecast, By By Product , 2016-2032
- 7.3.3. Pepper
- 7.3.4. Ginger
- 7.3.5. Cinnamon
- 7.3.6. Cumin
- 7.3.7. Turmeric
- 7.3.8. Cardamom
- 7.3.9. Coriander
- 7.4. APAC Spices Market Analysis, Opportunity and Forecast, By By Form , 2016-2032
- 7.4.1. APAC Spices Market Analysis by By Form : Introduction
- 7.4.2. Market Size Absolute $ Opportunity Analysis and Forecast, By By Form , 2016-2032
- 7.4.3. Powder
- 7.4.4. Whole
- 7.4.5. Chopped/Crushed
- 7.5. APAC Spices Market Analysis, Opportunity and Forecast, By Country , 2016-2032
- 7.5.1. APAC Spices Market Analysis by Country : Introduction
- 7.5.2. Market Size Absolute $ Opportunity Analysis and Forecast, Country , 2016-2032
- 7.5.2.1. China
- 7.5.2.2. Japan
- 7.5.2.3. South Korea
- 7.5.2.4. India
- 7.5.2.5. Australia & New Zeland
- 7.5.2.6. Indonesia
- 7.5.2.7. Malaysia
- 7.5.2.8. Philippines
- 7.5.2.9. Singapore
- 7.5.2.10. Thailand
- 7.5.2.11. Vietnam
- 7.5.2.12. Rest of APAC
- 8. Latin America Spices Market Analysis, Opportunity and Forecast, 2016-2032
- 8.1. Latin America Spices Market Analysis, 2016-2021
- 8.2. Latin America Spices Market Opportunity and Forecast, 2023-2032
- 8.3. Latin America Spices Market Analysis, Opportunity and Forecast, By By Product , 2016-2032
- 8.3.1. Latin America Spices Market Analysis by By Product : Introduction
- 8.3.2. Market Size Absolute $ Opportunity Analysis and Forecast, By By Product , 2016-2032
- 8.3.3. Pepper
- 8.3.4. Ginger
- 8.3.5. Cinnamon
- 8.3.6. Cumin
- 8.3.7. Turmeric
- 8.3.8. Cardamom
- 8.3.9. Coriander
- 8.4. Latin America Spices Market Analysis, Opportunity and Forecast, By By Form , 2016-2032
- 8.4.1. Latin America Spices Market Analysis by By Form : Introduction
- 8.4.2. Market Size Absolute $ Opportunity Analysis and Forecast, By By Form , 2016-2032
- 8.4.3. Powder
- 8.4.4. Whole
- 8.4.5. Chopped/Crushed
- 8.5. Latin America Spices Market Analysis, Opportunity and Forecast, By Country , 2016-2032
- 8.5.1. Latin America Spices Market Analysis by Country : Introduction
- 8.5.2. Market Size Absolute $ Opportunity Analysis and Forecast, Country , 2016-2032
- 8.5.2.1. Brazil
- 8.5.2.2. Colombia
- 8.5.2.3. Chile
- 8.5.2.4. Argentina
- 8.5.2.5. Costa Rica
- 8.5.2.6. Rest of Latin America
- 9. Middle East & Africa Spices Market Analysis, Opportunity and Forecast, 2016-2032
- 9.1. Middle East & Africa Spices Market Analysis, 2016-2021
- 9.2. Middle East & Africa Spices Market Opportunity and Forecast, 2023-2032
- 9.3. Middle East & Africa Spices Market Analysis, Opportunity and Forecast, By By Product , 2016-2032
- 9.3.1. Middle East & Africa Spices Market Analysis by By Product : Introduction
- 9.3.2. Market Size Absolute $ Opportunity Analysis and Forecast, By By Product , 2016-2032
- 9.3.3. Pepper
- 9.3.4. Ginger
- 9.3.5. Cinnamon
- 9.3.6. Cumin
- 9.3.7. Turmeric
- 9.3.8. Cardamom
- 9.3.9. Coriander
- 9.4. Middle East & Africa Spices Market Analysis, Opportunity and Forecast, By By Form , 2016-2032
- 9.4.1. Middle East & Africa Spices Market Analysis by By Form : Introduction
- 9.4.2. Market Size Absolute $ Opportunity Analysis and Forecast, By By Form , 2016-2032
- 9.4.3. Powder
- 9.4.4. Whole
- 9.4.5. Chopped/Crushed
- 9.5. Middle East & Africa Spices Market Analysis, Opportunity and Forecast, By Country , 2016-2032
- 9.5.1. Middle East & Africa Spices Market Analysis by Country : Introduction
- 9.5.2. Market Size Absolute $ Opportunity Analysis and Forecast, Country , 2016-2032
- 9.5.2.1. Algeria
- 9.5.2.2. Egypt
- 9.5.2.3. Israel
- 9.5.2.4. Kuwait
- 9.5.2.5. Nigeria
- 9.5.2.6. Saudi Arabia
- 9.5.2.7. South Africa
- 9.5.2.8. Turkey
- 9.5.2.9. The UAE
- 9.5.2.10. Rest of MEA
- 10. Global Spices Market Analysis, Opportunity and Forecast, By Region , 2016-2032
- 10.1. Global Spices Market Analysis by Region : Introduction
- 10.2. Market Size Absolute $ Opportunity Analysis and Forecast, By Region , 2016-2032
- 10.2.1. North America
- 10.2.2. Western Europe
- 10.2.3. Eastern Europe
- 10.2.4. APAC
- 10.2.5. Latin America
- 10.2.6. Middle East & Africa
- 11. Global Spices Market Competitive Landscape, Market Share Analysis, and Company Profiles
- 11.1. Market Share Analysis
- 11.2. Company Profiles
- 11.3. Ajinomoto Co., Inc.
- 11.3.1. Company Overview
- 11.3.2. Financial Highlights
- 11.3.3. Product Portfolio
- 11.3.4. SWOT Analysis
- 11.3.5. Key Strategies and Developments
- 11.4. Associated British Foods plc
- 11.4.1. Company Overview
- 11.4.2. Financial Highlights
- 11.4.3. Product Portfolio
- 11.4.4. SWOT Analysis
- 11.4.5. Key Strategies and Developments
- 11.5. ARIAKE JAPAN CO., LTD.
- 11.5.1. Company Overview
- 11.5.2. Financial Highlights
- 11.5.3. Product Portfolio
- 11.5.4. SWOT Analysis
- 11.5.5. Key Strategies and Developments
- 11.6. Baria Pepper
- 11.6.1. Company Overview
- 11.6.2. Financial Highlights
- 11.6.3. Product Portfolio
- 11.6.4. SWOT Analysis
- 11.6.5. Key Strategies and Developments
- 11.7. Kerry Group
- 11.7.1. Company Overview
- 11.7.2. Financial Highlights
- 11.7.3. Product Portfolio
- 11.7.4. SWOT Analysis
- 11.7.5. Key Strategies and Developments
- 11.8. The Bart Ingredients Co. Ltd.
- 11.8.1. Company Overview
- 11.8.2. Financial Highlights
- 11.8.3. Product Portfolio
- 11.8.4. SWOT Analysis
- 11.8.5. Key Strategies and Developments
- 11.9. DS Group
- 11.9.1. Company Overview
- 11.9.2. Financial Highlights
- 11.9.3. Product Portfolio
- 11.9.4. SWOT Analysis
- 11.9.5. Key Strategies and Developments
- 11.10. Everest Spices
- 11.10.1. Company Overview
- 11.10.2. Financial Highlights
- 11.10.3. Product Portfolio
- 11.10.4. SWOT Analysis
- 11.10.5. Key Strategies and Developments
- 11.11. Dohler Group
- 11.11.1. Company Overview
- 11.11.2. Financial Highlights
- 11.11.3. Product Portfolio
- 11.11.4. SWOT Analysis
- 11.11.5. Key Strategies and Developments
- 11.12. McCormick & Company, Inc.
- 11.12.1. Company Overview
- 11.12.2. Financial Highlights
- 11.12.3. Product Portfolio
- 11.12.4. SWOT Analysis
- 11.12.5. Key Strategies and Developments
- 11.13.1. Company Overview
- 11.13.2. Financial Highlights
- 11.13.3. Product Portfolio
- 11.13.4. SWOT Analysis
- 11.13.5. Key Strategies and Developments
- 12. Assumptions and Acronyms
- 13. Research Methodology
- 14. Contact
"
- List of Figures
- "
- Figure 1: Global Spices Market Revenue (US$ Mn) Market Share by By Product in 2022
- Figure 2: Global Spices Market Market Attractiveness Analysis by By Product , 2016-2032
- Figure 3: Global Spices Market Revenue (US$ Mn) Market Share by By Form in 2022
- Figure 4: Global Spices Market Market Attractiveness Analysis by By Form , 2016-2032
- Figure 5: Global Spices Market Revenue (US$ Mn) Market Share by Region in 2022
- Figure 6: Global Spices Market Market Attractiveness Analysis by Region, 2016-2032
- Figure 7: Global Spices Market Market Revenue (US$ Mn) (2016-2032)
- Figure 8: Global Spices Market Market Revenue (US$ Mn) Comparison by Region (2016-2032)
- Figure 9: Global Spices Market Market Revenue (US$ Mn) Comparison by By Product (2016-2032)
- Figure 10: Global Spices Market Market Revenue (US$ Mn) Comparison by By Form (2016-2032)
- Figure 11: Global Spices Market Market Y-o-Y Growth Rate Comparison by Region (2016-2032)
- Figure 12: Global Spices Market Market Y-o-Y Growth Rate Comparison by By Product (2016-2032)
- Figure 13: Global Spices Market Market Y-o-Y Growth Rate Comparison by By Form (2016-2032)
- Figure 14: Global Spices Market Market Share Comparison by Region (2016-2032)
- Figure 15: Global Spices Market Market Share Comparison by By Product (2016-2032)
- Figure 16: Global Spices Market Market Share Comparison by By Form (2016-2032)
- Figure 17: North America Spices Market Revenue (US$ Mn) Market Share by By Product in 2022
- Figure 18: North America Spices Market Market Attractiveness Analysis by By Product , 2016-2032
- Figure 19: North America Spices Market Revenue (US$ Mn) Market Share by By Form in 2022
- Figure 20: North America Spices Market Market Attractiveness Analysis by By Form , 2016-2032
- Figure 21: North America Spices Market Revenue (US$ Mn) Market Share by Country in 2022
- Figure 22: North America Spices Market Market Attractiveness Analysis by Country, 2016-2032
- Figure 23: North America Spices Market Market Revenue (US$ Mn) (2016-2032)
- Figure 24: North America Spices Market Market Revenue (US$ Mn) Comparison by Country (2016-2032)
- Figure 25: North America Spices Market Market Revenue (US$ Mn) Comparison by By Product (2016-2032)
- Figure 26: North America Spices Market Market Revenue (US$ Mn) Comparison by By Form (2016-2032)
- Figure 27: North America Spices Market Market Y-o-Y Growth Rate Comparison by Country (2016-2032)
- Figure 28: North America Spices Market Market Y-o-Y Growth Rate Comparison by By Product (2016-2032)
- Figure 29: North America Spices Market Market Y-o-Y Growth Rate Comparison by By Form (2016-2032)
- Figure 30: North America Spices Market Market Share Comparison by Country (2016-2032)
- Figure 31: North America Spices Market Market Share Comparison by By Product (2016-2032)
- Figure 32: North America Spices Market Market Share Comparison by By Form (2016-2032)
- Figure 33: Western Europe Spices Market Revenue (US$ Mn) Market Share by By Product in 2022
- Figure 34: Western Europe Spices Market Market Attractiveness Analysis by By Product , 2016-2032
- Figure 35: Western Europe Spices Market Revenue (US$ Mn) Market Share by By Form in 2022
- Figure 36: Western Europe Spices Market Market Attractiveness Analysis by By Form , 2016-2032
- Figure 37: Western Europe Spices Market Revenue (US$ Mn) Market Share by Country in 2022
- Figure 38: Western Europe Spices Market Market Attractiveness Analysis by Country, 2016-2032
- Figure 39: Western Europe Spices Market Market Revenue (US$ Mn) (2016-2032)
- Figure 40: Western Europe Spices Market Market Revenue (US$ Mn) Comparison by Country (2016-2032)
- Figure 41: Western Europe Spices Market Market Revenue (US$ Mn) Comparison by By Product (2016-2032)
- Figure 42: Western Europe Spices Market Market Revenue (US$ Mn) Comparison by By Form (2016-2032)
- Figure 43: Western Europe Spices Market Market Y-o-Y Growth Rate Comparison by Country (2016-2032)
- Figure 44: Western Europe Spices Market Market Y-o-Y Growth Rate Comparison by By Product (2016-2032)
- Figure 45: Western Europe Spices Market Market Y-o-Y Growth Rate Comparison by By Form (2016-2032)
- Figure 46: Western Europe Spices Market Market Share Comparison by Country (2016-2032)
- Figure 47: Western Europe Spices Market Market Share Comparison by By Product (2016-2032)
- Figure 48: Western Europe Spices Market Market Share Comparison by By Form (2016-2032)
- Figure 49: Eastern Europe Spices Market Revenue (US$ Mn) Market Share by By Product in 2022
- Figure 50: Eastern Europe Spices Market Market Attractiveness Analysis by By Product , 2016-2032
- Figure 51: Eastern Europe Spices Market Revenue (US$ Mn) Market Share by By Form in 2022
- Figure 52: Eastern Europe Spices Market Market Attractiveness Analysis by By Form , 2016-2032
- Figure 53: Eastern Europe Spices Market Revenue (US$ Mn) Market Share by Country in 2022
- Figure 54: Eastern Europe Spices Market Market Attractiveness Analysis by Country, 2016-2032
- Figure 55: Eastern Europe Spices Market Market Revenue (US$ Mn) (2016-2032)
- Figure 56: Eastern Europe Spices Market Market Revenue (US$ Mn) Comparison by Country (2016-2032)
- Figure 57: Eastern Europe Spices Market Market Revenue (US$ Mn) Comparison by By Product (2016-2032)
- Figure 58: Eastern Europe Spices Market Market Revenue (US$ Mn) Comparison by By Form (2016-2032)
- Figure 59: Eastern Europe Spices Market Market Y-o-Y Growth Rate Comparison by Country (2016-2032)
- Figure 60: Eastern Europe Spices Market Market Y-o-Y Growth Rate Comparison by By Product (2016-2032)
- Figure 61: Eastern Europe Spices Market Market Y-o-Y Growth Rate Comparison by By Form (2016-2032)
- Figure 62: Eastern Europe Spices Market Market Share Comparison by Country (2016-2032)
- Figure 63: Eastern Europe Spices Market Market Share Comparison by By Product (2016-2032)
- Figure 64: Eastern Europe Spices Market Market Share Comparison by By Form (2016-2032)
- Figure 65: APAC Spices Market Revenue (US$ Mn) Market Share by By Product in 2022
- Figure 66: APAC Spices Market Market Attractiveness Analysis by By Product , 2016-2032
- Figure 67: APAC Spices Market Revenue (US$ Mn) Market Share by By Form in 2022
- Figure 68: APAC Spices Market Market Attractiveness Analysis by By Form , 2016-2032
- Figure 69: APAC Spices Market Revenue (US$ Mn) Market Share by Country in 2022
- Figure 70: APAC Spices Market Market Attractiveness Analysis by Country, 2016-2032
- Figure 71: APAC Spices Market Market Revenue (US$ Mn) (2016-2032)
- Figure 72: APAC Spices Market Market Revenue (US$ Mn) Comparison by Country (2016-2032)
- Figure 73: APAC Spices Market Market Revenue (US$ Mn) Comparison by By Product (2016-2032)
- Figure 74: APAC Spices Market Market Revenue (US$ Mn) Comparison by By Form (2016-2032)
- Figure 75: APAC Spices Market Market Y-o-Y Growth Rate Comparison by Country (2016-2032)
- Figure 76: APAC Spices Market Market Y-o-Y Growth Rate Comparison by By Product (2016-2032)
- Figure 77: APAC Spices Market Market Y-o-Y Growth Rate Comparison by By Form (2016-2032)
- Figure 78: APAC Spices Market Market Share Comparison by Country (2016-2032)
- Figure 79: APAC Spices Market Market Share Comparison by By Product (2016-2032)
- Figure 80: APAC Spices Market Market Share Comparison by By Form (2016-2032)
- Figure 81: Latin America Spices Market Revenue (US$ Mn) Market Share by By Product in 2022
- Figure 82: Latin America Spices Market Market Attractiveness Analysis by By Product , 2016-2032
- Figure 83: Latin America Spices Market Revenue (US$ Mn) Market Share by By Form in 2022
- Figure 84: Latin America Spices Market Market Attractiveness Analysis by By Form , 2016-2032
- Figure 85: Latin America Spices Market Revenue (US$ Mn) Market Share by Country in 2022
- Figure 86: Latin America Spices Market Market Attractiveness Analysis by Country, 2016-2032
- Figure 87: Latin America Spices Market Market Revenue (US$ Mn) (2016-2032)
- Figure 88: Latin America Spices Market Market Revenue (US$ Mn) Comparison by Country (2016-2032)
- Figure 89: Latin America Spices Market Market Revenue (US$ Mn) Comparison by By Product (2016-2032)
- Figure 90: Latin America Spices Market Market Revenue (US$ Mn) Comparison by By Form (2016-2032)
- Figure 91: Latin America Spices Market Market Y-o-Y Growth Rate Comparison by Country (2016-2032)
- Figure 92: Latin America Spices Market Market Y-o-Y Growth Rate Comparison by By Product (2016-2032)
- Figure 93: Latin America Spices Market Market Y-o-Y Growth Rate Comparison by By Form (2016-2032)
- Figure 94: Latin America Spices Market Market Share Comparison by Country (2016-2032)
- Figure 95: Latin America Spices Market Market Share Comparison by By Product (2016-2032)
- Figure 96: Latin America Spices Market Market Share Comparison by By Form (2016-2032)
- Figure 97: Middle East & Africa Spices Market Revenue (US$ Mn) Market Share by By Product in 2022
- Figure 98: Middle East & Africa Spices Market Market Attractiveness Analysis by By Product , 2016-2032
- Figure 99: Middle East & Africa Spices Market Revenue (US$ Mn) Market Share by By Form in 2022
- Figure 100: Middle East & Africa Spices Market Market Attractiveness Analysis by By Form , 2016-2032
- Figure 101: Middle East & Africa Spices Market Revenue (US$ Mn) Market Share by Country in 2022
- Figure 102: Middle East & Africa Spices Market Market Attractiveness Analysis by Country, 2016-2032
- Figure 103: Middle East & Africa Spices Market Market Revenue (US$ Mn) (2016-2032)
- Figure 104: Middle East & Africa Spices Market Market Revenue (US$ Mn) Comparison by Country (2016-2032)
- Figure 105: Middle East & Africa Spices Market Market Revenue (US$ Mn) Comparison by By Product (2016-2032)
- Figure 106: Middle East & Africa Spices Market Market Revenue (US$ Mn) Comparison by By Form (2016-2032)
- Figure 107: Middle East & Africa Spices Market Market Y-o-Y Growth Rate Comparison by Country (2016-2032)
- Figure 108: Middle East & Africa Spices Market Market Y-o-Y Growth Rate Comparison by By Product (2016-2032)
- Figure 109: Middle East & Africa Spices Market Market Y-o-Y Growth Rate Comparison by By Form (2016-2032)
- Figure 110: Middle East & Africa Spices Market Market Share Comparison by Country (2016-2032)
- Figure 111: Middle East & Africa Spices Market Market Share Comparison by By Product (2016-2032)
- Figure 112: Middle East & Africa Spices Market Market Share Comparison by By Form (2016-2032)
"
- List of Tables
- "
- Table 1: Global Spices Market Market Comparison by By Product (2016-2032)
- Table 2: Global Spices Market Market Comparison by By Form (2016-2032)
- Table 3: Global Spices Market Revenue (US$ Mn) Comparison by Region (2016-2032)
- Table 4: Global Spices Market Market Revenue (US$ Mn) (2016-2032)
- Table 5: Global Spices Market Market Revenue (US$ Mn) Comparison by Region (2016-2032)
- Table 6: Global Spices Market Market Revenue (US$ Mn) Comparison by By Product (2016-2032)
- Table 7: Global Spices Market Market Revenue (US$ Mn) Comparison by By Form (2016-2032)
- Table 8: Global Spices Market Market Y-o-Y Growth Rate Comparison by Region (2016-2032)
- Table 9: Global Spices Market Market Y-o-Y Growth Rate Comparison by By Product (2016-2032)
- Table 10: Global Spices Market Market Y-o-Y Growth Rate Comparison by By Form (2016-2032)
- Table 11: Global Spices Market Market Share Comparison by Region (2016-2032)
- Table 12: Global Spices Market Market Share Comparison by By Product (2016-2032)
- Table 13: Global Spices Market Market Share Comparison by By Form (2016-2032)
- Table 14: North America Spices Market Market Comparison by By Form (2016-2032)
- Table 15: North America Spices Market Revenue (US$ Mn) Comparison by Country (2016-2032)
- Table 16: North America Spices Market Market Revenue (US$ Mn) (2016-2032)
- Table 17: North America Spices Market Market Revenue (US$ Mn) Comparison by Country (2016-2032)
- Table 18: North America Spices Market Market Revenue (US$ Mn) Comparison by By Product (2016-2032)
- Table 19: North America Spices Market Market Revenue (US$ Mn) Comparison by By Form (2016-2032)
- Table 20: North America Spices Market Market Y-o-Y Growth Rate Comparison by Country (2016-2032)
- Table 21: North America Spices Market Market Y-o-Y Growth Rate Comparison by By Product (2016-2032)
- Table 22: North America Spices Market Market Y-o-Y Growth Rate Comparison by By Form (2016-2032)
- Table 23: North America Spices Market Market Share Comparison by Country (2016-2032)
- Table 24: North America Spices Market Market Share Comparison by By Product (2016-2032)
- Table 25: North America Spices Market Market Share Comparison by By Form (2016-2032)
- Table 26: Western Europe Spices Market Market Comparison by By Product (2016-2032)
- Table 27: Western Europe Spices Market Market Comparison by By Form (2016-2032)
- Table 28: Western Europe Spices Market Revenue (US$ Mn) Comparison by Country (2016-2032)
- Table 29: Western Europe Spices Market Market Revenue (US$ Mn) (2016-2032)
- Table 30: Western Europe Spices Market Market Revenue (US$ Mn) Comparison by Country (2016-2032)
- Table 31: Western Europe Spices Market Market Revenue (US$ Mn) Comparison by By Product (2016-2032)
- Table 32: Western Europe Spices Market Market Revenue (US$ Mn) Comparison by By Form (2016-2032)
- Table 33: Western Europe Spices Market Market Y-o-Y Growth Rate Comparison by Country (2016-2032)
- Table 34: Western Europe Spices Market Market Y-o-Y Growth Rate Comparison by By Product (2016-2032)
- Table 35: Western Europe Spices Market Market Y-o-Y Growth Rate Comparison by By Form (2016-2032)
- Table 36: Western Europe Spices Market Market Share Comparison by Country (2016-2032)
- Table 37: Western Europe Spices Market Market Share Comparison by By Product (2016-2032)
- Table 38: Western Europe Spices Market Market Share Comparison by By Form (2016-2032)
- Table 39: Eastern Europe Spices Market Market Comparison by By Product (2016-2032)
- Table 40: Eastern Europe Spices Market Market Comparison by By Form (2016-2032)
- Table 41: Eastern Europe Spices Market Revenue (US$ Mn) Comparison by Country (2016-2032)
- Table 42: Eastern Europe Spices Market Market Revenue (US$ Mn) (2016-2032)
- Table 43: Eastern Europe Spices Market Market Revenue (US$ Mn) Comparison by Country (2016-2032)
- Table 44: Eastern Europe Spices Market Market Revenue (US$ Mn) Comparison by By Product (2016-2032)
- Table 45: Eastern Europe Spices Market Market Revenue (US$ Mn) Comparison by By Form (2016-2032)
- Table 46: Eastern Europe Spices Market Market Y-o-Y Growth Rate Comparison by Country (2016-2032)
- Table 47: Eastern Europe Spices Market Market Y-o-Y Growth Rate Comparison by By Product (2016-2032)
- Table 48: Eastern Europe Spices Market Market Y-o-Y Growth Rate Comparison by By Form (2016-2032)
- Table 49: Eastern Europe Spices Market Market Share Comparison by Country (2016-2032)
- Table 50: Eastern Europe Spices Market Market Share Comparison by By Product (2016-2032)
- Table 51: Eastern Europe Spices Market Market Share Comparison by By Form (2016-2032)
- Table 52: APAC Spices Market Market Comparison by By Product (2016-2032)
- Table 53: APAC Spices Market Market Comparison by By Form (2016-2032)
- Table 54: APAC Spices Market Revenue (US$ Mn) Comparison by Country (2016-2032)
- Table 55: APAC Spices Market Market Revenue (US$ Mn) (2016-2032)
- Table 56: APAC Spices Market Market Revenue (US$ Mn) Comparison by Country (2016-2032)
- Table 57: APAC Spices Market Market Revenue (US$ Mn) Comparison by By Product (2016-2032)
- Table 58: APAC Spices Market Market Revenue (US$ Mn) Comparison by By Form (2016-2032)
- Table 59: APAC Spices Market Market Y-o-Y Growth Rate Comparison by Country (2016-2032)
- Table 60: APAC Spices Market Market Y-o-Y Growth Rate Comparison by By Product (2016-2032)
- Table 61: APAC Spices Market Market Y-o-Y Growth Rate Comparison by By Form (2016-2032)
- Table 62: APAC Spices Market Market Share Comparison by Country (2016-2032)
- Table 63: APAC Spices Market Market Share Comparison by By Product (2016-2032)
- Table 64: APAC Spices Market Market Share Comparison by By Form (2016-2032)
- Table 65: Latin America Spices Market Market Comparison by By Product (2016-2032)
- Table 66: Latin America Spices Market Market Comparison by By Form (2016-2032)
- Table 67: Latin America Spices Market Revenue (US$ Mn) Comparison by Country (2016-2032)
- Table 68: Latin America Spices Market Market Revenue (US$ Mn) (2016-2032)
- Table 69: Latin America Spices Market Market Revenue (US$ Mn) Comparison by Country (2016-2032)
- Table 70: Latin America Spices Market Market Revenue (US$ Mn) Comparison by By Product (2016-2032)
- Table 71: Latin America Spices Market Market Revenue (US$ Mn) Comparison by By Form (2016-2032)
- Table 72: Latin America Spices Market Market Y-o-Y Growth Rate Comparison by Country (2016-2032)
- Table 73: Latin America Spices Market Market Y-o-Y Growth Rate Comparison by By Product (2016-2032)
- Table 74: Latin America Spices Market Market Y-o-Y Growth Rate Comparison by By Form (2016-2032)
- Table 75: Latin America Spices Market Market Share Comparison by Country (2016-2032)
- Table 76: Latin America Spices Market Market Share Comparison by By Product (2016-2032)
- Table 77: Latin America Spices Market Market Share Comparison by By Form (2016-2032)
- Table 78: Middle East & Africa Spices Market Market Comparison by By Product (2016-2032)
- Table 79: Middle East & Africa Spices Market Market Comparison by By Form (2016-2032)
- Table 80: Middle East & Africa Spices Market Revenue (US$ Mn) Comparison by Country (2016-2032)
- Table 81: Middle East & Africa Spices Market Market Revenue (US$ Mn) (2016-2032)
- Table 82: Middle East & Africa Spices Market Market Revenue (US$ Mn) Comparison by Country (2016-2032)
- Table 83: Middle East & Africa Spices Market Market Revenue (US$ Mn) Comparison by By Product (2016-2032)
- Table 84: Middle East & Africa Spices Market Market Revenue (US$ Mn) Comparison by By Form (2016-2032)
- Table 85: Middle East & Africa Spices Market Market Y-o-Y Growth Rate Comparison by Country (2016-2032)
- Table 86: Middle East & Africa Spices Market Market Y-o-Y Growth Rate Comparison by By Product (2016-2032)
- Table 87: Middle East & Africa Spices Market Market Y-o-Y Growth Rate Comparison by By Form (2016-2032)
- Table 88: Middle East & Africa Spices Market Market Share Comparison by Country (2016-2032)
- Table 89: Middle East & Africa Spices Market Market Share Comparison by By Product (2016-2032)
- Table 90: Middle East & Africa Spices Market Market Share Comparison by By Form (2016-2032)
- 1. Executive Summary
-
- Ajinomoto Co., Inc.
- Associated British Foods plc
- ARIAKE JAPAN CO., LTD.
- Baria Pepper
- Kerry Group
- The Bart Ingredients Co. Ltd.
- DS Group
- Everest Spices
- Dohler Group
- McCormick & Company, Inc.
Our Clients


View Our Licence Options
