Space Tourism Market By Type (Orbital, Sub-Orbital), By End-User (Government, Commercial, Other End-Users), By Region And Companies - Industry Segment Outlook, Market Assessment, Competition Scenario, Trends, And Forecast 2024-2033
-
50891
-
September 2024
-
300
-


-
This report was compiled by Research Team Research team of over 50 passionate professionals leverages advanced research methodologies and analytical expertise to deliver insightful, data-driven market intelligence that empowers businesses across diverse industries to make strategic, well-informed Correspondence Research Team Linkedin | Detailed Market research Methodology Our methodology involves a mix of primary research, including interviews with leading mental health experts, and secondary research from reputable medical journals and databases. View Detailed Methodology Page
-
Quick Navigation
Report Overview
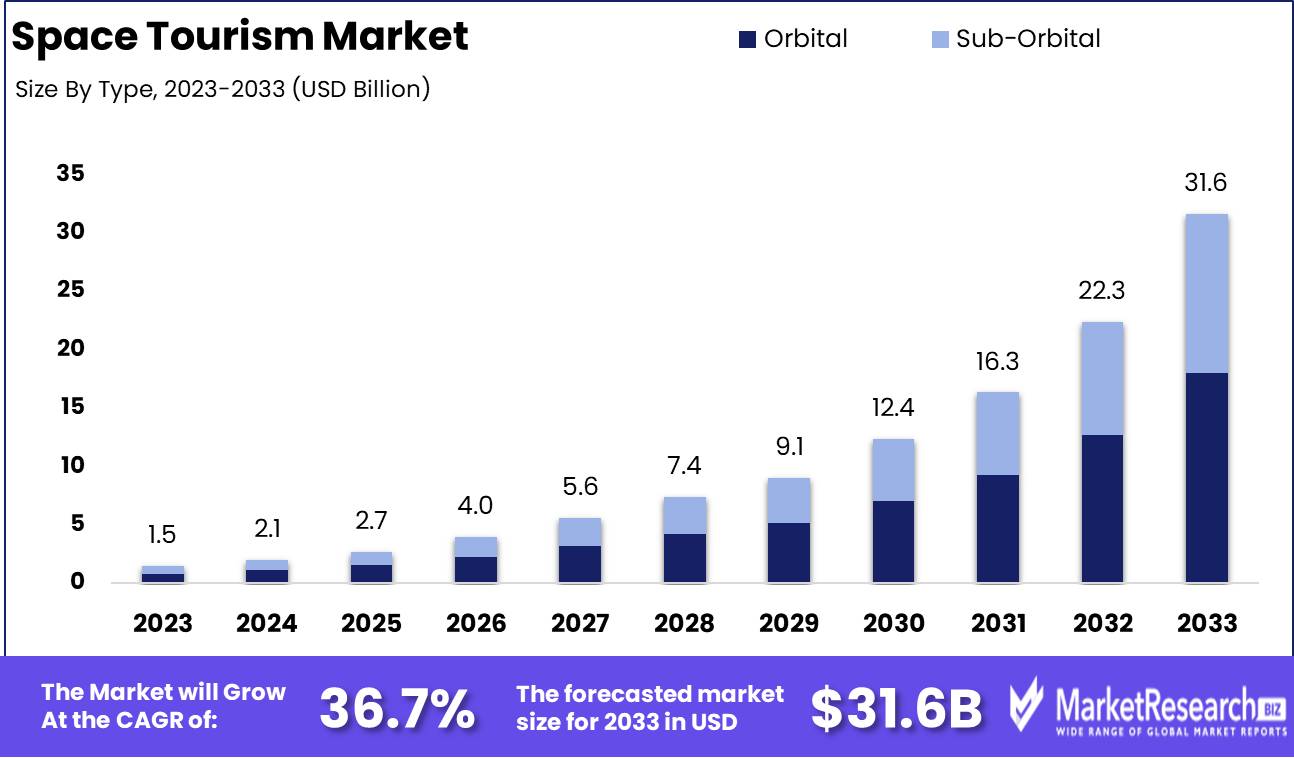
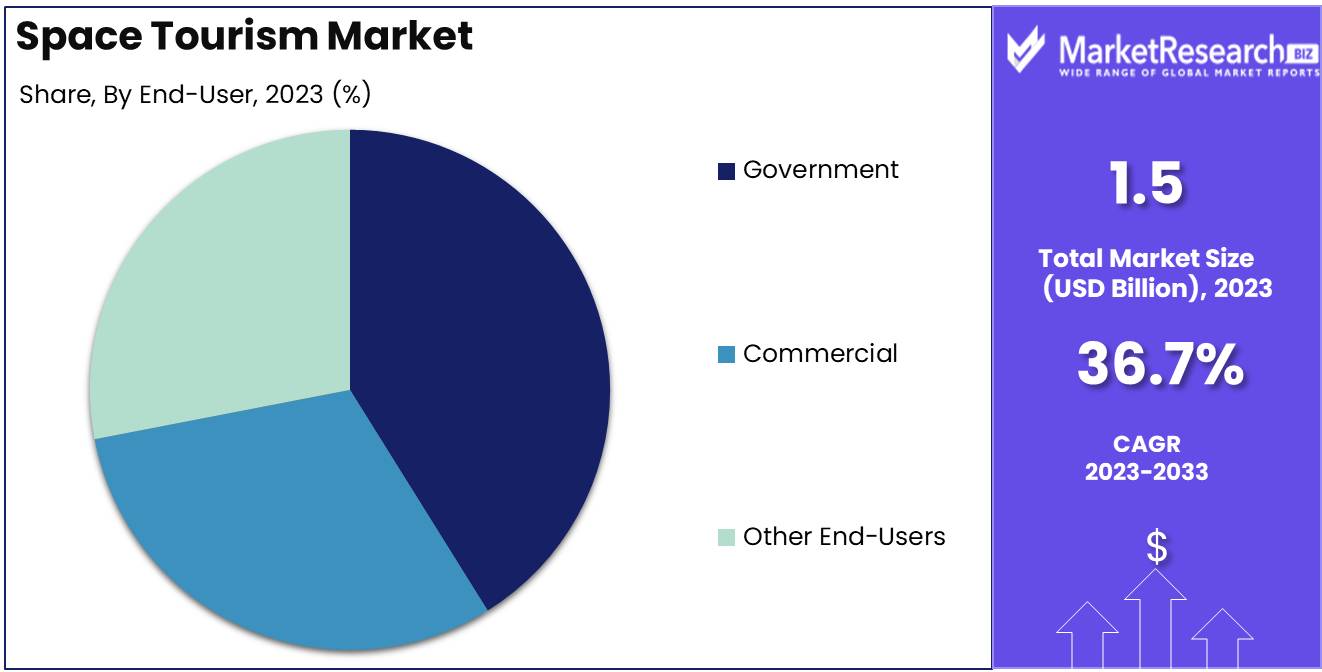
The Space Tourism Market was valued at USD 1.5 billion in 2023. It is expected to reach USD 31.6 billion by 2033, with a CAGR of 36.7% during the forecast period from 2024 to 2033.
The Space Tourism Market refers to the commercial sector offering travel experiences beyond Earth's atmosphere for private individuals and researchers. This emerging industry encompasses suborbital, orbital, and lunar tourism, facilitated by advancements in aerospace technology and the growing interest in space exploration.
The space tourism market is poised for substantial growth as it taps into the increasing global demand for luxury experiences, driven by affluent consumers seeking unique and exclusive adventures. The desire for extraordinary travel, coupled with advancements in space technology, positions this market at the forefront of innovation and high-net-worth consumer interest. The emergence of private companies like SpaceX, Blue Origin, and Virgin Galactic underscores the feasibility of commercial space travel, as they continue to develop and test advanced spacecraft designed to offer safe and memorable journeys beyond Earth's atmosphere.
However, the high cost of space travel remains a significant barrier to widespread adoption, limiting the market to a niche segment of ultra-wealthy individuals. Despite this, ongoing investments in technology are expected to drive down costs over time, potentially broadening the market's reach.
Moreover, potential collaborations with research institutions and government bodies could provide additional revenue streams and technological advancements. These partnerships are likely to play a crucial role in fostering innovation and reducing operational costs, thereby enhancing the market's scalability. As such, while the current market is characterized by exclusivity and high entry barriers, the long-term outlook is optimistic, with the space tourism industry positioned to evolve from a luxury niche into a more accessible frontier, particularly as cost-reduction strategies and collaborative efforts mature. The interplay between luxury demand, technological advancements, and strategic partnerships will be pivotal in shaping the future trajectory of the space tourism market.
Key Takeaways
- Market Growth: The Space Tourism Market was valued at USD 1.5 billion in 2023. It is expected to reach USD 31.6 billion by 2033, with a CAGR of 36.7% during the forecast period from 2024 to 2033.
- By Type: Orbital space tourism dominated the Space Tourism Market segment.
- By End-User: The Government sector dominated the expanding Space Tourism Market.
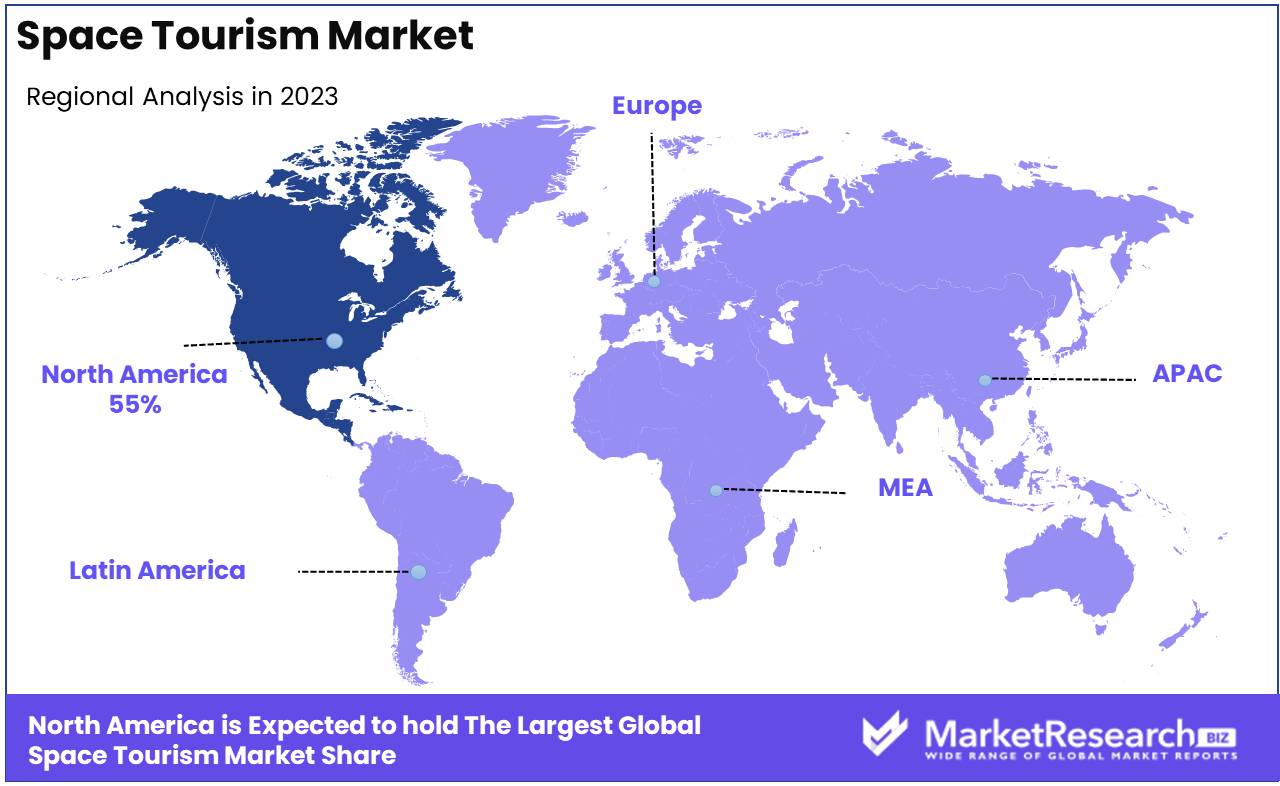
- Regional Dominance: North America dominates the space tourism market, holding a 55% largest share.
- Growth Opportunity: The global space tourism market is set for robust growth, driven by rising adventure travel demand and technological advancements, making space travel more accessible and appealing to broader audiences.
Driving factors
Growing Appeal Among Adventure Travelers Driving Market Demand
The increasing inclination of adventure travelers towards unique and once-in-a-lifetime experiences significantly contributes to the growth of the space tourism market. The modern traveler's desire to explore beyond traditional destinations has created a new niche market focused on space tourism. This demographic, typically characterized by high disposable income and a preference for exclusive experiences, sees space travel as the ultimate adventure. The adventurous nature of these travelers aligns perfectly with the concept of space tourism, driving substantial interest and investment in the sector. As this trend continues, the market is expected to see a steady influx of customers eager to participate in the early stages of commercial space travel, thereby expanding the market base.
Rising Affordability Broadening Market Accessibility
The declining costs associated with space travel have made it increasingly affordable, opening the market to a broader audience. Historically, space travel was the domain of governments and the extremely wealthy, but recent advancements in technology and increased competition among space companies have led to significant reductions in the cost of spaceflights. \
For instance, companies like SpaceX and Blue Origin have developed reusable rockets, which have drastically reduced the cost per flight. As affordability increases, space tourism is becoming accessible to a larger segment of the population, including affluent individuals outside the ultra-wealthy category. This affordability is a critical driver of market growth, as it transforms space tourism from a niche luxury experience into a more mainstream, albeit still premium, option for adventure travelers.
The leadership of Major Space Companies Accelerating Market Development
The presence of leading space companies such as SpaceX, Blue Origin, and Virgin Galactic is a pivotal factor in the growth of the space tourism market. These companies are not only advancing the technology required for safe and reliable space travel but are also heavily investing in marketing and infrastructure to make space tourism a viable commercial endeavor. Their ongoing research, development, and successful launches have validated the feasibility of space tourism, boosting investor confidence and encouraging further market expansion. For example, Virgin Galactic's public listing and its focus on suborbital space flights have drawn significant media attention, increasing public awareness and interest in space tourism. The leadership of these companies is essential for overcoming the technical and regulatory challenges associated with space tourism, thus paving the way for sustained market growth.
Restraining Factors
Regulatory Hurdles: Constraints on Market Expansion
Regulatory hurdles represent a significant barrier to the growth of the space tourism market. The stringent regulatory environment is driven by concerns over safety, liability, and the environmental impact of space travel. As governments and international bodies seek to establish comprehensive frameworks, they inadvertently slow market momentum. For instance, the Federal Aviation Administration (FAA) in the United States imposes rigorous safety standards and licensing requirements for commercial spaceflights. This regulatory framework aims to ensure passenger safety but also contributes to higher operational costs and delays in market entry.
The complexity and variability of regulations across different jurisdictions further complicate the landscape. Companies seeking to operate internationally must navigate a patchwork of regulatory requirements, which can result in increased administrative overhead and extended timelines for securing approvals. According to a report by the Space Data Association, regulatory constraints are one of the top three challenges cited by space tourism companies, with 68% of industry stakeholders indicating that regulatory issues impact their strategic planning and investment decisions.
Limited Infrastructure: Bottlenecks to Growth
Limited infrastructure constitutes another critical impediment to expanding the space tourism market. The current infrastructure for space travel is primarily concentrated around a few specialized launch sites and spaceports, which are insufficient to meet the anticipated demand for commercial spaceflights. Existing facilities, such as the Kennedy Space Center and Spaceport America, are equipped for a limited number of launches and are constrained by capacity and logistical challenges.
Developing new spaceports and supporting infrastructure is capital-intensive and requires substantial investment. For instance, the cost of building a new spaceport is estimated to exceed $100 million, according to the Space Foundation. This high capital expenditure, combined with the lengthy construction timelines, delays the establishment of a robust infrastructure network needed to support widespread space tourism.
Moreover, the infrastructure limitations extend to ground support services, including transportation to and from spaceports, accommodations, and training facilities. As the space tourism market matures, the need for comprehensive infrastructure that supports the entire customer journey from pre-flight training to post-flight recovery becomes increasingly critical. The lack of such infrastructure can constrain the market's ability to scale and attract a broader consumer base.
By Type Analysis
In 2023, Orbital space tourism dominated the Space Tourism Market segment.
In 2023, Orbital Space Tourism held a dominant market position in the By Type segment of the Space Tourism Market. The orbital segment, characterized by its extended space flights that reach and remain in orbit around Earth, accounted for the largest market share due to high demand among ultra-high-net-worth individuals seeking unique, extended experiences in space. This segment’s market dominance can be attributed to the technological advancements and significant investments made by leading space tourism companies such as SpaceX and Axiom Space, which have successfully executed multiple orbital missions. Additionally, the higher ticket prices associated with orbital flights, alongside the exclusivity and prestige of such experiences, have further bolstered revenue generation within this segment.
Conversely, the Sub-Orbital segment, involving shorter flights that briefly reach the edge of space without achieving orbit, also witnessed substantial growth in 2023. Companies like Blue Origin and Virgin Galactic drove this segment by offering relatively more affordable and accessible experiences. Despite its lower market share compared to the orbital segment, sub-orbital tourism is expected to expand rapidly, driven by increasing consumer interest and the entry of new market players aiming to democratize space travel.
By End-User Analysis
In 2023, The Government sector dominated the expanding Space Tourism Market.
In 2023, The Government Sector held a dominant market position in the Space Tourism Market's By End-User segment. The Government's significant investments in space exploration and tourism infrastructure were instrumental in driving this leadership. The sector capitalized on the growing interest in space tourism as a strategic avenue to boost national prestige and advance technological capabilities. By developing partnerships with private companies and fostering innovation through research and development, the Government sector established itself as a key player. Additionally, regulatory support and funding for space tourism projects provided a robust foundation for market growth, solidifying its dominance in this segment.
In contrast, the Commercial sector has shown rapid growth and is expected to play an increasingly vital role. The influx of private enterprises into the space tourism market, driven by high-net-worth individuals and corporations, has created a competitive landscape. Technological advancements and decreasing costs of space travel have made commercial space tourism more accessible, spurring demand in this segment. As competition intensifies, the commercial sector is poised to capture a significant market share.
Other end users, such as educational and research institutions, have also contributed to the market, albeit on a smaller scale. These organizations have leveraged space tourism for educational purposes and research, contributing to advancements in space science. Although their market share remains limited, their role is crucial in expanding the applications of space tourism beyond leisure, fostering innovation, and supporting the overall growth of the industry.
Key Market Segments
By Type
- Orbital
- Sub-Orbital
By End-User
- Government
- Commercial
- Other End-Users
Growth Opportunity
Growing Interest in Adventure Travel
The global space tourism market is poised for significant growth, driven by a rising consumer appetite for unique and extreme experiences. The increasing interest in adventure travel is a key factor fueling demand in this nascent industry. According to industry reports, adventure tourism is expected to grow at a CAGR of 16% from 2023 to 2030, with a notable portion of this growth attributed to the affluent segment seeking out-of-this-world experiences. Space tourism, offering an unparalleled adventure, is perfectly positioned to capitalize on this trend. This growing desire for adventure and exploration is likely to translate into higher demand for suborbital and orbital spaceflights, further propelling market growth.
Technological Advancements
Technological advancements are another critical driver of the space tourism market. The rapid development of reusable rockets and spacecraft, coupled with advancements in astronaut training and safety protocols, is making space travel more accessible and cost-effective. Companies like SpaceX and Blue Origin have successfully demonstrated the feasibility of commercial spaceflights, lowering the barrier to entry for other players in the market. By 2024, these technological strides are expected to significantly reduce the cost per flight, making space tourism more appealing to a broader consumer base.
Latest Trends
Establishment of Spaceports and Launch Facilities
The year is expected to witness significant advancements in the establishment of spaceports and launch facilities, which are critical infrastructure components for the burgeoning space tourism industry. Governments and private entities are likely to invest heavily in the development and enhancement of these facilities to accommodate the increasing demand for commercial space travel. The strategic positioning of spaceports in geographically advantageous locations will play a pivotal role in reducing operational costs and enhancing accessibility. This trend is anticipated to drive further investment and regulatory support, creating a more robust ecosystem for space tourism.
Advancements in Spacecraft Technology
Advancements in spacecraft technology will be a defining trend for the space tourism market. Innovations in propulsion systems, reusable rockets, and spacecraft design are expected to make space travel safer, more efficient, and cost-effective. These technological improvements are crucial for expanding the market beyond high-net-worth individuals to a broader demographic. The integration of cutting-edge materials and automation technologies will likely reduce the risk associated with space travel, thereby enhancing consumer confidence.
Furthermore, collaborations between established aerospace companies and emerging space tech firms are expected to accelerate the pace of innovation, leading to more frequent and affordable space tourism offerings.
Regional Analysis
North America dominates the space tourism market, holding a 55% largest share.
The space tourism market exhibits distinct characteristics across various regions, with North America emerging as the dominant force, accounting for approximately 55% of the global market share. This dominance is primarily attributed to the presence of key players such as SpaceX, Blue Origin, and Virgin Galactic, coupled with substantial government support and private investments. The U.S. government's commitment to advancing space technology and the robust infrastructure supporting space missions further bolster North America's leading position.
In Europe, the market is growing steadily, driven by advancements in space technology and collaborations between agencies like the European Space Agency (ESA) and private entities. Europe accounts for around 25% of the global market, with a strong focus on sustainable space tourism solutions.
The Asia-Pacific region is witnessing rapid growth, supported by increased government investments in space exploration, particularly in countries like China, Japan, and India. The region contributes approximately 15% to the global market, with significant potential for expansion as these countries ramp up their space tourism initiatives.
In contrast, the Middle East & Africa, and Latin America hold smaller shares in the space tourism market, with each region contributing roughly 3% and 2%, respectively. However, these regions are expected to grow as emerging markets, driven by increased interest and investments in space technology and tourism infrastructure.
Key Regions and Countries
North America
- The US
- Canada
- Rest of North America
Europe
- Germany
- France
- The UK
- Spain
- Netherlands
- Russia
- Italy
- Rest of Europe
Asia-Pacific
- China
- Japan
- Singapore
- Thailand
- South Korea
- Vietnam
- India
- New Zealand
- Rest of Asia Pacific
Latin America
- Mexico
- Brazil
- Rest of Latin America
Middle East & Africa
- Saudi Arabia
- South Africa
- UAE
- Rest of the Middle East & Africa
Key Players Analysis
The global space tourism market is poised for significant growth, driven by advancements in technology, increased interest from affluent consumers, and the growing number of key players entering the market. Among the leading companies, Blue Origin, Virgin Galactic, and SpaceX remain at the forefront, each with distinct strategies and technological capabilities that position them as pivotal players in the commercialization of space travel.
Blue Origin continues to make strides with its suborbital spaceflight offerings, targeting high-net-worth individuals. The company's focus on reusable rocket technology not only reduces costs but also enhances sustainability, a critical factor as the industry matures.
Virgin Galactic remains a key player in suborbital tourism, capitalizing on its early mover advantage and strong brand presence. The company’s strategic partnerships and focus on providing a premium spaceflight experience are expected to drive customer acquisition in the luxury segment.
SpaceX is leading in orbital tourism, leveraging its Falcon 9 and Starship vehicles. The company's ability to scale operations and its partnerships with entities like NASA give it a significant competitive edge in the market. SpaceX’s plans to expand into lunar tourism further solidify its leadership position.
Companies like Airbus Group SE and Boeing are also contributing to the industry, mainly through their technological expertise and strategic collaborations, which are expected to drive innovation and reduce costs.
Emerging players, including Axiom Space and Space Perspective, are introducing novel concepts, such as space habitats and stratospheric balloon flights, respectively, which are likely to diversify the market and attract new customer segments.
In conclusion, the global space tourism market will be characterized by fierce competition, technological innovation, and increasing consumer interest, with key players driving the industry's evolution.
Market Key Players
- Blue Origin
- Virgin Galactic
- SpaceX
- Airbus Group SE
- Boeing
- ZERO-G
- Axiom Space
- Bigelow Aerospace
- Orion Span
- Space Adventures
- Space Perspective
- World View Enterprises
- Zero2Infinity
- Other Key Players
Recent Development
- In August 2024, Blue Origin, the space company founded by Jeff Bezos, resumed its space tourist flights after a nearly two-year hiatus. This followed a successful series of safety tests, restoring confidence in its New Shepard spacecraft, which takes tourists to the edge of space for a brief period of weightlessness.
- In June 2023, Virgin Galactic officially commenced its commercial space tourism service, with its first flight between June 27 and June 30, 2023. This marked a significant milestone for the company as it transitioned from test flights to regular commercial operations. The second tourist spaceflight, "Galactic 02," was scheduled for early August 2023, with plans to conduct monthly flights thereafter.
- In February 2024, Virgin Galactic resumed its commercial spaceflights 2024, following a series of successful test flights. The company is expanding its offerings to include more frequent suborbital flights, catering to high-net-worth individuals seeking the unique experience of space travel. This move reinforces Virgin Galactic's position as a leader in the space tourism market.
Report Scope
Report Features Description Market Value (2023) USD 1.5 Billion Forecast Revenue (2033) USD 31.6 Billion CAGR (2024-2032) 36.7% Base Year for Estimation 2023 Historic Period 2016-2023 Forecast Period 2024-2033 Report Coverage Revenue Forecast, Market Dynamics, COVID-19 Impact, Competitive Landscape, Recent Developments Segments Covered By Type (Orbital, Sub-Orbital), By End-User (Government, Commercial, Other End-Users) Regional Analysis North America - The US, Canada, Rest of North America, Europe - Germany, France, The UK, Spain, Italy, Russia, Netherlands, Rest of Europe, Asia-Pacific - China, Japan, South Korea, India, New Zealand, Singapore, Thailand, Vietnam, Rest of Asia Pacific, Latin America - Brazil, Mexico, Rest of Latin America, Middle East & Africa - South Africa, Saudi Arabia, UAE, Rest of Middle East & Africa Competitive Landscape Blue Origin, Virgin Galactic, SpaceX, Airbus Group SE, Boeing, ZERO-G, Axiom Space, Bigelow Aerospace, Orion Span, Space Adventures, Space Perspective, World View Enterprises, Zero2Infinity, Other Key Players Customization Scope Customization for segments, region/country-level will be provided. Moreover, additional customization can be done based on the requirements. Purchase Options We have three licenses to opt for Single User License, Multi-User License (Up to 5 Users), Corporate Use License (Unlimited User and Printable PDF) -
- 1. Executive Summary
- 1.1. Definition
- 1.2. Taxonomy
- 1.3. Research Scope
- 1.4. Key Analysis
- 1.5. Key Findings by Major Segments
- 1.6. Top strategies by Major Players
- 2. Global Space Tourism Market Overview
- 2.1. Space Tourism Market Dynamics
- 2.1.1. Drivers
- 2.1.2. Opportunities
- 2.1.3. Restraints
- 2.1.4. Challenges
- 2.2. Macro-economic Factors
- 2.3. Regulatory Framework
- 2.4. Market Investment Feasibility Index
- 2.5. PEST Analysis
- 2.6. PORTER’S Five Force Analysis
- 2.7. Drivers & Restraints Impact Analysis
- 2.8. Industry Chain Analysis
- 2.9. Cost Structure Analysis
- 2.10. Marketing Strategy
- 2.11. Russia-Ukraine War Impact Analysis
- 2.12. Opportunity Map Analysis
- 2.13. Market Competition Scenario Analysis
- 2.14. Product Life Cycle Analysis
- 2.15. Opportunity Orbits
- 2.16. Manufacturer Intensity Map
- 2.17. Major Companies sales by Value & Volume
- 2.1. Space Tourism Market Dynamics
- 3. Global Space Tourism Market Analysis, Opportunity and Forecast, 2016-2032
- 3.1. Global Space Tourism Market Analysis, 2016-2021
- 3.2. Global Space Tourism Market Opportunity and Forecast, 2023-2032
- 3.3. Global Space Tourism Market Analysis, Opportunity and Forecast, By Type, 2016-2032
- 3.3.1. Global Space Tourism Market Analysis by Type: Introduction
- 3.3.2. Market Size Absolute $ Opportunity Analysis and Forecast, By Type, 2016-2032
- 3.3.3. Orbital
- 3.3.4. Sub-Orbital
- 3.4. Global Space Tourism Market Analysis, Opportunity and Forecast, By End-User, 2016-2032
- 3.4.1. Global Space Tourism Market Analysis by End-User: Introduction
- 3.4.2. Market Size Absolute $ Opportunity Analysis and Forecast, By End-User, 2016-2032
- 3.4.3. Government
- 3.4.4. Commercial
- 3.4.5. Other End-Users
- 4. North America Space Tourism Market Analysis, Opportunity and Forecast, 2016-2032
- 4.1. North America Space Tourism Market Analysis, 2016-2021
- 4.2. North America Space Tourism Market Opportunity and Forecast, 2023-2032
- 4.3. North America Space Tourism Market Analysis, Opportunity and Forecast, By Type, 2016-2032
- 4.3.1. North America Space Tourism Market Analysis by Type: Introduction
- 4.3.2. Market Size Absolute $ Opportunity Analysis and Forecast, By Type, 2016-2032
- 4.3.3. Orbital
- 4.3.4. Sub-Orbital
- 4.4. North America Space Tourism Market Analysis, Opportunity and Forecast, By End-User, 2016-2032
- 4.4.1. North America Space Tourism Market Analysis by End-User: Introduction
- 4.4.2. Market Size Absolute $ Opportunity Analysis and Forecast, By End-User, 2016-2032
- 4.4.3. Government
- 4.4.4. Commercial
- 4.4.5. Other End-Users
- 4.5. North America Space Tourism Market Analysis, Opportunity and Forecast, By Country , 2016-2032
- 4.5.1. North America Space Tourism Market Analysis by Country : Introduction
- 4.5.2. Market Size Absolute $ Opportunity Analysis and Forecast, Country , 2016-2032
- 4.5.2.1. The US
- 4.5.2.2. Canada
- 4.5.2.3. Mexico
- 5. Western Europe Space Tourism Market Analysis, Opportunity and Forecast, 2016-2032
- 5.1. Western Europe Space Tourism Market Analysis, 2016-2021
- 5.2. Western Europe Space Tourism Market Opportunity and Forecast, 2023-2032
- 5.3. Western Europe Space Tourism Market Analysis, Opportunity and Forecast, By Type, 2016-2032
- 5.3.1. Western Europe Space Tourism Market Analysis by Type: Introduction
- 5.3.2. Market Size Absolute $ Opportunity Analysis and Forecast, By Type, 2016-2032
- 5.3.3. Orbital
- 5.3.4. Sub-Orbital
- 5.4. Western Europe Space Tourism Market Analysis, Opportunity and Forecast, By End-User, 2016-2032
- 5.4.1. Western Europe Space Tourism Market Analysis by End-User: Introduction
- 5.4.2. Market Size Absolute $ Opportunity Analysis and Forecast, By End-User, 2016-2032
- 5.4.3. Government
- 5.4.4. Commercial
- 5.4.5. Other End-Users
- 5.5. Western Europe Space Tourism Market Analysis, Opportunity and Forecast, By Country , 2016-2032
- 5.5.1. Western Europe Space Tourism Market Analysis by Country : Introduction
- 5.5.2. Market Size Absolute $ Opportunity Analysis and Forecast, Country , 2016-2032
- 5.5.2.1. Germany
- 5.5.2.2. France
- 5.5.2.3. The UK
- 5.5.2.4. Spain
- 5.5.2.5. Italy
- 5.5.2.6. Portugal
- 5.5.2.7. Ireland
- 5.5.2.8. Austria
- 5.5.2.9. Switzerland
- 5.5.2.10. Benelux
- 5.5.2.11. Nordic
- 5.5.2.12. Rest of Western Europe
- 6. Eastern Europe Space Tourism Market Analysis, Opportunity and Forecast, 2016-2032
- 6.1. Eastern Europe Space Tourism Market Analysis, 2016-2021
- 6.2. Eastern Europe Space Tourism Market Opportunity and Forecast, 2023-2032
- 6.3. Eastern Europe Space Tourism Market Analysis, Opportunity and Forecast, By Type, 2016-2032
- 6.3.1. Eastern Europe Space Tourism Market Analysis by Type: Introduction
- 6.3.2. Market Size Absolute $ Opportunity Analysis and Forecast, By Type, 2016-2032
- 6.3.3. Orbital
- 6.3.4. Sub-Orbital
- 6.4. Eastern Europe Space Tourism Market Analysis, Opportunity and Forecast, By End-User, 2016-2032
- 6.4.1. Eastern Europe Space Tourism Market Analysis by End-User: Introduction
- 6.4.2. Market Size Absolute $ Opportunity Analysis and Forecast, By End-User, 2016-2032
- 6.4.3. Government
- 6.4.4. Commercial
- 6.4.5. Other End-Users
- 6.5. Eastern Europe Space Tourism Market Analysis, Opportunity and Forecast, By Country , 2016-2032
- 6.5.1. Eastern Europe Space Tourism Market Analysis by Country : Introduction
- 6.5.2. Market Size Absolute $ Opportunity Analysis and Forecast, Country , 2016-2032
- 6.5.2.1. Russia
- 6.5.2.2. Poland
- 6.5.2.3. The Czech Republic
- 6.5.2.4. Greece
- 6.5.2.5. Rest of Eastern Europe
- 7. APAC Space Tourism Market Analysis, Opportunity and Forecast, 2016-2032
- 7.1. APAC Space Tourism Market Analysis, 2016-2021
- 7.2. APAC Space Tourism Market Opportunity and Forecast, 2023-2032
- 7.3. APAC Space Tourism Market Analysis, Opportunity and Forecast, By Type, 2016-2032
- 7.3.1. APAC Space Tourism Market Analysis by Type: Introduction
- 7.3.2. Market Size Absolute $ Opportunity Analysis and Forecast, By Type, 2016-2032
- 7.3.3. Orbital
- 7.3.4. Sub-Orbital
- 7.4. APAC Space Tourism Market Analysis, Opportunity and Forecast, By End-User, 2016-2032
- 7.4.1. APAC Space Tourism Market Analysis by End-User: Introduction
- 7.4.2. Market Size Absolute $ Opportunity Analysis and Forecast, By End-User, 2016-2032
- 7.4.3. Government
- 7.4.4. Commercial
- 7.4.5. Other End-Users
- 7.5. APAC Space Tourism Market Analysis, Opportunity and Forecast, By Country , 2016-2032
- 7.5.1. APAC Space Tourism Market Analysis by Country : Introduction
- 7.5.2. Market Size Absolute $ Opportunity Analysis and Forecast, Country , 2016-2032
- 7.5.2.1. China
- 7.5.2.2. Japan
- 7.5.2.3. South Korea
- 7.5.2.4. India
- 7.5.2.5. Australia & New Zeland
- 7.5.2.6. Indonesia
- 7.5.2.7. Malaysia
- 7.5.2.8. Philippines
- 7.5.2.9. Singapore
- 7.5.2.10. Thailand
- 7.5.2.11. Vietnam
- 7.5.2.12. Rest of APAC
- 8. Latin America Space Tourism Market Analysis, Opportunity and Forecast, 2016-2032
- 8.1. Latin America Space Tourism Market Analysis, 2016-2021
- 8.2. Latin America Space Tourism Market Opportunity and Forecast, 2023-2032
- 8.3. Latin America Space Tourism Market Analysis, Opportunity and Forecast, By Type, 2016-2032
- 8.3.1. Latin America Space Tourism Market Analysis by Type: Introduction
- 8.3.2. Market Size Absolute $ Opportunity Analysis and Forecast, By Type, 2016-2032
- 8.3.3. Orbital
- 8.3.4. Sub-Orbital
- 8.4. Latin America Space Tourism Market Analysis, Opportunity and Forecast, By End-User, 2016-2032
- 8.4.1. Latin America Space Tourism Market Analysis by End-User: Introduction
- 8.4.2. Market Size Absolute $ Opportunity Analysis and Forecast, By End-User, 2016-2032
- 8.4.3. Government
- 8.4.4. Commercial
- 8.4.5. Other End-Users
- 8.5. Latin America Space Tourism Market Analysis, Opportunity and Forecast, By Country , 2016-2032
- 8.5.1. Latin America Space Tourism Market Analysis by Country : Introduction
- 8.5.2. Market Size Absolute $ Opportunity Analysis and Forecast, Country , 2016-2032
- 8.5.2.1. Brazil
- 8.5.2.2. Colombia
- 8.5.2.3. Chile
- 8.5.2.4. Argentina
- 8.5.2.5. Costa Rica
- 8.5.2.6. Rest of Latin America
- 9. Middle East & Africa Space Tourism Market Analysis, Opportunity and Forecast, 2016-2032
- 9.1. Middle East & Africa Space Tourism Market Analysis, 2016-2021
- 9.2. Middle East & Africa Space Tourism Market Opportunity and Forecast, 2023-2032
- 9.3. Middle East & Africa Space Tourism Market Analysis, Opportunity and Forecast, By Type, 2016-2032
- 9.3.1. Middle East & Africa Space Tourism Market Analysis by Type: Introduction
- 9.3.2. Market Size Absolute $ Opportunity Analysis and Forecast, By Type, 2016-2032
- 9.3.3. Orbital
- 9.3.4. Sub-Orbital
- 9.4. Middle East & Africa Space Tourism Market Analysis, Opportunity and Forecast, By End-User, 2016-2032
- 9.4.1. Middle East & Africa Space Tourism Market Analysis by End-User: Introduction
- 9.4.2. Market Size Absolute $ Opportunity Analysis and Forecast, By End-User, 2016-2032
- 9.4.3. Government
- 9.4.4. Commercial
- 9.4.5. Other End-Users
- 9.5. Middle East & Africa Space Tourism Market Analysis, Opportunity and Forecast, By Country , 2016-2032
- 9.5.1. Middle East & Africa Space Tourism Market Analysis by Country : Introduction
- 9.5.2. Market Size Absolute $ Opportunity Analysis and Forecast, Country , 2016-2032
- 9.5.2.1. Algeria
- 9.5.2.2. Egypt
- 9.5.2.3. Israel
- 9.5.2.4. Kuwait
- 9.5.2.5. Nigeria
- 9.5.2.6. Saudi Arabia
- 9.5.2.7. South Africa
- 9.5.2.8. Turkey
- 9.5.2.9. The UAE
- 9.5.2.10. Rest of MEA
- 10. Global Space Tourism Market Analysis, Opportunity and Forecast, By Region , 2016-2032
- 10.1. Global Space Tourism Market Analysis by Region : Introduction
- 10.2. Market Size Absolute $ Opportunity Analysis and Forecast, By Region , 2016-2032
- 10.2.1. North America
- 10.2.2. Western Europe
- 10.2.3. Eastern Europe
- 10.2.4. APAC
- 10.2.5. Latin America
- 10.2.6. Middle East & Africa
- 11. Global Space Tourism Market Competitive Landscape, Market Share Analysis, and Company Profiles
- 11.1. Market Share Analysis
- 11.2. Company Profiles
- 11.3. Blue Origin
- 11.3.1. Company Overview
- 11.3.2. Financial Highlights
- 11.3.3. Product Portfolio
- 11.3.4. SWOT Analysis
- 11.3.5. Key Strategies and Developments
- 11.4. Virgin Galactic
- 11.4.1. Company Overview
- 11.4.2. Financial Highlights
- 11.4.3. Product Portfolio
- 11.4.4. SWOT Analysis
- 11.4.5. Key Strategies and Developments
- 11.5. SpaceX
- 11.5.1. Company Overview
- 11.5.2. Financial Highlights
- 11.5.3. Product Portfolio
- 11.5.4. SWOT Analysis
- 11.5.5. Key Strategies and Developments
- 11.6. Airbus Group SE
- 11.6.1. Company Overview
- 11.6.2. Financial Highlights
- 11.6.3. Product Portfolio
- 11.6.4. SWOT Analysis
- 11.6.5. Key Strategies and Developments
- 11.7. Boeing
- 11.7.1. Company Overview
- 11.7.2. Financial Highlights
- 11.7.3. Product Portfolio
- 11.7.4. SWOT Analysis
- 11.7.5. Key Strategies and Developments
- 11.8. ZERO-G
- 11.8.1. Company Overview
- 11.8.2. Financial Highlights
- 11.8.3. Product Portfolio
- 11.8.4. SWOT Analysis
- 11.8.5. Key Strategies and Developments
- 11.9. Axiom Space
- 11.9.1. Company Overview
- 11.9.2. Financial Highlights
- 11.9.3. Product Portfolio
- 11.9.4. SWOT Analysis
- 11.9.5. Key Strategies and Developments
- 11.10. Bigelow Aerospace
- 11.10.1. Company Overview
- 11.10.2. Financial Highlights
- 11.10.3. Product Portfolio
- 11.10.4. SWOT Analysis
- 11.10.5. Key Strategies and Developments
- 11.11. Orion Span
- 11.11.1. Company Overview
- 11.11.2. Financial Highlights
- 11.11.3. Product Portfolio
- 11.11.4. SWOT Analysis
- 11.11.5. Key Strategies and Developments
- 11.12. Space Adventures
- 11.12.1. Company Overview
- 11.12.2. Financial Highlights
- 11.12.3. Product Portfolio
- 11.12.4. SWOT Analysis
- 11.12.5. Key Strategies and Developments
- 11.13.1. Company Overview
- 11.13.2. Financial Highlights
- 11.13.3. Product Portfolio
- 11.13.4. SWOT Analysis
- 11.13.5. Key Strategies and Developments
- 11.14. Space Perspective
- 11.14.1. Company Overview
- 11.14.2. Financial Highlights
- 11.14.3. Product Portfolio
- 11.14.4. SWOT Analysis
- 11.14.5. Key Strategies and Developments
- 11.15. Zero2Infinity
- 11.15.1. Company Overview
- 11.15.2. Financial Highlights
- 11.15.3. Product Portfolio
- 11.15.4. SWOT Analysis
- 11.15.5. Key Strategies and Developments
- 11.16. Other Key Players
- 11.16.1. Company Overview
- 11.16.2. Financial Highlights
- 11.16.3. Product Portfolio
- 11.16.4. SWOT Analysis
- 11.16.5. Key Strategies and Developments
- 12. Assumptions and Acronyms
- 13. Research Methodology
- 14. Contact
"
- List of Figures
- "
- Figure 1: Global Space Tourism Market Revenue (US$ Mn) Market Share by Type in 2022
- Figure 2: Global Space Tourism Market Market Attractiveness Analysis by Type, 2016-2032
- Figure 3: Global Space Tourism Market Revenue (US$ Mn) Market Share by End-Userin 2022
- Figure 4: Global Space Tourism Market Market Attractiveness Analysis by End-User, 2016-2032
- Figure 5: Global Space Tourism Market Revenue (US$ Mn) Market Share by Region in 2022
- Figure 6: Global Space Tourism Market Market Attractiveness Analysis by Region, 2016-2032
- Figure 7: Global Space Tourism Market Market Revenue (US$ Mn) (2016-2032)
- Figure 8: Global Space Tourism Market Market Revenue (US$ Mn) Comparison by Region (2016-2032)
- Figure 9: Global Space Tourism Market Market Revenue (US$ Mn) Comparison by Type (2016-2032)
- Figure 10: Global Space Tourism Market Market Revenue (US$ Mn) Comparison by End-User (2016-2032)
- Figure 11: Global Space Tourism Market Market Y-o-Y Growth Rate Comparison by Region (2016-2032)
- Figure 12: Global Space Tourism Market Market Y-o-Y Growth Rate Comparison by Type (2016-2032)
- Figure 13: Global Space Tourism Market Market Y-o-Y Growth Rate Comparison by End-User (2016-2032)
- Figure 14: Global Space Tourism Market Market Share Comparison by Region (2016-2032)
- Figure 15: Global Space Tourism Market Market Share Comparison by Type (2016-2032)
- Figure 16: Global Space Tourism Market Market Share Comparison by End-User (2016-2032)
- Figure 17: North America Space Tourism Market Revenue (US$ Mn) Market Share by Typein 2022
- Figure 18: North America Space Tourism Market Market Attractiveness Analysis by Type, 2016-2032
- Figure 19: North America Space Tourism Market Revenue (US$ Mn) Market Share by End-Userin 2022
- Figure 20: North America Space Tourism Market Market Attractiveness Analysis by End-User, 2016-2032
- Figure 21: North America Space Tourism Market Revenue (US$ Mn) Market Share by Country in 2022
- Figure 22: North America Space Tourism Market Market Attractiveness Analysis by Country, 2016-2032
- Figure 23: North America Space Tourism Market Market Revenue (US$ Mn) (2016-2032)
- Figure 24: North America Space Tourism Market Market Revenue (US$ Mn) Comparison by Country (2016-2032)
- Figure 25: North America Space Tourism Market Market Revenue (US$ Mn) Comparison by Type (2016-2032)
- Figure 26: North America Space Tourism Market Market Revenue (US$ Mn) Comparison by End-User (2016-2032)
- Figure 27: North America Space Tourism Market Market Y-o-Y Growth Rate Comparison by Country (2016-2032)
- Figure 28: North America Space Tourism Market Market Y-o-Y Growth Rate Comparison by Type (2016-2032)
- Figure 29: North America Space Tourism Market Market Y-o-Y Growth Rate Comparison by End-User (2016-2032)
- Figure 30: North America Space Tourism Market Market Share Comparison by Country (2016-2032)
- Figure 31: North America Space Tourism Market Market Share Comparison by Type (2016-2032)
- Figure 32: North America Space Tourism Market Market Share Comparison by End-User (2016-2032)
- Figure 33: Western Europe Space Tourism Market Revenue (US$ Mn) Market Share by Typein 2022
- Figure 34: Western Europe Space Tourism Market Market Attractiveness Analysis by Type, 2016-2032
- Figure 35: Western Europe Space Tourism Market Revenue (US$ Mn) Market Share by End-Userin 2022
- Figure 36: Western Europe Space Tourism Market Market Attractiveness Analysis by End-User, 2016-2032
- Figure 37: Western Europe Space Tourism Market Revenue (US$ Mn) Market Share by Country in 2022
- Figure 38: Western Europe Space Tourism Market Market Attractiveness Analysis by Country, 2016-2032
- Figure 39: Western Europe Space Tourism Market Market Revenue (US$ Mn) (2016-2032)
- Figure 40: Western Europe Space Tourism Market Market Revenue (US$ Mn) Comparison by Country (2016-2032)
- Figure 41: Western Europe Space Tourism Market Market Revenue (US$ Mn) Comparison by Type (2016-2032)
- Figure 42: Western Europe Space Tourism Market Market Revenue (US$ Mn) Comparison by End-User (2016-2032)
- Figure 43: Western Europe Space Tourism Market Market Y-o-Y Growth Rate Comparison by Country (2016-2032)
- Figure 44: Western Europe Space Tourism Market Market Y-o-Y Growth Rate Comparison by Type (2016-2032)
- Figure 45: Western Europe Space Tourism Market Market Y-o-Y Growth Rate Comparison by End-User (2016-2032)
- Figure 46: Western Europe Space Tourism Market Market Share Comparison by Country (2016-2032)
- Figure 47: Western Europe Space Tourism Market Market Share Comparison by Type (2016-2032)
- Figure 48: Western Europe Space Tourism Market Market Share Comparison by End-User (2016-2032)
- Figure 49: Eastern Europe Space Tourism Market Revenue (US$ Mn) Market Share by Typein 2022
- Figure 50: Eastern Europe Space Tourism Market Market Attractiveness Analysis by Type, 2016-2032
- Figure 51: Eastern Europe Space Tourism Market Revenue (US$ Mn) Market Share by End-Userin 2022
- Figure 52: Eastern Europe Space Tourism Market Market Attractiveness Analysis by End-User, 2016-2032
- Figure 53: Eastern Europe Space Tourism Market Revenue (US$ Mn) Market Share by Country in 2022
- Figure 54: Eastern Europe Space Tourism Market Market Attractiveness Analysis by Country, 2016-2032
- Figure 55: Eastern Europe Space Tourism Market Market Revenue (US$ Mn) (2016-2032)
- Figure 56: Eastern Europe Space Tourism Market Market Revenue (US$ Mn) Comparison by Country (2016-2032)
- Figure 57: Eastern Europe Space Tourism Market Market Revenue (US$ Mn) Comparison by Type (2016-2032)
- Figure 58: Eastern Europe Space Tourism Market Market Revenue (US$ Mn) Comparison by End-User (2016-2032)
- Figure 59: Eastern Europe Space Tourism Market Market Y-o-Y Growth Rate Comparison by Country (2016-2032)
- Figure 60: Eastern Europe Space Tourism Market Market Y-o-Y Growth Rate Comparison by Type (2016-2032)
- Figure 61: Eastern Europe Space Tourism Market Market Y-o-Y Growth Rate Comparison by End-User (2016-2032)
- Figure 62: Eastern Europe Space Tourism Market Market Share Comparison by Country (2016-2032)
- Figure 63: Eastern Europe Space Tourism Market Market Share Comparison by Type (2016-2032)
- Figure 64: Eastern Europe Space Tourism Market Market Share Comparison by End-User (2016-2032)
- Figure 65: APAC Space Tourism Market Revenue (US$ Mn) Market Share by Typein 2022
- Figure 66: APAC Space Tourism Market Market Attractiveness Analysis by Type, 2016-2032
- Figure 67: APAC Space Tourism Market Revenue (US$ Mn) Market Share by End-Userin 2022
- Figure 68: APAC Space Tourism Market Market Attractiveness Analysis by End-User, 2016-2032
- Figure 69: APAC Space Tourism Market Revenue (US$ Mn) Market Share by Country in 2022
- Figure 70: APAC Space Tourism Market Market Attractiveness Analysis by Country, 2016-2032
- Figure 71: APAC Space Tourism Market Market Revenue (US$ Mn) (2016-2032)
- Figure 72: APAC Space Tourism Market Market Revenue (US$ Mn) Comparison by Country (2016-2032)
- Figure 73: APAC Space Tourism Market Market Revenue (US$ Mn) Comparison by Type (2016-2032)
- Figure 74: APAC Space Tourism Market Market Revenue (US$ Mn) Comparison by End-User (2016-2032)
- Figure 75: APAC Space Tourism Market Market Y-o-Y Growth Rate Comparison by Country (2016-2032)
- Figure 76: APAC Space Tourism Market Market Y-o-Y Growth Rate Comparison by Type (2016-2032)
- Figure 77: APAC Space Tourism Market Market Y-o-Y Growth Rate Comparison by End-User (2016-2032)
- Figure 78: APAC Space Tourism Market Market Share Comparison by Country (2016-2032)
- Figure 79: APAC Space Tourism Market Market Share Comparison by Type (2016-2032)
- Figure 80: APAC Space Tourism Market Market Share Comparison by End-User (2016-2032)
- Figure 81: Latin America Space Tourism Market Revenue (US$ Mn) Market Share by Typein 2022
- Figure 82: Latin America Space Tourism Market Market Attractiveness Analysis by Type, 2016-2032
- Figure 83: Latin America Space Tourism Market Revenue (US$ Mn) Market Share by End-Userin 2022
- Figure 84: Latin America Space Tourism Market Market Attractiveness Analysis by End-User, 2016-2032
- Figure 85: Latin America Space Tourism Market Revenue (US$ Mn) Market Share by Country in 2022
- Figure 86: Latin America Space Tourism Market Market Attractiveness Analysis by Country, 2016-2032
- Figure 87: Latin America Space Tourism Market Market Revenue (US$ Mn) (2016-2032)
- Figure 88: Latin America Space Tourism Market Market Revenue (US$ Mn) Comparison by Country (2016-2032)
- Figure 89: Latin America Space Tourism Market Market Revenue (US$ Mn) Comparison by Type (2016-2032)
- Figure 90: Latin America Space Tourism Market Market Revenue (US$ Mn) Comparison by End-User (2016-2032)
- Figure 91: Latin America Space Tourism Market Market Y-o-Y Growth Rate Comparison by Country (2016-2032)
- Figure 92: Latin America Space Tourism Market Market Y-o-Y Growth Rate Comparison by Type (2016-2032)
- Figure 93: Latin America Space Tourism Market Market Y-o-Y Growth Rate Comparison by End-User (2016-2032)
- Figure 94: Latin America Space Tourism Market Market Share Comparison by Country (2016-2032)
- Figure 95: Latin America Space Tourism Market Market Share Comparison by Type (2016-2032)
- Figure 96: Latin America Space Tourism Market Market Share Comparison by End-User (2016-2032)
- Figure 97: Middle East & Africa Space Tourism Market Revenue (US$ Mn) Market Share by Typein 2022
- Figure 98: Middle East & Africa Space Tourism Market Market Attractiveness Analysis by Type, 2016-2032
- Figure 99: Middle East & Africa Space Tourism Market Revenue (US$ Mn) Market Share by End-Userin 2022
- Figure 100: Middle East & Africa Space Tourism Market Market Attractiveness Analysis by End-User, 2016-2032
- Figure 101: Middle East & Africa Space Tourism Market Revenue (US$ Mn) Market Share by Country in 2022
- Figure 102: Middle East & Africa Space Tourism Market Market Attractiveness Analysis by Country, 2016-2032
- Figure 103: Middle East & Africa Space Tourism Market Market Revenue (US$ Mn) (2016-2032)
- Figure 104: Middle East & Africa Space Tourism Market Market Revenue (US$ Mn) Comparison by Country (2016-2032)
- Figure 105: Middle East & Africa Space Tourism Market Market Revenue (US$ Mn) Comparison by Type (2016-2032)
- Figure 106: Middle East & Africa Space Tourism Market Market Revenue (US$ Mn) Comparison by End-User (2016-2032)
- Figure 107: Middle East & Africa Space Tourism Market Market Y-o-Y Growth Rate Comparison by Country (2016-2032)
- Figure 108: Middle East & Africa Space Tourism Market Market Y-o-Y Growth Rate Comparison by Type (2016-2032)
- Figure 109: Middle East & Africa Space Tourism Market Market Y-o-Y Growth Rate Comparison by End-User (2016-2032)
- Figure 110: Middle East & Africa Space Tourism Market Market Share Comparison by Country (2016-2032)
- Figure 111: Middle East & Africa Space Tourism Market Market Share Comparison by Type (2016-2032)
- Figure 112: Middle East & Africa Space Tourism Market Market Share Comparison by End-User (2016-2032)
"
- List of Tables
- "
- Table 1: Global Space Tourism Market Market Comparison by Type (2016-2032)
- Table 2: Global Space Tourism Market Market Comparison by End-User (2016-2032)
- Table 3: Global Space Tourism Market Revenue (US$ Mn) Comparison by Region (2016-2032)
- Table 4: Global Space Tourism Market Market Revenue (US$ Mn) (2016-2032)
- Table 5: Global Space Tourism Market Market Revenue (US$ Mn) Comparison by Region (2016-2032)
- Table 6: Global Space Tourism Market Market Revenue (US$ Mn) Comparison by Type (2016-2032)
- Table 7: Global Space Tourism Market Market Revenue (US$ Mn) Comparison by End-User (2016-2032)
- Table 8: Global Space Tourism Market Market Y-o-Y Growth Rate Comparison by Region (2016-2032)
- Table 9: Global Space Tourism Market Market Y-o-Y Growth Rate Comparison by Type (2016-2032)
- Table 10: Global Space Tourism Market Market Y-o-Y Growth Rate Comparison by End-User (2016-2032)
- Table 11: Global Space Tourism Market Market Share Comparison by Region (2016-2032)
- Table 12: Global Space Tourism Market Market Share Comparison by Type (2016-2032)
- Table 13: Global Space Tourism Market Market Share Comparison by End-User (2016-2032)
- Table 14: North America Space Tourism Market Market Comparison by End-User (2016-2032)
- Table 15: North America Space Tourism Market Revenue (US$ Mn) Comparison by Country (2016-2032)
- Table 16: North America Space Tourism Market Market Revenue (US$ Mn) (2016-2032)
- Table 17: North America Space Tourism Market Market Revenue (US$ Mn) Comparison by Country (2016-2032)
- Table 18: North America Space Tourism Market Market Revenue (US$ Mn) Comparison by Type (2016-2032)
- Table 19: North America Space Tourism Market Market Revenue (US$ Mn) Comparison by End-User (2016-2032)
- Table 20: North America Space Tourism Market Market Y-o-Y Growth Rate Comparison by Country (2016-2032)
- Table 21: North America Space Tourism Market Market Y-o-Y Growth Rate Comparison by Type (2016-2032)
- Table 22: North America Space Tourism Market Market Y-o-Y Growth Rate Comparison by End-User (2016-2032)
- Table 23: North America Space Tourism Market Market Share Comparison by Country (2016-2032)
- Table 24: North America Space Tourism Market Market Share Comparison by Type (2016-2032)
- Table 25: North America Space Tourism Market Market Share Comparison by End-User (2016-2032)
- Table 26: Western Europe Space Tourism Market Market Comparison by Type (2016-2032)
- Table 27: Western Europe Space Tourism Market Market Comparison by End-User (2016-2032)
- Table 28: Western Europe Space Tourism Market Revenue (US$ Mn) Comparison by Country (2016-2032)
- Table 29: Western Europe Space Tourism Market Market Revenue (US$ Mn) (2016-2032)
- Table 30: Western Europe Space Tourism Market Market Revenue (US$ Mn) Comparison by Country (2016-2032)
- Table 31: Western Europe Space Tourism Market Market Revenue (US$ Mn) Comparison by Type (2016-2032)
- Table 32: Western Europe Space Tourism Market Market Revenue (US$ Mn) Comparison by End-User (2016-2032)
- Table 33: Western Europe Space Tourism Market Market Y-o-Y Growth Rate Comparison by Country (2016-2032)
- Table 34: Western Europe Space Tourism Market Market Y-o-Y Growth Rate Comparison by Type (2016-2032)
- Table 35: Western Europe Space Tourism Market Market Y-o-Y Growth Rate Comparison by End-User (2016-2032)
- Table 36: Western Europe Space Tourism Market Market Share Comparison by Country (2016-2032)
- Table 37: Western Europe Space Tourism Market Market Share Comparison by Type (2016-2032)
- Table 38: Western Europe Space Tourism Market Market Share Comparison by End-User (2016-2032)
- Table 39: Eastern Europe Space Tourism Market Market Comparison by Type (2016-2032)
- Table 40: Eastern Europe Space Tourism Market Market Comparison by End-User (2016-2032)
- Table 41: Eastern Europe Space Tourism Market Revenue (US$ Mn) Comparison by Country (2016-2032)
- Table 42: Eastern Europe Space Tourism Market Market Revenue (US$ Mn) (2016-2032)
- Table 43: Eastern Europe Space Tourism Market Market Revenue (US$ Mn) Comparison by Country (2016-2032)
- Table 44: Eastern Europe Space Tourism Market Market Revenue (US$ Mn) Comparison by Type (2016-2032)
- Table 45: Eastern Europe Space Tourism Market Market Revenue (US$ Mn) Comparison by End-User (2016-2032)
- Table 46: Eastern Europe Space Tourism Market Market Y-o-Y Growth Rate Comparison by Country (2016-2032)
- Table 47: Eastern Europe Space Tourism Market Market Y-o-Y Growth Rate Comparison by Type (2016-2032)
- Table 48: Eastern Europe Space Tourism Market Market Y-o-Y Growth Rate Comparison by End-User (2016-2032)
- Table 49: Eastern Europe Space Tourism Market Market Share Comparison by Country (2016-2032)
- Table 50: Eastern Europe Space Tourism Market Market Share Comparison by Type (2016-2032)
- Table 51: Eastern Europe Space Tourism Market Market Share Comparison by End-User (2016-2032)
- Table 52: APAC Space Tourism Market Market Comparison by Type (2016-2032)
- Table 53: APAC Space Tourism Market Market Comparison by End-User (2016-2032)
- Table 54: APAC Space Tourism Market Revenue (US$ Mn) Comparison by Country (2016-2032)
- Table 55: APAC Space Tourism Market Market Revenue (US$ Mn) (2016-2032)
- Table 56: APAC Space Tourism Market Market Revenue (US$ Mn) Comparison by Country (2016-2032)
- Table 57: APAC Space Tourism Market Market Revenue (US$ Mn) Comparison by Type (2016-2032)
- Table 58: APAC Space Tourism Market Market Revenue (US$ Mn) Comparison by End-User (2016-2032)
- Table 59: APAC Space Tourism Market Market Y-o-Y Growth Rate Comparison by Country (2016-2032)
- Table 60: APAC Space Tourism Market Market Y-o-Y Growth Rate Comparison by Type (2016-2032)
- Table 61: APAC Space Tourism Market Market Y-o-Y Growth Rate Comparison by End-User (2016-2032)
- Table 62: APAC Space Tourism Market Market Share Comparison by Country (2016-2032)
- Table 63: APAC Space Tourism Market Market Share Comparison by Type (2016-2032)
- Table 64: APAC Space Tourism Market Market Share Comparison by End-User (2016-2032)
- Table 65: Latin America Space Tourism Market Market Comparison by Type (2016-2032)
- Table 66: Latin America Space Tourism Market Market Comparison by End-User (2016-2032)
- Table 67: Latin America Space Tourism Market Revenue (US$ Mn) Comparison by Country (2016-2032)
- Table 68: Latin America Space Tourism Market Market Revenue (US$ Mn) (2016-2032)
- Table 69: Latin America Space Tourism Market Market Revenue (US$ Mn) Comparison by Country (2016-2032)
- Table 70: Latin America Space Tourism Market Market Revenue (US$ Mn) Comparison by Type (2016-2032)
- Table 71: Latin America Space Tourism Market Market Revenue (US$ Mn) Comparison by End-User (2016-2032)
- Table 72: Latin America Space Tourism Market Market Y-o-Y Growth Rate Comparison by Country (2016-2032)
- Table 73: Latin America Space Tourism Market Market Y-o-Y Growth Rate Comparison by Type (2016-2032)
- Table 74: Latin America Space Tourism Market Market Y-o-Y Growth Rate Comparison by End-User (2016-2032)
- Table 75: Latin America Space Tourism Market Market Share Comparison by Country (2016-2032)
- Table 76: Latin America Space Tourism Market Market Share Comparison by Type (2016-2032)
- Table 77: Latin America Space Tourism Market Market Share Comparison by End-User (2016-2032)
- Table 78: Middle East & Africa Space Tourism Market Market Comparison by Type (2016-2032)
- Table 79: Middle East & Africa Space Tourism Market Market Comparison by End-User (2016-2032)
- Table 80: Middle East & Africa Space Tourism Market Revenue (US$ Mn) Comparison by Country (2016-2032)
- Table 81: Middle East & Africa Space Tourism Market Market Revenue (US$ Mn) (2016-2032)
- Table 82: Middle East & Africa Space Tourism Market Market Revenue (US$ Mn) Comparison by Country (2016-2032)
- Table 83: Middle East & Africa Space Tourism Market Market Revenue (US$ Mn) Comparison by Type (2016-2032)
- Table 84: Middle East & Africa Space Tourism Market Market Revenue (US$ Mn) Comparison by End-User (2016-2032)
- Table 85: Middle East & Africa Space Tourism Market Market Y-o-Y Growth Rate Comparison by Country (2016-2032)
- Table 86: Middle East & Africa Space Tourism Market Market Y-o-Y Growth Rate Comparison by Type (2016-2032)
- Table 87: Middle East & Africa Space Tourism Market Market Y-o-Y Growth Rate Comparison by End-User (2016-2032)
- Table 88: Middle East & Africa Space Tourism Market Market Share Comparison by Country (2016-2032)
- Table 89: Middle East & Africa Space Tourism Market Market Share Comparison by Type (2016-2032)
- Table 90: Middle East & Africa Space Tourism Market Market Share Comparison by End-User (2016-2032)
- 1. Executive Summary
-
- Blue Origin
- Virgin Galactic
- SpaceX
- Airbus Group SE
- Boeing
- ZERO-G
- Axiom Space
- Bigelow Aerospace
- Orion Span
- Space Adventures
- Space Perspective
- World View Enterprises
- Zero2Infinity
- Other Key Players
Our Clients


View Our Licence Options
