
Software Asset Management Market By Component (Solutions, Services), By deployment (Cloud, On-Premises), By organization size (Large Enterprises, SMEs), By vertical (Retail, BFSI,and Others)By Region And Companies - Industry Segment Outlook, Market Assessment, Competition Scenario, Trends, And Forecast 2023-2032
-
26594
-
Jul 2023
-
160
-


-
This report was compiled by Vishwa Gaul Vishwa is an experienced market research and consulting professional with over 8 years of expertise in the ICT industry, contributing to over 700 reports across telecommunications, software, hardware, and digital solutions. Correspondence Team Lead- ICT Linkedin | Detailed Market research Methodology Our methodology involves a mix of primary research, including interviews with leading mental health experts, and secondary research from reputable medical journals and databases. View Detailed Methodology Page
-
Quick Navigation
Report Overview
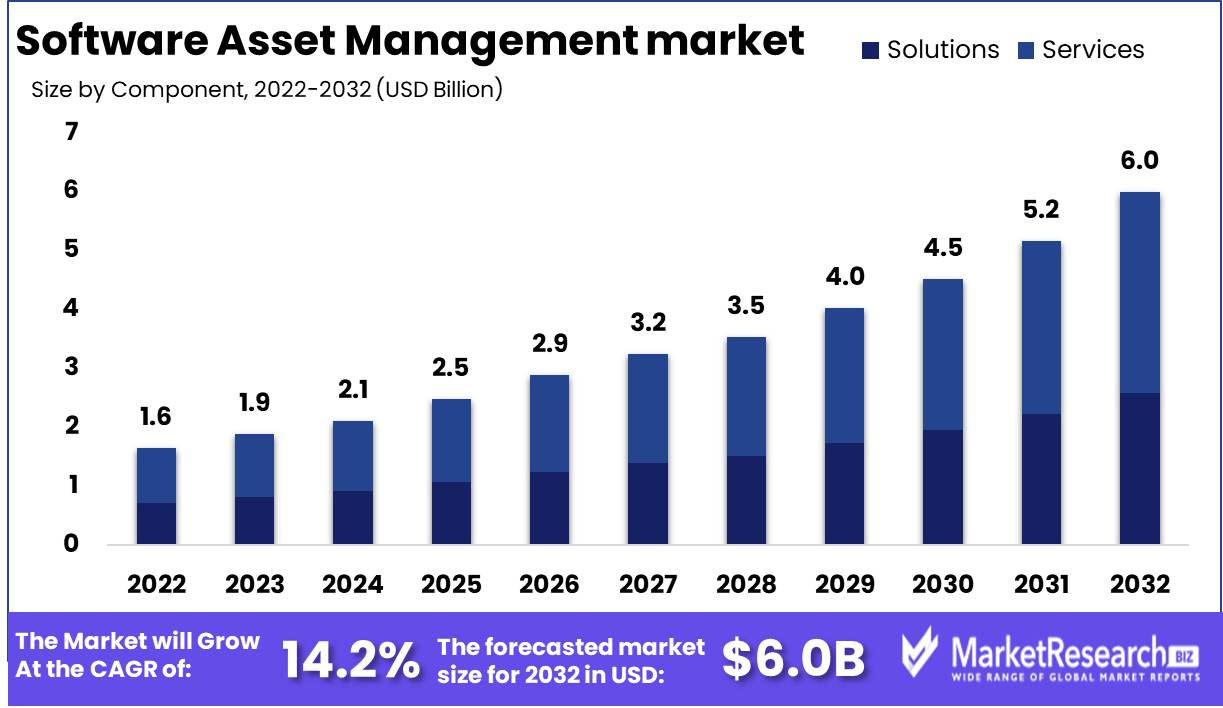
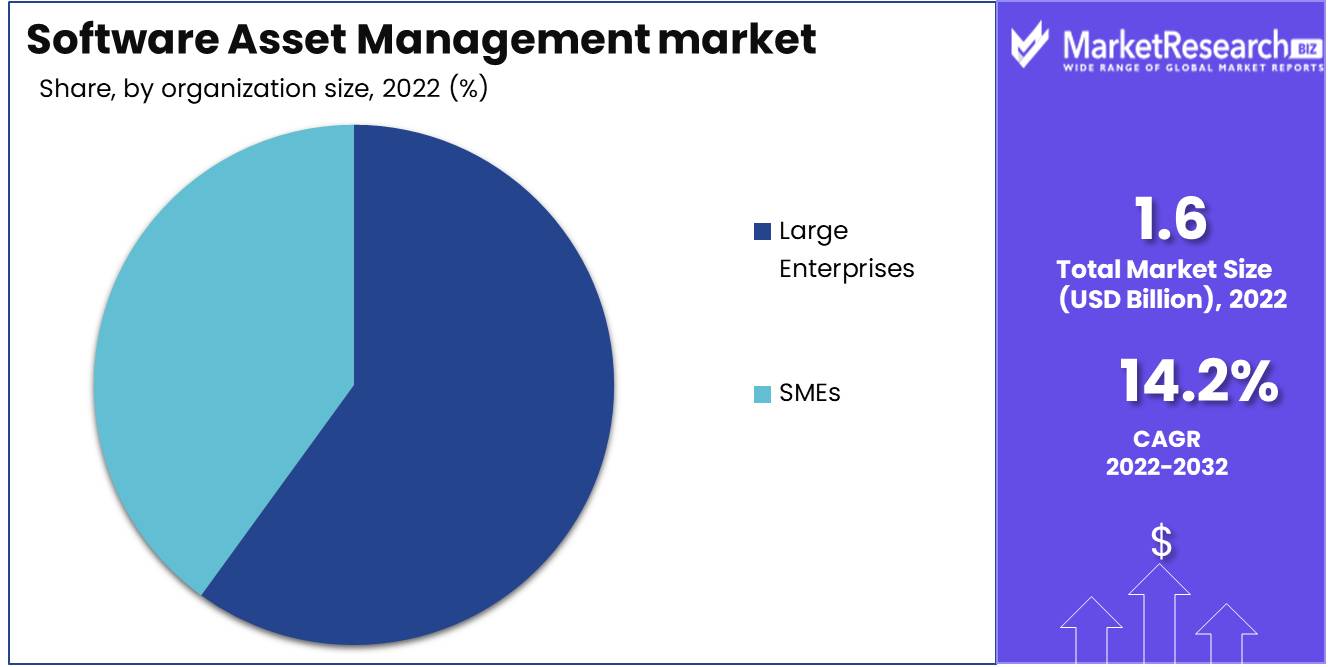
Software Asset Management Market size is expected to be worth around USD 6.0 Bn by 2032 from USD 1.6 Bn in 2022, growing at a CAGR of 14.2% during the forecast period from 2023 to 2032.
The software asset management market, which is a dynamic industry, develops a wide variety of innovative technologies and services. Software asset management involves carefully managing software licensing and usage to maximize the value of software assets. The software asset management industry offers cutting-edge software license management technologies, complete consulting services, and continuous support.
Software asset management (SAM) is a complex web of strategies and processes that helps firms manage and improve their software assets. SAM aims to optimally leverage software assets while reducing costs and hazards. This holistic discipline combines license management, resource allocation, and utilization data to help firms track software assets, inventory, and usage patterns.
An effective software asset management approach may save companies money, reduce risk, and enhance productivity. Organizations can avoid financial penalties for license misuse, non-compliance, and unnecessary software purchases by optimizing software assets.
SAM also protects organizations from security breaches, data loss, and other IT issues. Finally, SAM ensures that employees have free access to the necessary software arsenal, eliminating productivity barriers and decreasing software-related downtime.
The software asset management market continues to grow. Cloud-based solutions and disruptive technologies like AI and machine learning are driving this growth. The market thrives on the increasing complexity of software licensing and compliance, which drives sophisticated solutions to maximize software assets and ensure compliance.
Healthcare, banking, retail, and government sectors participate in software asset management. These sectors actively streamline their software assets to cut licensing and compliance expenses and protect their finances.
Driving factors
An increase in the use of software solutions hosted in the cloud.
In the years to come, it is anticipated that the software asset management market will expand dramatically. One of the primary elements that has contributed to this expansion is the rising popularity of software solutions that are hosted in the cloud. Cloud-based software solutions offer a more cost-effective and flexible approach to the management of software, allowing organizations to effectively manage their software licenses and maintain compliance. Cloud-based software solutions are also known as SaaS (software as a service).
management of software licensing and compliance that is both efficient and compliant
The increasing demand for software management solutions that are also cost-effective is another factor that is boosting the market. Software asset management solutions offer a cost-effective way to manage software licenses and reduce the risk of non-compliance, which is beneficial for businesses in this day and age when they are under pressure to cut costs and improve their operations.
An ever-increasing level of complication within software license agreements
Another element that contributes to this phenomenon is the growing complexity of software license agreements. Businesses want software asset management solutions to assist them in navigating the complexities of software licensing agreements and avoiding costly fines. This is because software licensing agreements are becoming more difficult to maintain and more complex overall.
Restraining Factors
High Initial Investment Cost for Software Asset Management Market Implementation
When it comes to investing in the software asset management (SAM) Market, the high initial investment cost is a major concern for small and medium-sized businesses. The majority of stand-alone SAM Markets necessitate a sizeable up-front investment, which can be a significant burden on SMBs, particularly those in their early phases of development. These businesses may lack the financial resources necessary to implement SAM software, or they may not prioritize its implementation over other business aspects.
Lack of understanding among small and medium-sized businesses
The lack of awareness among SMBs regarding the significance of SAM has been a significant factor in retarding the market's expansion. Numerous business proprietors and decision-makers are unaware of the advantages that SAM Market can provide their companies. This lack of understanding can result in insufficient funding for SAM initiatives, as well as organizations missing out on the increased productivity and efficiency that SAM tools provide.
Limited compatibility of the market for software asset management with legacy systems
In certain circumstances, it may not be possible to replace legacy software systems with SAM Market, resulting in limited interoperability. Incompatibility between legacy systems and the new SAM Market can be problematic, resulting in a burdensome integration procedure that may not be worthwhile. This can be a substantial setback for SMBs, as the required effort to implement the new system can be burdensome.
Component Analysis
Software Asset Management (SAM) is an essential organizational procedure for managing and optimizing the acquisition, deployment, maintenance, utilization, and disposal of software assets. In recent years, the SAM market has experienced significant growth globally, with the Software Asset Management Services segment dominating the market. This segment comprises Suites, Services, and Managed Services for Software Asset Management.
Economic Development in Emerging Economies drives Software Asset Management Services Segment Adoption. In emerging economies, the demand for Software Asset Management Services is driven by the increasing adoption of cutting-edge technologies such as Artificial Intelligence (AI), the Internet of Things (IoT), and Big Data Analytics. In addition, government initiatives aimed at improving the IT infrastructure, increasing digitization, and promoting the use of software in a variety of industries are propelling the expansion of this market segment.
Deployment Analysis
In recent years, Cloud-based Software Asset Management Services have dominated the SAM market. The Cloud Segment comprises cloud-deployed Software Asset Management Suites, Software Asset Management Services, and Software Asset Management Managed Services. Increased security, flexibility, scalability, decreased maintenance costs, and accessibility from anywhere are just a few of the benefits of Cloud-based Software Asset Management Services.
With the expansion of the SAM market in emerging economies, Economic Development in Emerging Economies drives the Cloud Segment's adoption. Software Asset Management Services are not exempt from the necessity for businesses in emerging economies to implement cloud-based technologies to remain competitive. The increasing demand for flexible and scalable solutions is driving favorable consumer trends and Cloud segment behavior. Organizations are adopting cloud-based Software Asset Management Services to adapt to modern technological requirements and obtain a competitive advantage.
Organization Size Analysis
The Large Enterprises Segment dominates the SAM market, accounting for a substantial proportion of market revenue. Software Asset Management is necessary for large enterprises to monitor software usage, reduce costs, avoid license non-compliance risks, and optimize license utilization. In addition, Large Enterprises anticipate vendors to deliver Software Asset Management solutions with enhanced scalability, flexibility, and reporting capabilities.
Economic Growth in Emerging Economies drives the adoption of the Large Enterprises Segment in the software asset management market. With the rapid expansion of businesses in emergent economies, there is a growing demand for Software Asset Management solutions to efficiently manage software licenses and optimize software utilization. Organizations are progressively adopting Software Asset Management solutions to improve performance, maintain compliance, and cut costs.
In the coming years, the Large Enterprises segment of the software asset management market is anticipated to record the highest growth rate, primarily due to the rising demand for Software Asset Management solutions in emerging economies.
Vertical Analysis
The IT and Telecom Segment dominates the SAM market, accounting for the largest market revenue share. IT and Telecom companies are the largest consumers of software licenses and require Software Asset Management solutions to manage software installations, reduce costs, and ensure license compliance.
Economic Development in Emerging Economies drives the IT and Telecom Segment of the software asset management market. The expansion of the IT and Telecom industries in developing nations has increased the need for Software Asset Management Solutions to effectively manage software licenses.
The adoption of advanced technologies such as AI, IoT, and Big Data Analytics is on the rise, which is altering consumer trends and behaviors in the IT and Telecom market. Consequently, Software Asset Management solutions are indispensable for optimizing license utilization, vendor management, and license compliance.
Key Market Segments
By Component
- Solutions
- Services
ByDeploymentt
- Cloud
- On-Premises
By organization size
- Large Enterprises
- SMEs
By Vertical
- Retail
- BFSI
- IT & Telecom
- Healthcare
- Government Sector
- Energy and Power
- Manufacturing
- Others
Growth Opportunity
The ever-increasing need for cloud-based software asset management Market
One of the main drivers behind the development potential in this market is the increasing demand for cloud-based software asset management Market. This need is one of the driving forces. Cloud computing is becoming increasingly popular among corporations as a method for storing data and administering software assets. Scalability, accessibility, and cost efficiency are just some of the advantages offered by cloud-based markets.
The ever increasing demand for efficient software license management and compliance
The rising importance of efficient software licensing management and regulatory compliance is another element that is contributing to the market for software asset management's expansionary potential. Because there are so many software programs available, it can be difficult for organizations to monitor their license agreements and ensure that they are in compliance with the terms of those agreements. Businesses can improve their efficiency in managing their licenses and stay in line with industry laws by implementing effective software asset management Market.
An increasing number of small and medium-sized businesses are utilizing the software asset management market.
The increasing popularity of the software asset management Market among small and medium-sized businesses (SMEs), on the other hand, is another factor that is adding to the growth potential of this market. As more small and medium-sized enterprises (SMEs) become aware of the significance of properly managing their software assets, more of them are looking to the software asset management Market for assistance in maintaining compliance and organization.
Latest Trends
Adoption of Subscription-Based Licensing Models on the Rise
Over the years, subscription-based licensing models have gained popularity. This trend has been fuelled by several factors, including the model's adaptability and cost-effectiveness. With a subscription-based license, businesses can pay for their software license on a monthly or annual basis, as opposed to making a substantial up-front investment for perpetual licenses. This model also facilitates scalability, as companies can easily increase or decrease their license requirements based on their current requirements. Additionally, it allows them to upgrade or downgrade to various software versions without making additional purchases.
The Software Asset Management as a Service (SaaS) delivery model is gaining popularity.
Due to its adaptability and affordability, the software asset management as a service (SaaS) delivery model is gaining popularity. The SaaS delivery model enables businesses to access software via a web-based interface, removing the need for on-premises installations.T his model has several advantages, including lower up-front costs, fewer hardware and infrastructure needs, and automatic updates and maintenance. It also allows companies to access the software from anywhere, which is crucial in today's remote work environment.
Increasing Demand for Software License Optimization Instruments
Software license optimization tools are gaining popularity as businesses seek to reduce software licensing expenses. These tools analyze software usage data to identify inactive or underutilized licenses, which can then be repurposed or decommissioned to save money. This trend is fueled by the fact that many businesses overspend on software licensing because they cannot keep track of all the licenses they have purchased. With software license optimization tools, businesses can gain greater visibility and control over their licenses, thereby reducing their software licensing expenses.
Regional Analysis
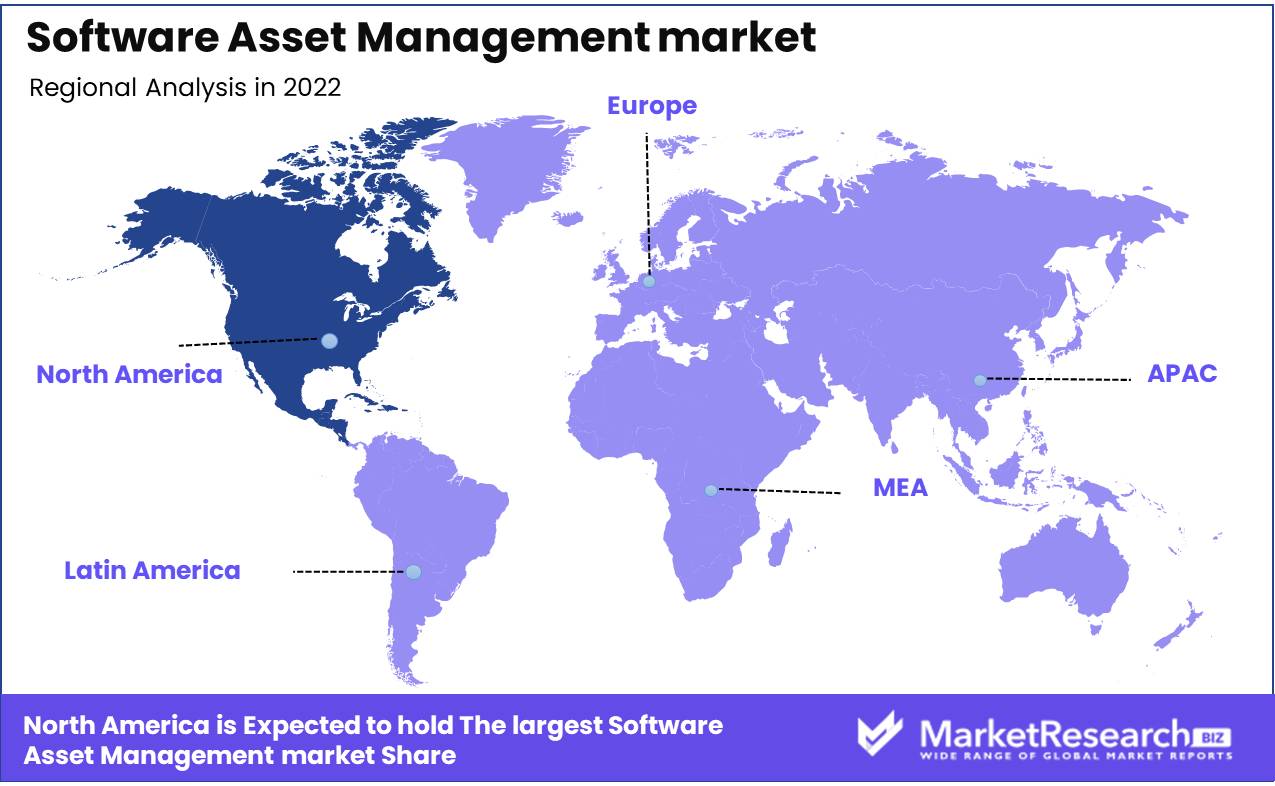
North America leads the software asset management market for numerous reasons. The market and demand for software asset management systems have risen rapidly. This article discusses how North America became a leading software asset management market.
North America has several multinationals and huge firms. These companies use software to manage a large workforce. These firms require an effective software asset management system. This demand has made the North American software asset management market attractive to businesses.
North America has advanced technology that helps the software asset management market. Data centers, cloud service providers, and internet service providers in the region enable software asset management solutions. North America's stronNorthndustry helps drive the software asset management market.
The region's IT-savvy workforce is highly qualified. Due to their software asset management skills, these individuals are in high demand, helping the market develop.
North America strictly regulates software asset management. Companies must follow software licensing, usage, and reporting rules to comply. These restrictions level the software asset management market and promote fair business practices.Many North American companies optimize their software assets proactively due to a greater knowledge of software asset management. This has increased demand for software asset management systems, fueling market expansion.
Key Regions and Countries
North America
- US
- Canada
- Mexico
Western Europe
- Germany
- France
- The UK
- Spain
- Italy
- Portugal
- Ireland
- Austria
- Switzerland
- Benelux
- Nordic
- Rest of Western Europe
Eastern Europe
- Russia
- Poland
- The Czech Republic
- Greece
- Rest of Eastern Europe
APAC
- China
- Japan
- South Korea
- India
- Australia & New Zealand
- Indonesia
- Malaysia
- Philippines
- Singapore
- Thailand
- Vietnam
- Rest of APAC
Latin America
- Brazil
- Colombia
- Chile
- Argentina
- Costa Rica
- Rest of Latin America
Middle East & Africa
- Algeria
- Egypt
- Israel
- Kuwait
- Nigeria
- Saudi Arabia
- South Africa
- Turkey
- United Arab Emirates
- Rest of MEA
Key Players Analysis
Software Asset Management (SAM) is a fast-growing technological market. Technology advances daily, bringing new software solutions to market. Thus, software asset management has become increasingly important for IT management in all sizes of businesses.M any SAM market players have unique expertise and approaches.
IBM, Oracle, HPE, BMC, and ServiceNow are major participants.IBM Corporation leads the SAM market with its IBM License Metric Tool (ILMT), which helps enterprises manage and report software consumption and license compliance. Oracle License Management Services (LMS) helps enterprises optimize software spending and comply with licensing agreements.
HPE Asset Manager helps firms manage software and hardware assets.BMC Software's BMC Helix ITSM solution automates asset discovery and management for software licenses, hardware, and other IT assets.
ServiceNow's IT Asset Management (ITAM) software delivers real-time visibility over software and hardware assets, helping firms comply with licensing agreements and save software expenses. These SAM market leaders help companies optimize software spending, comply with licensing agreements, and manage IT assets. Their dedication to the SAM business ensures market growth.
Top Key Players in Software Asset Management Market
- Microsoft Corporation
- CA Technologies
- BMC Software Inc.
- Symantec Corporation
- Aspera Technologies
- IBM Corporation
- Ivanti
- Micro Focus International plc
- Snow Software AB
Recent Development
- Starting with an August 2022 announcement, Microsoft disclosed its acquisition of License Dashboard, a software asset management company. Microsoft improved its cloud-based software asset management capabilities, making it a more attractive option for businesses attempting to effectively manage their software assets.
- With the launch of its software asset management platform in June 2022, ServiceNow also made ripples in the market. The platform offers real-time visibility into software assets and licenses, granting businesses greater control and visibility into their software inventory.
- Flexera introduced its new cloud-based software asset management solution in March 2022. The offering is intended to assist businesses in optimizing their software usage and reducing costs, highlighting the increasing significance of effective software management in the current business environment.
- Not wanting to be left behind, Ivanti acquired Cherwell Software in January 2022 in a significant move. Ivanti acquired a provider of IT service management and software asset management solutions to expand its software asset management capabilities and strengthen its position as a market leader.
- Snow Software introduced its new software asset management solution, Snow Commander, in November 2021. The solution provides a unified view of software assets across an organization's IT estate, thereby streamlining inventory management and decreasing the risk of noncompliance.
Report Scope
Report Features Description Market Value (2022) USD 1.6 Bn Forecast Revenue (2032) USD 6.0 Bn CAGR (2023-2032) 14.2% Base Year for Estimation 2022 Historic Period 2016-2022 Forecast Period 2023-2032 Report Coverage Revenue Forecast, Market Dynamics, COVID-19 Impact, Competitive Landscape, Recent Developments Segments Covered By Component (Solutions, Services), ByDeploymentt (Cloud, On-Premises), By organization size (Large Enterprises, SMEs), ByVerticall (Retail, BFSI, IT & Telecom, Healthcare, Government Sector, Energy and Power, Manufacturing, Others) Regional Analysis North America – The US, Canada, & Mexico; Western Europe – Germany, France, The UK, Spain, Italy, Portugal, Ireland, Austria, Switzerland, Benelux, Nordic, & Rest of Western Europe; Eastern Europe – Russia, Poland, The Czech Republic, Greece, & Rest of Eastern Europe; APAC – China, Japan, South Korea, India, Australia & New Zealand, Indonesia, Malaysia, Philippines, Singapore, Thailand, Vietnam, & Rest of APAC; Latin America – Brazil, Colombia, Chile, Argentina, Costa Rica, & Rest of Latin America; Middle East & Africa – Algeria, Egypt, Israel, Kuwait, Nigeria, Saudi Arabia, South Africa, Turkey, United Arab Emirates, & Rest of MEA Competitive Landscape Microsoft Corporation, CA Technologies, BMC Software Inc., Symantec Corporation, Aspera Technologies, IBM Corporation, Ivanti, Micro Focus International plc, Snow Software AB Customization Scope Customization for segments, region/country-level will be provided. Moreover, additional customization can be done based on the requirements. Purchase Options We have three licenses to opt for Single User License, Multi-User License (Up to 5 Users), Corporate Use License (Unlimited User and Printable PDF) -
- 1. Executive Summary
- 1.1. Definition
- 1.2. Taxonomy
- 1.3. Research Scope
- 1.4. Key Analysis
- 1.5. Key Findings by Major Segments
- 1.6. Top strategies by Major Players
- 2. Global Software Asset Management Market Overview
- 2.1. Software Asset Management Market Dynamics
- 2.1.1. Drivers
- 2.1.2. Opportunities
- 2.1.3. Restraints
- 2.1.4. Challenges
- 2.2. Macro-economic Factors
- 2.3. Regulatory Framework
- 2.4. Market Investment Feasibility Index
- 2.5. PEST Analysis
- 2.6. PORTER’S Five Force Analysis
- 2.7. Drivers & Restraints Impact Analysis
- 2.8. Industry Chain Analysis
- 2.9. Cost Structure Analysis
- 2.10. Marketing Strategy
- 2.11. Russia-Ukraine War Impact Analysis
- 2.12. Opportunity Map Analysis
- 2.13. Market Competition Scenario Analysis
- 2.14. Product Life Cycle Analysis
- 2.15. Opportunity Orbits
- 2.16. Manufacturer Intensity Map
- 2.17. Major Companies sales by Value & Volume
- 2.1. Software Asset Management Market Dynamics
- 3. Global Software Asset Management Market Analysis, Opportunity and Forecast, 2016-2032
- 3.1. Global Software Asset Management Market Analysis, 2016-2021
- 3.2. Global Software Asset Management Market Opportunity and Forecast, 2023-2032
- 3.3. Global Software Asset Management Market Analysis, Opportunity and Forecast, By By Component, 2016-2032
- 3.3.1. Global Software Asset Management Market Analysis by By Component: Introduction
- 3.3.2. Market Size Absolute $ Opportunity Analysis and Forecast, By By Component, 2016-2032
- 3.3.4. Solutions
- 3.3.5. Services
- 3.4. Global Software Asset Management Market Analysis, Opportunity and Forecast, By By deployment, 2016-2032
- 3.4.1. Global Software Asset Management Market Analysis by By deployment: Introduction
- 3.4.2. Market Size Absolute $ Opportunity Analysis and Forecast, By By deployment, 2016-2032
- 3.4.3. Cloud
- 3.4.4. On-Premises
- 3.5. Global Software Asset Management Market Analysis, Opportunity and Forecast, By By organization size, 2016-2032
- 3.5.1. Global Software Asset Management Market Analysis by By organization size: Introduction
- 3.5.2. Market Size Absolute $ Opportunity Analysis and Forecast, By By organization size, 2016-2032
- 3.5.3. Large Enterprises
- 3.5.4. SMEs
- 3.6. Global Software Asset Management Market Analysis, Opportunity and Forecast, By By vertical, 2016-2032
- 3.6.1. Global Software Asset Management Market Analysis by By vertical: Introduction
- 3.6.2. Market Size Absolute $ Opportunity Analysis and Forecast, By By vertical, 2016-2032
- 3.6.3. Retail
- 3.6.4. BFSI
- 3.6.5. IT & Telecom
- 3.6.6. Healthcare
- 3.6.7. Government Sector
- 3.6.8. Energy and Power
- 3.6.9. Manufacturing
- 3.6.10. Others
- 4. North America Software Asset Management Market Analysis, Opportunity and Forecast, 2016-2032
- 4.1. North America Software Asset Management Market Analysis, 2016-2021
- 4.2. North America Software Asset Management Market Opportunity and Forecast, 2023-2032
- 4.3. North America Software Asset Management Market Analysis, Opportunity and Forecast, By By Component, 2016-2032
- 4.3.1. North America Software Asset Management Market Analysis by By Component: Introduction
- 4.3.2. Market Size Absolute $ Opportunity Analysis and Forecast, By By Component, 2016-2032
- 4.3.4. Solutions
- 4.3.5. Services
- 4.4. North America Software Asset Management Market Analysis, Opportunity and Forecast, By By deployment, 2016-2032
- 4.4.1. North America Software Asset Management Market Analysis by By deployment: Introduction
- 4.4.2. Market Size Absolute $ Opportunity Analysis and Forecast, By By deployment, 2016-2032
- 4.4.3. Cloud
- 4.4.4. On-Premises
- 4.5. North America Software Asset Management Market Analysis, Opportunity and Forecast, By By organization size, 2016-2032
- 4.5.1. North America Software Asset Management Market Analysis by By organization size: Introduction
- 4.5.2. Market Size Absolute $ Opportunity Analysis and Forecast, By By organization size, 2016-2032
- 4.5.3. Large Enterprises
- 4.5.4. SMEs
- 4.6. North America Software Asset Management Market Analysis, Opportunity and Forecast, By By vertical, 2016-2032
- 4.6.1. North America Software Asset Management Market Analysis by By vertical: Introduction
- 4.6.2. Market Size Absolute $ Opportunity Analysis and Forecast, By By vertical, 2016-2032
- 4.6.3. Retail
- 4.6.4. BFSI
- 4.6.5. IT & Telecom
- 4.6.6. Healthcare
- 4.6.7. Government Sector
- 4.6.8. Energy and Power
- 4.6.9. Manufacturing
- 4.6.10. Others
- 4.7. North America Software Asset Management Market Analysis, Opportunity and Forecast, By Country , 2016-2032
- 4.7.1. North America Software Asset Management Market Analysis by Country : Introduction
- 4.7.2. Market Size Absolute $ Opportunity Analysis and Forecast, Country , 2016-2032
- 4.7.2.1. The US
- 4.7.2.2. Canada
- 4.7.2.3. Mexico
- 5. Western Europe Software Asset Management Market Analysis, Opportunity and Forecast, 2016-2032
- 5.1. Western Europe Software Asset Management Market Analysis, 2016-2021
- 5.2. Western Europe Software Asset Management Market Opportunity and Forecast, 2023-2032
- 5.3. Western Europe Software Asset Management Market Analysis, Opportunity and Forecast, By By Component, 2016-2032
- 5.3.1. Western Europe Software Asset Management Market Analysis by By Component: Introduction
- 5.3.2. Market Size Absolute $ Opportunity Analysis and Forecast, By By Component, 2016-2032
- 5.3.4. Solutions
- 5.3.5. Services
- 5.4. Western Europe Software Asset Management Market Analysis, Opportunity and Forecast, By By deployment, 2016-2032
- 5.4.1. Western Europe Software Asset Management Market Analysis by By deployment: Introduction
- 5.4.2. Market Size Absolute $ Opportunity Analysis and Forecast, By By deployment, 2016-2032
- 5.4.3. Cloud
- 5.4.4. On-Premises
- 5.5. Western Europe Software Asset Management Market Analysis, Opportunity and Forecast, By By organization size, 2016-2032
- 5.5.1. Western Europe Software Asset Management Market Analysis by By organization size: Introduction
- 5.5.2. Market Size Absolute $ Opportunity Analysis and Forecast, By By organization size, 2016-2032
- 5.5.3. Large Enterprises
- 5.5.4. SMEs
- 5.6. Western Europe Software Asset Management Market Analysis, Opportunity and Forecast, By By vertical, 2016-2032
- 5.6.1. Western Europe Software Asset Management Market Analysis by By vertical: Introduction
- 5.6.2. Market Size Absolute $ Opportunity Analysis and Forecast, By By vertical, 2016-2032
- 5.6.3. Retail
- 5.6.4. BFSI
- 5.6.5. IT & Telecom
- 5.6.6. Healthcare
- 5.6.7. Government Sector
- 5.6.8. Energy and Power
- 5.6.9. Manufacturing
- 5.6.10. Others
- 5.7. Western Europe Software Asset Management Market Analysis, Opportunity and Forecast, By Country , 2016-2032
- 5.7.1. Western Europe Software Asset Management Market Analysis by Country : Introduction
- 5.7.2. Market Size Absolute $ Opportunity Analysis and Forecast, Country , 2016-2032
- 5.7.2.1. Germany
- 5.7.2.2. France
- 5.7.2.3. The UK
- 5.7.2.4. Spain
- 5.7.2.5. Italy
- 5.7.2.6. Portugal
- 5.7.2.7. Ireland
- 5.7.2.8. Austria
- 5.7.2.9. Switzerland
- 5.7.2.10. Benelux
- 5.7.2.11. Nordic
- 5.7.2.12. Rest of Western Europe
- 6. Eastern Europe Software Asset Management Market Analysis, Opportunity and Forecast, 2016-2032
- 6.1. Eastern Europe Software Asset Management Market Analysis, 2016-2021
- 6.2. Eastern Europe Software Asset Management Market Opportunity and Forecast, 2023-2032
- 6.3. Eastern Europe Software Asset Management Market Analysis, Opportunity and Forecast, By By Component, 2016-2032
- 6.3.1. Eastern Europe Software Asset Management Market Analysis by By Component: Introduction
- 6.3.2. Market Size Absolute $ Opportunity Analysis and Forecast, By By Component, 2016-2032
- 6.3.4. Solutions
- 6.3.5. Services
- 6.4. Eastern Europe Software Asset Management Market Analysis, Opportunity and Forecast, By By deployment, 2016-2032
- 6.4.1. Eastern Europe Software Asset Management Market Analysis by By deployment: Introduction
- 6.4.2. Market Size Absolute $ Opportunity Analysis and Forecast, By By deployment, 2016-2032
- 6.4.3. Cloud
- 6.4.4. On-Premises
- 6.5. Eastern Europe Software Asset Management Market Analysis, Opportunity and Forecast, By By organization size, 2016-2032
- 6.5.1. Eastern Europe Software Asset Management Market Analysis by By organization size: Introduction
- 6.5.2. Market Size Absolute $ Opportunity Analysis and Forecast, By By organization size, 2016-2032
- 6.5.3. Large Enterprises
- 6.5.4. SMEs
- 6.6. Eastern Europe Software Asset Management Market Analysis, Opportunity and Forecast, By By vertical, 2016-2032
- 6.6.1. Eastern Europe Software Asset Management Market Analysis by By vertical: Introduction
- 6.6.2. Market Size Absolute $ Opportunity Analysis and Forecast, By By vertical, 2016-2032
- 6.6.3. Retail
- 6.6.4. BFSI
- 6.6.5. IT & Telecom
- 6.6.6. Healthcare
- 6.6.7. Government Sector
- 6.6.8. Energy and Power
- 6.6.9. Manufacturing
- 6.6.10. Others
- 6.7. Eastern Europe Software Asset Management Market Analysis, Opportunity and Forecast, By Country , 2016-2032
- 6.7.1. Eastern Europe Software Asset Management Market Analysis by Country : Introduction
- 6.7.2. Market Size Absolute $ Opportunity Analysis and Forecast, Country , 2016-2032
- 6.7.2.1. Russia
- 6.7.2.2. Poland
- 6.7.2.3. The Czech Republic
- 6.7.2.4. Greece
- 6.7.2.5. Rest of Eastern Europe
- 7. APAC Software Asset Management Market Analysis, Opportunity and Forecast, 2016-2032
- 7.1. APAC Software Asset Management Market Analysis, 2016-2021
- 7.2. APAC Software Asset Management Market Opportunity and Forecast, 2023-2032
- 7.3. APAC Software Asset Management Market Analysis, Opportunity and Forecast, By By Component, 2016-2032
- 7.3.1. APAC Software Asset Management Market Analysis by By Component: Introduction
- 7.3.2. Market Size Absolute $ Opportunity Analysis and Forecast, By By Component, 2016-2032
- 7.3.4. Solutions
- 7.3.5. Services
- 7.4. APAC Software Asset Management Market Analysis, Opportunity and Forecast, By By deployment, 2016-2032
- 7.4.1. APAC Software Asset Management Market Analysis by By deployment: Introduction
- 7.4.2. Market Size Absolute $ Opportunity Analysis and Forecast, By By deployment, 2016-2032
- 7.4.3. Cloud
- 7.4.4. On-Premises
- 7.5. APAC Software Asset Management Market Analysis, Opportunity and Forecast, By By organization size, 2016-2032
- 7.5.1. APAC Software Asset Management Market Analysis by By organization size: Introduction
- 7.5.2. Market Size Absolute $ Opportunity Analysis and Forecast, By By organization size, 2016-2032
- 7.5.3. Large Enterprises
- 7.5.4. SMEs
- 7.6. APAC Software Asset Management Market Analysis, Opportunity and Forecast, By By vertical, 2016-2032
- 7.6.1. APAC Software Asset Management Market Analysis by By vertical: Introduction
- 7.6.2. Market Size Absolute $ Opportunity Analysis and Forecast, By By vertical, 2016-2032
- 7.6.3. Retail
- 7.6.4. BFSI
- 7.6.5. IT & Telecom
- 7.6.6. Healthcare
- 7.6.7. Government Sector
- 7.6.8. Energy and Power
- 7.6.9. Manufacturing
- 7.6.10. Others
- 7.7. APAC Software Asset Management Market Analysis, Opportunity and Forecast, By Country , 2016-2032
- 7.7.1. APAC Software Asset Management Market Analysis by Country : Introduction
- 7.7.2. Market Size Absolute $ Opportunity Analysis and Forecast, Country , 2016-2032
- 7.7.2.1. China
- 7.7.2.2. Japan
- 7.7.2.3. South Korea
- 7.7.2.4. India
- 7.7.2.5. Australia & New Zeland
- 7.7.2.6. Indonesia
- 7.7.2.7. Malaysia
- 7.7.2.8. Philippines
- 7.7.2.9. Singapore
- 7.7.2.10. Thailand
- 7.7.2.11. Vietnam
- 7.7.2.12. Rest of APAC
- 8. Latin America Software Asset Management Market Analysis, Opportunity and Forecast, 2016-2032
- 8.1. Latin America Software Asset Management Market Analysis, 2016-2021
- 8.2. Latin America Software Asset Management Market Opportunity and Forecast, 2023-2032
- 8.3. Latin America Software Asset Management Market Analysis, Opportunity and Forecast, By By Component, 2016-2032
- 8.3.1. Latin America Software Asset Management Market Analysis by By Component: Introduction
- 8.3.2. Market Size Absolute $ Opportunity Analysis and Forecast, By By Component, 2016-2032
- 8.3.4. Solutions
- 8.3.5. Services
- 8.4. Latin America Software Asset Management Market Analysis, Opportunity and Forecast, By By deployment, 2016-2032
- 8.4.1. Latin America Software Asset Management Market Analysis by By deployment: Introduction
- 8.4.2. Market Size Absolute $ Opportunity Analysis and Forecast, By By deployment, 2016-2032
- 8.4.3. Cloud
- 8.4.4. On-Premises
- 8.5. Latin America Software Asset Management Market Analysis, Opportunity and Forecast, By By organization size, 2016-2032
- 8.5.1. Latin America Software Asset Management Market Analysis by By organization size: Introduction
- 8.5.2. Market Size Absolute $ Opportunity Analysis and Forecast, By By organization size, 2016-2032
- 8.5.3. Large Enterprises
- 8.5.4. SMEs
- 8.6. Latin America Software Asset Management Market Analysis, Opportunity and Forecast, By By vertical, 2016-2032
- 8.6.1. Latin America Software Asset Management Market Analysis by By vertical: Introduction
- 8.6.2. Market Size Absolute $ Opportunity Analysis and Forecast, By By vertical, 2016-2032
- 8.6.3. Retail
- 8.6.4. BFSI
- 8.6.5. IT & Telecom
- 8.6.6. Healthcare
- 8.6.7. Government Sector
- 8.6.8. Energy and Power
- 8.6.9. Manufacturing
- 8.6.10. Others
- 8.7. Latin America Software Asset Management Market Analysis, Opportunity and Forecast, By Country , 2016-2032
- 8.7.1. Latin America Software Asset Management Market Analysis by Country : Introduction
- 8.7.2. Market Size Absolute $ Opportunity Analysis and Forecast, Country , 2016-2032
- 8.7.2.1. Brazil
- 8.7.2.2. Colombia
- 8.7.2.3. Chile
- 8.7.2.4. Argentina
- 8.7.2.5. Costa Rica
- 8.7.2.6. Rest of Latin America
- 9. Middle East & Africa Software Asset Management Market Analysis, Opportunity and Forecast, 2016-2032
- 9.1. Middle East & Africa Software Asset Management Market Analysis, 2016-2021
- 9.2. Middle East & Africa Software Asset Management Market Opportunity and Forecast, 2023-2032
- 9.3. Middle East & Africa Software Asset Management Market Analysis, Opportunity and Forecast, By By Component, 2016-2032
- 9.3.1. Middle East & Africa Software Asset Management Market Analysis by By Component: Introduction
- 9.3.2. Market Size Absolute $ Opportunity Analysis and Forecast, By By Component, 2016-2032
- 9.3.4. Solutions
- 9.3.5. Services
- 9.4. Middle East & Africa Software Asset Management Market Analysis, Opportunity and Forecast, By By deployment, 2016-2032
- 9.4.1. Middle East & Africa Software Asset Management Market Analysis by By deployment: Introduction
- 9.4.2. Market Size Absolute $ Opportunity Analysis and Forecast, By By deployment, 2016-2032
- 9.4.3. Cloud
- 9.4.4. On-Premises
- 9.5. Middle East & Africa Software Asset Management Market Analysis, Opportunity and Forecast, By By organization size, 2016-2032
- 9.5.1. Middle East & Africa Software Asset Management Market Analysis by By organization size: Introduction
- 9.5.2. Market Size Absolute $ Opportunity Analysis and Forecast, By By organization size, 2016-2032
- 9.5.3. Large Enterprises
- 9.5.4. SMEs
- 9.6. Middle East & Africa Software Asset Management Market Analysis, Opportunity and Forecast, By By vertical, 2016-2032
- 9.6.1. Middle East & Africa Software Asset Management Market Analysis by By vertical: Introduction
- 9.6.2. Market Size Absolute $ Opportunity Analysis and Forecast, By By vertical, 2016-2032
- 9.6.3. Retail
- 9.6.4. BFSI
- 9.6.5. IT & Telecom
- 9.6.6. Healthcare
- 9.6.7. Government Sector
- 9.6.8. Energy and Power
- 9.6.9. Manufacturing
- 9.6.10. Others
- 9.7. Middle East & Africa Software Asset Management Market Analysis, Opportunity and Forecast, By Country , 2016-2032
- 9.7.1. Middle East & Africa Software Asset Management Market Analysis by Country : Introduction
- 9.7.2. Market Size Absolute $ Opportunity Analysis and Forecast, Country , 2016-2032
- 9.7.2.1. Algeria
- 9.7.2.2. Egypt
- 9.7.2.3. Israel
- 9.7.2.4. Kuwait
- 9.7.2.5. Nigeria
- 9.7.2.6. Saudi Arabia
- 9.7.2.7. South Africa
- 9.7.2.8. Turkey
- 9.7.2.9. The UAE
- 9.7.2.10. Rest of MEA
- 10. Global Software Asset Management Market Analysis, Opportunity and Forecast, By Region , 2016-2032
- 10.1. Global Software Asset Management Market Analysis by Region : Introduction
- 10.2. Market Size Absolute $ Opportunity Analysis and Forecast, By Region , 2016-2032
- 10.2.1. North America
- 10.2.2. Western Europe
- 10.2.3. Eastern Europe
- 10.2.4. APAC
- 10.2.5. Latin America
- 10.2.6. Middle East & Africa
- 11. Global Software Asset Management Market Competitive Landscape, Market Share Analysis, and Company Profiles
- 11.1. Market Share Analysis
- 11.2. Company Profiles
- 11.3. Microsoft Corporation
- 11.3.1. Company Overview
- 11.3.2. Financial Highlights
- 11.3.3. Product Portfolio
- 11.3.4. SWOT Analysis
- 11.3.5. Key Strategies and Developments
- 11.4. CA Technologies
- 11.4.1. Company Overview
- 11.4.2. Financial Highlights
- 11.4.3. Product Portfolio
- 11.4.4. SWOT Analysis
- 11.4.5. Key Strategies and Developments
- 11.5. BMC Software Inc.
- 11.5.1. Company Overview
- 11.5.2. Financial Highlights
- 11.5.3. Product Portfolio
- 11.5.4. SWOT Analysis
- 11.5.5. Key Strategies and Developments
- 11.6. Symantec Corporation
- 11.6.1. Company Overview
- 11.6.2. Financial Highlights
- 11.6.3. Product Portfolio
- 11.6.4. SWOT Analysis
- 11.6.5. Key Strategies and Developments
- 11.7. Aspera Technologies
- 11.7.1. Company Overview
- 11.7.2. Financial Highlights
- 11.7.3. Product Portfolio
- 11.7.4. SWOT Analysis
- 11.7.5. Key Strategies and Developments
- 11.8. IBM Corporation
- 11.8.1. Company Overview
- 11.8.2. Financial Highlights
- 11.8.3. Product Portfolio
- 11.8.4. SWOT Analysis
- 11.8.5. Key Strategies and Developments
- 11.9. Ivanti
- 11.9.1. Company Overview
- 11.9.2. Financial Highlights
- 11.9.3. Product Portfolio
- 11.9.4. SWOT Analysis
- 11.9.5. Key Strategies and Developments
- 11.10. Micro Focus International plc
- 11.10.1. Company Overview
- 11.10.2. Financial Highlights
- 11.10.3. Product Portfolio
- 11.10.4. SWOT Analysis
- 11.10.5. Key Strategies and Developments
- 11.11. Snow Software AB
- 11.11.1. Company Overview
- 11.11.2. Financial Highlights
- 11.11.3. Product Portfolio
- 11.11.4. SWOT Analysis
- 11.11.5. Key Strategies and Developments
- 12. Assumptions and Acronyms
- 13. Research Methodology
- 14. Contact
List of Figures
- Figure 1: Global Software Asset Management Market Revenue (US$ Mn) Market Share by By Component in 2022
- Figure 2: Global Software Asset Management Market Attractiveness Analysis by By Component, 2016-2032
- Figure 3: Global Software Asset Management Market Revenue (US$ Mn) Market Share by By deploymentin 2022
- Figure 4: Global Software Asset Management Market Attractiveness Analysis by By deployment, 2016-2032
- Figure 5: Global Software Asset Management Market Revenue (US$ Mn) Market Share by By organization sizein 2022
- Figure 6: Global Software Asset Management Market Attractiveness Analysis by By organization size, 2016-2032
- Figure 7: Global Software Asset Management Market Revenue (US$ Mn) Market Share by By verticalin 2022
- Figure 8: Global Software Asset Management Market Attractiveness Analysis by By vertical, 2016-2032
- Figure 9: Global Software Asset Management Market Revenue (US$ Mn) Market Share by Region in 2022
- Figure 10: Global Software Asset Management Market Attractiveness Analysis by Region, 2016-2032
- Figure 11: Global Software Asset Management Market Revenue (US$ Mn) (2016-2032)
- Figure 12: Global Software Asset Management Market Revenue (US$ Mn) Comparison by Region (2016-2032)
- Figure 13: Global Software Asset Management Market Revenue (US$ Mn) Comparison by By Component (2016-2032)
- Figure 14: Global Software Asset Management Market Revenue (US$ Mn) Comparison by By deployment (2016-2032)
- Figure 15: Global Software Asset Management Market Revenue (US$ Mn) Comparison by By organization size (2016-2032)
- Figure 16: Global Software Asset Management Market Revenue (US$ Mn) Comparison by By vertical (2016-2032)
- Figure 17: Global Software Asset Management Market Y-o-Y Growth Rate Comparison by Region (2016-2032)
- Figure 18: Global Software Asset Management Market Y-o-Y Growth Rate Comparison by By Component (2016-2032)
- Figure 19: Global Software Asset Management Market Y-o-Y Growth Rate Comparison by By deployment (2016-2032)
- Figure 20: Global Software Asset Management Market Y-o-Y Growth Rate Comparison by By organization size (2016-2032)
- Figure 21: Global Software Asset Management Market Y-o-Y Growth Rate Comparison by By vertical (2016-2032)
- Figure 22: Global Software Asset Management Market Share Comparison by Region (2016-2032)
- Figure 23: Global Software Asset Management Market Share Comparison by By Component (2016-2032)
- Figure 24: Global Software Asset Management Market Share Comparison by By deployment (2016-2032)
- Figure 25: Global Software Asset Management Market Share Comparison by By organization size (2016-2032)
- Figure 26: Global Software Asset Management Market Share Comparison by By vertical (2016-2032)
- Figure 27: North America Software Asset Management Market Revenue (US$ Mn) Market Share by By Componentin 2022
- Figure 28: North America Software Asset Management Market Attractiveness Analysis by By Component, 2016-2032
- Figure 29: North America Software Asset Management Market Revenue (US$ Mn) Market Share by By deploymentin 2022
- Figure 30: North America Software Asset Management Market Attractiveness Analysis by By deployment, 2016-2032
- Figure 31: North America Software Asset Management Market Revenue (US$ Mn) Market Share by By organization sizein 2022
- Figure 32: North America Software Asset Management Market Attractiveness Analysis by By organization size, 2016-2032
- Figure 33: North America Software Asset Management Market Revenue (US$ Mn) Market Share by By verticalin 2022
- Figure 34: North America Software Asset Management Market Attractiveness Analysis by By vertical, 2016-2032
- Figure 35: North America Software Asset Management Market Revenue (US$ Mn) Market Share by Country in 2022
- Figure 36: North America Software Asset Management Market Attractiveness Analysis by Country, 2016-2032
- Figure 37: North America Software Asset Management Market Revenue (US$ Mn) (2016-2032)
- Figure 38: North America Software Asset Management Market Revenue (US$ Mn) Comparison by Country (2016-2032)
- Figure 39: North America Software Asset Management Market Revenue (US$ Mn) Comparison by By Component (2016-2032)
- Figure 40: North America Software Asset Management Market Revenue (US$ Mn) Comparison by By deployment (2016-2032)
- Figure 41: North America Software Asset Management Market Revenue (US$ Mn) Comparison by By organization size (2016-2032)
- Figure 42: North America Software Asset Management Market Revenue (US$ Mn) Comparison by By vertical (2016-2032)
- Figure 43: North America Software Asset Management Market Y-o-Y Growth Rate Comparison by Country (2016-2032)
- Figure 44: North America Software Asset Management Market Y-o-Y Growth Rate Comparison by By Component (2016-2032)
- Figure 45: North America Software Asset Management Market Y-o-Y Growth Rate Comparison by By deployment (2016-2032)
- Figure 46: North America Software Asset Management Market Y-o-Y Growth Rate Comparison by By organization size (2016-2032)
- Figure 47: North America Software Asset Management Market Y-o-Y Growth Rate Comparison by By vertical (2016-2032)
- Figure 48: North America Software Asset Management Market Share Comparison by Country (2016-2032)
- Figure 49: North America Software Asset Management Market Share Comparison by By Component (2016-2032)
- Figure 50: North America Software Asset Management Market Share Comparison by By deployment (2016-2032)
- Figure 51: North America Software Asset Management Market Share Comparison by By organization size (2016-2032)
- Figure 52: North America Software Asset Management Market Share Comparison by By vertical (2016-2032)
- Figure 53: Western Europe Software Asset Management Market Revenue (US$ Mn) Market Share by By Componentin 2022
- Figure 54: Western Europe Software Asset Management Market Attractiveness Analysis by By Component, 2016-2032
- Figure 55: Western Europe Software Asset Management Market Revenue (US$ Mn) Market Share by By deploymentin 2022
- Figure 56: Western Europe Software Asset Management Market Attractiveness Analysis by By deployment, 2016-2032
- Figure 57: Western Europe Software Asset Management Market Revenue (US$ Mn) Market Share by By organization sizein 2022
- Figure 58: Western Europe Software Asset Management Market Attractiveness Analysis by By organization size, 2016-2032
- Figure 59: Western Europe Software Asset Management Market Revenue (US$ Mn) Market Share by By verticalin 2022
- Figure 60: Western Europe Software Asset Management Market Attractiveness Analysis by By vertical, 2016-2032
- Figure 61: Western Europe Software Asset Management Market Revenue (US$ Mn) Market Share by Country in 2022
- Figure 62: Western Europe Software Asset Management Market Attractiveness Analysis by Country, 2016-2032
- Figure 63: Western Europe Software Asset Management Market Revenue (US$ Mn) (2016-2032)
- Figure 64: Western Europe Software Asset Management Market Revenue (US$ Mn) Comparison by Country (2016-2032)
- Figure 65: Western Europe Software Asset Management Market Revenue (US$ Mn) Comparison by By Component (2016-2032)
- Figure 66: Western Europe Software Asset Management Market Revenue (US$ Mn) Comparison by By deployment (2016-2032)
- Figure 67: Western Europe Software Asset Management Market Revenue (US$ Mn) Comparison by By organization size (2016-2032)
- Figure 68: Western Europe Software Asset Management Market Revenue (US$ Mn) Comparison by By vertical (2016-2032)
- Figure 69: Western Europe Software Asset Management Market Y-o-Y Growth Rate Comparison by Country (2016-2032)
- Figure 70: Western Europe Software Asset Management Market Y-o-Y Growth Rate Comparison by By Component (2016-2032)
- Figure 71: Western Europe Software Asset Management Market Y-o-Y Growth Rate Comparison by By deployment (2016-2032)
- Figure 72: Western Europe Software Asset Management Market Y-o-Y Growth Rate Comparison by By organization size (2016-2032)
- Figure 73: Western Europe Software Asset Management Market Y-o-Y Growth Rate Comparison by By vertical (2016-2032)
- Figure 74: Western Europe Software Asset Management Market Share Comparison by Country (2016-2032)
- Figure 75: Western Europe Software Asset Management Market Share Comparison by By Component (2016-2032)
- Figure 76: Western Europe Software Asset Management Market Share Comparison by By deployment (2016-2032)
- Figure 77: Western Europe Software Asset Management Market Share Comparison by By organization size (2016-2032)
- Figure 78: Western Europe Software Asset Management Market Share Comparison by By vertical (2016-2032)
- Figure 79: Eastern Europe Software Asset Management Market Revenue (US$ Mn) Market Share by By Componentin 2022
- Figure 80: Eastern Europe Software Asset Management Market Attractiveness Analysis by By Component, 2016-2032
- Figure 81: Eastern Europe Software Asset Management Market Revenue (US$ Mn) Market Share by By deploymentin 2022
- Figure 82: Eastern Europe Software Asset Management Market Attractiveness Analysis by By deployment, 2016-2032
- Figure 83: Eastern Europe Software Asset Management Market Revenue (US$ Mn) Market Share by By organization sizein 2022
- Figure 84: Eastern Europe Software Asset Management Market Attractiveness Analysis by By organization size, 2016-2032
- Figure 85: Eastern Europe Software Asset Management Market Revenue (US$ Mn) Market Share by By verticalin 2022
- Figure 86: Eastern Europe Software Asset Management Market Attractiveness Analysis by By vertical, 2016-2032
- Figure 87: Eastern Europe Software Asset Management Market Revenue (US$ Mn) Market Share by Country in 2022
- Figure 88: Eastern Europe Software Asset Management Market Attractiveness Analysis by Country, 2016-2032
- Figure 89: Eastern Europe Software Asset Management Market Revenue (US$ Mn) (2016-2032)
- Figure 90: Eastern Europe Software Asset Management Market Revenue (US$ Mn) Comparison by Country (2016-2032)
- Figure 91: Eastern Europe Software Asset Management Market Revenue (US$ Mn) Comparison by By Component (2016-2032)
- Figure 92: Eastern Europe Software Asset Management Market Revenue (US$ Mn) Comparison by By deployment (2016-2032)
- Figure 93: Eastern Europe Software Asset Management Market Revenue (US$ Mn) Comparison by By organization size (2016-2032)
- Figure 94: Eastern Europe Software Asset Management Market Revenue (US$ Mn) Comparison by By vertical (2016-2032)
- Figure 95: Eastern Europe Software Asset Management Market Y-o-Y Growth Rate Comparison by Country (2016-2032)
- Figure 96: Eastern Europe Software Asset Management Market Y-o-Y Growth Rate Comparison by By Component (2016-2032)
- Figure 97: Eastern Europe Software Asset Management Market Y-o-Y Growth Rate Comparison by By deployment (2016-2032)
- Figure 98: Eastern Europe Software Asset Management Market Y-o-Y Growth Rate Comparison by By organization size (2016-2032)
- Figure 99: Eastern Europe Software Asset Management Market Y-o-Y Growth Rate Comparison by By vertical (2016-2032)
- Figure 100: Eastern Europe Software Asset Management Market Share Comparison by Country (2016-2032)
- Figure 101: Eastern Europe Software Asset Management Market Share Comparison by By Component (2016-2032)
- Figure 102: Eastern Europe Software Asset Management Market Share Comparison by By deployment (2016-2032)
- Figure 103: Eastern Europe Software Asset Management Market Share Comparison by By organization size (2016-2032)
- Figure 104: Eastern Europe Software Asset Management Market Share Comparison by By vertical (2016-2032)
- Figure 105: APAC Software Asset Management Market Revenue (US$ Mn) Market Share by By Componentin 2022
- Figure 106: APAC Software Asset Management Market Attractiveness Analysis by By Component, 2016-2032
- Figure 107: APAC Software Asset Management Market Revenue (US$ Mn) Market Share by By deploymentin 2022
- Figure 108: APAC Software Asset Management Market Attractiveness Analysis by By deployment, 2016-2032
- Figure 109: APAC Software Asset Management Market Revenue (US$ Mn) Market Share by By organization sizein 2022
- Figure 110: APAC Software Asset Management Market Attractiveness Analysis by By organization size, 2016-2032
- Figure 111: APAC Software Asset Management Market Revenue (US$ Mn) Market Share by By verticalin 2022
- Figure 112: APAC Software Asset Management Market Attractiveness Analysis by By vertical, 2016-2032
- Figure 113: APAC Software Asset Management Market Revenue (US$ Mn) Market Share by Country in 2022
- Figure 114: APAC Software Asset Management Market Attractiveness Analysis by Country, 2016-2032
- Figure 115: APAC Software Asset Management Market Revenue (US$ Mn) (2016-2032)
- Figure 116: APAC Software Asset Management Market Revenue (US$ Mn) Comparison by Country (2016-2032)
- Figure 117: APAC Software Asset Management Market Revenue (US$ Mn) Comparison by By Component (2016-2032)
- Figure 118: APAC Software Asset Management Market Revenue (US$ Mn) Comparison by By deployment (2016-2032)
- Figure 119: APAC Software Asset Management Market Revenue (US$ Mn) Comparison by By organization size (2016-2032)
- Figure 120: APAC Software Asset Management Market Revenue (US$ Mn) Comparison by By vertical (2016-2032)
- Figure 121: APAC Software Asset Management Market Y-o-Y Growth Rate Comparison by Country (2016-2032)
- Figure 122: APAC Software Asset Management Market Y-o-Y Growth Rate Comparison by By Component (2016-2032)
- Figure 123: APAC Software Asset Management Market Y-o-Y Growth Rate Comparison by By deployment (2016-2032)
- Figure 124: APAC Software Asset Management Market Y-o-Y Growth Rate Comparison by By organization size (2016-2032)
- Figure 125: APAC Software Asset Management Market Y-o-Y Growth Rate Comparison by By vertical (2016-2032)
- Figure 126: APAC Software Asset Management Market Share Comparison by Country (2016-2032)
- Figure 127: APAC Software Asset Management Market Share Comparison by By Component (2016-2032)
- Figure 128: APAC Software Asset Management Market Share Comparison by By deployment (2016-2032)
- Figure 129: APAC Software Asset Management Market Share Comparison by By organization size (2016-2032)
- Figure 130: APAC Software Asset Management Market Share Comparison by By vertical (2016-2032)
- Figure 131: Latin America Software Asset Management Market Revenue (US$ Mn) Market Share by By Componentin 2022
- Figure 132: Latin America Software Asset Management Market Attractiveness Analysis by By Component, 2016-2032
- Figure 133: Latin America Software Asset Management Market Revenue (US$ Mn) Market Share by By deploymentin 2022
- Figure 134: Latin America Software Asset Management Market Attractiveness Analysis by By deployment, 2016-2032
- Figure 135: Latin America Software Asset Management Market Revenue (US$ Mn) Market Share by By organization sizein 2022
- Figure 136: Latin America Software Asset Management Market Attractiveness Analysis by By organization size, 2016-2032
- Figure 137: Latin America Software Asset Management Market Revenue (US$ Mn) Market Share by By verticalin 2022
- Figure 138: Latin America Software Asset Management Market Attractiveness Analysis by By vertical, 2016-2032
- Figure 139: Latin America Software Asset Management Market Revenue (US$ Mn) Market Share by Country in 2022
- Figure 140: Latin America Software Asset Management Market Attractiveness Analysis by Country, 2016-2032
- Figure 141: Latin America Software Asset Management Market Revenue (US$ Mn) (2016-2032)
- Figure 142: Latin America Software Asset Management Market Revenue (US$ Mn) Comparison by Country (2016-2032)
- Figure 143: Latin America Software Asset Management Market Revenue (US$ Mn) Comparison by By Component (2016-2032)
- Figure 144: Latin America Software Asset Management Market Revenue (US$ Mn) Comparison by By deployment (2016-2032)
- Figure 145: Latin America Software Asset Management Market Revenue (US$ Mn) Comparison by By organization size (2016-2032)
- Figure 146: Latin America Software Asset Management Market Revenue (US$ Mn) Comparison by By vertical (2016-2032)
- Figure 147: Latin America Software Asset Management Market Y-o-Y Growth Rate Comparison by Country (2016-2032)
- Figure 148: Latin America Software Asset Management Market Y-o-Y Growth Rate Comparison by By Component (2016-2032)
- Figure 149: Latin America Software Asset Management Market Y-o-Y Growth Rate Comparison by By deployment (2016-2032)
- Figure 150: Latin America Software Asset Management Market Y-o-Y Growth Rate Comparison by By organization size (2016-2032)
- Figure 151: Latin America Software Asset Management Market Y-o-Y Growth Rate Comparison by By vertical (2016-2032)
- Figure 152: Latin America Software Asset Management Market Share Comparison by Country (2016-2032)
- Figure 153: Latin America Software Asset Management Market Share Comparison by By Component (2016-2032)
- Figure 154: Latin America Software Asset Management Market Share Comparison by By deployment (2016-2032)
- Figure 155: Latin America Software Asset Management Market Share Comparison by By organization size (2016-2032)
- Figure 156: Latin America Software Asset Management Market Share Comparison by By vertical (2016-2032)
- Figure 157: Middle East & Africa Software Asset Management Market Revenue (US$ Mn) Market Share by By Componentin 2022
- Figure 158: Middle East & Africa Software Asset Management Market Attractiveness Analysis by By Component, 2016-2032
- Figure 159: Middle East & Africa Software Asset Management Market Revenue (US$ Mn) Market Share by By deploymentin 2022
- Figure 160: Middle East & Africa Software Asset Management Market Attractiveness Analysis by By deployment, 2016-2032
- Figure 161: Middle East & Africa Software Asset Management Market Revenue (US$ Mn) Market Share by By organization sizein 2022
- Figure 162: Middle East & Africa Software Asset Management Market Attractiveness Analysis by By organization size, 2016-2032
- Figure 163: Middle East & Africa Software Asset Management Market Revenue (US$ Mn) Market Share by By verticalin 2022
- Figure 164: Middle East & Africa Software Asset Management Market Attractiveness Analysis by By vertical, 2016-2032
- Figure 165: Middle East & Africa Software Asset Management Market Revenue (US$ Mn) Market Share by Country in 2022
- Figure 166: Middle East & Africa Software Asset Management Market Attractiveness Analysis by Country, 2016-2032
- Figure 167: Middle East & Africa Software Asset Management Market Revenue (US$ Mn) (2016-2032)
- Figure 168: Middle East & Africa Software Asset Management Market Revenue (US$ Mn) Comparison by Country (2016-2032)
- Figure 169: Middle East & Africa Software Asset Management Market Revenue (US$ Mn) Comparison by By Component (2016-2032)
- Figure 170: Middle East & Africa Software Asset Management Market Revenue (US$ Mn) Comparison by By deployment (2016-2032)
- Figure 171: Middle East & Africa Software Asset Management Market Revenue (US$ Mn) Comparison by By organization size (2016-2032)
- Figure 172: Middle East & Africa Software Asset Management Market Revenue (US$ Mn) Comparison by By vertical (2016-2032)
- Figure 173: Middle East & Africa Software Asset Management Market Y-o-Y Growth Rate Comparison by Country (2016-2032)
- Figure 174: Middle East & Africa Software Asset Management Market Y-o-Y Growth Rate Comparison by By Component (2016-2032)
- Figure 175: Middle East & Africa Software Asset Management Market Y-o-Y Growth Rate Comparison by By deployment (2016-2032)
- Figure 176: Middle East & Africa Software Asset Management Market Y-o-Y Growth Rate Comparison by By organization size (2016-2032)
- Figure 177: Middle East & Africa Software Asset Management Market Y-o-Y Growth Rate Comparison by By vertical (2016-2032)
- Figure 178: Middle East & Africa Software Asset Management Market Share Comparison by Country (2016-2032)
- Figure 179: Middle East & Africa Software Asset Management Market Share Comparison by By Component (2016-2032)
- Figure 180: Middle East & Africa Software Asset Management Market Share Comparison by By deployment (2016-2032)
- Figure 181: Middle East & Africa Software Asset Management Market Share Comparison by By organization size (2016-2032)
- Figure 182: Middle East & Africa Software Asset Management Market Share Comparison by By vertical (2016-2032)
List of Tables
-
- Table 1: Global Software Asset Management Market Comparison by By Component (2016-2032)
- Table 2: Global Software Asset Management Market Comparison by By deployment (2016-2032)
- Table 3: Global Software Asset Management Market Comparison by By organization size (2016-2032)
- Table 4: Global Software Asset Management Market Comparison by By vertical (2016-2032)
- Table 5: Global Software Asset Management Market Revenue (US$ Mn) Comparison by Region (2016-2032)
- Table 6: Global Software Asset Management Market Revenue (US$ Mn) (2016-2032)
- Table 7: Global Software Asset Management Market Revenue (US$ Mn) Comparison by Region (2016-2032)
- Table 8: Global Software Asset Management Market Revenue (US$ Mn) Comparison by By Component (2016-2032)
- Table 9: Global Software Asset Management Market Revenue (US$ Mn) Comparison by By deployment (2016-2032)
- Table 10: Global Software Asset Management Market Revenue (US$ Mn) Comparison by By organization size (2016-2032)
- Table 11: Global Software Asset Management Market Revenue (US$ Mn) Comparison by By vertical (2016-2032)
- Table 12: Global Software Asset Management Market Y-o-Y Growth Rate Comparison by Region (2016-2032)
- Table 13: Global Software Asset Management Market Y-o-Y Growth Rate Comparison by By Component (2016-2032)
- Table 14: Global Software Asset Management Market Y-o-Y Growth Rate Comparison by By deployment (2016-2032)
- Table 15: Global Software Asset Management Market Y-o-Y Growth Rate Comparison by By organization size (2016-2032)
- Table 16: Global Software Asset Management Market Y-o-Y Growth Rate Comparison by By vertical (2016-2032)
- Table 17: Global Software Asset Management Market Share Comparison by Region (2016-2032)
- Table 18: Global Software Asset Management Market Share Comparison by By Component (2016-2032)
- Table 19: Global Software Asset Management Market Share Comparison by By deployment (2016-2032)
- Table 20: Global Software Asset Management Market Share Comparison by By organization size (2016-2032)
- Table 21: Global Software Asset Management Market Share Comparison by By vertical (2016-2032)
- Table 22: North America Software Asset Management Market Comparison by By deployment (2016-2032)
- Table 23: North America Software Asset Management Market Comparison by By organization size (2016-2032)
- Table 24: North America Software Asset Management Market Comparison by By vertical (2016-2032)
- Table 25: North America Software Asset Management Market Revenue (US$ Mn) Comparison by Country (2016-2032)
- Table 26: North America Software Asset Management Market Revenue (US$ Mn) (2016-2032)
- Table 27: North America Software Asset Management Market Revenue (US$ Mn) Comparison by Country (2016-2032)
- Table 28: North America Software Asset Management Market Revenue (US$ Mn) Comparison by By Component (2016-2032)
- Table 29: North America Software Asset Management Market Revenue (US$ Mn) Comparison by By deployment (2016-2032)
- Table 30: North America Software Asset Management Market Revenue (US$ Mn) Comparison by By organization size (2016-2032)
- Table 31: North America Software Asset Management Market Revenue (US$ Mn) Comparison by By vertical (2016-2032)
- Table 32: North America Software Asset Management Market Y-o-Y Growth Rate Comparison by Country (2016-2032)
- Table 33: North America Software Asset Management Market Y-o-Y Growth Rate Comparison by By Component (2016-2032)
- Table 34: North America Software Asset Management Market Y-o-Y Growth Rate Comparison by By deployment (2016-2032)
- Table 35: North America Software Asset Management Market Y-o-Y Growth Rate Comparison by By organization size (2016-2032)
- Table 36: North America Software Asset Management Market Y-o-Y Growth Rate Comparison by By vertical (2016-2032)
- Table 37: North America Software Asset Management Market Share Comparison by Country (2016-2032)
- Table 38: North America Software Asset Management Market Share Comparison by By Component (2016-2032)
- Table 39: North America Software Asset Management Market Share Comparison by By deployment (2016-2032)
- Table 40: North America Software Asset Management Market Share Comparison by By organization size (2016-2032)
- Table 41: North America Software Asset Management Market Share Comparison by By vertical (2016-2032)
- Table 42: Western Europe Software Asset Management Market Comparison by By Component (2016-2032)
- Table 43: Western Europe Software Asset Management Market Comparison by By deployment (2016-2032)
- Table 44: Western Europe Software Asset Management Market Comparison by By organization size (2016-2032)
- Table 45: Western Europe Software Asset Management Market Comparison by By vertical (2016-2032)
- Table 46: Western Europe Software Asset Management Market Revenue (US$ Mn) Comparison by Country (2016-2032)
- Table 47: Western Europe Software Asset Management Market Revenue (US$ Mn) (2016-2032)
- Table 48: Western Europe Software Asset Management Market Revenue (US$ Mn) Comparison by Country (2016-2032)
- Table 49: Western Europe Software Asset Management Market Revenue (US$ Mn) Comparison by By Component (2016-2032)
- Table 50: Western Europe Software Asset Management Market Revenue (US$ Mn) Comparison by By deployment (2016-2032)
- Table 51: Western Europe Software Asset Management Market Revenue (US$ Mn) Comparison by By organization size (2016-2032)
- Table 52: Western Europe Software Asset Management Market Revenue (US$ Mn) Comparison by By vertical (2016-2032)
- Table 53: Western Europe Software Asset Management Market Y-o-Y Growth Rate Comparison by Country (2016-2032)
- Table 54: Western Europe Software Asset Management Market Y-o-Y Growth Rate Comparison by By Component (2016-2032)
- Table 55: Western Europe Software Asset Management Market Y-o-Y Growth Rate Comparison by By deployment (2016-2032)
- Table 56: Western Europe Software Asset Management Market Y-o-Y Growth Rate Comparison by By organization size (2016-2032)
- Table 57: Western Europe Software Asset Management Market Y-o-Y Growth Rate Comparison by By vertical (2016-2032)
- Table 58: Western Europe Software Asset Management Market Share Comparison by Country (2016-2032)
- Table 59: Western Europe Software Asset Management Market Share Comparison by By Component (2016-2032)
- Table 60: Western Europe Software Asset Management Market Share Comparison by By deployment (2016-2032)
- Table 61: Western Europe Software Asset Management Market Share Comparison by By organization size (2016-2032)
- Table 62: Western Europe Software Asset Management Market Share Comparison by By vertical (2016-2032)
- Table 63: Eastern Europe Software Asset Management Market Comparison by By Component (2016-2032)
- Table 64: Eastern Europe Software Asset Management Market Comparison by By deployment (2016-2032)
- Table 65: Eastern Europe Software Asset Management Market Comparison by By organization size (2016-2032)
- Table 66: Eastern Europe Software Asset Management Market Comparison by By vertical (2016-2032)
- Table 67: Eastern Europe Software Asset Management Market Revenue (US$ Mn) Comparison by Country (2016-2032)
- Table 68: Eastern Europe Software Asset Management Market Revenue (US$ Mn) (2016-2032)
- Table 69: Eastern Europe Software Asset Management Market Revenue (US$ Mn) Comparison by Country (2016-2032)
- Table 70: Eastern Europe Software Asset Management Market Revenue (US$ Mn) Comparison by By Component (2016-2032)
- Table 71: Eastern Europe Software Asset Management Market Revenue (US$ Mn) Comparison by By deployment (2016-2032)
- Table 72: Eastern Europe Software Asset Management Market Revenue (US$ Mn) Comparison by By organization size (2016-2032)
- Table 73: Eastern Europe Software Asset Management Market Revenue (US$ Mn) Comparison by By vertical (2016-2032)
- Table 74: Eastern Europe Software Asset Management Market Y-o-Y Growth Rate Comparison by Country (2016-2032)
- Table 75: Eastern Europe Software Asset Management Market Y-o-Y Growth Rate Comparison by By Component (2016-2032)
- Table 76: Eastern Europe Software Asset Management Market Y-o-Y Growth Rate Comparison by By deployment (2016-2032)
- Table 77: Eastern Europe Software Asset Management Market Y-o-Y Growth Rate Comparison by By organization size (2016-2032)
- Table 78: Eastern Europe Software Asset Management Market Y-o-Y Growth Rate Comparison by By vertical (2016-2032)
- Table 79: Eastern Europe Software Asset Management Market Share Comparison by Country (2016-2032)
- Table 80: Eastern Europe Software Asset Management Market Share Comparison by By Component (2016-2032)
- Table 81: Eastern Europe Software Asset Management Market Share Comparison by By deployment (2016-2032)
- Table 82: Eastern Europe Software Asset Management Market Share Comparison by By organization size (2016-2032)
- Table 83: Eastern Europe Software Asset Management Market Share Comparison by By vertical (2016-2032)
- Table 84: APAC Software Asset Management Market Comparison by By Component (2016-2032)
- Table 85: APAC Software Asset Management Market Comparison by By deployment (2016-2032)
- Table 86: APAC Software Asset Management Market Comparison by By organization size (2016-2032)
- Table 87: APAC Software Asset Management Market Comparison by By vertical (2016-2032)
- Table 88: APAC Software Asset Management Market Revenue (US$ Mn) Comparison by Country (2016-2032)
- Table 89: APAC Software Asset Management Market Revenue (US$ Mn) (2016-2032)
- Table 90: APAC Software Asset Management Market Revenue (US$ Mn) Comparison by Country (2016-2032)
- Table 91: APAC Software Asset Management Market Revenue (US$ Mn) Comparison by By Component (2016-2032)
- Table 92: APAC Software Asset Management Market Revenue (US$ Mn) Comparison by By deployment (2016-2032)
- Table 93: APAC Software Asset Management Market Revenue (US$ Mn) Comparison by By organization size (2016-2032)
- Table 94: APAC Software Asset Management Market Revenue (US$ Mn) Comparison by By vertical (2016-2032)
- Table 95: APAC Software Asset Management Market Y-o-Y Growth Rate Comparison by Country (2016-2032)
- Table 96: APAC Software Asset Management Market Y-o-Y Growth Rate Comparison by By Component (2016-2032)
- Table 97: APAC Software Asset Management Market Y-o-Y Growth Rate Comparison by By deployment (2016-2032)
- Table 98: APAC Software Asset Management Market Y-o-Y Growth Rate Comparison by By organization size (2016-2032)
- Table 99: APAC Software Asset Management Market Y-o-Y Growth Rate Comparison by By vertical (2016-2032)
- Table 100: APAC Software Asset Management Market Share Comparison by Country (2016-2032)
- Table 101: APAC Software Asset Management Market Share Comparison by By Component (2016-2032)
- Table 102: APAC Software Asset Management Market Share Comparison by By deployment (2016-2032)
- Table 103: APAC Software Asset Management Market Share Comparison by By organization size (2016-2032)
- Table 104: APAC Software Asset Management Market Share Comparison by By vertical (2016-2032)
- Table 105: Latin America Software Asset Management Market Comparison by By Component (2016-2032)
- Table 106: Latin America Software Asset Management Market Comparison by By deployment (2016-2032)
- Table 107: Latin America Software Asset Management Market Comparison by By organization size (2016-2032)
- Table 108: Latin America Software Asset Management Market Comparison by By vertical (2016-2032)
- Table 109: Latin America Software Asset Management Market Revenue (US$ Mn) Comparison by Country (2016-2032)
- Table 110: Latin America Software Asset Management Market Revenue (US$ Mn) (2016-2032)
- Table 111: Latin America Software Asset Management Market Revenue (US$ Mn) Comparison by Country (2016-2032)
- Table 112: Latin America Software Asset Management Market Revenue (US$ Mn) Comparison by By Component (2016-2032)
- Table 113: Latin America Software Asset Management Market Revenue (US$ Mn) Comparison by By deployment (2016-2032)
- Table 114: Latin America Software Asset Management Market Revenue (US$ Mn) Comparison by By organization size (2016-2032)
- Table 115: Latin America Software Asset Management Market Revenue (US$ Mn) Comparison by By vertical (2016-2032)
- Table 116: Latin America Software Asset Management Market Y-o-Y Growth Rate Comparison by Country (2016-2032)
- Table 117: Latin America Software Asset Management Market Y-o-Y Growth Rate Comparison by By Component (2016-2032)
- Table 118: Latin America Software Asset Management Market Y-o-Y Growth Rate Comparison by By deployment (2016-2032)
- Table 119: Latin America Software Asset Management Market Y-o-Y Growth Rate Comparison by By organization size (2016-2032)
- Table 120: Latin America Software Asset Management Market Y-o-Y Growth Rate Comparison by By vertical (2016-2032)
- Table 121: Latin America Software Asset Management Market Share Comparison by Country (2016-2032)
- Table 122: Latin America Software Asset Management Market Share Comparison by By Component (2016-2032)
- Table 123: Latin America Software Asset Management Market Share Comparison by By deployment (2016-2032)
- Table 124: Latin America Software Asset Management Market Share Comparison by By organization size (2016-2032)
- Table 125: Latin America Software Asset Management Market Share Comparison by By vertical (2016-2032)
- Table 126: Middle East & Africa Software Asset Management Market Comparison by By Component (2016-2032)
- Table 127: Middle East & Africa Software Asset Management Market Comparison by By deployment (2016-2032)
- Table 128: Middle East & Africa Software Asset Management Market Comparison by By organization size (2016-2032)
- Table 129: Middle East & Africa Software Asset Management Market Comparison by By vertical (2016-2032)
- Table 130: Middle East & Africa Software Asset Management Market Revenue (US$ Mn) Comparison by Country (2016-2032)
- Table 131: Middle East & Africa Software Asset Management Market Revenue (US$ Mn) (2016-2032)
- Table 132: Middle East & Africa Software Asset Management Market Revenue (US$ Mn) Comparison by Country (2016-2032)
- Table 133: Middle East & Africa Software Asset Management Market Revenue (US$ Mn) Comparison by By Component (2016-2032)
- Table 134: Middle East & Africa Software Asset Management Market Revenue (US$ Mn) Comparison by By deployment (2016-2032)
- Table 135: Middle East & Africa Software Asset Management Market Revenue (US$ Mn) Comparison by By organization size (2016-2032)
- Table 136: Middle East & Africa Software Asset Management Market Revenue (US$ Mn) Comparison by By vertical (2016-2032)
- Table 137: Middle East & Africa Software Asset Management Market Y-o-Y Growth Rate Comparison by Country (2016-2032)
- Table 138: Middle East & Africa Software Asset Management Market Y-o-Y Growth Rate Comparison by By Component (2016-2032)
- Table 139: Middle East & Africa Software Asset Management Market Y-o-Y Growth Rate Comparison by By deployment (2016-2032)
- Table 140: Middle East & Africa Software Asset Management Market Y-o-Y Growth Rate Comparison by By organization size (2016-2032)
- Table 141: Middle East & Africa Software Asset Management Market Y-o-Y Growth Rate Comparison by By vertical (2016-2032)
- Table 142: Middle East & Africa Software Asset Management Market Share Comparison by Country (2016-2032)
- Table 143: Middle East & Africa Software Asset Management Market Share Comparison by By Component (2016-2032)
- Table 144: Middle East & Africa Software Asset Management Market Share Comparison by By deployment (2016-2032)
- Table 145: Middle East & Africa Software Asset Management Market Share Comparison by By organization size (2016-2032)
- Table 146: Middle East & Africa Software Asset Management Market Share Comparison by By vertical (2016-2032)
- 1. Executive Summary
-
- Microsoft Corporation
- CA Technologies
- BMC Software Inc.
- Symantec Corporation
- Aspera Technologies
- IBM Corporation
- Ivanti
- Micro Focus International plc
- Snow Software AB
Our Clients


View Our Licence Options
