
Smart Government Market By Type(Analytics, Security, Other), By Component(Solution, Service), By Deployment Mode(Cloud Based, On-Premise), By Region And Companies - Industry Segment Outlook, Market Assessment, Competition Scenario, Trends, And Forecast 2023-2032
-
12065
-
May 2023
-
174
-


-
This report was compiled by Vishwa Gaul Vishwa is an experienced market research and consulting professional with over 8 years of expertise in the ICT industry, contributing to over 700 reports across telecommunications, software, hardware, and digital solutions. Correspondence Team Lead- ICT Linkedin | Detailed Market research Methodology Our methodology involves a mix of primary research, including interviews with leading mental health experts, and secondary research from reputable medical journals and databases. View Detailed Methodology Page
-
Quick Navigation
Report Overview
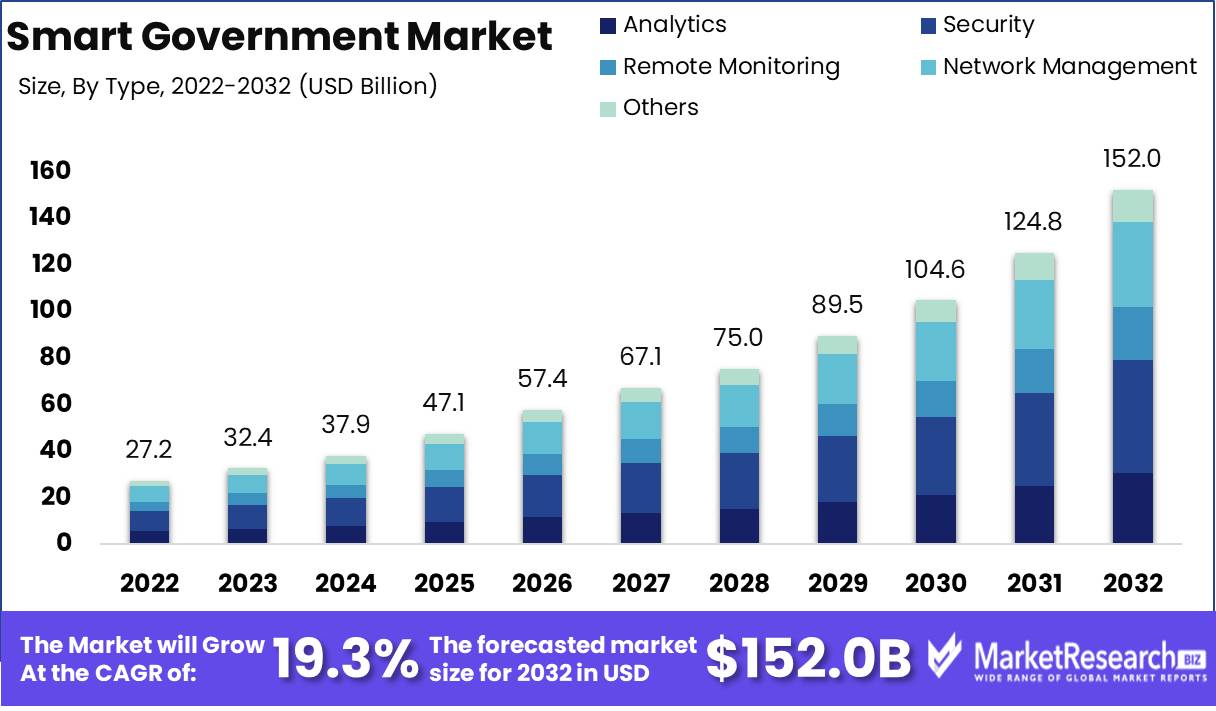
Smart Government Market size is expected to be worth around USD 152.0 Bn by 2032 from USD 27.2 Bn in 2022, growing at a CAGR of 19.3% during the forecast period from 2023 to 2032.
The concept of smart governments refers to the use of innovative technologies and inventive solutions to transform conventional government operations and enhance public services. The primary goal of smart governments is to improve efficiency, transparency, and responsiveness, resulting in more effective governance. In recent years, this emerging market has gained significant momentum, with governments around the globe investing more in it to reap its numerous benefits.
The ability to use your imagination to solve problems is what makes the Internet of Things so popular. Smart governments strive to expedite bureaucratic processes, combat corruption, encourage citizen participation, and improve service delivery by leveraging the power of technology. These initiatives may result in enhanced governance, increased public trust, and better resource allocation.
The integration of artificial intelligence (AI) and machine learning (ML) is a groundbreaking innovation in the smart government market. These technologies have the capability of automating mundane administrative duties, analyzing vast amounts of data to derive valuable insights, and facilitating predictive decision-making. For example, chatbots enabled by AI can provide immediate responses and assistance to citizens, reducing their reliance on human support.
Governments are also making substantial investments in the incorporation of smart solutions into a variety of products and services. For instance, Internet of Things (IoT) sensors are utilized by smart cities to monitor and manage infrastructure, optimize energy consumption, and enhance public safety. In a similar vein, smart transportation systems are utilizing technology to improve traffic management, lessen congestion, and enhance public transportation services.
The growth of the market for smart governments is driven by global digitization and connectivity. As more governments recognize the potential benefits of smart solutions, they are actively employing and implementing them in a variety of sectors. Sectors such as healthcare, education, transportation, and energy are anticipated to drive significant growth in the market in the coming years.
Globally, industries are investing in the smart government market in order to capitalize on its potential. Technology companies, consulting firms, and solution providers are creating and providing governments with innovative smart solutions. These solutions include data analytics, cybersecurity, e-governance, and platforms for citizen engagement.
Several factors are driving the growth of the market for smart government. Increasing demand for efficient and citizen-centric government services is one of the main drivers. Governments are under pressure to adopt innovative solutions that can satisfy the rising expectations of their citizens. In addition, technological advancements and the declining cost of technology have made smart solutions more accessible and implementable by governments.
Driving factors
Enhancing Digitization and Interconnectivity
As the world enters the digital era, increasing digitization and connectivity have become crucial determinants for the future of smart governments. The integration of technology and data enables governments to provide citizens with efficient and effective services. With the introduction of the Internet of Things (IoT) and the expansion of connectivity infrastructure, the potential for smart governments is expanding at an unprecedented rate.
Development of Smart City Projects
Smart city initiatives are at the vanguard of transforming conventional urban landscapes into highly interconnected and sustainable settings. These initiatives incorporate a variety of technological advancements that enhance the quality of life for citizens while optimizing resource allocation. The rise of smart city initiatives is directly related to the growth of the Smart Government Market, as governments endeavor to create digitally integrated cities that offer enhanced services and improved citizen experiences.
Technological advances in information and communication
Governments can expedite processes and enhance service delivery thanks to advancements in information and communication technologies (ICT). These advancements include the adoption of cloud computing, artificial intelligence (AI), big data analytics, and blockchain technology. AI-powered solutions can automate repetitive duties, whereas big data analytics offer valuable insights for evidence-based decision-making. Blockchain technology ensures secure and transparent transactions, reducing the likelihood of corruption. As governments perceive the opportunity to innovate and provide efficient citizen-centric services, the interaction of these technologies paves the way for the smart government market to flourish.
Increasing Government Concentration on Citizen-Centered Services
Governments throughout the globe are placing a greater emphasis on citizen-centric services, aiming to provide seamless, user-friendly interactions that cater to the diverse needs of their constituents. Governments can create platforms that facilitate interactions, consultations, and feedback mechanisms by leveraging technology. Digital government portals enable citizens to access services, submit applications, and monitor the status of their requests from the convenience of their residences or mobile devices. This customer-centric strategy is essential for boosting citizen engagement and satisfaction, thereby propelling the growth of the market for smart governments.
Restraining Factors
Concerns about data privacy and security
One of the primary concerns about the implementation of smart governments is privacy and data security. Governments need to ensure that comprehensive privacy policies and strong security measures are in place as more personal and sensitive information is collected and stored in digital databases. While data gathering allows governments to obtain useful insights and make data-driven choices, it also raises concerns about potential security breaches, unwanted access, and information misuse. Addressing these concerns is critical to gaining citizens' trust and promoting active involvement in smart government efforts.
Requirements for Regulatory and Compliance
Implementing smart governments frequently requires the integration of multiple technologies and platforms, which can result in complicated regulatory and compliance obligations. varying countries and areas have varying data protection, privacy, and cybersecurity laws and regulations. Compliance with international standards and frameworks becomes increasingly vital when smart governments traverse geographic boundaries. The ability to manage the regulatory landscape while maintaining a high standard of living is a must for any successful business.
Legacy's Obstacles Integration of Systems
The challenges associated with legacy system integration might stymie the shift from traditional government systems to smart governments. Governments frequently have legacy infrastructure, processes, and systems that are deeply ingrained in their operations. It can be difficult and time-consuming to integrate these legacy systems with modern smart technology. Furthermore, concerns with interoperability, data migration, and the need for considerable system upgrades can all be significant challenges. To avoid interruptions and ensure a smooth transition, governments need to properly prepare and implement their integration initiatives.
Type Analysis
In recent years, the Smart Government Market has grown significantly, with numerous categories emerging as main drivers of this upward trend. The security segment is one that has dominated the market. Emerging economies' economic prosperity has been critical in boosting the adoption of the security segment in smart governance. As these economies grow and expand, the need for strong security measures becomes even more apparent. Governments are heavily investing in cutting-edge security solutions to secure key infrastructure, safeguard national interests, and assure citizens' safety.
Consumer habits and behaviors also contribute to the security segment's dominance in the Smart Government Market. Individuals have become increasingly aware of the necessity for stronger security measures as digitalization and reliance on technology have increased. The public's demand for effective security solutions has driven governments to invest in innovative technologies capable of combating emerging threats and safeguarding sensitive data.
Component Analysis
The solution segment has emerged as a dominant force in the field of smart governance. Economic development in emerging markets has been a major driver of solution segment adoption. These countries are investing in innovative technologies to assist them achieve their aims of modernizing their administrative systems and improving governance. In these economies, solutions that automate procedures, facilitate data-driven decision-making, and improve public involvement are in great demand.
Consumer trends and behaviors also play an important impact in the solution segment's dominance in the Smart Government Market. Citizens are increasingly looking for government services that are more efficient and effective. They expect experiences that are consistent with their interactions with private-sector organizations. Consumer demand has compelled governments to invest in comprehensive solutions capable of meeting these expectations.
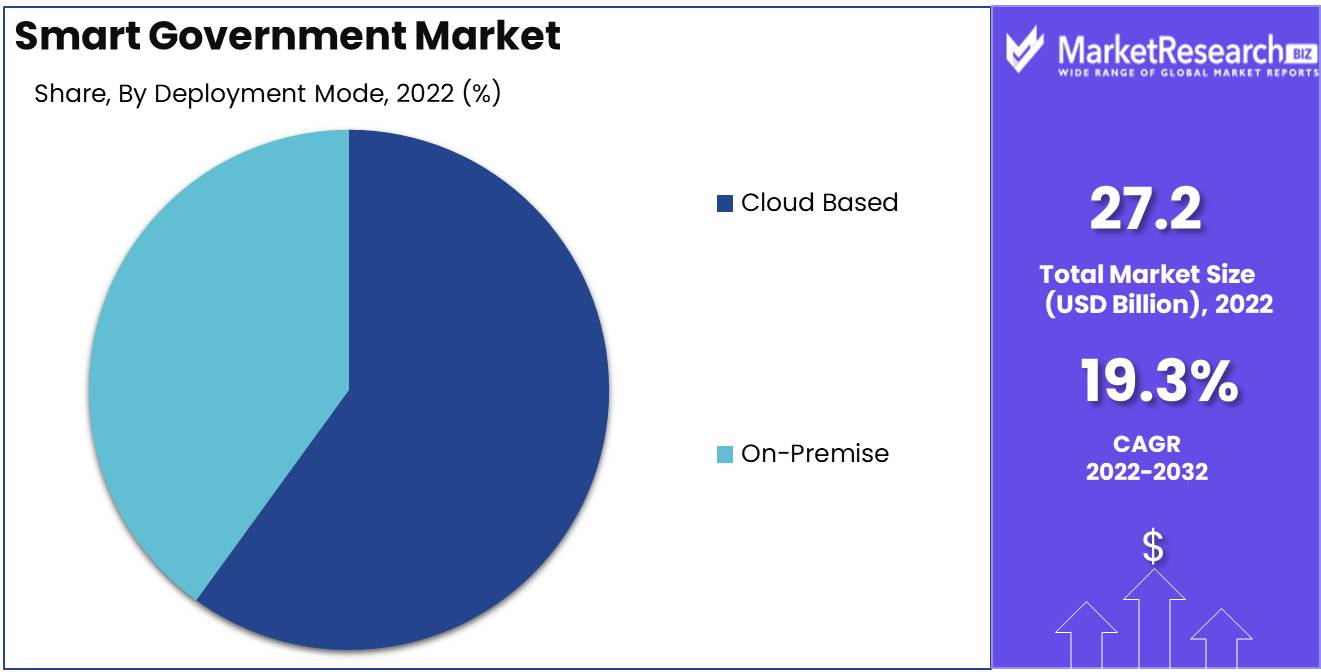
Deployment Mode Analysis
In the Smart Government Market, the cloud-based segment has emerged as the dominant deployment mode. Emerging economies' economic progress has aided in the adoption of cloud-based technologies in smart governance. Governments are looking for ways to maximize their resources and infrastructure as these economies grow. Cloud-based solutions allow them to take use of new technologies without requiring large upfront investments, making them an excellent alternative for growing economies.
Consumer habits and behaviors also contribute to cloud-based solutions' supremacy in the Smart Government Market. Citizens expect quick access to government services anytime, anywhere, as services become more digitized and reliant on mobile devices. Cloud-based deployment enables governments to deliver services and information to residents in a seamless manner, resulting in a great user experience.
Key Market Segments
By Type
- Analytics
- Security
- Remote Monitoring
- Network Management
- Other
By Component
- Solution
- Service
By Deployment Mode
- Cloud Based
- On-Premise
Growth Opportunity
Collaboration between technology providers and local governments
Collaboration is vital to smart governments. The use of technology to solve problems is a common practice, but it's also important to remember that the best way to solve problems is through collaboration. Engaging technology providers allows governments to take advantage of the most recent breakthroughs in fields such as artificial intelligence, blockchain, and the Internet of Things (IoT), laying the groundwork for improved service delivery.
AI and Machine Learning Adoption in Data Analytics
The intelligent use of data is becoming increasingly important in the public sector for effective decision-making. The use of artificial intelligence (AI) and machine learning to solve problems is a growing trend in the business world. AI-powered analytics enables predictive modeling, finding trends and patterns, and ultimately leading to better policy development and targeted service delivery.
Put an emphasis on citizen engagement and participation
Citizen participation and engagement are essential components of any successful smart government effort. Governments can develop a sense of ownership and empowerment among the public by including citizens in the decision-making process and soliciting their feedback. The ability to participate in online surveys, as well as the ability to send and receive messages, is a key component of the Internet of Things. This inclusive approach strengthens the relationship between governments and citizens, leading to greater trust, transparency, and, ultimately, more effective governance.
Investing in High-Growth Industries
Aside from the critical priority areas mentioned above, the Smart Government Market has the ability to develop into high-growth industries. Smart technologies, such as IoT and big data analytics, can significantly enhance sectors such as healthcare, transportation, and energy management. By forming partnerships and collaborations with industry leaders in these sectors, governments may use existing expertise, stimulate innovation, and deliver targeted solutions to specific sectoral concerns.
Latest Trends
E-government and digital service delivery are expanding.
E-governance, also known as electronic governance, is the use of information and communication technologies (ICTs) in government to improve service delivery and efficiency. With the rapid evolution of technology, governments throughout the world are rapidly embracing e-governance initiatives to streamline their operations and provide citizens with seamless digital services. This trend has grown particularly more important recently, as the COVID-19 epidemic has increased the demand for remote access to government services.
The use of e-governance in a variety of settings, such as tax filing, license applications, and permit requests, has made it possible for governments to digitize their procedures. Governments can provide citizens with simple and user-friendly ways to communicate with their services by utilizing online platforms and digital tools.
Smart Transportation and Infrastructure Management are in high demand.
The demand for smart transportation and infrastructure management systems grows as cities become more populated. Governments around the world are dealing with the challenges of traffic congestion, inadequate transportation systems, and aging infrastructure. As a result, they are increasingly relying on smart technologies to enhance transportation networks and boost mobility.
Intelligent traffic management systems, real-time traffic monitoring, integrated public transportation services, and smart parking systems are examples of smart transportation initiatives. The use of data from sensors, IoT devices, and the Internet of Things (IoT) to improve the quality of life is a common practice.
Use of Data Analytics in Policymaking and Decision Support
Data has evolved into a valuable tool for governments in the formulation of policies and the making of data-driven choices. The utilization of data analytics is critical in helping governments to obtain insights, spot patterns, and make educated decisions that have a substantial impact on the well-being of citizens and economic growth.
Governments may efficiently exploit huge volumes of data generated across multiple areas, such as healthcare, transportation, education, and public safety, through the deployment of modern analytics tools. It's possible to find out more about this by looking at the data.
Regional Analysis
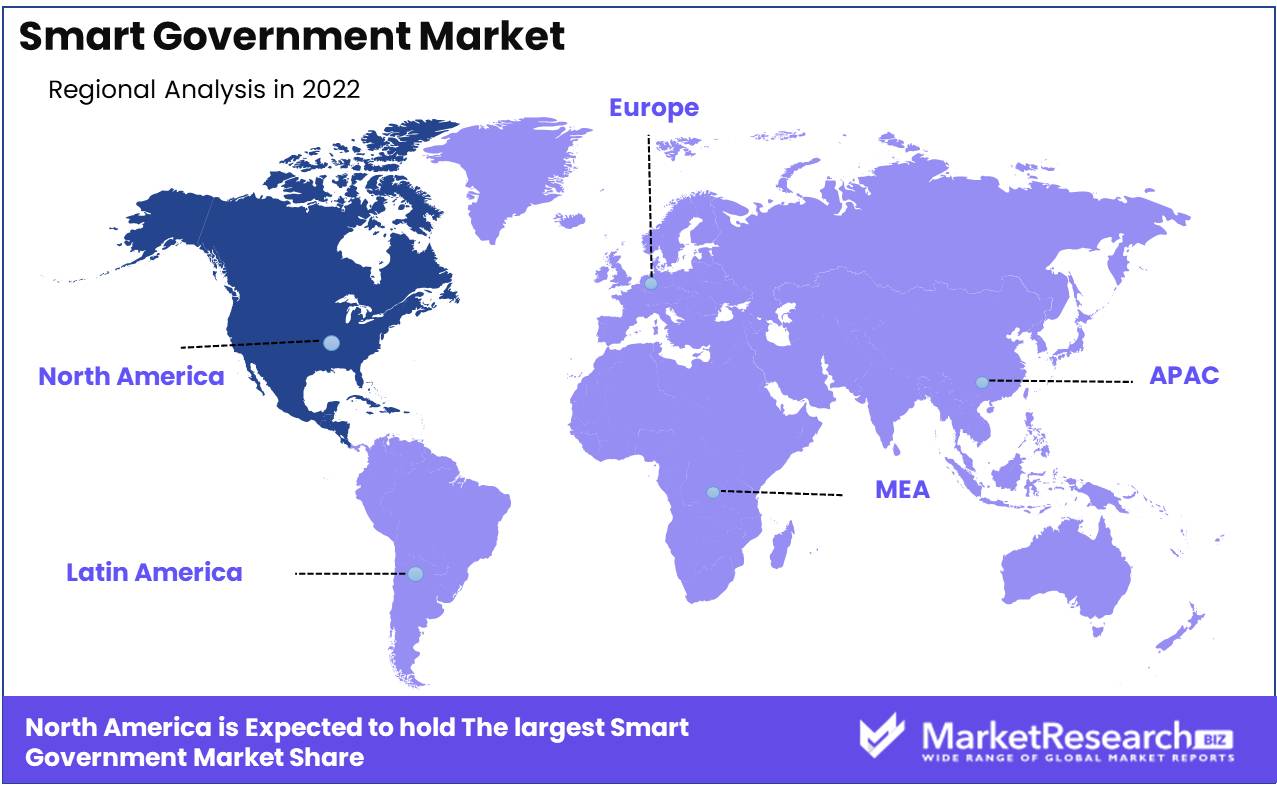
Smart Government Market is dominated by the North American region
Governments around the world are making enormous gains toward becoming smart governments in the quickly expanding digital environment. These smart governments are enhancing citizen services, optimizing resource allocation, and driving economic growth by leveraging modern technologies and data-driven insights. Among the numerous regions around the world, North America is the major participant in the Smart Government Market.
For decades, the North American region, which includes the United States and Canada, has been at the forefront of technical breakthroughs. North America has established a favorable environment for the establishment of smart governments through its robust infrastructure, mature markets, and proactive governance. This region is experiencing a spike in the adoption of smart government programs, establishing itself as a global leader in this field.
One of the primary elements contributing to North America's supremacy in the Smart Government Market is its strong emphasis on innovation and research. The region is home to vibrant technology clusters like Silicon Valley, which serve as breeding grounds for cutting-edge ideas and solutions. These innovation centers promote collaboration among government bodies, technology businesses, and academic institutions, resulting in the creation of ground-breaking smart solutions suited to the specific demands of governments and populations.
The region's robust digital infrastructure is another aspect contributing to North America's dominance. North America provides a good platform for the implementation of smart government solutions, with substantial broadband coverage, advanced telecommunications networks, and widespread internet access. This digital infrastructure allows governments to provide online services to residents, improve digital connectivity, and use data to make educated decisions.
Key Regions and Countries
North America
- US
- Canada
- Mexico
Western Europe
- Germany
- France
- The UK
- Spain
- Italy
- Portugal
- Ireland
- Austria
- Switzerland
- Benelux
- Nordic
- Rest of Western Europe
Eastern Europe
- Russia
- Poland
- The Czech Republic
- Greece
- Rest of Eastern Europe
APAC
- China
- Japan
- South Korea
- India
- Australia & New Zealand
- Indonesia
- Malaysia
- Philippines
- Singapore
- Thailand
- Vietnam
- Rest of APAC
Latin America
- Brazil
- Colombia
- Chile
- Argentina
- Costa Rica
- Rest of Latin America
Middle East & Africa
- Algeria
- Egypt
- Israel
- Kuwait
- Nigeria
- Saudi Arabia
- South Africa
- Turkey
- United Arab Emirates
- Rest of MEA
Key Players Analysis
Through its creative solutions, IBM has been instrumental in modernizing government processes. The company provides a comprehensive range of products and services designed to solve the unique difficulties that governments face around the world. The use of artificial intelligence (AI) and the Internet of Things (IoT) in the workplace is a growing trend.
Microsoft has played a critical role in enabling governments to effectively harness digital technologies. The company's diverse portfolio of products, which includes Azure Government Cloud, Office 365, and Dynamics 365, provides secure and scalable platforms for government agencies to update their infrastructure and deliver citizen-centric services. Microsoft's emphasis on interoperability and cooperation aids in the establishment of seamless communication and data sharing among various government organizations, enabling efficient governance at all levels.
Siemens AG has established itself as a leading participant in the market for smart governments by providing cutting-edge solutions that promote sustainable urban development. The competence of the company is in integrated systems that enable efficient energy management, intelligent transportation, and increased public safety. In order to improve the quality of life for its residents, the government has implemented a number of initiatives, including the use of smartphones and tablets.
ANSYS Inc is a world leader in smart governments, concentrating on simulation-driven digital transformation. Governments can analyze complicated systems, forecast outcomes, and make educated decisions with the use of the company's simulation software and engineering services. ANSYS helps governments plan and optimize critical infrastructure projects, strengthen disaster management strategies, and enhance overall operational resilience by utilizing the power of simulation.
Top Key Players in Smart Government Market
- IBM Corporation (U.S.)
- Microsoft (U.S.)
- Siemens AG (Germany)
- ANSYS Inc (U.S.)
- SAP SE (Germany)
- Oracle (U.S.)
- Robert Bosch GmbH (Germany)
- Swim.ai Inc. (U.S.)
- Atos S.E. (France)
- ABB (Switzerland)
- KELLTON TECH (India)
- AVEVA Group plc (U.K.)
- DXC Technology Company (U.S.)
- Altair Engineering Inc (U.S.)
- Hexaware Technologies Limited (India)
- Tata Consultancy Services Limited (India)
- Infosys Limited (India)
- NTT DATA Inc. (Japan)
- TIBCO Software Inc. (U.S.)
Recent Development
- In 2022, The UK unveiled a £1 billion smart government program. The UK government intends to use innovative technologies to streamline operations and give citizens maximum comfort as part of its ambition to modernize public services. The program aims to leverage a wide range of smart solutions, including artificial intelligence, data analytics, and IoT-enabled devices.
- In 2021, Singapore, stepping into the spotlight of innovation, unveiled its breakthrough smart government initiative. The program intends to build a seamless administration-citizen interaction model, with a heavy emphasis on leveraging technology to increase citizen engagement. Singapore seeks an improved public service experience for its inhabitants by combining emerging technologies such as blockchain, data analytics, and e-services.
- In 2020, The United States led the adoption of cutting-edge technologies in its smart government initiative, laying the groundwork for a digitally altered governance landscape. The program prioritized government efficiency by using a wide range of technological solutions to optimize administrative operations and improve service delivery. The comprehensive initiative aims to improve governmental responsiveness, minimize bureaucratic bottlenecks, and promote cost minimization by leveraging automation, cloud computing, and data-driven insights.
Report Scope:
Report Features Description Market Value (2022) USD 27.2 Bn Forecast Revenue (2032) USD 152 Bn CAGR (2023-2032) 19.3% Base Year for Estimation 2022 Historic Period 2016-2022 Forecast Period 2023-2032 Report Coverage Revenue Forecast, Market Dynamics, COVID-19 Impact, Competitive Landscape, Recent Developments Segments Covered By Type(Analytics, Security, Other), By Component(Solution, Service), By Deployment Mode(Cloud Based, On-Premise) Regional Analysis North America – The US, Canada, & Mexico; Western Europe – Germany, France, The UK, Spain, Italy, Portugal, Ireland, Austria, Switzerland, Benelux, Nordic, & Rest of Western Europe; Eastern Europe – Russia, Poland, The Czech Republic, Greece, & Rest of Eastern Europe; APAC – China, Japan, South Korea, India, Australia & New Zealand, Indonesia, Malaysia, Philippines, Singapore, Thailand, Vietnam, & Rest of APAC; Latin America – Brazil, Colombia, Chile, Argentina, Costa Rica, & Rest of Latin America; Middle East & Africa – Algeria, Egypt, Israel, Kuwait, Nigeria, Saudi Arabia, South Africa, Turkey, United Arab Emirates, & Rest of MEA Competitive Landscape IBM Corporation (U.S.), Microsoft (U.S.), Siemens AG (Germany), ANSYS Inc (U.S.), SAP SE (Germany), Oracle (U.S.), Robert Bosch GmbH (Germany), Swim.ai Inc. (U.S.), Atos S.E. (France), ABB (Switzerland), KELLTON TECH (India), AVEVA Group plc (U.K.), DXC Technology Company (U.S.), Altair Engineering Inc (U.S.), Hexaware Technologies Limited (India), Tata Consultancy Services Limited (India), Infosys Limited (India), NTT DATA Inc. (Japan), TIBCO Software Inc. (U.S.) Customization Scope Customization for segments, region/country-level will be provided. Moreover, additional customization can be done based on the requirements. Purchase Options We have three licenses to opt for: Single User License, Multi-User License (Up to 5 Users), Corporate Use License (Unlimited User and Printable PDF) -
- 1. Executive Summary
- 1.1. Definition
- 1.2. Taxonomy
- 1.3. Research Scope
- 1.4. Key Analysis
- 1.5. Key Findings by Major Segments
- 1.6. Top strategies by Major Players
- 2. Global Smart Government Marke Overview
- 2.1. Smart Government Marke Dynamics
- 2.1.1. Drivers
- 2.1.2. Opportunities
- 2.1.3. Restraints
- 2.1.4. Challenges
- 2.2. Macro-economic Factors
- 2.3. Regulatory Framework
- 2.4. Market Investment Feasibility Index
- 2.5. PEST Analysis
- 2.6. PORTER’S Five Force Analysis
- 2.7. Drivers & Restraints Impact Analysis
- 2.8. Industry Chain Analysis
- 2.9. Cost Structure Analysis
- 2.10. Marketing Strategy
- 2.11. Russia-Ukraine War Impact Analysis
- 2.12. Opportunity Map Analysis
- 2.13. Market Competition Scenario Analysis
- 2.14. Product Life Cycle Analysis
- 2.15. Opportunity Orbits
- 2.16. Manufacturer Intensity Map
- 2.17. Major Companies sales by Value & Volume
- 2.1. Smart Government Marke Dynamics
- 3. Global Smart Government Marke Analysis, Opportunity and Forecast, 2016-2032
- 3.1. Global Smart Government Marke Analysis, 2016-2021
- 3.2. Global Smart Government Marke Opportunity and Forecast, 2023-2032
- 3.3. Global Smart Government Marke Analysis, Opportunity and Forecast, By By Type, 2016-2032
- 3.3.1. Global Smart Government Marke Analysis by By Type: Introduction
- 3.3.2. Market Size Absolute $ Opportunity Analysis and Forecast, By By Type, 2016-2032
- 3.3.3. Analytics
- 3.3.4. Security
- 3.3.5. Remote Monitoring
- 3.3.6. Network Management
- 3.3.7. Other
- 3.4. Global Smart Government Marke Analysis, Opportunity and Forecast, By By Component, 2016-2032
- 3.4.1. Global Smart Government Marke Analysis by By Component: Introduction
- 3.4.2. Market Size Absolute $ Opportunity Analysis and Forecast, By By Component, 2016-2032
- 3.4.3. Solution
- 3.4.4. Service
- 3.5. Global Smart Government Marke Analysis, Opportunity and Forecast, By By Deployment Mode, 2016-2032
- 3.5.1. Global Smart Government Marke Analysis by By Deployment Mode: Introduction
- 3.5.2. Market Size Absolute $ Opportunity Analysis and Forecast, By By Deployment Mode, 2016-2032
- 3.5.3. Cloud Based
- 3.5.4. On-Premise
- 4. North America Smart Government Marke Analysis, Opportunity and Forecast, 2016-2032
- 4.1. North America Smart Government Marke Analysis, 2016-2021
- 4.2. North America Smart Government Marke Opportunity and Forecast, 2023-2032
- 4.3. North America Smart Government Marke Analysis, Opportunity and Forecast, By By Type, 2016-2032
- 4.3.1. North America Smart Government Marke Analysis by By Type: Introduction
- 4.3.2. Market Size Absolute $ Opportunity Analysis and Forecast, By By Type, 2016-2032
- 4.3.3. Analytics
- 4.3.4. Security
- 4.3.5. Remote Monitoring
- 4.3.6. Network Management
- 4.3.7. Other
- 4.4. North America Smart Government Marke Analysis, Opportunity and Forecast, By By Component, 2016-2032
- 4.4.1. North America Smart Government Marke Analysis by By Component: Introduction
- 4.4.2. Market Size Absolute $ Opportunity Analysis and Forecast, By By Component, 2016-2032
- 4.4.3. Solution
- 4.4.4. Service
- 4.5. North America Smart Government Marke Analysis, Opportunity and Forecast, By By Deployment Mode, 2016-2032
- 4.5.1. North America Smart Government Marke Analysis by By Deployment Mode: Introduction
- 4.5.2. Market Size Absolute $ Opportunity Analysis and Forecast, By By Deployment Mode, 2016-2032
- 4.5.3. Cloud Based
- 4.5.4. On-Premise
- 4.6. North America Smart Government Marke Analysis, Opportunity and Forecast, By Country , 2016-2032
- 4.6.1. North America Smart Government Marke Analysis by Country : Introduction
- 4.6.2. Market Size Absolute $ Opportunity Analysis and Forecast, Country , 2016-2032
- 4.6.2.1. The US
- 4.6.2.2. Canada
- 4.6.2.3. Mexico
- 5. Western Europe Smart Government Marke Analysis, Opportunity and Forecast, 2016-2032
- 5.1. Western Europe Smart Government Marke Analysis, 2016-2021
- 5.2. Western Europe Smart Government Marke Opportunity and Forecast, 2023-2032
- 5.3. Western Europe Smart Government Marke Analysis, Opportunity and Forecast, By By Type, 2016-2032
- 5.3.1. Western Europe Smart Government Marke Analysis by By Type: Introduction
- 5.3.2. Market Size Absolute $ Opportunity Analysis and Forecast, By By Type, 2016-2032
- 5.3.3. Analytics
- 5.3.4. Security
- 5.3.5. Remote Monitoring
- 5.3.6. Network Management
- 5.3.7. Other
- 5.4. Western Europe Smart Government Marke Analysis, Opportunity and Forecast, By By Component, 2016-2032
- 5.4.1. Western Europe Smart Government Marke Analysis by By Component: Introduction
- 5.4.2. Market Size Absolute $ Opportunity Analysis and Forecast, By By Component, 2016-2032
- 5.4.3. Solution
- 5.4.4. Service
- 5.5. Western Europe Smart Government Marke Analysis, Opportunity and Forecast, By By Deployment Mode, 2016-2032
- 5.5.1. Western Europe Smart Government Marke Analysis by By Deployment Mode: Introduction
- 5.5.2. Market Size Absolute $ Opportunity Analysis and Forecast, By By Deployment Mode, 2016-2032
- 5.5.3. Cloud Based
- 5.5.4. On-Premise
- 5.6. Western Europe Smart Government Marke Analysis, Opportunity and Forecast, By Country , 2016-2032
- 5.6.1. Western Europe Smart Government Marke Analysis by Country : Introduction
- 5.6.2. Market Size Absolute $ Opportunity Analysis and Forecast, Country , 2016-2032
- 5.6.2.1. Germany
- 5.6.2.2. France
- 5.6.2.3. The UK
- 5.6.2.4. Spain
- 5.6.2.5. Italy
- 5.6.2.6. Portugal
- 5.6.2.7. Ireland
- 5.6.2.8. Austria
- 5.6.2.9. Switzerland
- 5.6.2.10. Benelux
- 5.6.2.11. Nordic
- 5.6.2.12. Rest of Western Europe
- 6. Eastern Europe Smart Government Marke Analysis, Opportunity and Forecast, 2016-2032
- 6.1. Eastern Europe Smart Government Marke Analysis, 2016-2021
- 6.2. Eastern Europe Smart Government Marke Opportunity and Forecast, 2023-2032
- 6.3. Eastern Europe Smart Government Marke Analysis, Opportunity and Forecast, By By Type, 2016-2032
- 6.3.1. Eastern Europe Smart Government Marke Analysis by By Type: Introduction
- 6.3.2. Market Size Absolute $ Opportunity Analysis and Forecast, By By Type, 2016-2032
- 6.3.3. Analytics
- 6.3.4. Security
- 6.3.5. Remote Monitoring
- 6.3.6. Network Management
- 6.3.7. Other
- 6.4. Eastern Europe Smart Government Marke Analysis, Opportunity and Forecast, By By Component, 2016-2032
- 6.4.1. Eastern Europe Smart Government Marke Analysis by By Component: Introduction
- 6.4.2. Market Size Absolute $ Opportunity Analysis and Forecast, By By Component, 2016-2032
- 6.4.3. Solution
- 6.4.4. Service
- 6.5. Eastern Europe Smart Government Marke Analysis, Opportunity and Forecast, By By Deployment Mode, 2016-2032
- 6.5.1. Eastern Europe Smart Government Marke Analysis by By Deployment Mode: Introduction
- 6.5.2. Market Size Absolute $ Opportunity Analysis and Forecast, By By Deployment Mode, 2016-2032
- 6.5.3. Cloud Based
- 6.5.4. On-Premise
- 6.6. Eastern Europe Smart Government Marke Analysis, Opportunity and Forecast, By Country , 2016-2032
- 6.6.1. Eastern Europe Smart Government Marke Analysis by Country : Introduction
- 6.6.2. Market Size Absolute $ Opportunity Analysis and Forecast, Country , 2016-2032
- 6.6.2.1. Russia
- 6.6.2.2. Poland
- 6.6.2.3. The Czech Republic
- 6.6.2.4. Greece
- 6.6.2.5. Rest of Eastern Europe
- 7. APAC Smart Government Marke Analysis, Opportunity and Forecast, 2016-2032
- 7.1. APAC Smart Government Marke Analysis, 2016-2021
- 7.2. APAC Smart Government Marke Opportunity and Forecast, 2023-2032
- 7.3. APAC Smart Government Marke Analysis, Opportunity and Forecast, By By Type, 2016-2032
- 7.3.1. APAC Smart Government Marke Analysis by By Type: Introduction
- 7.3.2. Market Size Absolute $ Opportunity Analysis and Forecast, By By Type, 2016-2032
- 7.3.3. Analytics
- 7.3.4. Security
- 7.3.5. Remote Monitoring
- 7.3.6. Network Management
- 7.3.7. Other
- 7.4. APAC Smart Government Marke Analysis, Opportunity and Forecast, By By Component, 2016-2032
- 7.4.1. APAC Smart Government Marke Analysis by By Component: Introduction
- 7.4.2. Market Size Absolute $ Opportunity Analysis and Forecast, By By Component, 2016-2032
- 7.4.3. Solution
- 7.4.4. Service
- 7.5. APAC Smart Government Marke Analysis, Opportunity and Forecast, By By Deployment Mode, 2016-2032
- 7.5.1. APAC Smart Government Marke Analysis by By Deployment Mode: Introduction
- 7.5.2. Market Size Absolute $ Opportunity Analysis and Forecast, By By Deployment Mode, 2016-2032
- 7.5.3. Cloud Based
- 7.5.4. On-Premise
- 7.6. APAC Smart Government Marke Analysis, Opportunity and Forecast, By Country , 2016-2032
- 7.6.1. APAC Smart Government Marke Analysis by Country : Introduction
- 7.6.2. Market Size Absolute $ Opportunity Analysis and Forecast, Country , 2016-2032
- 7.6.2.1. China
- 7.6.2.2. Japan
- 7.6.2.3. South Korea
- 7.6.2.4. India
- 7.6.2.5. Australia & New Zeland
- 7.6.2.6. Indonesia
- 7.6.2.7. Malaysia
- 7.6.2.8. Philippines
- 7.6.2.9. Singapore
- 7.6.2.10. Thailand
- 7.6.2.11. Vietnam
- 7.6.2.12. Rest of APAC
- 8. Latin America Smart Government Marke Analysis, Opportunity and Forecast, 2016-2032
- 8.1. Latin America Smart Government Marke Analysis, 2016-2021
- 8.2. Latin America Smart Government Marke Opportunity and Forecast, 2023-2032
- 8.3. Latin America Smart Government Marke Analysis, Opportunity and Forecast, By By Type, 2016-2032
- 8.3.1. Latin America Smart Government Marke Analysis by By Type: Introduction
- 8.3.2. Market Size Absolute $ Opportunity Analysis and Forecast, By By Type, 2016-2032
- 8.3.3. Analytics
- 8.3.4. Security
- 8.3.5. Remote Monitoring
- 8.3.6. Network Management
- 8.3.7. Other
- 8.4. Latin America Smart Government Marke Analysis, Opportunity and Forecast, By By Component, 2016-2032
- 8.4.1. Latin America Smart Government Marke Analysis by By Component: Introduction
- 8.4.2. Market Size Absolute $ Opportunity Analysis and Forecast, By By Component, 2016-2032
- 8.4.3. Solution
- 8.4.4. Service
- 8.5. Latin America Smart Government Marke Analysis, Opportunity and Forecast, By By Deployment Mode, 2016-2032
- 8.5.1. Latin America Smart Government Marke Analysis by By Deployment Mode: Introduction
- 8.5.2. Market Size Absolute $ Opportunity Analysis and Forecast, By By Deployment Mode, 2016-2032
- 8.5.3. Cloud Based
- 8.5.4. On-Premise
- 8.6. Latin America Smart Government Marke Analysis, Opportunity and Forecast, By Country , 2016-2032
- 8.6.1. Latin America Smart Government Marke Analysis by Country : Introduction
- 8.6.2. Market Size Absolute $ Opportunity Analysis and Forecast, Country , 2016-2032
- 8.6.2.1. Brazil
- 8.6.2.2. Colombia
- 8.6.2.3. Chile
- 8.6.2.4. Argentina
- 8.6.2.5. Costa Rica
- 8.6.2.6. Rest of Latin America
- 9. Middle East & Africa Smart Government Marke Analysis, Opportunity and Forecast, 2016-2032
- 9.1. Middle East & Africa Smart Government Marke Analysis, 2016-2021
- 9.2. Middle East & Africa Smart Government Marke Opportunity and Forecast, 2023-2032
- 9.3. Middle East & Africa Smart Government Marke Analysis, Opportunity and Forecast, By By Type, 2016-2032
- 9.3.1. Middle East & Africa Smart Government Marke Analysis by By Type: Introduction
- 9.3.2. Market Size Absolute $ Opportunity Analysis and Forecast, By By Type, 2016-2032
- 9.3.3. Analytics
- 9.3.4. Security
- 9.3.5. Remote Monitoring
- 9.3.6. Network Management
- 9.3.7. Other
- 9.4. Middle East & Africa Smart Government Marke Analysis, Opportunity and Forecast, By By Component, 2016-2032
- 9.4.1. Middle East & Africa Smart Government Marke Analysis by By Component: Introduction
- 9.4.2. Market Size Absolute $ Opportunity Analysis and Forecast, By By Component, 2016-2032
- 9.4.3. Solution
- 9.4.4. Service
- 9.5. Middle East & Africa Smart Government Marke Analysis, Opportunity and Forecast, By By Deployment Mode, 2016-2032
- 9.5.1. Middle East & Africa Smart Government Marke Analysis by By Deployment Mode: Introduction
- 9.5.2. Market Size Absolute $ Opportunity Analysis and Forecast, By By Deployment Mode, 2016-2032
- 9.5.3. Cloud Based
- 9.5.4. On-Premise
- 9.6. Middle East & Africa Smart Government Marke Analysis, Opportunity and Forecast, By Country , 2016-2032
- 9.6.1. Middle East & Africa Smart Government Marke Analysis by Country : Introduction
- 9.6.2. Market Size Absolute $ Opportunity Analysis and Forecast, Country , 2016-2032
- 9.6.2.1. Algeria
- 9.6.2.2. Egypt
- 9.6.2.3. Israel
- 9.6.2.4. Kuwait
- 9.6.2.5. Nigeria
- 9.6.2.6. Saudi Arabia
- 9.6.2.7. South Africa
- 9.6.2.8. Turkey
- 9.6.2.9. The UAE
- 9.6.2.10. Rest of MEA
- 10. Global Smart Government Marke Analysis, Opportunity and Forecast, By Region , 2016-2032
- 10.1. Global Smart Government Marke Analysis by Region : Introduction
- 10.2. Market Size Absolute $ Opportunity Analysis and Forecast, By Region , 2016-2032
- 10.2.1. North America
- 10.2.2. Western Europe
- 10.2.3. Eastern Europe
- 10.2.4. APAC
- 10.2.5. Latin America
- 10.2.6. Middle East & Africa
- 11. Global Smart Government Marke Competitive Landscape, Market Share Analysis, and Company Profiles
- 11.1. Market Share Analysis
- 11.2. Company Profiles
- 11.3. IBM Corporation (U.S.)
- 11.3.1. Company Overview
- 11.3.2. Financial Highlights
- 11.3.3. Product Portfolio
- 11.3.4. SWOT Analysis
- 11.3.5. Key Strategies and Developments
- 11.4. Microsoft (U.S.)
- 11.4.1. Company Overview
- 11.4.2. Financial Highlights
- 11.4.3. Product Portfolio
- 11.4.4. SWOT Analysis
- 11.4.5. Key Strategies and Developments
- 11.5. Siemens AG (Germany)
- 11.5.1. Company Overview
- 11.5.2. Financial Highlights
- 11.5.3. Product Portfolio
- 11.5.4. SWOT Analysis
- 11.5.5. Key Strategies and Developments
- 11.6. ANSYS Inc (U.S.)
- 11.6.1. Company Overview
- 11.6.2. Financial Highlights
- 11.6.3. Product Portfolio
- 11.6.4. SWOT Analysis
- 11.6.5. Key Strategies and Developments
- 11.7. SAP SE (Germany)
- 11.7.1. Company Overview
- 11.7.2. Financial Highlights
- 11.7.3. Product Portfolio
- 11.7.4. SWOT Analysis
- 11.7.5. Key Strategies and Developments
- 11.8. Oracle (U.S.)
- 11.8.1. Company Overview
- 11.8.2. Financial Highlights
- 11.8.3. Product Portfolio
- 11.8.4. SWOT Analysis
- 11.8.5. Key Strategies and Developments
- 11.9. Robert Bosch GmbH (Germany)
- 11.9.1. Company Overview
- 11.9.2. Financial Highlights
- 11.9.3. Product Portfolio
- 11.9.4. SWOT Analysis
- 11.9.5. Key Strategies and Developments
- 11.10. Swim.ai Inc. (U.S.)
- 11.10.1. Company Overview
- 11.10.2. Financial Highlights
- 11.10.3. Product Portfolio
- 11.10.4. SWOT Analysis
- 11.10.5. Key Strategies and Developments
- 11.11. Atos S.E. (France)
- 11.11.1. Company Overview
- 11.11.2. Financial Highlights
- 11.11.3. Product Portfolio
- 11.11.4. SWOT Analysis
- 11.11.5. Key Strategies and Developments
- 11.12. ABB (Switzerland)
- 11.12.1. Company Overview
- 11.12.2. Financial Highlights
- 11.12.3. Product Portfolio
- 11.12.4. SWOT Analysis
- 11.12.5. Key Strategies and Developments
- 11.13. KELLTON TECH (India)
- 11.13.1. Company Overview
- 11.13.2. Financial Highlights
- 11.13.3. Product Portfolio
- 11.13.4. SWOT Analysis
- 11.13.5. Key Strategies and Developments
- 11.14. AVEVA Group plc (U.K.)
- 11.14.1. Company Overview
- 11.14.2. Financial Highlights
- 11.14.3. Product Portfolio
- 11.14.4. SWOT Analysis
- 11.14.5. Key Strategies and Developments
- 11.15. DXC Technology Company (U.S.)
- 11.15.1. Company Overview
- 11.15.2. Financial Highlights
- 11.15.3. Product Portfolio
- 11.15.4. SWOT Analysis
- 11.15.5. Key Strategies and Developments
- 11.16. Altair Engineering Inc (U.S.)
- 11.16.1. Company Overview
- 11.16.2. Financial Highlights
- 11.16.3. Product Portfolio
- 11.16.4. SWOT Analysis
- 11.16.5. Key Strategies and Developments
- 11.17. Hexaware Technologies Limited (India)
- 11.17.1. Company Overview
- 11.17.2. Financial Highlights
- 11.17.3. Product Portfolio
- 11.17.4. SWOT Analysis
- 11.17.5. Key Strategies and Developments
- 11.18. Tata Consultancy Services Limited (India)
- 11.18.1. Company Overview
- 11.18.2. Financial Highlights
- 11.18.3. Product Portfolio
- 11.18.4. SWOT Analysis
- 11.18.5. Key Strategies and Developments
- 11.19. Infosys Limited (India)
- 11.19.1. Company Overview
- 11.19.2. Financial Highlights
- 11.19.3. Product Portfolio
- 11.19.4. SWOT Analysis
- 11.19.5. Key Strategies and Developments
- 11.20. NTT DATA Inc. (Japan)
- 11.20.1. Company Overview
- 11.20.2. Financial Highlights
- 11.20.3. Product Portfolio
- 11.20.4. SWOT Analysis
- 11.20.5. Key Strategies and Developments
- 11.21. TIBCO Software Inc. (U.S.)
- 11.21.1. Company Overview
- 11.21.2. Financial Highlights
- 11.21.3. Product Portfolio
- 11.21.4. SWOT Analysis
- 11.21.5. Key Strategies and Developments
- 12. Assumptions and Acronyms
- 13. Research Methodology
- 14. Contact
List of Figures
-
- Figure 1: Global Smart Government Market Revenue (US$ Mn) Market Share by By Type in 2022
- Figure 2: Global Smart Government Market Attractiveness Analysis by By Type, 2016-2032
- Figure 3: Global Smart Government Market Revenue (US$ Mn) Market Share by By Componentin 2022
- Figure 4: Global Smart Government Market Attractiveness Analysis by By Component, 2016-2032
- Figure 5: Global Smart Government Market Revenue (US$ Mn) Market Share by By Deployment Modein 2022
- Figure 6: Global Smart Government Market Attractiveness Analysis by By Deployment Mode, 2016-2032
- Figure 7: Global Smart Government Market Revenue (US$ Mn) Market Share by Region in 2022
- Figure 8: Global Smart Government Market Attractiveness Analysis by Region, 2016-2032
- Figure 9: Global Smart Government Market Revenue (US$ Mn) (2016-2032)
- Figure 10: Global Smart Government Market Revenue (US$ Mn) Comparison by Region (2016-2032)
- Figure 11: Global Smart Government Market Revenue (US$ Mn) Comparison by By Type (2016-2032)
- Figure 12: Global Smart Government Market Revenue (US$ Mn) Comparison by By Component (2016-2032)
- Figure 13: Global Smart Government Market Revenue (US$ Mn) Comparison by By Deployment Mode (2016-2032)
- Figure 14: Global Smart Government Market Y-o-Y Growth Rate Comparison by Region (2016-2032)
- Figure 15: Global Smart Government Market Y-o-Y Growth Rate Comparison by By Type (2016-2032)
- Figure 16: Global Smart Government Market Y-o-Y Growth Rate Comparison by By Component (2016-2032)
- Figure 17: Global Smart Government Market Y-o-Y Growth Rate Comparison by By Deployment Mode (2016-2032)
- Figure 18: Global Smart Government Market Share Comparison by Region (2016-2032)
- Figure 19: Global Smart Government Market Share Comparison by By Type (2016-2032)
- Figure 20: Global Smart Government Market Share Comparison by By Component (2016-2032)
- Figure 21: Global Smart Government Market Share Comparison by By Deployment Mode (2016-2032)
- Figure 22: North America Smart Government Market Revenue (US$ Mn) Market Share by By Typein 2022
- Figure 23: North America Smart Government Market Attractiveness Analysis by By Type, 2016-2032
- Figure 24: North America Smart Government Market Revenue (US$ Mn) Market Share by By Componentin 2022
- Figure 25: North America Smart Government Market Attractiveness Analysis by By Component, 2016-2032
- Figure 26: North America Smart Government Market Revenue (US$ Mn) Market Share by By Deployment Modein 2022
- Figure 27: North America Smart Government Market Attractiveness Analysis by By Deployment Mode, 2016-2032
- Figure 28: North America Smart Government Market Revenue (US$ Mn) Market Share by Country in 2022
- Figure 29: North America Smart Government Market Attractiveness Analysis by Country, 2016-2032
- Figure 30: North America Smart Government Market Revenue (US$ Mn) (2016-2032)
- Figure 31: North America Smart Government Market Revenue (US$ Mn) Comparison by Country (2016-2032)
- Figure 32: North America Smart Government Market Revenue (US$ Mn) Comparison by By Type (2016-2032)
- Figure 33: North America Smart Government Market Revenue (US$ Mn) Comparison by By Component (2016-2032)
- Figure 34: North America Smart Government Market Revenue (US$ Mn) Comparison by By Deployment Mode (2016-2032)
- Figure 35: North America Smart Government Market Y-o-Y Growth Rate Comparison by Country (2016-2032)
- Figure 36: North America Smart Government Market Y-o-Y Growth Rate Comparison by By Type (2016-2032)
- Figure 37: North America Smart Government Market Y-o-Y Growth Rate Comparison by By Component (2016-2032)
- Figure 38: North America Smart Government Market Y-o-Y Growth Rate Comparison by By Deployment Mode (2016-2032)
- Figure 39: North America Smart Government Market Share Comparison by Country (2016-2032)
- Figure 40: North America Smart Government Market Share Comparison by By Type (2016-2032)
- Figure 41: North America Smart Government Market Share Comparison by By Component (2016-2032)
- Figure 42: North America Smart Government Market Share Comparison by By Deployment Mode (2016-2032)
- Figure 43: Western Europe Smart Government Market Revenue (US$ Mn) Market Share by By Typein 2022
- Figure 44: Western Europe Smart Government Market Attractiveness Analysis by By Type, 2016-2032
- Figure 45: Western Europe Smart Government Market Revenue (US$ Mn) Market Share by By Componentin 2022
- Figure 46: Western Europe Smart Government Market Attractiveness Analysis by By Component, 2016-2032
- Figure 47: Western Europe Smart Government Market Revenue (US$ Mn) Market Share by By Deployment Modein 2022
- Figure 48: Western Europe Smart Government Market Attractiveness Analysis by By Deployment Mode, 2016-2032
- Figure 49: Western Europe Smart Government Market Revenue (US$ Mn) Market Share by Country in 2022
- Figure 50: Western Europe Smart Government Market Attractiveness Analysis by Country, 2016-2032
- Figure 51: Western Europe Smart Government Market Revenue (US$ Mn) (2016-2032)
- Figure 52: Western Europe Smart Government Market Revenue (US$ Mn) Comparison by Country (2016-2032)
- Figure 53: Western Europe Smart Government Market Revenue (US$ Mn) Comparison by By Type (2016-2032)
- Figure 54: Western Europe Smart Government Market Revenue (US$ Mn) Comparison by By Component (2016-2032)
- Figure 55: Western Europe Smart Government Market Revenue (US$ Mn) Comparison by By Deployment Mode (2016-2032)
- Figure 56: Western Europe Smart Government Market Y-o-Y Growth Rate Comparison by Country (2016-2032)
- Figure 57: Western Europe Smart Government Market Y-o-Y Growth Rate Comparison by By Type (2016-2032)
- Figure 58: Western Europe Smart Government Market Y-o-Y Growth Rate Comparison by By Component (2016-2032)
- Figure 59: Western Europe Smart Government Market Y-o-Y Growth Rate Comparison by By Deployment Mode (2016-2032)
- Figure 60: Western Europe Smart Government Market Share Comparison by Country (2016-2032)
- Figure 61: Western Europe Smart Government Market Share Comparison by By Type (2016-2032)
- Figure 62: Western Europe Smart Government Market Share Comparison by By Component (2016-2032)
- Figure 63: Western Europe Smart Government Market Share Comparison by By Deployment Mode (2016-2032)
- Figure 64: Eastern Europe Smart Government Market Revenue (US$ Mn) Market Share by By Typein 2022
- Figure 65: Eastern Europe Smart Government Market Attractiveness Analysis by By Type, 2016-2032
- Figure 66: Eastern Europe Smart Government Market Revenue (US$ Mn) Market Share by By Componentin 2022
- Figure 67: Eastern Europe Smart Government Market Attractiveness Analysis by By Component, 2016-2032
- Figure 68: Eastern Europe Smart Government Market Revenue (US$ Mn) Market Share by By Deployment Modein 2022
- Figure 69: Eastern Europe Smart Government Market Attractiveness Analysis by By Deployment Mode, 2016-2032
- Figure 70: Eastern Europe Smart Government Market Revenue (US$ Mn) Market Share by Country in 2022
- Figure 71: Eastern Europe Smart Government Market Attractiveness Analysis by Country, 2016-2032
- Figure 72: Eastern Europe Smart Government Market Revenue (US$ Mn) (2016-2032)
- Figure 73: Eastern Europe Smart Government Market Revenue (US$ Mn) Comparison by Country (2016-2032)
- Figure 74: Eastern Europe Smart Government Market Revenue (US$ Mn) Comparison by By Type (2016-2032)
- Figure 75: Eastern Europe Smart Government Market Revenue (US$ Mn) Comparison by By Component (2016-2032)
- Figure 76: Eastern Europe Smart Government Market Revenue (US$ Mn) Comparison by By Deployment Mode (2016-2032)
- Figure 77: Eastern Europe Smart Government Market Y-o-Y Growth Rate Comparison by Country (2016-2032)
- Figure 78: Eastern Europe Smart Government Market Y-o-Y Growth Rate Comparison by By Type (2016-2032)
- Figure 79: Eastern Europe Smart Government Market Y-o-Y Growth Rate Comparison by By Component (2016-2032)
- Figure 80: Eastern Europe Smart Government Market Y-o-Y Growth Rate Comparison by By Deployment Mode (2016-2032)
- Figure 81: Eastern Europe Smart Government Market Share Comparison by Country (2016-2032)
- Figure 82: Eastern Europe Smart Government Market Share Comparison by By Type (2016-2032)
- Figure 83: Eastern Europe Smart Government Market Share Comparison by By Component (2016-2032)
- Figure 84: Eastern Europe Smart Government Market Share Comparison by By Deployment Mode (2016-2032)
- Figure 85: APAC Smart Government Market Revenue (US$ Mn) Market Share by By Typein 2022
- Figure 86: APAC Smart Government Market Attractiveness Analysis by By Type, 2016-2032
- Figure 87: APAC Smart Government Market Revenue (US$ Mn) Market Share by By Componentin 2022
- Figure 88: APAC Smart Government Market Attractiveness Analysis by By Component, 2016-2032
- Figure 89: APAC Smart Government Market Revenue (US$ Mn) Market Share by By Deployment Modein 2022
- Figure 90: APAC Smart Government Market Attractiveness Analysis by By Deployment Mode, 2016-2032
- Figure 91: APAC Smart Government Market Revenue (US$ Mn) Market Share by Country in 2022
- Figure 92: APAC Smart Government Market Attractiveness Analysis by Country, 2016-2032
- Figure 93: APAC Smart Government Market Revenue (US$ Mn) (2016-2032)
- Figure 94: APAC Smart Government Market Revenue (US$ Mn) Comparison by Country (2016-2032)
- Figure 95: APAC Smart Government Market Revenue (US$ Mn) Comparison by By Type (2016-2032)
- Figure 96: APAC Smart Government Market Revenue (US$ Mn) Comparison by By Component (2016-2032)
- Figure 97: APAC Smart Government Market Revenue (US$ Mn) Comparison by By Deployment Mode (2016-2032)
- Figure 98: APAC Smart Government Market Y-o-Y Growth Rate Comparison by Country (2016-2032)
- Figure 99: APAC Smart Government Market Y-o-Y Growth Rate Comparison by By Type (2016-2032)
- Figure 100: APAC Smart Government Market Y-o-Y Growth Rate Comparison by By Component (2016-2032)
- Figure 101: APAC Smart Government Market Y-o-Y Growth Rate Comparison by By Deployment Mode (2016-2032)
- Figure 102: APAC Smart Government Market Share Comparison by Country (2016-2032)
- Figure 103: APAC Smart Government Market Share Comparison by By Type (2016-2032)
- Figure 104: APAC Smart Government Market Share Comparison by By Component (2016-2032)
- Figure 105: APAC Smart Government Market Share Comparison by By Deployment Mode (2016-2032)
- Figure 106: Latin America Smart Government Market Revenue (US$ Mn) Market Share by By Typein 2022
- Figure 107: Latin America Smart Government Market Attractiveness Analysis by By Type, 2016-2032
- Figure 108: Latin America Smart Government Market Revenue (US$ Mn) Market Share by By Componentin 2022
- Figure 109: Latin America Smart Government Market Attractiveness Analysis by By Component, 2016-2032
- Figure 110: Latin America Smart Government Market Revenue (US$ Mn) Market Share by By Deployment Modein 2022
- Figure 111: Latin America Smart Government Market Attractiveness Analysis by By Deployment Mode, 2016-2032
- Figure 112: Latin America Smart Government Market Revenue (US$ Mn) Market Share by Country in 2022
- Figure 113: Latin America Smart Government Market Attractiveness Analysis by Country, 2016-2032
- Figure 114: Latin America Smart Government Market Revenue (US$ Mn) (2016-2032)
- Figure 115: Latin America Smart Government Market Revenue (US$ Mn) Comparison by Country (2016-2032)
- Figure 116: Latin America Smart Government Market Revenue (US$ Mn) Comparison by By Type (2016-2032)
- Figure 117: Latin America Smart Government Market Revenue (US$ Mn) Comparison by By Component (2016-2032)
- Figure 118: Latin America Smart Government Market Revenue (US$ Mn) Comparison by By Deployment Mode (2016-2032)
- Figure 119: Latin America Smart Government Market Y-o-Y Growth Rate Comparison by Country (2016-2032)
- Figure 120: Latin America Smart Government Market Y-o-Y Growth Rate Comparison by By Type (2016-2032)
- Figure 121: Latin America Smart Government Market Y-o-Y Growth Rate Comparison by By Component (2016-2032)
- Figure 122: Latin America Smart Government Market Y-o-Y Growth Rate Comparison by By Deployment Mode (2016-2032)
- Figure 123: Latin America Smart Government Market Share Comparison by Country (2016-2032)
- Figure 124: Latin America Smart Government Market Share Comparison by By Type (2016-2032)
- Figure 125: Latin America Smart Government Market Share Comparison by By Component (2016-2032)
- Figure 126: Latin America Smart Government Market Share Comparison by By Deployment Mode (2016-2032)
- Figure 127: Middle East & Africa Smart Government Market Revenue (US$ Mn) Market Share by By Typein 2022
- Figure 128: Middle East & Africa Smart Government Market Attractiveness Analysis by By Type, 2016-2032
- Figure 129: Middle East & Africa Smart Government Market Revenue (US$ Mn) Market Share by By Componentin 2022
- Figure 130: Middle East & Africa Smart Government Market Attractiveness Analysis by By Component, 2016-2032
- Figure 131: Middle East & Africa Smart Government Market Revenue (US$ Mn) Market Share by By Deployment Modein 2022
- Figure 132: Middle East & Africa Smart Government Market Attractiveness Analysis by By Deployment Mode, 2016-2032
- Figure 133: Middle East & Africa Smart Government Market Revenue (US$ Mn) Market Share by Country in 2022
- Figure 134: Middle East & Africa Smart Government Market Attractiveness Analysis by Country, 2016-2032
- Figure 135: Middle East & Africa Smart Government Market Revenue (US$ Mn) (2016-2032)
- Figure 136: Middle East & Africa Smart Government Market Revenue (US$ Mn) Comparison by Country (2016-2032)
- Figure 137: Middle East & Africa Smart Government Market Revenue (US$ Mn) Comparison by By Type (2016-2032)
- Figure 138: Middle East & Africa Smart Government Market Revenue (US$ Mn) Comparison by By Component (2016-2032)
- Figure 139: Middle East & Africa Smart Government Market Revenue (US$ Mn) Comparison by By Deployment Mode (2016-2032)
- Figure 140: Middle East & Africa Smart Government Market Y-o-Y Growth Rate Comparison by Country (2016-2032)
- Figure 141: Middle East & Africa Smart Government Market Y-o-Y Growth Rate Comparison by By Type (2016-2032)
- Figure 142: Middle East & Africa Smart Government Market Y-o-Y Growth Rate Comparison by By Component (2016-2032)
- Figure 143: Middle East & Africa Smart Government Market Y-o-Y Growth Rate Comparison by By Deployment Mode (2016-2032)
- Figure 144: Middle East & Africa Smart Government Market Share Comparison by Country (2016-2032)
- Figure 145: Middle East & Africa Smart Government Market Share Comparison by By Type (2016-2032)
- Figure 146: Middle East & Africa Smart Government Market Share Comparison by By Component (2016-2032)
- Figure 147: Middle East & Africa Smart Government Market Share Comparison by By Deployment Mode (2016-2032)
List of Tables
- Table 1: Global Smart Government Market Comparison by By Type (2016-2032)
- Table 2: Global Smart Government Market Comparison by By Component (2016-2032)
- Table 3: Global Smart Government Market Comparison by By Deployment Mode (2016-2032)
- Table 4: Global Smart Government Marke Revenue (US$ Mn) Comparison by Region (2016-2032)
- Table 5: Global Smart Government Market Revenue (US$ Mn) (2016-2032)
- Table 6: Global Smart Government Market Revenue (US$ Mn) Comparison by Region (2016-2032)
- Table 7: Global Smart Government Market Revenue (US$ Mn) Comparison by By Type (2016-2032)
- Table 8: Global Smart Government Market Revenue (US$ Mn) Comparison by By Component (2016-2032)
- Table 9: Global Smart Government Market Revenue (US$ Mn) Comparison by By Deployment Mode (2016-2032)
- Table 10: Global Smart Government Market Y-o-Y Growth Rate Comparison by Region (2016-2032)
- Table 11: Global Smart Government Market Y-o-Y Growth Rate Comparison by By Type (2016-2032)
- Table 12: Global Smart Government Market Y-o-Y Growth Rate Comparison by By Component (2016-2032)
- Table 13: Global Smart Government Market Y-o-Y Growth Rate Comparison by By Deployment Mode (2016-2032)
- Table 14: Global Smart Government Market Share Comparison by Region (2016-2032)
- Table 15: Global Smart Government Market Share Comparison by By Type (2016-2032)
- Table 16: Global Smart Government Market Share Comparison by By Component (2016-2032)
- Table 17: Global Smart Government Market Share Comparison by By Deployment Mode (2016-2032)
- Table 18: North America Smart Government Market Comparison by By Component (2016-2032)
- Table 19: North America Smart Government Market Comparison by By Deployment Mode (2016-2032)
- Table 20: North America Smart Government Marke Revenue (US$ Mn) Comparison by Country (2016-2032)
- Table 21: North America Smart Government Market Revenue (US$ Mn) (2016-2032)
- Table 22: North America Smart Government Market Revenue (US$ Mn) Comparison by Country (2016-2032)
- Table 23: North America Smart Government Market Revenue (US$ Mn) Comparison by By Type (2016-2032)
- Table 24: North America Smart Government Market Revenue (US$ Mn) Comparison by By Component (2016-2032)
- Table 25: North America Smart Government Market Revenue (US$ Mn) Comparison by By Deployment Mode (2016-2032)
- Table 26: North America Smart Government Market Y-o-Y Growth Rate Comparison by Country (2016-2032)
- Table 27: North America Smart Government Market Y-o-Y Growth Rate Comparison by By Type (2016-2032)
- Table 28: North America Smart Government Market Y-o-Y Growth Rate Comparison by By Component (2016-2032)
- Table 29: North America Smart Government Market Y-o-Y Growth Rate Comparison by By Deployment Mode (2016-2032)
- Table 30: North America Smart Government Market Share Comparison by Country (2016-2032)
- Table 31: North America Smart Government Market Share Comparison by By Type (2016-2032)
- Table 32: North America Smart Government Market Share Comparison by By Component (2016-2032)
- Table 33: North America Smart Government Market Share Comparison by By Deployment Mode (2016-2032)
- Table 34: Western Europe Smart Government Market Comparison by By Type (2016-2032)
- Table 35: Western Europe Smart Government Market Comparison by By Component (2016-2032)
- Table 36: Western Europe Smart Government Market Comparison by By Deployment Mode (2016-2032)
- Table 37: Western Europe Smart Government Marke Revenue (US$ Mn) Comparison by Country (2016-2032)
- Table 38: Western Europe Smart Government Market Revenue (US$ Mn) (2016-2032)
- Table 39: Western Europe Smart Government Market Revenue (US$ Mn) Comparison by Country (2016-2032)
- Table 40: Western Europe Smart Government Market Revenue (US$ Mn) Comparison by By Type (2016-2032)
- Table 41: Western Europe Smart Government Market Revenue (US$ Mn) Comparison by By Component (2016-2032)
- Table 42: Western Europe Smart Government Market Revenue (US$ Mn) Comparison by By Deployment Mode (2016-2032)
- Table 43: Western Europe Smart Government Market Y-o-Y Growth Rate Comparison by Country (2016-2032)
- Table 44: Western Europe Smart Government Market Y-o-Y Growth Rate Comparison by By Type (2016-2032)
- Table 45: Western Europe Smart Government Market Y-o-Y Growth Rate Comparison by By Component (2016-2032)
- Table 46: Western Europe Smart Government Market Y-o-Y Growth Rate Comparison by By Deployment Mode (2016-2032)
- Table 47: Western Europe Smart Government Market Share Comparison by Country (2016-2032)
- Table 48: Western Europe Smart Government Market Share Comparison by By Type (2016-2032)
- Table 49: Western Europe Smart Government Market Share Comparison by By Component (2016-2032)
- Table 50: Western Europe Smart Government Market Share Comparison by By Deployment Mode (2016-2032)
- Table 51: Eastern Europe Smart Government Market Comparison by By Type (2016-2032)
- Table 52: Eastern Europe Smart Government Market Comparison by By Component (2016-2032)
- Table 53: Eastern Europe Smart Government Market Comparison by By Deployment Mode (2016-2032)
- Table 54: Eastern Europe Smart Government Marke Revenue (US$ Mn) Comparison by Country (2016-2032)
- Table 55: Eastern Europe Smart Government Market Revenue (US$ Mn) (2016-2032)
- Table 56: Eastern Europe Smart Government Market Revenue (US$ Mn) Comparison by Country (2016-2032)
- Table 57: Eastern Europe Smart Government Market Revenue (US$ Mn) Comparison by By Type (2016-2032)
- Table 58: Eastern Europe Smart Government Market Revenue (US$ Mn) Comparison by By Component (2016-2032)
- Table 59: Eastern Europe Smart Government Market Revenue (US$ Mn) Comparison by By Deployment Mode (2016-2032)
- Table 60: Eastern Europe Smart Government Market Y-o-Y Growth Rate Comparison by Country (2016-2032)
- Table 61: Eastern Europe Smart Government Market Y-o-Y Growth Rate Comparison by By Type (2016-2032)
- Table 62: Eastern Europe Smart Government Market Y-o-Y Growth Rate Comparison by By Component (2016-2032)
- Table 63: Eastern Europe Smart Government Market Y-o-Y Growth Rate Comparison by By Deployment Mode (2016-2032)
- Table 64: Eastern Europe Smart Government Market Share Comparison by Country (2016-2032)
- Table 65: Eastern Europe Smart Government Market Share Comparison by By Type (2016-2032)
- Table 66: Eastern Europe Smart Government Market Share Comparison by By Component (2016-2032)
- Table 67: Eastern Europe Smart Government Market Share Comparison by By Deployment Mode (2016-2032)
- Table 68: APAC Smart Government Market Comparison by By Type (2016-2032)
- Table 69: APAC Smart Government Market Comparison by By Component (2016-2032)
- Table 70: APAC Smart Government Market Comparison by By Deployment Mode (2016-2032)
- Table 71: APAC Smart Government Marke Revenue (US$ Mn) Comparison by Country (2016-2032)
- Table 72: APAC Smart Government Market Revenue (US$ Mn) (2016-2032)
- Table 73: APAC Smart Government Market Revenue (US$ Mn) Comparison by Country (2016-2032)
- Table 74: APAC Smart Government Market Revenue (US$ Mn) Comparison by By Type (2016-2032)
- Table 75: APAC Smart Government Market Revenue (US$ Mn) Comparison by By Component (2016-2032)
- Table 76: APAC Smart Government Market Revenue (US$ Mn) Comparison by By Deployment Mode (2016-2032)
- Table 77: APAC Smart Government Market Y-o-Y Growth Rate Comparison by Country (2016-2032)
- Table 78: APAC Smart Government Market Y-o-Y Growth Rate Comparison by By Type (2016-2032)
- Table 79: APAC Smart Government Market Y-o-Y Growth Rate Comparison by By Component (2016-2032)
- Table 80: APAC Smart Government Market Y-o-Y Growth Rate Comparison by By Deployment Mode (2016-2032)
- Table 81: APAC Smart Government Market Share Comparison by Country (2016-2032)
- Table 82: APAC Smart Government Market Share Comparison by By Type (2016-2032)
- Table 83: APAC Smart Government Market Share Comparison by By Component (2016-2032)
- Table 84: APAC Smart Government Market Share Comparison by By Deployment Mode (2016-2032)
- Table 85: Latin America Smart Government Market Comparison by By Type (2016-2032)
- Table 86: Latin America Smart Government Market Comparison by By Component (2016-2032)
- Table 87: Latin America Smart Government Market Comparison by By Deployment Mode (2016-2032)
- Table 88: Latin America Smart Government Marke Revenue (US$ Mn) Comparison by Country (2016-2032)
- Table 89: Latin America Smart Government Market Revenue (US$ Mn) (2016-2032)
- Table 90: Latin America Smart Government Market Revenue (US$ Mn) Comparison by Country (2016-2032)
- Table 91: Latin America Smart Government Market Revenue (US$ Mn) Comparison by By Type (2016-2032)
- Table 92: Latin America Smart Government Market Revenue (US$ Mn) Comparison by By Component (2016-2032)
- Table 93: Latin America Smart Government Market Revenue (US$ Mn) Comparison by By Deployment Mode (2016-2032)
- Table 94: Latin America Smart Government Market Y-o-Y Growth Rate Comparison by Country (2016-2032)
- Table 95: Latin America Smart Government Market Y-o-Y Growth Rate Comparison by By Type (2016-2032)
- Table 96: Latin America Smart Government Market Y-o-Y Growth Rate Comparison by By Component (2016-2032)
- Table 97: Latin America Smart Government Market Y-o-Y Growth Rate Comparison by By Deployment Mode (2016-2032)
- Table 98: Latin America Smart Government Market Share Comparison by Country (2016-2032)
- Table 99: Latin America Smart Government Market Share Comparison by By Type (2016-2032)
- Table 100: Latin America Smart Government Market Share Comparison by By Component (2016-2032)
- Table 101: Latin America Smart Government Market Share Comparison by By Deployment Mode (2016-2032)
- Table 102: Middle East & Africa Smart Government Market Comparison by By Type (2016-2032)
- Table 103: Middle East & Africa Smart Government Market Comparison by By Component (2016-2032)
- Table 104: Middle East & Africa Smart Government Market Comparison by By Deployment Mode (2016-2032)
- Table 105: Middle East & Africa Smart Government Marke Revenue (US$ Mn) Comparison by Country (2016-2032)
- Table 106: Middle East & Africa Smart Government Market Revenue (US$ Mn) (2016-2032)
- Table 107: Middle East & Africa Smart Government Market Revenue (US$ Mn) Comparison by Country (2016-2032)
- Table 108: Middle East & Africa Smart Government Market Revenue (US$ Mn) Comparison by By Type (2016-2032)
- Table 109: Middle East & Africa Smart Government Market Revenue (US$ Mn) Comparison by By Component (2016-2032)
- Table 110: Middle East & Africa Smart Government Market Revenue (US$ Mn) Comparison by By Deployment Mode (2016-2032)
- Table 111: Middle East & Africa Smart Government Market Y-o-Y Growth Rate Comparison by Country (2016-2032)
- Table 112: Middle East & Africa Smart Government Market Y-o-Y Growth Rate Comparison by By Type (2016-2032)
- Table 113: Middle East & Africa Smart Government Market Y-o-Y Growth Rate Comparison by By Component (2016-2032)
- Table 114: Middle East & Africa Smart Government Market Y-o-Y Growth Rate Comparison by By Deployment Mode (2016-2032)
- Table 115: Middle East & Africa Smart Government Market Share Comparison by Country (2016-2032)
- Table 116: Middle East & Africa Smart Government Market Share Comparison by By Type (2016-2032)
- Table 117: Middle East & Africa Smart Government Market Share Comparison by By Component (2016-2032)
- Table 118: Middle East & Africa Smart Government Market Share Comparison by By Deployment Mode (2016-2032)
- 1. Executive Summary
-
- IBM Corporation (U.S.)
- Microsoft (U.S.)
- Siemens AG (Germany)
- ANSYS Inc (U.S.)
- SAP SE (Germany)
- Oracle (U.S.)
- Robert Bosch GmbH (Germany)
- Swim.ai Inc. (U.S.)
- Atos S.E. (France)
- ABB (Switzerland)
- KELLTON TECH (India)
- AVEVA Group plc (U.K.)
- DXC Technology Company (U.S.)
- Altair Engineering Inc (U.S.)
- Hexaware Technologies Limited (India)
- Tata Consultancy Services Limited (India)
- Infosys Limited (India)
- NTT DATA Inc. (Japan)
- TIBCO Software Inc. (U.S.)
Our Clients


View Our Licence Options
