Salicylic Acid Market Report By Form (Powder, Liquid), By Type (Natural, Synthetic), By Grade (Pharmaceutical, Cosmetic, Technical), By Application (Food and Beverage, Cosmetics and Personal Care, Pharmaceuticals, Others), By Region and Companies - Industry Segment Outlook, Market Assessment, Competition Scenario, Trends and Forecast 2024-2033
-
48271
-
July 2024
-
325
-


-
This report was compiled by Shreyas Rokade Shreyas Rokade is a seasoned Research Analyst with CMFE, bringing extensive expertise in market research and consulting, with a strong background in Chemical Engineering. Correspondence Team Lead-CMFE Linkedin | Detailed Market research Methodology Our methodology involves a mix of primary research, including interviews with leading mental health experts, and secondary research from reputable medical journals and databases. View Detailed Methodology Page
-
Quick Navigation
Report Overview
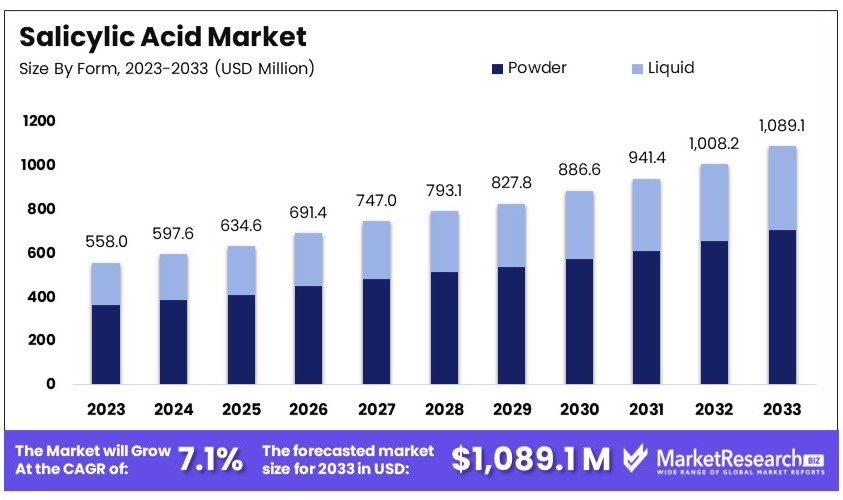
The Global Salicylic Acid Market size is expected to be worth around USD 1,089.1 Million by 2033, from USD 558.0 Million in 2023, growing at a CAGR of 7.1% during the forecast period from 2024 to 2033.
Salicylic Acid Market involves the production and distribution of a beta hydroxy acid used primarily in skincare and pharmaceutical applications. It is renowned for its efficacy in treating acne, psoriasis, and warts.
The cosmetic segment, driven by the demand for clear skin products, prominently fuels the market growth. Additionally, its use in haircare products to combat dandruff further diversifies its applications, making it a staple in personal care and medicinal formulations.
The global Salicylic Acid market exhibits dynamic growth trends and diverse regulatory environments across different regions. For instance, in 2023, China emerges as a key player, holding a significant share of the market in East Asia. The country's extensive production capabilities, coupled with its high consumption rates, notably influence global supply and demand dynamics.
Export and import dynamics also significantly influence the market, with Salicylic Acid, salts ranking as a notably traded product. China, France, and Germany are the leading exporters, which underscores the global nature of the market. Regulatory environments affect these dynamics, with an average tariff of 5.06% in 2018, marking Salicylic Acid as one of the lower tariff products, facilitating its global trade.
Moreover, the regulatory landscape across different countries imposes varied import duties and controls, further shaping the global market dynamics. For example, when importing goods into the Netherlands from outside the European Union (EU), businesses must comply with multiple taxes and duties, which are enforced by customs checks to regulate the market effectively.
These factors collectively influence the Salicylic Acid market, underpinning its growth, competitive landscape, and regional market shifts over the forecasted period.
Key Takeaways
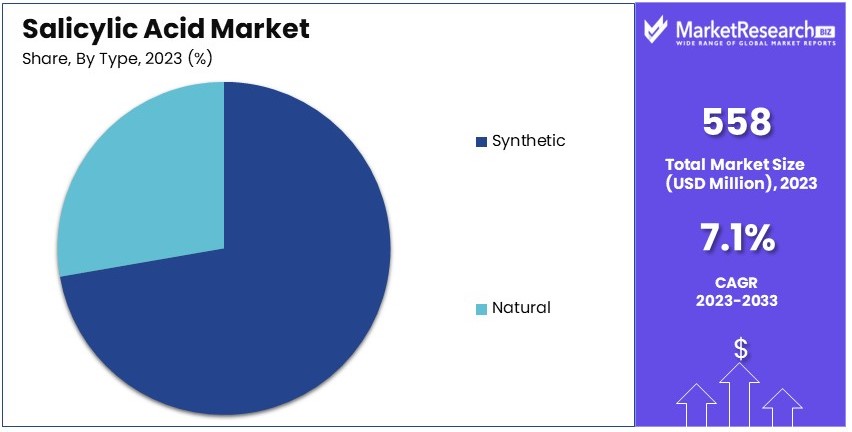
- Market Value: The Salicylic Acid Market was valued at USD 558.0 million in 2023 and is expected to reach USD 1,089.1 million by 2033, with a CAGR of 7.1%.
- By Form Analysis: Powder dominates with 65.3%; favored for its ease of formulation and stability.
- By Type Analysis: Synthetic leads with 73.3%; preferred due to consistent quality and scalability.
- By Grade Analysis: Pharmaceutical holds 54.3%; critical for meeting stringent industry standards.
- By Application Analysis: Pharmaceuticals dominate at 43.4%; essential for its widespread use in pain and fever reduction.
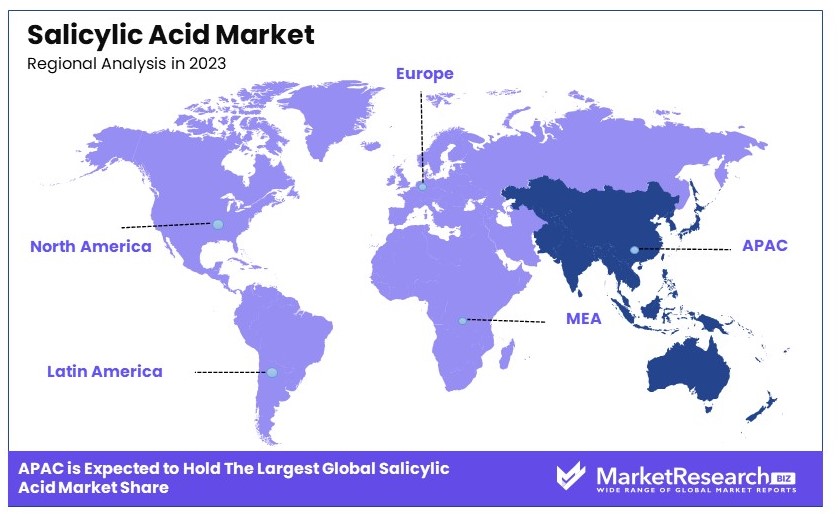
- Dominant Region: Asia Pacific with 43.3%; a major production hub with extensive industrial applications.
- Analyst Viewpoint: Market is growing steadily, driven by demand in pharmaceuticals and cosmetics, with innovation in synthetic formulations highlighted.
- Growth Opportunities: Development of bio-based salicylic acid could open new market segments, particularly in natural cosmetics.
Driving Factors
Increasing Demand from the Pharmaceutical Industry Drives Market Growth
Salicylic acid is widely used in the production of various pharmaceutical products, including acne drugs, anti-inflammatory drugs, and pain relievers. The rising prevalence of skin conditions like acne and the growing demand for over-the-counter and prescription medications are driving market growth. For example, topical salicylic acid treatments for acne have become increasingly popular due to their effectiveness in unclogging pores and reducing inflammation.
This rising demand from the pharmaceutical industry, combined with ongoing research and development, ensures continuous growth for the salicylic acid market. The synergy between the need for effective skin treatments and pharmaceutical advancements drives the expansion of the market, making salicylic acid a crucial ingredient in many medications.
Expanding Applications in Personal Care and Cosmetic Products Drive Market Growth
Salicylic acid is a popular ingredient in personal care and cosmetic products due to its exfoliating and keratolytic properties. The growing demand for anti-aging, skin-lightening, and acne-fighting products has fueled market growth. For instance, salicylic acid is commonly used in face washes, toners, and peels to improve skin texture and treat various skin conditions.
The personal care industry significantly impacts the salicylic acid market. The global skincare market was valued at USD 145.3 billion in 2020, reflecting the high demand for effective skincare solutions. Salicylic acid's ability to treat acne, exfoliate dead skin cells, and improve overall skin health makes it a preferred ingredient in many skincare products.
Rising Demand from the Food and Beverage Industry Drives Market Growth
Salicylic acid is used as a preservative and antimicrobial agent in the food and beverage industry. The increasing demand for shelf-stable and preservative-free products has driven market growth. For example, salicylic acid is used in the production of fruit juices, jams, and other food products to extend their shelf life and prevent microbial growth.
The food and beverage industry plays a crucial role in the salicylic acid market. The global market for food preservatives was valued at USD 2.6 billion in 2023, indicating a substantial demand for effective preservation solutions like salicylic acid. Its use in extending shelf life and ensuring food safety makes it an essential ingredient in many food products.
Restraining Factors
Limited Availability of Raw Materials Restrains Market Growth
The production of salicylic acid relies heavily on raw materials such as the bark of willow trees and phenol derived from petroleum sources. The limited availability and fluctuating prices of these raw materials significantly impact the production costs and supply chain of salicylic acid.
For example, disruptions in petroleum supply or overharvesting of willow trees can lead to shortages and increased costs. These challenges make it difficult for manufacturers to maintain consistent production levels and stable pricing, thereby restraining the growth of the salicylic acid market. This volatility in raw material supply can discourage investment and expansion efforts within the industry.
Competition from Alternative Products Restrains Market Growth
Salicylic acid faces stiff competition from alternative products like benzoic acid and sorbic acid. These alternatives offer similar functionalities and are often preferred due to factors such as cost-effectiveness, easier availability, and regulatory compliance.
For instance, in certain applications, benzoic acid and sorbic acid might be chosen over salicylic acid because they can be sourced more reliably or at a lower cost. This preference for alternatives limits the demand and market growth of salicylic acid. As a result, manufacturers of salicylic acid must continually innovate and differentiate their products to maintain market share in the face of these competitive pressures.
Form Analysis
Powder dominates with 65.3% due to its versatility and ease of use.
Powdered salicylic acid holds 65.3% of the market share, making it the dominant form. Its popularity is largely due to its versatility and ease of use in various applications. Powdered salicylic acid is easily mixed with other ingredients, making it suitable for a wide range of products in pharmaceuticals, cosmetics, and personal care. Its stability and longer shelf life compared to liquid form also contribute to its widespread use.
Liquid salicylic acid, while significant, holds a smaller share. This form is often used in formulations where precise concentrations are crucial, such as in liquid medications or certain cosmetic products. The liquid form allows for easy application and quick absorption, particularly in topical treatments for skin conditions. Despite its advantages, the need for special storage and handling conditions can limit its broader application compared to the powder form.
The dominance of the powder form is driven by its application in large-scale manufacturing processes where precise dosing and consistency are essential. In the pharmaceutical industry, powdered salicylic acid is a key ingredient in the production of various medications, including those for pain relief and anti-inflammatory treatments. In the cosmetics industry, it is widely used in acne treatments, exfoliants, and other skincare products due to its keratolytic properties.
Type Analysis
Synthetic dominates with 73.3% due to cost-effectiveness and availability.
Synthetic salicylic acid leads the market with a 73.3% share. Its dominance is attributed to its cost-effectiveness and consistent availability. Synthetic production methods ensure a steady supply of high-quality salicylic acid, which meets the stringent standards required for pharmaceutical and cosmetic applications. The synthetic form is also more affordable, making it accessible for large-scale manufacturing.
Natural salicylic acid, derived from plant sources like willow bark, holds a smaller market share. It appeals to consumers who prefer natural and organic products, particularly in the cosmetics and personal care segments. However, the extraction process is more complex and costly, leading to higher prices for natural salicylic acid products. Despite these challenges, the demand for natural salicylic acid is growing, driven by the increasing consumer preference for natural and sustainable ingredients.
The synthetic segment’s dominance is reinforced by the ability to produce salicylic acid in large quantities at a lower cost. This makes it a preferred choice for pharmaceutical companies and large cosmetic manufacturers. As demand for cost-effective and reliable ingredients continues to rise, the synthetic segment is expected to maintain its leading position.
Grade Analysis
Pharmaceutical grade dominates with 54.3% due to stringent quality requirements.
Pharmaceutical-grade salicylic acid holds 54.3% of the market share, making it the dominant grade. This grade is used in the production of various medications, including those for treating skin conditions, pain relief, and anti-inflammatory purposes. The stringent quality and purity standards required for pharmaceutical applications ensure the effectiveness and safety of the products, driving the demand for pharmaceutical-grade salicylic acid.
Cosmetic-grade salicylic acid is also significant, used extensively in skincare products for its exfoliating and anti-acne properties. While it holds a smaller share compared to pharmaceutical grade, the cosmetic grade is crucial in the beauty and personal care industry. Its applications include cleansers, toners, and treatment products designed to improve skin texture and clarity.
Technical grade salicylic acid, used in industrial applications, holds the smallest market share. It is utilized in the synthesis of other chemicals, preservatives, and in certain manufacturing processes. Despite its smaller market presence, technical-grade salicylic acid plays a vital role in various industrial applications, contributing to the overall demand for salicylic acid.
The dominance of pharmaceutical-grade salicylic acid is driven by the rigorous regulatory standards in the pharmaceutical industry. Ensuring the highest quality and purity is essential for producing safe and effective medications. This demand for high-quality ingredients in the pharmaceutical sector supports the continued dominance of pharmaceutical-grade salicylic acid.
Application Analysis
Pharmaceuticals dominate with 43.4% due to extensive medicinal uses.
Pharmaceuticals hold the largest share of the salicylic acid market, accounting for 43.4%. The extensive medicinal uses of salicylic acid, including its role in treating skin conditions, pain relief, and as an anti-inflammatory agent, drive this dominance. It is a key ingredient in many over-the-counter and prescription medications, supporting its significant market presence.
The cosmetics and personal care segment also holds a substantial share. Salicylic acid is widely used in skincare products for its exfoliating and anti-acne properties. Its ability to penetrate and clear pores makes it a popular choice in products designed to treat and prevent acne, as well as improve overall skin texture.
The food and beverage segment, while smaller, is important for its use as a preservative and food additive. Salicylic acid helps extend the shelf life of products and ensures their safety for consumption. Although its use in this segment is more limited compared to pharmaceuticals and cosmetics, it plays a critical role in food preservation.
Other applications, including its use in dyes, fragrances, and industrial processes, contribute to the overall demand for salicylic acid. These applications, while not as prominent, add to the versatility and importance of salicylic acid in various industries.
The dominance of the pharmaceutical segment is supported by the continuous demand for effective and safe medications. As the global healthcare industry grows, the need for high-quality pharmaceutical ingredients like salicylic acid remains strong, ensuring its leading position in the market.
Key Market Segments
By Form
- Powder
- Liquid
By Type
- Natural
- Synthetic
By Grade
- Pharmaceutical
- Cosmetic
- Technical
By Application
- Food and Beverage
- Cosmetics and Personal Care
- Pharmaceuticals
- Others
Growth Opportunities
Increasing Demand for Natural and Eco-friendly Products Offers Growth Opportunity
The trend towards natural and eco-friendly products is driving growth in the salicylic acid market. Derived from natural sources like willow bark, salicylic acid fits well with consumer preferences for organic and sustainable options.
This is particularly evident in the personal care industry, where demand for natural skincare products containing salicylic acid is rising. The pharmaceutical and agriculture sectors also benefit from this trend, as they seek eco-friendly ingredients. The growing consumer awareness and preference for natural products create a substantial market potential for salicylic acid, encouraging its use across various applications.
Expansion in Emerging Markets Offers Growth Opportunity
Emerging markets in Asia-Pacific and Latin America present significant opportunities for the salicylic acid market. Rising disposable incomes and increased awareness of personal care products drive demand in these regions.
Additionally, the growth of industrial sectors further boosts the need for salicylic acid. These markets are experiencing rapid economic development, leading to higher consumption of pharmaceuticals, cosmetics, and agricultural products. The expanding middle class and urbanization trends in these regions create a favorable environment for salicylic acid market growth, enhancing its application across diverse industries.
Trending Factors
Sustainable and Bio-based Production Methods Are Trending Factors
Sustainable and bio-based production methods are gaining popularity in the chemical industry, including salicylic acid production. Research focuses on finding alternative sources and eco-friendly manufacturing processes that align with global sustainability goals. This trend responds to increasing environmental concerns and regulatory pressures.
Companies investing in sustainable practices can attract environmentally conscious consumers and meet stricter environmental standards. The shift towards green chemistry and bio-based products not only reduces the environmental impact but also enhances the market appeal of salicylic acid, promoting its use in various applications.
Combination Products and Synergistic Formulations Are Trending Factors
The use of salicylic acid in combination with other active ingredients is a growing trend in the market. In skincare, for example, salicylic acid is often paired with other exfoliating agents or moisturizers to enhance product efficacy.
This trend improves the performance and appeal of products, meeting consumer demands for multifunctional solutions. Synergistic formulations that combine salicylic acid with other ingredients can address multiple skin concerns, offering better results. This approach increases the versatility and marketability of salicylic acid, driving its demand in the personal care industry and beyond.
Regional Analysis
Asia Pacific Dominates with 43.3% Market Share in the Salicylic Acid Market
Asia Pacific's dominant position in the salicylic acid market, holding a 43.3% share, is primarily driven by extensive manufacturing capacities and the burgeoning pharmaceutical and skincare industries within the region. The high concentration of cosmetic manufacturers in countries like South Korea and Japan, coupled with increasing demand for salicylic acid-based products for acne treatment and other skin conditions, propels this market share. Additionally, the competitive pricing strategies adopted by local manufacturers help maintain the region's leadership.
The market dynamics of Asia Pacific are characterized by rapid industrial growth and increasing consumer awareness about personal care and health. The region benefits from a robust supply chain and lower production costs, which facilitate the production of salicylic acid at competitive rates. Furthermore, favorable government policies aimed at promoting the pharmaceutical and cosmetics sectors amplify the market's expansion, making Asia Pacific a pivotal area for salicylic acid production and consumption.
Regional Market Shares and Statistics:
- North America: The region holds approximately 25% of the market, driven by advanced healthcare and cosmetics sectors, emphasizing high-quality, dermatologically approved ingredients.
- Europe: Europe accounts for about 20% of the market. Strong regulatory frameworks promoting safe cosmetic formulations contribute to steady demand for salicylic acid.
- Middle East & Africa: This region captures a smaller market share of around 6%. Growth is primarily driven by expanding cosmetic and pharmaceutical industries in key countries.
- Latin America: Latin America holds a market share of 6%, with growth influenced by increasing local manufacturing and rising awareness of skincare benefits among the population.
Key Regions and Countries
- North America
- The US
- Canada
- Mexico
- Western Europe
- Germany
- France
- The UK
- Spain
- Italy
- Portugal
- Ireland
- Austria
- Switzerland
- Benelux
- Nordic
- Rest of Western Europe
- Eastern Europe
- Russia
- Poland
- The Czech Republic
- Greece
- Rest of Eastern Europe
- APAC
- China
- Japan
- South Korea
- India
- Australia & New Zealand
- Indonesia
- Malaysia
- Philippines
- Singapore
- Thailand
- Vietnam
- Rest of APAC
- Latin America
- Brazil
- Colombia
- Chile
- Argentina
- Costa Rica
- Rest of Latin America
- Middle East & Africa
- Algeria
- Egypt
- Israel
- Kuwait
- Nigeria
- Saudi Arabia
- South Africa
- Turkey
- United Arab Emirates
- Rest of MEA
Key Players Analysis
The salicylic acid market is competitive and driven by demand in pharmaceuticals and cosmetics. Key players like Merck & Co. Inc. lead with strong research and development capabilities. Their advanced products and global reach enhance their market influence.
Thermo Fisher Scientific and Spectrum Chemical Manufacturing Corp are significant due to their extensive product lines and reliable supply chains. Their strategic positioning in the market is reinforced by their reputation for quality and innovation.
Novocap and Seqens SAS are major players with a focus on high-quality production processes. Their strong presence in Europe boosts their market influence and competitive edge.
Alfa Aesar and Simco Chemicals cater to specialized segments, offering a range of chemicals including salicylic acid. Their niche market focus ensures steady demand and market positioning.
Shandong Xinhua Longxin Chemical Co. Ltd and Hebei Jingye Group from China are prominent due to their large-scale production capabilities and competitive pricing. Their strategic positioning in Asia contributes significantly to market dynamics.
Alta Laboratories and Siddharth Carbochem Products Ltd. are notable in the Indian market, providing cost-effective solutions and maintaining strong regional influence.
Overall, the salicylic acid market is shaped by the strategic actions and innovations of these key players. The market is characterized by a balance of large multinational corporations and specialized regional companies, each contributing to market growth and development. The combined efforts in research, quality production, and strategic positioning drive the market forward, meeting the growing demand in various industries.
Market Key Players
- Alfa Aesar
- Alta Laboratories
- Hebei Jingye Group
- Huayin Jinqiancheng
- JM Loveridge Limited
- Merck & Co. Inc.
- Novocap
- Seqens International
- Seqens SAS
- Shandong Xinhua Longxin Chemical Co. Ltd
- Siddharth Carbochem Products Ltd
- Simco Chemicals
- Spectrum Chemical Manufacturing Corp
- Thermo Fisher Scientific
- Zhenjiang Gaopeng Pharmaceutical Co., Ltd.
Recent Developments
- March 2023: Alta Laboratories reported a 5% increase in sales, achieving a monthly revenue of $30 million due to heightened demand for salicylic acid in skincare products, particularly for acne treatment.
- January 2023: Merck reported a 5% increase in sales for its Salicylic Acid products, amounting to a monthly revenue of $18 million, driven by strong demand in the skincare segment.
Report Scope
Report Features Description Market Value (2023) USD 558.0 Million Forecast Revenue (2033) USD 1,089.1 Million CAGR (2024-2033) 7.1% Base Year for Estimation 2023 Historic Period 2018-2023 Forecast Period 2024-2033 Report Coverage Revenue Forecast, Market Dynamics, Competitive Landscape, Recent Developments Segments Covered By Form (Powder, Liquid), By Type (Natural, Synthetic), By Grade (Pharmaceutical, Cosmetic, Technical), By Application (Food and Beverage, Cosmetics and Personal Care, Pharmaceuticals, Others) Regional Analysis North America - The US, Canada, & Mexico; Western Europe - Germany, France, The UK, Spain, Italy, Portugal, Ireland, Austria, Switzerland, Benelux, Nordic, & Rest of Western Europe; Eastern Europe - Russia, Poland, The Czech Republic, Greece, & Rest of Eastern Europe; APAC - China, Japan, South Korea, India, Australia & New Zealand, Indonesia, Malaysia, Philippines, Singapore, Thailand, Vietnam, & Rest of APAC; Latin America - Brazil, Colombia, Chile, Argentina, Costa Rica, & Rest of Latin America; Middle East & Africa - Algeria, Egypt, Israel, Kuwait, Nigeria, Saudi Arabia, South Africa, Turkey, United Arab Emirates, & Rest of MEA Competitive Landscape Alfa Aesar, Alta Laboratories, Hebei Jingye Group, Huayin Jinqiancheng, JM Loveridge Limited, Merck & Co. Inc., Novocap, Seqens International, Seqens SAS, Shandong Xinhua Longxin Chemical Co. Ltd, Siddharth Carbochem Products Ltd, Simco Chemicals, Spectrum Chemical Manufacturing Corp, Thermo Fisher Scientific, Zhenjiang Gaopeng Pharmaceutical Co., Ltd. Customization Scope Customization for segments, region/country-level will be provided. Moreover, additional customization can be done based on the requirements. Purchase Options We have three licenses to opt for: Single User License, Multi-User License (Up to 5 Users), Corporate Use License (Unlimited User and Printable PDF) -
- 1. Executive Summary
- 1.1. Definition
- 1.2. Taxonomy
- 1.3. Research Scope
- 1.4. Key Analysis
- 1.5. Key Findings by Major Segments
- 1.6. Top strategies by Major Players
- 2. Global Salicylic Acid Market Overview
- 2.1. Salicylic Acid Market Dynamics
- 2.1.1. Drivers
- 2.1.2. Opportunities
- 2.1.3. Restraints
- 2.1.4. Challenges
- 2.2. Macro-economic Factors
- 2.3. Regulatory Framework
- 2.4. Market Investment Feasibility Index
- 2.5. PEST Analysis
- 2.6. PORTER’S Five Force Analysis
- 2.7. Drivers & Restraints Impact Analysis
- 2.8. Industry Chain Analysis
- 2.9. Cost Structure Analysis
- 2.10. Marketing Strategy
- 2.11. Russia-Ukraine War Impact Analysis
- 2.12. Opportunity Map Analysis
- 2.13. Market Competition Scenario Analysis
- 2.14. Product Life Cycle Analysis
- 2.15. Opportunity Orbits
- 2.16. Manufacturer Intensity Map
- 2.17. Major Companies sales by Value & Volume
- 2.1. Salicylic Acid Market Dynamics
- 3. Global Salicylic Acid Market Analysis, Opportunity and Forecast, 2016-2032
- 3.1. Global Salicylic Acid Market Analysis, 2016-2021
- 3.2. Global Salicylic Acid Market Opportunity and Forecast, 2023-2032
- 3.3. Global Salicylic Acid Market Analysis, Opportunity and Forecast, By Form, 2016-2032
- 3.3.1. Global Salicylic Acid Market Analysis by Form: Introduction
- 3.3.2. Market Size Absolute $ Opportunity Analysis and Forecast, By Form, 2016-2032
- 3.3.3. Powder
- 3.3.4. Liquid
- 3.4. Global Salicylic Acid Market Analysis, Opportunity and Forecast, By Type, 2016-2032
- 3.4.1. Global Salicylic Acid Market Analysis by Type: Introduction
- 3.4.2. Market Size Absolute $ Opportunity Analysis and Forecast, By Type, 2016-2032
- 3.4.3. Natural
- 3.4.4. Synthetic
- 3.5. Global Salicylic Acid Market Analysis, Opportunity and Forecast, By Grade, 2016-2032
- 3.5.1. Global Salicylic Acid Market Analysis by Grade: Introduction
- 3.5.2. Market Size Absolute $ Opportunity Analysis and Forecast, By Grade, 2016-2032
- 3.5.3. Pharmaceutical
- 3.5.4. Cosmetic
- 3.5.5. Technical
- 3.6. Global Salicylic Acid Market Analysis, Opportunity and Forecast, By Application , 2016-2032
- 3.6.1. Global Salicylic Acid Market Analysis by Application : Introduction
- 3.6.2. Market Size Absolute $ Opportunity Analysis and Forecast, By Application , 2016-2032
- 3.6.3. Food and Beverage
- 3.6.4. Cosmetics and Personal Care
- 3.6.5. Pharmaceuticals
- 3.6.6. Others
- 4. North America Salicylic Acid Market Analysis, Opportunity and Forecast, 2016-2032
- 4.1. North America Salicylic Acid Market Analysis, 2016-2021
- 4.2. North America Salicylic Acid Market Opportunity and Forecast, 2023-2032
- 4.3. North America Salicylic Acid Market Analysis, Opportunity and Forecast, By Form, 2016-2032
- 4.3.1. North America Salicylic Acid Market Analysis by Form: Introduction
- 4.3.2. Market Size Absolute $ Opportunity Analysis and Forecast, By Form, 2016-2032
- 4.3.3. Powder
- 4.3.4. Liquid
- 4.4. North America Salicylic Acid Market Analysis, Opportunity and Forecast, By Type, 2016-2032
- 4.4.1. North America Salicylic Acid Market Analysis by Type: Introduction
- 4.4.2. Market Size Absolute $ Opportunity Analysis and Forecast, By Type, 2016-2032
- 4.4.3. Natural
- 4.4.4. Synthetic
- 4.5. North America Salicylic Acid Market Analysis, Opportunity and Forecast, By Grade, 2016-2032
- 4.5.1. North America Salicylic Acid Market Analysis by Grade: Introduction
- 4.5.2. Market Size Absolute $ Opportunity Analysis and Forecast, By Grade, 2016-2032
- 4.5.3. Pharmaceutical
- 4.5.4. Cosmetic
- 4.5.5. Technical
- 4.6. North America Salicylic Acid Market Analysis, Opportunity and Forecast, By Application , 2016-2032
- 4.6.1. North America Salicylic Acid Market Analysis by Application : Introduction
- 4.6.2. Market Size Absolute $ Opportunity Analysis and Forecast, By Application , 2016-2032
- 4.6.3. Food and Beverage
- 4.6.4. Cosmetics and Personal Care
- 4.6.5. Pharmaceuticals
- 4.6.6. Others
- 4.7. North America Salicylic Acid Market Analysis, Opportunity and Forecast, By Country , 2016-2032
- 4.7.1. North America Salicylic Acid Market Analysis by Country : Introduction
- 4.7.2. Market Size Absolute $ Opportunity Analysis and Forecast, Country , 2016-2032
- 4.7.2.1. The US
- 4.7.2.2. Canada
- 4.7.2.3. Mexico
- 5. Western Europe Salicylic Acid Market Analysis, Opportunity and Forecast, 2016-2032
- 5.1. Western Europe Salicylic Acid Market Analysis, 2016-2021
- 5.2. Western Europe Salicylic Acid Market Opportunity and Forecast, 2023-2032
- 5.3. Western Europe Salicylic Acid Market Analysis, Opportunity and Forecast, By Form, 2016-2032
- 5.3.1. Western Europe Salicylic Acid Market Analysis by Form: Introduction
- 5.3.2. Market Size Absolute $ Opportunity Analysis and Forecast, By Form, 2016-2032
- 5.3.3. Powder
- 5.3.4. Liquid
- 5.4. Western Europe Salicylic Acid Market Analysis, Opportunity and Forecast, By Type, 2016-2032
- 5.4.1. Western Europe Salicylic Acid Market Analysis by Type: Introduction
- 5.4.2. Market Size Absolute $ Opportunity Analysis and Forecast, By Type, 2016-2032
- 5.4.3. Natural
- 5.4.4. Synthetic
- 5.5. Western Europe Salicylic Acid Market Analysis, Opportunity and Forecast, By Grade, 2016-2032
- 5.5.1. Western Europe Salicylic Acid Market Analysis by Grade: Introduction
- 5.5.2. Market Size Absolute $ Opportunity Analysis and Forecast, By Grade, 2016-2032
- 5.5.3. Pharmaceutical
- 5.5.4. Cosmetic
- 5.5.5. Technical
- 5.6. Western Europe Salicylic Acid Market Analysis, Opportunity and Forecast, By Application , 2016-2032
- 5.6.1. Western Europe Salicylic Acid Market Analysis by Application : Introduction
- 5.6.2. Market Size Absolute $ Opportunity Analysis and Forecast, By Application , 2016-2032
- 5.6.3. Food and Beverage
- 5.6.4. Cosmetics and Personal Care
- 5.6.5. Pharmaceuticals
- 5.6.6. Others
- 5.7. Western Europe Salicylic Acid Market Analysis, Opportunity and Forecast, By Country , 2016-2032
- 5.7.1. Western Europe Salicylic Acid Market Analysis by Country : Introduction
- 5.7.2. Market Size Absolute $ Opportunity Analysis and Forecast, Country , 2016-2032
- 5.7.2.1. Germany
- 5.7.2.2. France
- 5.7.2.3. The UK
- 5.7.2.4. Spain
- 5.7.2.5. Italy
- 5.7.2.6. Portugal
- 5.7.2.7. Ireland
- 5.7.2.8. Austria
- 5.7.2.9. Switzerland
- 5.7.2.10. Benelux
- 5.7.2.11. Nordic
- 5.7.2.12. Rest of Western Europe
- 6. Eastern Europe Salicylic Acid Market Analysis, Opportunity and Forecast, 2016-2032
- 6.1. Eastern Europe Salicylic Acid Market Analysis, 2016-2021
- 6.2. Eastern Europe Salicylic Acid Market Opportunity and Forecast, 2023-2032
- 6.3. Eastern Europe Salicylic Acid Market Analysis, Opportunity and Forecast, By Form, 2016-2032
- 6.3.1. Eastern Europe Salicylic Acid Market Analysis by Form: Introduction
- 6.3.2. Market Size Absolute $ Opportunity Analysis and Forecast, By Form, 2016-2032
- 6.3.3. Powder
- 6.3.4. Liquid
- 6.4. Eastern Europe Salicylic Acid Market Analysis, Opportunity and Forecast, By Type, 2016-2032
- 6.4.1. Eastern Europe Salicylic Acid Market Analysis by Type: Introduction
- 6.4.2. Market Size Absolute $ Opportunity Analysis and Forecast, By Type, 2016-2032
- 6.4.3. Natural
- 6.4.4. Synthetic
- 6.5. Eastern Europe Salicylic Acid Market Analysis, Opportunity and Forecast, By Grade, 2016-2032
- 6.5.1. Eastern Europe Salicylic Acid Market Analysis by Grade: Introduction
- 6.5.2. Market Size Absolute $ Opportunity Analysis and Forecast, By Grade, 2016-2032
- 6.5.3. Pharmaceutical
- 6.5.4. Cosmetic
- 6.5.5. Technical
- 6.6. Eastern Europe Salicylic Acid Market Analysis, Opportunity and Forecast, By Application , 2016-2032
- 6.6.1. Eastern Europe Salicylic Acid Market Analysis by Application : Introduction
- 6.6.2. Market Size Absolute $ Opportunity Analysis and Forecast, By Application , 2016-2032
- 6.6.3. Food and Beverage
- 6.6.4. Cosmetics and Personal Care
- 6.6.5. Pharmaceuticals
- 6.6.6. Others
- 6.7. Eastern Europe Salicylic Acid Market Analysis, Opportunity and Forecast, By Country , 2016-2032
- 6.7.1. Eastern Europe Salicylic Acid Market Analysis by Country : Introduction
- 6.7.2. Market Size Absolute $ Opportunity Analysis and Forecast, Country , 2016-2032
- 6.7.2.1. Russia
- 6.7.2.2. Poland
- 6.7.2.3. The Czech Republic
- 6.7.2.4. Greece
- 6.7.2.5. Rest of Eastern Europe
- 7. APAC Salicylic Acid Market Analysis, Opportunity and Forecast, 2016-2032
- 7.1. APAC Salicylic Acid Market Analysis, 2016-2021
- 7.2. APAC Salicylic Acid Market Opportunity and Forecast, 2023-2032
- 7.3. APAC Salicylic Acid Market Analysis, Opportunity and Forecast, By Form, 2016-2032
- 7.3.1. APAC Salicylic Acid Market Analysis by Form: Introduction
- 7.3.2. Market Size Absolute $ Opportunity Analysis and Forecast, By Form, 2016-2032
- 7.3.3. Powder
- 7.3.4. Liquid
- 7.4. APAC Salicylic Acid Market Analysis, Opportunity and Forecast, By Type, 2016-2032
- 7.4.1. APAC Salicylic Acid Market Analysis by Type: Introduction
- 7.4.2. Market Size Absolute $ Opportunity Analysis and Forecast, By Type, 2016-2032
- 7.4.3. Natural
- 7.4.4. Synthetic
- 7.5. APAC Salicylic Acid Market Analysis, Opportunity and Forecast, By Grade, 2016-2032
- 7.5.1. APAC Salicylic Acid Market Analysis by Grade: Introduction
- 7.5.2. Market Size Absolute $ Opportunity Analysis and Forecast, By Grade, 2016-2032
- 7.5.3. Pharmaceutical
- 7.5.4. Cosmetic
- 7.5.5. Technical
- 7.6. APAC Salicylic Acid Market Analysis, Opportunity and Forecast, By Application , 2016-2032
- 7.6.1. APAC Salicylic Acid Market Analysis by Application : Introduction
- 7.6.2. Market Size Absolute $ Opportunity Analysis and Forecast, By Application , 2016-2032
- 7.6.3. Food and Beverage
- 7.6.4. Cosmetics and Personal Care
- 7.6.5. Pharmaceuticals
- 7.6.6. Others
- 7.7. APAC Salicylic Acid Market Analysis, Opportunity and Forecast, By Country , 2016-2032
- 7.7.1. APAC Salicylic Acid Market Analysis by Country : Introduction
- 7.7.2. Market Size Absolute $ Opportunity Analysis and Forecast, Country , 2016-2032
- 7.7.2.1. China
- 7.7.2.2. Japan
- 7.7.2.3. South Korea
- 7.7.2.4. India
- 7.7.2.5. Australia & New Zeland
- 7.7.2.6. Indonesia
- 7.7.2.7. Malaysia
- 7.7.2.8. Philippines
- 7.7.2.9. Singapore
- 7.7.2.10. Thailand
- 7.7.2.11. Vietnam
- 7.7.2.12. Rest of APAC
- 8. Latin America Salicylic Acid Market Analysis, Opportunity and Forecast, 2016-2032
- 8.1. Latin America Salicylic Acid Market Analysis, 2016-2021
- 8.2. Latin America Salicylic Acid Market Opportunity and Forecast, 2023-2032
- 8.3. Latin America Salicylic Acid Market Analysis, Opportunity and Forecast, By Form, 2016-2032
- 8.3.1. Latin America Salicylic Acid Market Analysis by Form: Introduction
- 8.3.2. Market Size Absolute $ Opportunity Analysis and Forecast, By Form, 2016-2032
- 8.3.3. Powder
- 8.3.4. Liquid
- 8.4. Latin America Salicylic Acid Market Analysis, Opportunity and Forecast, By Type, 2016-2032
- 8.4.1. Latin America Salicylic Acid Market Analysis by Type: Introduction
- 8.4.2. Market Size Absolute $ Opportunity Analysis and Forecast, By Type, 2016-2032
- 8.4.3. Natural
- 8.4.4. Synthetic
- 8.5. Latin America Salicylic Acid Market Analysis, Opportunity and Forecast, By Grade, 2016-2032
- 8.5.1. Latin America Salicylic Acid Market Analysis by Grade: Introduction
- 8.5.2. Market Size Absolute $ Opportunity Analysis and Forecast, By Grade, 2016-2032
- 8.5.3. Pharmaceutical
- 8.5.4. Cosmetic
- 8.5.5. Technical
- 8.6. Latin America Salicylic Acid Market Analysis, Opportunity and Forecast, By Application , 2016-2032
- 8.6.1. Latin America Salicylic Acid Market Analysis by Application : Introduction
- 8.6.2. Market Size Absolute $ Opportunity Analysis and Forecast, By Application , 2016-2032
- 8.6.3. Food and Beverage
- 8.6.4. Cosmetics and Personal Care
- 8.6.5. Pharmaceuticals
- 8.6.6. Others
- 8.7. Latin America Salicylic Acid Market Analysis, Opportunity and Forecast, By Country , 2016-2032
- 8.7.1. Latin America Salicylic Acid Market Analysis by Country : Introduction
- 8.7.2. Market Size Absolute $ Opportunity Analysis and Forecast, Country , 2016-2032
- 8.7.2.1. Brazil
- 8.7.2.2. Colombia
- 8.7.2.3. Chile
- 8.7.2.4. Argentina
- 8.7.2.5. Costa Rica
- 8.7.2.6. Rest of Latin America
- 9. Middle East & Africa Salicylic Acid Market Analysis, Opportunity and Forecast, 2016-2032
- 9.1. Middle East & Africa Salicylic Acid Market Analysis, 2016-2021
- 9.2. Middle East & Africa Salicylic Acid Market Opportunity and Forecast, 2023-2032
- 9.3. Middle East & Africa Salicylic Acid Market Analysis, Opportunity and Forecast, By Form, 2016-2032
- 9.3.1. Middle East & Africa Salicylic Acid Market Analysis by Form: Introduction
- 9.3.2. Market Size Absolute $ Opportunity Analysis and Forecast, By Form, 2016-2032
- 9.3.3. Powder
- 9.3.4. Liquid
- 9.4. Middle East & Africa Salicylic Acid Market Analysis, Opportunity and Forecast, By Type, 2016-2032
- 9.4.1. Middle East & Africa Salicylic Acid Market Analysis by Type: Introduction
- 9.4.2. Market Size Absolute $ Opportunity Analysis and Forecast, By Type, 2016-2032
- 9.4.3. Natural
- 9.4.4. Synthetic
- 9.5. Middle East & Africa Salicylic Acid Market Analysis, Opportunity and Forecast, By Grade, 2016-2032
- 9.5.1. Middle East & Africa Salicylic Acid Market Analysis by Grade: Introduction
- 9.5.2. Market Size Absolute $ Opportunity Analysis and Forecast, By Grade, 2016-2032
- 9.5.3. Pharmaceutical
- 9.5.4. Cosmetic
- 9.5.5. Technical
- 9.6. Middle East & Africa Salicylic Acid Market Analysis, Opportunity and Forecast, By Application , 2016-2032
- 9.6.1. Middle East & Africa Salicylic Acid Market Analysis by Application : Introduction
- 9.6.2. Market Size Absolute $ Opportunity Analysis and Forecast, By Application , 2016-2032
- 9.6.3. Food and Beverage
- 9.6.4. Cosmetics and Personal Care
- 9.6.5. Pharmaceuticals
- 9.6.6. Others
- 9.7. Middle East & Africa Salicylic Acid Market Analysis, Opportunity and Forecast, By Country , 2016-2032
- 9.7.1. Middle East & Africa Salicylic Acid Market Analysis by Country : Introduction
- 9.7.2. Market Size Absolute $ Opportunity Analysis and Forecast, Country , 2016-2032
- 9.7.2.1. Algeria
- 9.7.2.2. Egypt
- 9.7.2.3. Israel
- 9.7.2.4. Kuwait
- 9.7.2.5. Nigeria
- 9.7.2.6. Saudi Arabia
- 9.7.2.7. South Africa
- 9.7.2.8. Turkey
- 9.7.2.9. The UAE
- 9.7.2.10. Rest of MEA
- 10. Global Salicylic Acid Market Analysis, Opportunity and Forecast, By Region , 2016-2032
- 10.1. Global Salicylic Acid Market Analysis by Region : Introduction
- 10.2. Market Size Absolute $ Opportunity Analysis and Forecast, By Region , 2016-2032
- 10.2.1. North America
- 10.2.2. Western Europe
- 10.2.3. Eastern Europe
- 10.2.4. APAC
- 10.2.5. Latin America
- 10.2.6. Middle East & Africa
- 11. Global Salicylic Acid Market Competitive Landscape, Market Share Analysis, and Company Profiles
- 11.1. Market Share Analysis
- 11.2. Company Profiles
- 11.3. Alfa Aesar
- 11.3.1. Company Overview
- 11.3.2. Financial Highlights
- 11.3.3. Product Portfolio
- 11.3.4. SWOT Analysis
- 11.3.5. Key Strategies and Developments
- 11.4. Alta Laboratories
- 11.4.1. Company Overview
- 11.4.2. Financial Highlights
- 11.4.3. Product Portfolio
- 11.4.4. SWOT Analysis
- 11.4.5. Key Strategies and Developments
- 11.5. Hebei Jingye Group
- 11.5.1. Company Overview
- 11.5.2. Financial Highlights
- 11.5.3. Product Portfolio
- 11.5.4. SWOT Analysis
- 11.5.5. Key Strategies and Developments
- 11.6. Huayin Jinqiancheng
- 11.6.1. Company Overview
- 11.6.2. Financial Highlights
- 11.6.3. Product Portfolio
- 11.6.4. SWOT Analysis
- 11.6.5. Key Strategies and Developments
- 11.7. JM Loveridge Limited
- 11.7.1. Company Overview
- 11.7.2. Financial Highlights
- 11.7.3. Product Portfolio
- 11.7.4. SWOT Analysis
- 11.7.5. Key Strategies and Developments
- 11.8. Merck & Co. Inc.
- 11.8.1. Company Overview
- 11.8.2. Financial Highlights
- 11.8.3. Product Portfolio
- 11.8.4. SWOT Analysis
- 11.8.5. Key Strategies and Developments
- 11.9. Novocap
- 11.9.1. Company Overview
- 11.9.2. Financial Highlights
- 11.9.3. Product Portfolio
- 11.9.4. SWOT Analysis
- 11.9.5. Key Strategies and Developments
- 11.10. Seqens International
- 11.10.1. Company Overview
- 11.10.2. Financial Highlights
- 11.10.3. Product Portfolio
- 11.10.4. SWOT Analysis
- 11.10.5. Key Strategies and Developments
- 11.11. Seqens SAS
- 11.11.1. Company Overview
- 11.11.2. Financial Highlights
- 11.11.3. Product Portfolio
- 11.11.4. SWOT Analysis
- 11.11.5. Key Strategies and Developments
- 11.12. Shandong Xinhua Longxin Chemical Co. Ltd
- 11.12.1. Company Overview
- 11.12.2. Financial Highlights
- 11.12.3. Product Portfolio
- 11.12.4. SWOT Analysis
- 11.12.5. Key Strategies and Developments
- 11.13.1. Company Overview
- 11.13.2. Financial Highlights
- 11.13.3. Product Portfolio
- 11.13.4. SWOT Analysis
- 11.13.5. Key Strategies and Developments
- 11.14. Siddharth Carbochem Products Ltd
- 11.14.1. Company Overview
- 11.14.2. Financial Highlights
- 11.14.3. Product Portfolio
- 11.14.4. SWOT Analysis
- 11.14.5. Key Strategies and Developments
- 11.15. Spectrum Chemical Manufacturing Corp
- 11.15.1. Company Overview
- 11.15.2. Financial Highlights
- 11.15.3. Product Portfolio
- 11.15.4. SWOT Analysis
- 11.15.5. Key Strategies and Developments
- 11.16. Thermo Fisher Scientific
- 11.16.1. Company Overview
- 11.16.2. Financial Highlights
- 11.16.3. Product Portfolio
- 11.16.4. SWOT Analysis
- 11.16.5. Key Strategies and Developments
- 11.17. Zhenjiang Gaopeng Pharmaceutical Co., Ltd.
- 11.17.1. Company Overview
- 11.17.2. Financial Highlights
- 11.17.3. Product Portfolio
- 11.17.4. SWOT Analysis
- 11.17.5. Key Strategies and Developments
- 12. Assumptions and Acronyms
- 13. Research Methodology
- 14. Contact
- List of Figures
- Figure 1: Global Salicylic Acid Market Revenue (US$ Mn) Market Share by Form in 2022
- Figure 2: Global Salicylic Acid Market Attractiveness Analysis by Form, 2016-2032
- Figure 3: Global Salicylic Acid Market Revenue (US$ Mn) Market Share by Typein 2022
- Figure 4: Global Salicylic Acid Market Attractiveness Analysis by Type, 2016-2032
- Figure 5: Global Salicylic Acid Market Revenue (US$ Mn) Market Share by Gradein 2022
- Figure 6: Global Salicylic Acid Market Attractiveness Analysis by Grade, 2016-2032
- Figure 7: Global Salicylic Acid Market Revenue (US$ Mn) Market Share by Application in 2022
- Figure 8: Global Salicylic Acid Market Attractiveness Analysis by Application , 2016-2032
- Figure 9: Global Salicylic Acid Market Revenue (US$ Mn) Market Share by Region in 2022
- Figure 10: Global Salicylic Acid Market Attractiveness Analysis by Region, 2016-2032
- Figure 11: Global Salicylic Acid Market Revenue (US$ Mn) (2016-2032)
- Figure 12: Global Salicylic Acid Market Revenue (US$ Mn) Comparison by Region (2016-2032)
- Figure 13: Global Salicylic Acid Market Revenue (US$ Mn) Comparison by Form (2016-2032)
- Figure 14: Global Salicylic Acid Market Revenue (US$ Mn) Comparison by Type (2016-2032)
- Figure 15: Global Salicylic Acid Market Revenue (US$ Mn) Comparison by Grade (2016-2032)
- Figure 16: Global Salicylic Acid Market Revenue (US$ Mn) Comparison by Application (2016-2032)
- Figure 17: Global Salicylic Acid Market Y-o-Y Growth Rate Comparison by Region (2016-2032)
- Figure 18: Global Salicylic Acid Market Y-o-Y Growth Rate Comparison by Form (2016-2032)
- Figure 19: Global Salicylic Acid Market Y-o-Y Growth Rate Comparison by Type (2016-2032)
- Figure 20: Global Salicylic Acid Market Y-o-Y Growth Rate Comparison by Grade (2016-2032)
- Figure 21: Global Salicylic Acid Market Y-o-Y Growth Rate Comparison by Application (2016-2032)
- Figure 22: Global Salicylic Acid Market Share Comparison by Region (2016-2032)
- Figure 23: Global Salicylic Acid Market Share Comparison by Form (2016-2032)
- Figure 24: Global Salicylic Acid Market Share Comparison by Type (2016-2032)
- Figure 25: Global Salicylic Acid Market Share Comparison by Grade (2016-2032)
- Figure 26: Global Salicylic Acid Market Share Comparison by Application (2016-2032)
- Figure 27: North America Salicylic Acid Market Revenue (US$ Mn) Market Share by Formin 2022
- Figure 28: North America Salicylic Acid Market Attractiveness Analysis by Form, 2016-2032
- Figure 29: North America Salicylic Acid Market Revenue (US$ Mn) Market Share by Typein 2022
- Figure 30: North America Salicylic Acid Market Attractiveness Analysis by Type, 2016-2032
- Figure 31: North America Salicylic Acid Market Revenue (US$ Mn) Market Share by Gradein 2022
- Figure 32: North America Salicylic Acid Market Attractiveness Analysis by Grade, 2016-2032
- Figure 33: North America Salicylic Acid Market Revenue (US$ Mn) Market Share by Application in 2022
- Figure 34: North America Salicylic Acid Market Attractiveness Analysis by Application , 2016-2032
- Figure 35: North America Salicylic Acid Market Revenue (US$ Mn) Market Share by Country in 2022
- Figure 36: North America Salicylic Acid Market Attractiveness Analysis by Country, 2016-2032
- Figure 37: North America Salicylic Acid Market Revenue (US$ Mn) (2016-2032)
- Figure 38: North America Salicylic Acid Market Revenue (US$ Mn) Comparison by Country (2016-2032)
- Figure 39: North America Salicylic Acid Market Revenue (US$ Mn) Comparison by Form (2016-2032)
- Figure 40: North America Salicylic Acid Market Revenue (US$ Mn) Comparison by Type (2016-2032)
- Figure 41: North America Salicylic Acid Market Revenue (US$ Mn) Comparison by Grade (2016-2032)
- Figure 42: North America Salicylic Acid Market Revenue (US$ Mn) Comparison by Application (2016-2032)
- Figure 43: North America Salicylic Acid Market Y-o-Y Growth Rate Comparison by Country (2016-2032)
- Figure 44: North America Salicylic Acid Market Y-o-Y Growth Rate Comparison by Form (2016-2032)
- Figure 45: North America Salicylic Acid Market Y-o-Y Growth Rate Comparison by Type (2016-2032)
- Figure 46: North America Salicylic Acid Market Y-o-Y Growth Rate Comparison by Grade (2016-2032)
- Figure 47: North America Salicylic Acid Market Y-o-Y Growth Rate Comparison by Application (2016-2032)
- Figure 48: North America Salicylic Acid Market Share Comparison by Country (2016-2032)
- Figure 49: North America Salicylic Acid Market Share Comparison by Form (2016-2032)
- Figure 50: North America Salicylic Acid Market Share Comparison by Type (2016-2032)
- Figure 51: North America Salicylic Acid Market Share Comparison by Grade (2016-2032)
- Figure 52: North America Salicylic Acid Market Share Comparison by Application (2016-2032)
- Figure 53: Western Europe Salicylic Acid Market Revenue (US$ Mn) Market Share by Formin 2022
- Figure 54: Western Europe Salicylic Acid Market Attractiveness Analysis by Form, 2016-2032
- Figure 55: Western Europe Salicylic Acid Market Revenue (US$ Mn) Market Share by Typein 2022
- Figure 56: Western Europe Salicylic Acid Market Attractiveness Analysis by Type, 2016-2032
- Figure 57: Western Europe Salicylic Acid Market Revenue (US$ Mn) Market Share by Gradein 2022
- Figure 58: Western Europe Salicylic Acid Market Attractiveness Analysis by Grade, 2016-2032
- Figure 59: Western Europe Salicylic Acid Market Revenue (US$ Mn) Market Share by Application in 2022
- Figure 60: Western Europe Salicylic Acid Market Attractiveness Analysis by Application , 2016-2032
- Figure 61: Western Europe Salicylic Acid Market Revenue (US$ Mn) Market Share by Country in 2022
- Figure 62: Western Europe Salicylic Acid Market Attractiveness Analysis by Country, 2016-2032
- Figure 63: Western Europe Salicylic Acid Market Revenue (US$ Mn) (2016-2032)
- Figure 64: Western Europe Salicylic Acid Market Revenue (US$ Mn) Comparison by Country (2016-2032)
- Figure 65: Western Europe Salicylic Acid Market Revenue (US$ Mn) Comparison by Form (2016-2032)
- Figure 66: Western Europe Salicylic Acid Market Revenue (US$ Mn) Comparison by Type (2016-2032)
- Figure 67: Western Europe Salicylic Acid Market Revenue (US$ Mn) Comparison by Grade (2016-2032)
- Figure 68: Western Europe Salicylic Acid Market Revenue (US$ Mn) Comparison by Application (2016-2032)
- Figure 69: Western Europe Salicylic Acid Market Y-o-Y Growth Rate Comparison by Country (2016-2032)
- Figure 70: Western Europe Salicylic Acid Market Y-o-Y Growth Rate Comparison by Form (2016-2032)
- Figure 71: Western Europe Salicylic Acid Market Y-o-Y Growth Rate Comparison by Type (2016-2032)
- Figure 72: Western Europe Salicylic Acid Market Y-o-Y Growth Rate Comparison by Grade (2016-2032)
- Figure 73: Western Europe Salicylic Acid Market Y-o-Y Growth Rate Comparison by Application (2016-2032)
- Figure 74: Western Europe Salicylic Acid Market Share Comparison by Country (2016-2032)
- Figure 75: Western Europe Salicylic Acid Market Share Comparison by Form (2016-2032)
- Figure 76: Western Europe Salicylic Acid Market Share Comparison by Type (2016-2032)
- Figure 77: Western Europe Salicylic Acid Market Share Comparison by Grade (2016-2032)
- Figure 78: Western Europe Salicylic Acid Market Share Comparison by Application (2016-2032)
- Figure 79: Eastern Europe Salicylic Acid Market Revenue (US$ Mn) Market Share by Formin 2022
- Figure 80: Eastern Europe Salicylic Acid Market Attractiveness Analysis by Form, 2016-2032
- Figure 81: Eastern Europe Salicylic Acid Market Revenue (US$ Mn) Market Share by Typein 2022
- Figure 82: Eastern Europe Salicylic Acid Market Attractiveness Analysis by Type, 2016-2032
- Figure 83: Eastern Europe Salicylic Acid Market Revenue (US$ Mn) Market Share by Gradein 2022
- Figure 84: Eastern Europe Salicylic Acid Market Attractiveness Analysis by Grade, 2016-2032
- Figure 85: Eastern Europe Salicylic Acid Market Revenue (US$ Mn) Market Share by Application in 2022
- Figure 86: Eastern Europe Salicylic Acid Market Attractiveness Analysis by Application , 2016-2032
- Figure 87: Eastern Europe Salicylic Acid Market Revenue (US$ Mn) Market Share by Country in 2022
- Figure 88: Eastern Europe Salicylic Acid Market Attractiveness Analysis by Country, 2016-2032
- Figure 89: Eastern Europe Salicylic Acid Market Revenue (US$ Mn) (2016-2032)
- Figure 90: Eastern Europe Salicylic Acid Market Revenue (US$ Mn) Comparison by Country (2016-2032)
- Figure 91: Eastern Europe Salicylic Acid Market Revenue (US$ Mn) Comparison by Form (2016-2032)
- Figure 92: Eastern Europe Salicylic Acid Market Revenue (US$ Mn) Comparison by Type (2016-2032)
- Figure 93: Eastern Europe Salicylic Acid Market Revenue (US$ Mn) Comparison by Grade (2016-2032)
- Figure 94: Eastern Europe Salicylic Acid Market Revenue (US$ Mn) Comparison by Application (2016-2032)
- Figure 95: Eastern Europe Salicylic Acid Market Y-o-Y Growth Rate Comparison by Country (2016-2032)
- Figure 96: Eastern Europe Salicylic Acid Market Y-o-Y Growth Rate Comparison by Form (2016-2032)
- Figure 97: Eastern Europe Salicylic Acid Market Y-o-Y Growth Rate Comparison by Type (2016-2032)
- Figure 98: Eastern Europe Salicylic Acid Market Y-o-Y Growth Rate Comparison by Grade (2016-2032)
- Figure 99: Eastern Europe Salicylic Acid Market Y-o-Y Growth Rate Comparison by Application (2016-2032)
- Figure 100: Eastern Europe Salicylic Acid Market Share Comparison by Country (2016-2032)
- Figure 101: Eastern Europe Salicylic Acid Market Share Comparison by Form (2016-2032)
- Figure 102: Eastern Europe Salicylic Acid Market Share Comparison by Type (2016-2032)
- Figure 103: Eastern Europe Salicylic Acid Market Share Comparison by Grade (2016-2032)
- Figure 104: Eastern Europe Salicylic Acid Market Share Comparison by Application (2016-2032)
- Figure 105: APAC Salicylic Acid Market Revenue (US$ Mn) Market Share by Formin 2022
- Figure 106: APAC Salicylic Acid Market Attractiveness Analysis by Form, 2016-2032
- Figure 107: APAC Salicylic Acid Market Revenue (US$ Mn) Market Share by Typein 2022
- Figure 108: APAC Salicylic Acid Market Attractiveness Analysis by Type, 2016-2032
- Figure 109: APAC Salicylic Acid Market Revenue (US$ Mn) Market Share by Gradein 2022
- Figure 110: APAC Salicylic Acid Market Attractiveness Analysis by Grade, 2016-2032
- Figure 111: APAC Salicylic Acid Market Revenue (US$ Mn) Market Share by Application in 2022
- Figure 112: APAC Salicylic Acid Market Attractiveness Analysis by Application , 2016-2032
- Figure 113: APAC Salicylic Acid Market Revenue (US$ Mn) Market Share by Country in 2022
- Figure 114: APAC Salicylic Acid Market Attractiveness Analysis by Country, 2016-2032
- Figure 115: APAC Salicylic Acid Market Revenue (US$ Mn) (2016-2032)
- Figure 116: APAC Salicylic Acid Market Revenue (US$ Mn) Comparison by Country (2016-2032)
- Figure 117: APAC Salicylic Acid Market Revenue (US$ Mn) Comparison by Form (2016-2032)
- Figure 118: APAC Salicylic Acid Market Revenue (US$ Mn) Comparison by Type (2016-2032)
- Figure 119: APAC Salicylic Acid Market Revenue (US$ Mn) Comparison by Grade (2016-2032)
- Figure 120: APAC Salicylic Acid Market Revenue (US$ Mn) Comparison by Application (2016-2032)
- Figure 121: APAC Salicylic Acid Market Y-o-Y Growth Rate Comparison by Country (2016-2032)
- Figure 122: APAC Salicylic Acid Market Y-o-Y Growth Rate Comparison by Form (2016-2032)
- Figure 123: APAC Salicylic Acid Market Y-o-Y Growth Rate Comparison by Type (2016-2032)
- Figure 124: APAC Salicylic Acid Market Y-o-Y Growth Rate Comparison by Grade (2016-2032)
- Figure 125: APAC Salicylic Acid Market Y-o-Y Growth Rate Comparison by Application (2016-2032)
- Figure 126: APAC Salicylic Acid Market Share Comparison by Country (2016-2032)
- Figure 127: APAC Salicylic Acid Market Share Comparison by Form (2016-2032)
- Figure 128: APAC Salicylic Acid Market Share Comparison by Type (2016-2032)
- Figure 129: APAC Salicylic Acid Market Share Comparison by Grade (2016-2032)
- Figure 130: APAC Salicylic Acid Market Share Comparison by Application (2016-2032)
- Figure 131: Latin America Salicylic Acid Market Revenue (US$ Mn) Market Share by Formin 2022
- Figure 132: Latin America Salicylic Acid Market Attractiveness Analysis by Form, 2016-2032
- Figure 133: Latin America Salicylic Acid Market Revenue (US$ Mn) Market Share by Typein 2022
- Figure 134: Latin America Salicylic Acid Market Attractiveness Analysis by Type, 2016-2032
- Figure 135: Latin America Salicylic Acid Market Revenue (US$ Mn) Market Share by Gradein 2022
- Figure 136: Latin America Salicylic Acid Market Attractiveness Analysis by Grade, 2016-2032
- Figure 137: Latin America Salicylic Acid Market Revenue (US$ Mn) Market Share by Application in 2022
- Figure 138: Latin America Salicylic Acid Market Attractiveness Analysis by Application , 2016-2032
- Figure 139: Latin America Salicylic Acid Market Revenue (US$ Mn) Market Share by Country in 2022
- Figure 140: Latin America Salicylic Acid Market Attractiveness Analysis by Country, 2016-2032
- Figure 141: Latin America Salicylic Acid Market Revenue (US$ Mn) (2016-2032)
- Figure 142: Latin America Salicylic Acid Market Revenue (US$ Mn) Comparison by Country (2016-2032)
- Figure 143: Latin America Salicylic Acid Market Revenue (US$ Mn) Comparison by Form (2016-2032)
- Figure 144: Latin America Salicylic Acid Market Revenue (US$ Mn) Comparison by Type (2016-2032)
- Figure 145: Latin America Salicylic Acid Market Revenue (US$ Mn) Comparison by Grade (2016-2032)
- Figure 146: Latin America Salicylic Acid Market Revenue (US$ Mn) Comparison by Application (2016-2032)
- Figure 147: Latin America Salicylic Acid Market Y-o-Y Growth Rate Comparison by Country (2016-2032)
- Figure 148: Latin America Salicylic Acid Market Y-o-Y Growth Rate Comparison by Form (2016-2032)
- Figure 149: Latin America Salicylic Acid Market Y-o-Y Growth Rate Comparison by Type (2016-2032)
- Figure 150: Latin America Salicylic Acid Market Y-o-Y Growth Rate Comparison by Grade (2016-2032)
- Figure 151: Latin America Salicylic Acid Market Y-o-Y Growth Rate Comparison by Application (2016-2032)
- Figure 152: Latin America Salicylic Acid Market Share Comparison by Country (2016-2032)
- Figure 153: Latin America Salicylic Acid Market Share Comparison by Form (2016-2032)
- Figure 154: Latin America Salicylic Acid Market Share Comparison by Type (2016-2032)
- Figure 155: Latin America Salicylic Acid Market Share Comparison by Grade (2016-2032)
- Figure 156: Latin America Salicylic Acid Market Share Comparison by Application (2016-2032)
- Figure 157: Middle East & Africa Salicylic Acid Market Revenue (US$ Mn) Market Share by Formin 2022
- Figure 158: Middle East & Africa Salicylic Acid Market Attractiveness Analysis by Form, 2016-2032
- Figure 159: Middle East & Africa Salicylic Acid Market Revenue (US$ Mn) Market Share by Typein 2022
- Figure 160: Middle East & Africa Salicylic Acid Market Attractiveness Analysis by Type, 2016-2032
- Figure 161: Middle East & Africa Salicylic Acid Market Revenue (US$ Mn) Market Share by Gradein 2022
- Figure 162: Middle East & Africa Salicylic Acid Market Attractiveness Analysis by Grade, 2016-2032
- Figure 163: Middle East & Africa Salicylic Acid Market Revenue (US$ Mn) Market Share by Application in 2022
- Figure 164: Middle East & Africa Salicylic Acid Market Attractiveness Analysis by Application , 2016-2032
- Figure 165: Middle East & Africa Salicylic Acid Market Revenue (US$ Mn) Market Share by Country in 2022
- Figure 166: Middle East & Africa Salicylic Acid Market Attractiveness Analysis by Country, 2016-2032
- Figure 167: Middle East & Africa Salicylic Acid Market Revenue (US$ Mn) (2016-2032)
- Figure 168: Middle East & Africa Salicylic Acid Market Revenue (US$ Mn) Comparison by Country (2016-2032)
- Figure 169: Middle East & Africa Salicylic Acid Market Revenue (US$ Mn) Comparison by Form (2016-2032)
- Figure 170: Middle East & Africa Salicylic Acid Market Revenue (US$ Mn) Comparison by Type (2016-2032)
- Figure 171: Middle East & Africa Salicylic Acid Market Revenue (US$ Mn) Comparison by Grade (2016-2032)
- Figure 172: Middle East & Africa Salicylic Acid Market Revenue (US$ Mn) Comparison by Application (2016-2032)
- Figure 173: Middle East & Africa Salicylic Acid Market Y-o-Y Growth Rate Comparison by Country (2016-2032)
- Figure 174: Middle East & Africa Salicylic Acid Market Y-o-Y Growth Rate Comparison by Form (2016-2032)
- Figure 175: Middle East & Africa Salicylic Acid Market Y-o-Y Growth Rate Comparison by Type (2016-2032)
- Figure 176: Middle East & Africa Salicylic Acid Market Y-o-Y Growth Rate Comparison by Grade (2016-2032)
- Figure 177: Middle East & Africa Salicylic Acid Market Y-o-Y Growth Rate Comparison by Application (2016-2032)
- Figure 178: Middle East & Africa Salicylic Acid Market Share Comparison by Country (2016-2032)
- Figure 179: Middle East & Africa Salicylic Acid Market Share Comparison by Form (2016-2032)
- Figure 180: Middle East & Africa Salicylic Acid Market Share Comparison by Type (2016-2032)
- Figure 181: Middle East & Africa Salicylic Acid Market Share Comparison by Grade (2016-2032)
- Figure 182: Middle East & Africa Salicylic Acid Market Share Comparison by Application (2016-2032)
- List of Tables
- Table 1: Global Salicylic Acid Market Comparison by Form (2016-2032)
- Table 2: Global Salicylic Acid Market Comparison by Type (2016-2032)
- Table 3: Global Salicylic Acid Market Comparison by Grade (2016-2032)
- Table 4: Global Salicylic Acid Market Comparison by Application (2016-2032)
- Table 5: Global Salicylic Acid Market Revenue (US$ Mn) Comparison by Region (2016-2032)
- Table 6: Global Salicylic Acid Market Revenue (US$ Mn) (2016-2032)
- Table 7: Global Salicylic Acid Market Revenue (US$ Mn) Comparison by Region (2016-2032)
- Table 8: Global Salicylic Acid Market Revenue (US$ Mn) Comparison by Form (2016-2032)
- Table 9: Global Salicylic Acid Market Revenue (US$ Mn) Comparison by Type (2016-2032)
- Table 10: Global Salicylic Acid Market Revenue (US$ Mn) Comparison by Grade (2016-2032)
- Table 11: Global Salicylic Acid Market Revenue (US$ Mn) Comparison by Application (2016-2032)
- Table 12: Global Salicylic Acid Market Y-o-Y Growth Rate Comparison by Region (2016-2032)
- Table 13: Global Salicylic Acid Market Y-o-Y Growth Rate Comparison by Form (2016-2032)
- Table 14: Global Salicylic Acid Market Y-o-Y Growth Rate Comparison by Type (2016-2032)
- Table 15: Global Salicylic Acid Market Y-o-Y Growth Rate Comparison by Grade (2016-2032)
- Table 16: Global Salicylic Acid Market Y-o-Y Growth Rate Comparison by Application (2016-2032)
- Table 17: Global Salicylic Acid Market Share Comparison by Region (2016-2032)
- Table 18: Global Salicylic Acid Market Share Comparison by Form (2016-2032)
- Table 19: Global Salicylic Acid Market Share Comparison by Type (2016-2032)
- Table 20: Global Salicylic Acid Market Share Comparison by Grade (2016-2032)
- Table 21: Global Salicylic Acid Market Share Comparison by Application (2016-2032)
- Table 22: North America Salicylic Acid Market Comparison by Type (2016-2032)
- Table 23: North America Salicylic Acid Market Comparison by Grade (2016-2032)
- Table 24: North America Salicylic Acid Market Comparison by Application (2016-2032)
- Table 25: North America Salicylic Acid Market Revenue (US$ Mn) Comparison by Country (2016-2032)
- Table 26: North America Salicylic Acid Market Revenue (US$ Mn) (2016-2032)
- Table 27: North America Salicylic Acid Market Revenue (US$ Mn) Comparison by Country (2016-2032)
- Table 28: North America Salicylic Acid Market Revenue (US$ Mn) Comparison by Form (2016-2032)
- Table 29: North America Salicylic Acid Market Revenue (US$ Mn) Comparison by Type (2016-2032)
- Table 30: North America Salicylic Acid Market Revenue (US$ Mn) Comparison by Grade (2016-2032)
- Table 31: North America Salicylic Acid Market Revenue (US$ Mn) Comparison by Application (2016-2032)
- Table 32: North America Salicylic Acid Market Y-o-Y Growth Rate Comparison by Country (2016-2032)
- Table 33: North America Salicylic Acid Market Y-o-Y Growth Rate Comparison by Form (2016-2032)
- Table 34: North America Salicylic Acid Market Y-o-Y Growth Rate Comparison by Type (2016-2032)
- Table 35: North America Salicylic Acid Market Y-o-Y Growth Rate Comparison by Grade (2016-2032)
- Table 36: North America Salicylic Acid Market Y-o-Y Growth Rate Comparison by Application (2016-2032)
- Table 37: North America Salicylic Acid Market Share Comparison by Country (2016-2032)
- Table 38: North America Salicylic Acid Market Share Comparison by Form (2016-2032)
- Table 39: North America Salicylic Acid Market Share Comparison by Type (2016-2032)
- Table 40: North America Salicylic Acid Market Share Comparison by Grade (2016-2032)
- Table 41: North America Salicylic Acid Market Share Comparison by Application (2016-2032)
- Table 42: Western Europe Salicylic Acid Market Comparison by Form (2016-2032)
- Table 43: Western Europe Salicylic Acid Market Comparison by Type (2016-2032)
- Table 44: Western Europe Salicylic Acid Market Comparison by Grade (2016-2032)
- Table 45: Western Europe Salicylic Acid Market Comparison by Application (2016-2032)
- Table 46: Western Europe Salicylic Acid Market Revenue (US$ Mn) Comparison by Country (2016-2032)
- Table 47: Western Europe Salicylic Acid Market Revenue (US$ Mn) (2016-2032)
- Table 48: Western Europe Salicylic Acid Market Revenue (US$ Mn) Comparison by Country (2016-2032)
- Table 49: Western Europe Salicylic Acid Market Revenue (US$ Mn) Comparison by Form (2016-2032)
- Table 50: Western Europe Salicylic Acid Market Revenue (US$ Mn) Comparison by Type (2016-2032)
- Table 51: Western Europe Salicylic Acid Market Revenue (US$ Mn) Comparison by Grade (2016-2032)
- Table 52: Western Europe Salicylic Acid Market Revenue (US$ Mn) Comparison by Application (2016-2032)
- Table 53: Western Europe Salicylic Acid Market Y-o-Y Growth Rate Comparison by Country (2016-2032)
- Table 54: Western Europe Salicylic Acid Market Y-o-Y Growth Rate Comparison by Form (2016-2032)
- Table 55: Western Europe Salicylic Acid Market Y-o-Y Growth Rate Comparison by Type (2016-2032)
- Table 56: Western Europe Salicylic Acid Market Y-o-Y Growth Rate Comparison by Grade (2016-2032)
- Table 57: Western Europe Salicylic Acid Market Y-o-Y Growth Rate Comparison by Application (2016-2032)
- Table 58: Western Europe Salicylic Acid Market Share Comparison by Country (2016-2032)
- Table 59: Western Europe Salicylic Acid Market Share Comparison by Form (2016-2032)
- Table 60: Western Europe Salicylic Acid Market Share Comparison by Type (2016-2032)
- Table 61: Western Europe Salicylic Acid Market Share Comparison by Grade (2016-2032)
- Table 62: Western Europe Salicylic Acid Market Share Comparison by Application (2016-2032)
- Table 63: Eastern Europe Salicylic Acid Market Comparison by Form (2016-2032)
- Table 64: Eastern Europe Salicylic Acid Market Comparison by Type (2016-2032)
- Table 65: Eastern Europe Salicylic Acid Market Comparison by Grade (2016-2032)
- Table 66: Eastern Europe Salicylic Acid Market Comparison by Application (2016-2032)
- Table 67: Eastern Europe Salicylic Acid Market Revenue (US$ Mn) Comparison by Country (2016-2032)
- Table 68: Eastern Europe Salicylic Acid Market Revenue (US$ Mn) (2016-2032)
- Table 69: Eastern Europe Salicylic Acid Market Revenue (US$ Mn) Comparison by Country (2016-2032)
- Table 70: Eastern Europe Salicylic Acid Market Revenue (US$ Mn) Comparison by Form (2016-2032)
- Table 71: Eastern Europe Salicylic Acid Market Revenue (US$ Mn) Comparison by Type (2016-2032)
- Table 72: Eastern Europe Salicylic Acid Market Revenue (US$ Mn) Comparison by Grade (2016-2032)
- Table 73: Eastern Europe Salicylic Acid Market Revenue (US$ Mn) Comparison by Application (2016-2032)
- Table 74: Eastern Europe Salicylic Acid Market Y-o-Y Growth Rate Comparison by Country (2016-2032)
- Table 75: Eastern Europe Salicylic Acid Market Y-o-Y Growth Rate Comparison by Form (2016-2032)
- Table 76: Eastern Europe Salicylic Acid Market Y-o-Y Growth Rate Comparison by Type (2016-2032)
- Table 77: Eastern Europe Salicylic Acid Market Y-o-Y Growth Rate Comparison by Grade (2016-2032)
- Table 78: Eastern Europe Salicylic Acid Market Y-o-Y Growth Rate Comparison by Application (2016-2032)
- Table 79: Eastern Europe Salicylic Acid Market Share Comparison by Country (2016-2032)
- Table 80: Eastern Europe Salicylic Acid Market Share Comparison by Form (2016-2032)
- Table 81: Eastern Europe Salicylic Acid Market Share Comparison by Type (2016-2032)
- Table 82: Eastern Europe Salicylic Acid Market Share Comparison by Grade (2016-2032)
- Table 83: Eastern Europe Salicylic Acid Market Share Comparison by Application (2016-2032)
- Table 84: APAC Salicylic Acid Market Comparison by Form (2016-2032)
- Table 85: APAC Salicylic Acid Market Comparison by Type (2016-2032)
- Table 86: APAC Salicylic Acid Market Comparison by Grade (2016-2032)
- Table 87: APAC Salicylic Acid Market Comparison by Application (2016-2032)
- Table 88: APAC Salicylic Acid Market Revenue (US$ Mn) Comparison by Country (2016-2032)
- Table 89: APAC Salicylic Acid Market Revenue (US$ Mn) (2016-2032)
- Table 90: APAC Salicylic Acid Market Revenue (US$ Mn) Comparison by Country (2016-2032)
- Table 91: APAC Salicylic Acid Market Revenue (US$ Mn) Comparison by Form (2016-2032)
- Table 92: APAC Salicylic Acid Market Revenue (US$ Mn) Comparison by Type (2016-2032)
- Table 93: APAC Salicylic Acid Market Revenue (US$ Mn) Comparison by Grade (2016-2032)
- Table 94: APAC Salicylic Acid Market Revenue (US$ Mn) Comparison by Application (2016-2032)
- Table 95: APAC Salicylic Acid Market Y-o-Y Growth Rate Comparison by Country (2016-2032)
- Table 96: APAC Salicylic Acid Market Y-o-Y Growth Rate Comparison by Form (2016-2032)
- Table 97: APAC Salicylic Acid Market Y-o-Y Growth Rate Comparison by Type (2016-2032)
- Table 98: APAC Salicylic Acid Market Y-o-Y Growth Rate Comparison by Grade (2016-2032)
- Table 99: APAC Salicylic Acid Market Y-o-Y Growth Rate Comparison by Application (2016-2032)
- Table 100: APAC Salicylic Acid Market Share Comparison by Country (2016-2032)
- Table 101: APAC Salicylic Acid Market Share Comparison by Form (2016-2032)
- Table 102: APAC Salicylic Acid Market Share Comparison by Type (2016-2032)
- Table 103: APAC Salicylic Acid Market Share Comparison by Grade (2016-2032)
- Table 104: APAC Salicylic Acid Market Share Comparison by Application (2016-2032)
- Table 105: Latin America Salicylic Acid Market Comparison by Form (2016-2032)
- Table 106: Latin America Salicylic Acid Market Comparison by Type (2016-2032)
- Table 107: Latin America Salicylic Acid Market Comparison by Grade (2016-2032)
- Table 108: Latin America Salicylic Acid Market Comparison by Application (2016-2032)
- Table 109: Latin America Salicylic Acid Market Revenue (US$ Mn) Comparison by Country (2016-2032)
- Table 110: Latin America Salicylic Acid Market Revenue (US$ Mn) (2016-2032)
- Table 111: Latin America Salicylic Acid Market Revenue (US$ Mn) Comparison by Country (2016-2032)
- Table 112: Latin America Salicylic Acid Market Revenue (US$ Mn) Comparison by Form (2016-2032)
- Table 113: Latin America Salicylic Acid Market Revenue (US$ Mn) Comparison by Type (2016-2032)
- Table 114: Latin America Salicylic Acid Market Revenue (US$ Mn) Comparison by Grade (2016-2032)
- Table 115: Latin America Salicylic Acid Market Revenue (US$ Mn) Comparison by Application (2016-2032)
- Table 116: Latin America Salicylic Acid Market Y-o-Y Growth Rate Comparison by Country (2016-2032)
- Table 117: Latin America Salicylic Acid Market Y-o-Y Growth Rate Comparison by Form (2016-2032)
- Table 118: Latin America Salicylic Acid Market Y-o-Y Growth Rate Comparison by Type (2016-2032)
- Table 119: Latin America Salicylic Acid Market Y-o-Y Growth Rate Comparison by Grade (2016-2032)
- Table 120: Latin America Salicylic Acid Market Y-o-Y Growth Rate Comparison by Application (2016-2032)
- Table 121: Latin America Salicylic Acid Market Share Comparison by Country (2016-2032)
- Table 122: Latin America Salicylic Acid Market Share Comparison by Form (2016-2032)
- Table 123: Latin America Salicylic Acid Market Share Comparison by Type (2016-2032)
- Table 124: Latin America Salicylic Acid Market Share Comparison by Grade (2016-2032)
- Table 125: Latin America Salicylic Acid Market Share Comparison by Application (2016-2032)
- Table 126: Middle East & Africa Salicylic Acid Market Comparison by Form (2016-2032)
- Table 127: Middle East & Africa Salicylic Acid Market Comparison by Type (2016-2032)
- Table 128: Middle East & Africa Salicylic Acid Market Comparison by Grade (2016-2032)
- Table 129: Middle East & Africa Salicylic Acid Market Comparison by Application (2016-2032)
- Table 130: Middle East & Africa Salicylic Acid Market Revenue (US$ Mn) Comparison by Country (2016-2032)
- Table 131: Middle East & Africa Salicylic Acid Market Revenue (US$ Mn) (2016-2032)
- Table 132: Middle East & Africa Salicylic Acid Market Revenue (US$ Mn) Comparison by Country (2016-2032)
- Table 133: Middle East & Africa Salicylic Acid Market Revenue (US$ Mn) Comparison by Form (2016-2032)
- Table 134: Middle East & Africa Salicylic Acid Market Revenue (US$ Mn) Comparison by Type (2016-2032)
- Table 135: Middle East & Africa Salicylic Acid Market Revenue (US$ Mn) Comparison by Grade (2016-2032)
- Table 136: Middle East & Africa Salicylic Acid Market Revenue (US$ Mn) Comparison by Application (2016-2032)
- Table 137: Middle East & Africa Salicylic Acid Market Y-o-Y Growth Rate Comparison by Country (2016-2032)
- Table 138: Middle East & Africa Salicylic Acid Market Y-o-Y Growth Rate Comparison by Form (2016-2032)
- Table 139: Middle East & Africa Salicylic Acid Market Y-o-Y Growth Rate Comparison by Type (2016-2032)
- Table 140: Middle East & Africa Salicylic Acid Market Y-o-Y Growth Rate Comparison by Grade (2016-2032)
- Table 141: Middle East & Africa Salicylic Acid Market Y-o-Y Growth Rate Comparison by Application (2016-2032)
- Table 142: Middle East & Africa Salicylic Acid Market Share Comparison by Country (2016-2032)
- Table 143: Middle East & Africa Salicylic Acid Market Share Comparison by Form (2016-2032)
- Table 144: Middle East & Africa Salicylic Acid Market Share Comparison by Type (2016-2032)
- Table 145: Middle East & Africa Salicylic Acid Market Share Comparison by Grade (2016-2032)
- Table 146: Middle East & Africa Salicylic Acid Market Share Comparison by Application (2016-2032)
- 1. Executive Summary
-
- Alfa Aesar
- Alta Laboratories
- Hebei Jingye Group
- Huayin Jinqiancheng
- JM Loveridge Limited
- Merck & Co. Inc.
- Novocap
- Seqens International
- Seqens SAS
- Shandong Xinhua Longxin Chemical Co. Ltd
- Siddharth Carbochem Products Ltd
- Simco Chemicals
- Spectrum Chemical Manufacturing Corp
- Thermo Fisher Scientific
- Zhenjiang Gaopeng Pharmaceutical Co., Ltd.
Our Clients


View Our Licence Options
