
Global Ready To Use Therapeutic Food Market By Type (Drinkable therapeutic food, Paste, Solid), By End-user(SNGOs, WFP, UNICEF, Others), By Region And Companies - Industry Segment Outlook, Market Assessment, Competition Scenario, Trends, And Forecast 2024-2033
-
46334
-
May 2024
-
300
-


-
This report was compiled by Shreyas Rokade Shreyas Rokade is a seasoned Research Analyst with CMFE, bringing extensive expertise in market research and consulting, with a strong background in Chemical Engineering. Correspondence Team Lead-CMFE Linkedin | Detailed Market research Methodology Our methodology involves a mix of primary research, including interviews with leading mental health experts, and secondary research from reputable medical journals and databases. View Detailed Methodology Page
-
Quick Navigation
Report Overview
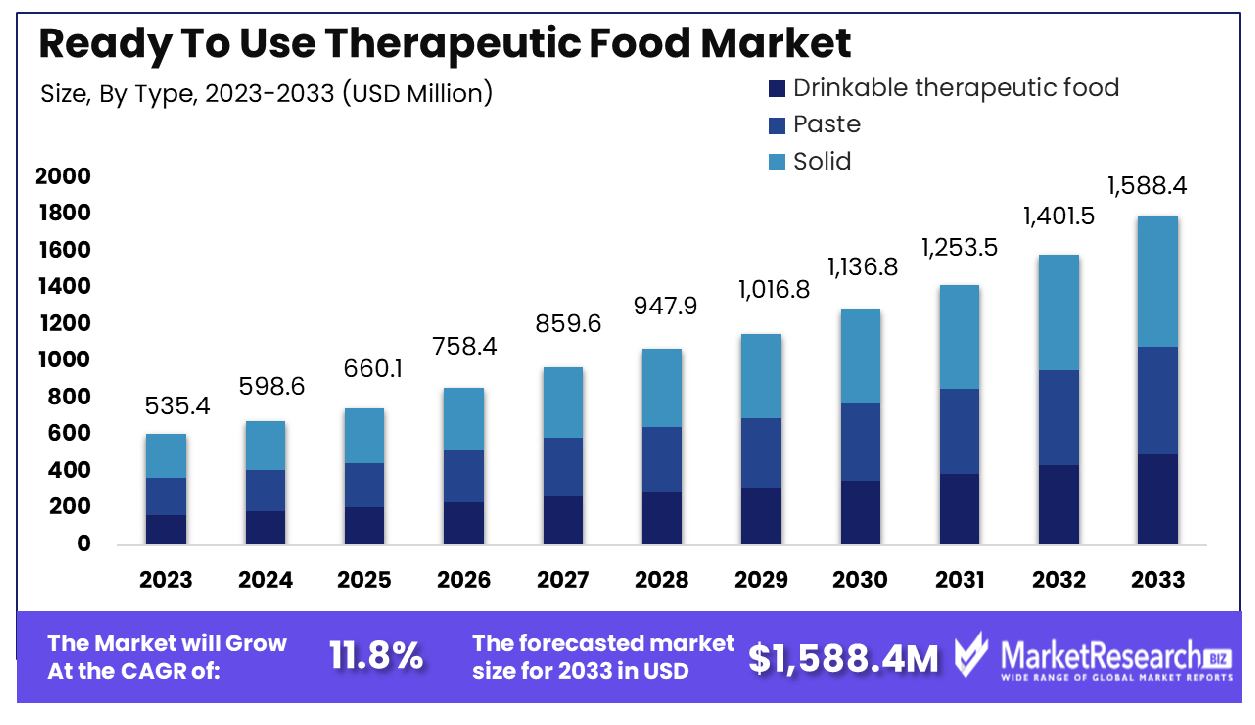
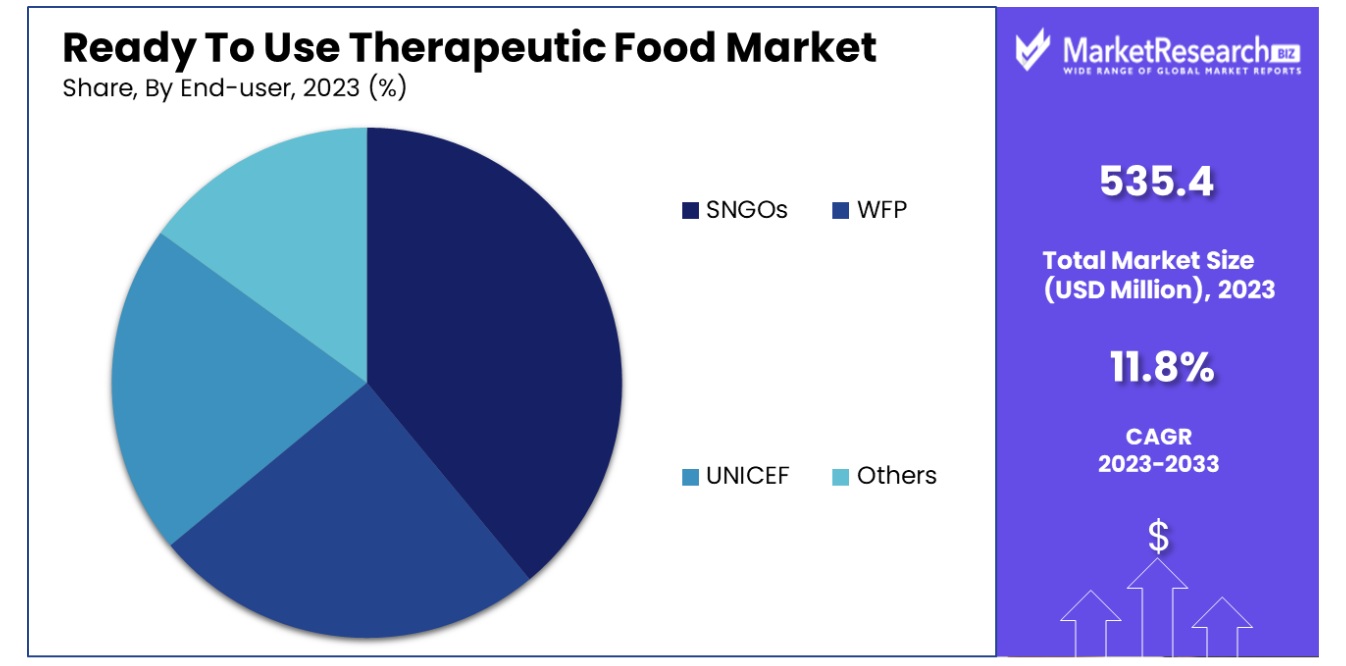
The Global Ready To Use Therapeutic Food Market was valued at USD 535.4 million in 2023. It is expected to reach USD 1,588.4 million by 2033, with a CAGR of 11.8% during the forecast period from 2024 to 2033.
The Ready To Use Therapeutic Food (RUTF) Market encompasses specialized, energy-dense foods designed for the dietary management of malnutrition. These products are shelf-stable, require no preparation, and are formulated to deliver a high nutrient payload essential for recovery. This market caters primarily to healthcare sectors, humanitarian organizations, and government bodies.
RUTF products are pivotal in global health strategies, particularly in areas plagued by food insecurity. The demand in this market is driven by rising malnutrition awareness, global humanitarian needs, and support from international health organizations. For leaders in healthcare and nutrition, RUTF represents a critical component in addressing urgent global malnutrition challenges.
The Ready To Use Therapeutic Food (RUTF) market has witnessed substantial growth, driven by an escalating global demand to address severe malnutrition among children. In 2022, UNICEF's procurement of RUTF scaled significantly to 121,400 metric tons—an increase of 37% over the average annual volumes observed in prior years.
This surge primarily occurred in the fourth quarter, aligning with the timing of funding availability, and was sufficient to treat approximately 4.8 million children. UNICEF, securing between 75-80% of the globally funded demand annually, remains a principal procurer, with USAID contributing an additional 5-10% to the total procurement.
Despite these advancements, challenges persist. Notably, 50-75% of children suffering from severe wasting remain untreated, highlighting a critical gap in access to necessary nutritional interventions. This discrepancy underscores the need for increased production capacities, enhanced funding mechanisms, and more robust distribution networks to ensure wider accessibility and effectiveness of treatment programs.
The market's growth is poised to continue, influenced by heightened awareness and the rising prevalence of acute malnutrition globally. However, addressing the treatment gap requires concerted efforts from both the public and private sectors to innovate and scale solutions that can meet the urgent needs of this vulnerable population.
Key Takeaways
- Market Growth: The Global Ready To Use Therapeutic Food Market was valued at USD 535.4 million in 2023. It is expected to reach USD 1,588.4 million by 2033, with a CAGR of 11.8% during the forecast period from 2024 to 2033.
- By Type: solid products dominated with a 65% market share.
- By End-user: SNGOs held the majority with 52% dominance.
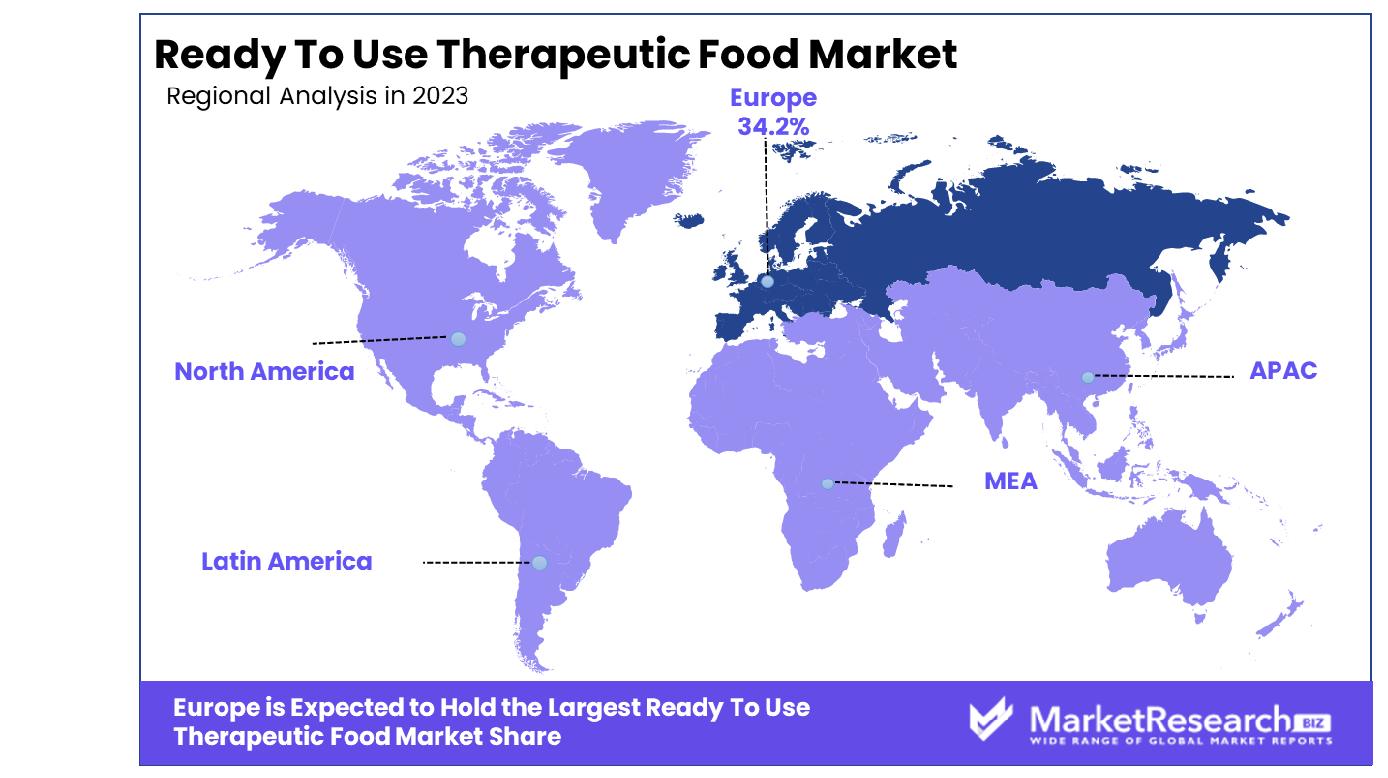
- Regional Dominance: The Ready-To-Use Therapeutic Food market in Europe grew by 34.2%.
- Growth Opportunity: In 2023, global efforts to combat malnutrition boost the Ready To Use Therapeutic Food (RUTF) market, driven by research into cost-effective, nutritious ingredients, expanding access and efficacy.
Driving factors
Expansion of Local Market Availability Enhancing Accessibility
The growing availability of Ready To Use Therapeutic Food (RUTF) in local markets significantly drives its accessibility and adoption. By increasing the points of sale within closer geographic proximity to needy populations, the deployment of RUTF is greatly facilitated, ensuring that vital nutritional support reaches malnourished children more rapidly and efficiently.
This local availability is particularly crucial in remote or conflict-affected regions where logistical challenges often impede timely aid delivery. Market research indicates that enhanced local distribution channels not only increase the usage rates of RUTF but also bolster the market's overall growth trajectory by integrating supply chains more deeply into the communities they serve.
Government Procurement Policies Fueling Market Expansion
Increased procurement of RUTF by governments acts as a critical catalyst for market growth. Governments, especially in countries with high malnutrition rates, are prioritizing nutritional interventions as a part of public health policy. This trend is reflected in the allocation of increased budgets for the procurement of therapeutic foods, driven by the proven efficacy of RUTF in combating malnutrition among children.
For instance, initiatives by the World Health Organization and UNICEF have encouraged governments to integrate RUTF into their national health programs, which has directly resulted in amplified market demand and stimulated production and innovation in the sector.
Adoption of Sugar Substitutes Aligning with Health Trends
The rising trend of utilizing sugar substitutes in the formulation of RUTF aligns with global health trends advocating for reduced sugar intake. This shift not only caters to the nutritional needs of the target demographic but also addresses broader consumer demands for healthier food options.
By incorporating sugar alternatives that maintain the palatability and effectiveness of RUTF while reducing potential health risks associated with high sugar consumption, manufacturers are able to appeal to a more health-conscious market. This adaptation not only enhances the market appeal of RUTF products but also supports market growth by aligning with contemporary dietary guidelines and consumer preferences.
Restraining Factors
Impact of Raw Material Price Fluctuations and Supply Chain Disruptions
The volatility in raw material prices and frequent disruptions in supply chains significantly restrain the growth of the Ready To Use Therapeutic Food (RUTF) market. These fluctuations often lead to unpredictable costs and delays in production, which can, in turn, impact the pricing and availability of the final product. For instance, the COVID-19 pandemic highlighted how global emergencies could lead to severe bottlenecks in supply chains, affecting the timely delivery of critical nutritional products to malnourished populations.
Such instability can deter investment in the sector, as manufacturers face increased risks associated with inventory and cash flow management. Consequently, the uncertainty in supply chains and raw material costs can create a challenging environment for scaling up RUTF production, ultimately impeding market growth.
Challenges Posed by the Lack of Skilled Professionals
The shortage of skilled professionals to handle and distribute RUTF products further complicates the market landscape. Effective distribution and administration of RUTF require trained healthcare providers who can ensure that the therapeutic food reaches those in need and is used correctly to achieve the desired health outcomes.
In regions most affected by malnutrition, there is often a parallel deficit in healthcare infrastructure and professional training, which exacerbates the problem. Without adequate training programs for local health workers and caregivers, the potential of RUTF to combat malnutrition is not fully realized, hindering both the effectiveness and the expansion of the market. This lack of skilled professionals not only affects operational efficiency but also limits the geographical reach and impact of RUTF interventions.
By Type Analysis:
Solid forms dominated the market with a 65% share, highlighting their widespread preference.
In 2023, Solid held a dominant market position in the "By Type" segment of the Ready To Use Therapeutic Food (RUTF) Market, capturing more than a 65% share. This market segment, which includes drinkable therapeutic food, paste, and solid forms, has seen varying levels of demand, with solids leading significantly.
Solid RUTFs are favored for their ease of distribution, long shelf life, and no need for preparation or refrigeration, making them highly suitable for use in remote and resource-limited settings. This has propelled their dominance in the market, especially in regions with high incidences of malnutrition and limited healthcare infrastructure.
The paste form of RUTF, while also widely used, has secured a smaller market share compared to solids. Pastes are generally more palatable and easier for younger children to consume but involve slightly higher costs for production and transport, which can limit their use in budget-constrained programs.
Drinkable therapeutic foods, although innovative and effective for certain nutritional needs, have the smallest share. This form of RUTF requires some level of preservation and careful handling during distribution, which can pose logistical challenges in crisis-affected areas.
The overall market dynamics of the RUTF segment are influenced by factors such as global health policies, donor funding, and the operational capabilities of non-governmental organizations and local governments. With solid forms leading the market, stakeholders are encouraged to optimize production and distribution strategies to meet the urgent nutritional needs effectively. The continued growth and dominance of solid RUTFs underscore the critical role they play in global health interventions aimed at combating acute malnutrition.
By End-user Analysis:
Social and Non-Governmental Organizations (SNGOs) held a significant 52% market share, leading demand.
In 2023, SNGOs held a dominant market position in the "By End-user" segment of the Ready To Use Therapeutic Food (RUTF) Market, capturing more than a 52% share. This segment is broadly categorized into several key players: SNGOs, WFP (World Food Programme), UNICEF, and others, which include smaller NGOs and government bodies.
The significant market share held by SNGOs can be attributed to their extensive on-ground networks and capabilities in reaching remote and conflict-affected regions where malnutrition rates are particularly high. SNGOs are often more flexible in operation and can implement community-based programs effectively, which is crucial for the distribution and administration of RUTF.
WFP and UNICEF also play critical roles but have distinct operational focuses. WFP often manages emergency response and recovery operations, which utilize RUTF for immediate nutritional support during crises. UNICEF, on the other hand, focuses more on children's health and preventive programs, integrating RUTF into broader health and nutrition services.
The category labeled "Others" includes a variety of stakeholders such as local NGOs and government programs. Although they hold a smaller share of the market, their impact on local scales can be significant, particularly in areas where larger organizations have limited reach.
The dominance of SNGOs in this market underscores the importance of collaborative efforts and partnerships in addressing global malnutrition challenges. Their ability to adapt quickly and work closely with local communities ensures that RUTF reaches those most in need, thereby enhancing the overall effectiveness of global health and nutrition programs.
Key Market Segments
By Type
- Drinkable therapeutic food
- Paste
- Solid
By End-user
- SNGOs
- WFP
- UNICEF
- Others
Growth Opportunity
Growing International Concern to Combat Malnutrition
The escalation of global initiatives to address malnutrition has notably propelled the market for Ready To Use Therapeutic Food (RUTF) in 2023. International agencies and governments are increasingly focusing on malnutrition, particularly in regions plagued by food insecurity and poverty. This heightened attention is a direct response to the urgent need to improve health outcomes and reduce the mortality rates associated with undernutrition.
The strategic deployment of RUTF as a pivotal component in international health campaigns has catalyzed its demand, with support being channeled through global health programs and humanitarian aid. The commitment of such entities to eradicate malnutrition is expected to continue driving the RUTF market's expansion, positioning it as a critical tool in the global health arsenal.
Research and Development for Affordable and Effective Ingredients
In 2023, the RUTF market is witnessing a surge in research and development efforts aimed at enhancing the efficacy and affordability of these vital nutritional products. The focus is predominantly on innovating formulations that not only meet the nutritional needs of malnourished populations but also ensure cost-effectiveness to facilitate broader accessibility.
Advances in food technology and nutrition science are enabling the development of new ingredients that improve the palatability and nutritional profile of RUTFs without escalating costs. Such developments are crucial for scaling the production and distribution of RUTF to meet global demands effectively. The ongoing investment in R&D is pivotal in sustaining the growth trajectory of the RUTF market, as it seeks to deliver more impactful nutritional solutions across diverse geographical regions.
Latest Trends
Strengthening National Capacity for RUTF Management
In 2023, a significant trend in the global Ready To Use Therapeutic Food (RUTF) market is the enhancement of national capacities to manage RUTF programs. Governments, particularly in countries with high rates of malnutrition, are prioritizing the establishment and strengthening of local infrastructure and capabilities to handle RUTF logistics and distribution.
This includes training healthcare workers, improving storage facilities, and streamlining supply chains to ensure timely and efficient delivery of RUTF to affected communities. By investing in national capacity, countries are aiming to enhance their self-sufficiency in managing malnutrition crises, reducing dependency on international aid, and improving overall program sustainability and effectiveness.
Emphasis on Food Safety and Quality Control in RUTF Production
The global RUTF market in 2023 also witnesses an increased focus on food safety and quality control measures in the production of therapeutic foods. With RUTFs being critical in treating severe acute malnutrition, ensuring their safety and nutritional integrity is paramount. Manufacturers are adopting stringent quality control protocols and leveraging advanced technology to monitor and maintain product standards throughout the production process.
This trend is driven by regulatory pressures as well as by the need to gain the trust of healthcare providers and recipients. Enhanced safety and quality assurance practices not only comply with international health and safety standards but also reinforce the effectiveness and reliability of RUTF interventions in global malnutrition treatment programs.
Regional Analysis
The Ready-to-Use Therapeutic Food market in Europe is projected to grow at a rate of 34.2%.
The global Ready-To-Use Therapeutic Food (RUTF) market exhibits significant regional variations in growth and market share, influenced by differing health challenges, nutritional needs, and governmental policies. North America has seen moderate growth, driven by increasing awareness of malnutrition and supportive healthcare policies.
The market in this region is characterized by high adoption rates of innovative RUTF formulations, with the U.S. being a key contributor due to its robust healthcare infrastructure and extensive distribution networks. In Europe, the RUTF market is dominated by a substantial 34.2% share, attributed to strong governmental and non-governmental efforts in addressing child malnutrition, especially in countries like France and Germany, which are at the forefront of implementing effective nutrition programs.
Asia Pacific is experiencing rapid market expansion, fueled by high malnutrition rates in countries such as India and Bangladesh. The region's large population and increasing governmental and NGO intervention programs have accelerated market growth, making it a critical area for future investments. The Middle East & Africa region is another significant market, primarily driven by high malnutrition prevalence and substantial international aid. Countries like Sudan and Nigeria are major consumers of RUTF due to ongoing humanitarian crises and severe malnutrition issues, which necessitate substantial RUTF supplies.
Latin America, although a smaller market, is showing steady growth with increasing awareness and intervention programs in countries like Brazil and Guatemala. Regional governments and international organizations are progressively focusing on combating malnutrition, thus driving market demand.
Key Regions and Countries
North America
- The US
- Canada
- Rest of North America
Europe
- Germany
- France
- The UK
- Spain
- Netherlands
- Russia
- Italy
- Rest of Europe
Asia-Pacific
- China
- Japan
- Singapore
- Thailand
- South Korea
- Vietnam
- India
- New Zealand
- Rest of Asia Pacific
Latin America
- Mexico
- Brazil
- Rest of Latin America
Middle East & Africa
- Saudi Arabia
- South Africa
- UAE
- Rest of Middle East & Africa
Key Players Analysis
In 2023, the global Ready-To-Use Therapeutic Food (RUTF) market witnessed notable contributions from several key players, each bringing unique strengths and strategies to address global malnutrition. Nuflower Foods and GC Rieber Compact AS have been pivotal in expanding their production capacities and enhancing distribution networks, ensuring the availability of RUTF in remote and high-need areas. Their innovative product formulations and commitment to quality have set industry benchmarks.
Valid Nutrition has continued to leverage its extensive research and development capabilities to introduce nutrient-rich RUTF products, addressing specific regional dietary deficiencies. InnoFaso Corp. and Edesia Inc. have focused on collaborations with international aid organizations, enhancing the outreach and impact of their RUTF solutions in critical regions affected by severe malnutrition.
Nutrivita Foods Ltd. and Diva Nutritional Products have made significant strides in optimizing cost-effective production techniques, making RUTF more affordable and accessible. Insta Products Ltd. has emphasized sustainability, sourcing locally grown ingredients to support local economies and reduce carbon footprints, while ensuring high nutritional value in their products.
Mana Nutritive Aid Product Inc. and Meds & Food for Kids Inc. have been instrumental in community-based initiatives, providing both immediate nutritional relief and long-term solutions to malnutrition through education and local production. Samil Industrial Co. and Tabatchnick Fine Foods Inc. have diversified their product lines, offering a range of RUTF options tailored to different age groups and nutritional needs.
Amul India Inc. and Hilina Enriched Foods PLC have capitalized on their extensive market presence and distribution capabilities in Asia and Africa, respectively, significantly contributing to the RUTF market's growth. Société de Transformation Alimentaire has played a crucial role in the Francophone regions, ensuring the availability of high-quality therapeutic foods through strategic partnerships and efficient supply chains.
Overall, these key players have collectively driven innovation, expanded accessibility, and strengthened the global RUTF market, underscoring their commitment to combating malnutrition worldwide. Their diverse approaches and strategic initiatives highlight the importance of collaboration and continuous improvement in addressing the complex challenge of global malnutrition.
Market Key Players
- Nuflower Foods
- GC Rieber Compact AS
- Valid Nutrition
- InnoFaso Corp.
- Edesia Inc.
- Nutrivita Foods Ltd.
- Diva Nutritional Products
- Insta Products Ltd.
- Mana Nutritive Aid Product Inc.
- Meds & Food for Kids Inc.
- Samil Industrial Co.
- Tabatchnick Fine Foods Inc.
- Amul India Inc.
- Hilina Enriched Foods PLC
- Société de Transformation Alimentaire
Recent Development
- In April 2024, UNICEF releases the first Healthy Market Framework (HMF) for Ready-to-Use Therapeutic Food (RUTF) market, showcasing a commitment to children's well-being and transparency in procurement.
- In April 2024, Action Against Hunger emphasized the health implications of the hunger crisis, urging holistic solutions and increased funding to address malnutrition as a global health issue.
Report Scope
Report Features Description Market Value (2023) USD 535.4 Million Forecast Revenue (2033) USD 1,588.4 Million CAGR (2024-2032) 11.8% Base Year for Estimation 2023 Historic Period 2016-2023 Forecast Period 2024-2033 Report Coverage Revenue Forecast, Market Dynamics, COVID-19 Impact, Competitive Landscape, Recent Developments Segments Covered By Type (Drinkable therapeutic food, Paste, Solid), By End-user(SNGOs, WFP, UNICEF, Others) Regional Analysis North America - The US, Canada, Rest of North America, Europe - Germany, France, The UK, Spain, Italy, Russia, Netherlands, Rest of Europe, Asia-Pacific - China, Japan, South Korea, India, New Zealand, Singapore, Thailand, Vietnam, Rest of Asia Pacific, Latin America - Brazil, Mexico, Rest of Latin America, Middle East & Africa - South Africa, Saudi Arabia, UAE, Rest of Middle East & Africa Competitive Landscape Nuflower Foods, GC Rieber Compact AS, Valid Nutrition, InnoFaso Corp., Edesia Inc., Nutrivita Foods Ltd., Diva Nutritional Products, Insta Products Ltd., Mana Nutritive Aid Product Inc., Meds & Food for Kids Inc., Samil Industrial Co., Tabatchnick Fine Foods Inc., Amul India Inc., Hilina Enriched Foods PLC, Société de Transformation Alimentaire Customization Scope Customization for segments, region/country-level will be provided. Moreover, additional customization can be done based on the requirements. Purchase Options We have three licenses to opt for Single User License, Multi-User License (Up to 5 Users), Corporate Use License (Unlimited User and Printable PDF) -
- 1. Executive Summary
- 1.1. Definition
- 1.2. Taxonomy
- 1.3. Research Scope
- 1.4. Key Analysis
- 1.5. Key Findings by Major Segments
- 1.6. Top strategies by Major Players
- 2. Global Ready To Use Therapeutic Food Market Overview
- 2.1. Ready To Use Therapeutic Food Market Dynamics
- 2.1.1. Drivers
- 2.1.2. Opportunities
- 2.1.3. Restraints
- 2.1.4. Challenges
- 2.2. Macro-economic Factors
- 2.3. Regulatory Framework
- 2.4. Market Investment Feasibility Index
- 2.5. PEST Analysis
- 2.6. PORTER’S Five Force Analysis
- 2.7. Drivers & Restraints Impact Analysis
- 2.8. Industry Chain Analysis
- 2.9. Cost Structure Analysis
- 2.10. Marketing Strategy
- 2.11. Russia-Ukraine War Impact Analysis
- 2.12. Opportunity Map Analysis
- 2.13. Market Competition Scenario Analysis
- 2.14. Product Life Cycle Analysis
- 2.15. Opportunity Orbits
- 2.16. Manufacturer Intensity Map
- 2.17. Major Companies sales by Value & Volume
- 2.1. Ready To Use Therapeutic Food Market Dynamics
- 3. Global Ready To Use Therapeutic Food Market Analysis, Opportunity and Forecast, 2016-2032
- 3.1. Global Ready To Use Therapeutic Food Market Analysis, 2016-2021
- 3.2. Global Ready To Use Therapeutic Food Market Opportunity and Forecast, 2023-2032
- 3.3. Global Ready To Use Therapeutic Food Market Analysis, Opportunity and Forecast, By By Type, 2016-2032
- 3.3.1. Global Ready To Use Therapeutic Food Market Analysis by By Type: Introduction
- 3.3.2. Market Size Absolute $ Opportunity Analysis and Forecast, By By Type, 2016-2032
- 3.3.3. Drinkable therapeutic food
- 3.3.4. Paste
- 3.3.5. Solid
- 3.4. Global Ready To Use Therapeutic Food Market Analysis, Opportunity and Forecast, By By End-user, 2016-2032
- 3.4.1. Global Ready To Use Therapeutic Food Market Analysis by By End-user: Introduction
- 3.4.2. Market Size Absolute $ Opportunity Analysis and Forecast, By By End-user, 2016-2032
- 3.4.3. SNGOs
- 3.4.4. WFP
- 3.4.5. UNICEF
- 3.4.6. Others
- 4. North America Ready To Use Therapeutic Food Market Analysis, Opportunity and Forecast, 2016-2032
- 4.1. North America Ready To Use Therapeutic Food Market Analysis, 2016-2021
- 4.2. North America Ready To Use Therapeutic Food Market Opportunity and Forecast, 2023-2032
- 4.3. North America Ready To Use Therapeutic Food Market Analysis, Opportunity and Forecast, By By Type, 2016-2032
- 4.3.1. North America Ready To Use Therapeutic Food Market Analysis by By Type: Introduction
- 4.3.2. Market Size Absolute $ Opportunity Analysis and Forecast, By By Type, 2016-2032
- 4.3.3. Drinkable therapeutic food
- 4.3.4. Paste
- 4.3.5. Solid
- 4.4. North America Ready To Use Therapeutic Food Market Analysis, Opportunity and Forecast, By By End-user, 2016-2032
- 4.4.1. North America Ready To Use Therapeutic Food Market Analysis by By End-user: Introduction
- 4.4.2. Market Size Absolute $ Opportunity Analysis and Forecast, By By End-user, 2016-2032
- 4.4.3. SNGOs
- 4.4.4. WFP
- 4.4.5. UNICEF
- 4.4.6. Others
- 4.5. North America Ready To Use Therapeutic Food Market Analysis, Opportunity and Forecast, By Country , 2016-2032
- 4.5.1. North America Ready To Use Therapeutic Food Market Analysis by Country : Introduction
- 4.5.2. Market Size Absolute $ Opportunity Analysis and Forecast, Country , 2016-2032
- 4.5.2.1. The US
- 4.5.2.2. Canada
- 4.5.2.3. Mexico
- 5. Western Europe Ready To Use Therapeutic Food Market Analysis, Opportunity and Forecast, 2016-2032
- 5.1. Western Europe Ready To Use Therapeutic Food Market Analysis, 2016-2021
- 5.2. Western Europe Ready To Use Therapeutic Food Market Opportunity and Forecast, 2023-2032
- 5.3. Western Europe Ready To Use Therapeutic Food Market Analysis, Opportunity and Forecast, By By Type, 2016-2032
- 5.3.1. Western Europe Ready To Use Therapeutic Food Market Analysis by By Type: Introduction
- 5.3.2. Market Size Absolute $ Opportunity Analysis and Forecast, By By Type, 2016-2032
- 5.3.3. Drinkable therapeutic food
- 5.3.4. Paste
- 5.3.5. Solid
- 5.4. Western Europe Ready To Use Therapeutic Food Market Analysis, Opportunity and Forecast, By By End-user, 2016-2032
- 5.4.1. Western Europe Ready To Use Therapeutic Food Market Analysis by By End-user: Introduction
- 5.4.2. Market Size Absolute $ Opportunity Analysis and Forecast, By By End-user, 2016-2032
- 5.4.3. SNGOs
- 5.4.4. WFP
- 5.4.5. UNICEF
- 5.4.6. Others
- 5.5. Western Europe Ready To Use Therapeutic Food Market Analysis, Opportunity and Forecast, By Country , 2016-2032
- 5.5.1. Western Europe Ready To Use Therapeutic Food Market Analysis by Country : Introduction
- 5.5.2. Market Size Absolute $ Opportunity Analysis and Forecast, Country , 2016-2032
- 5.5.2.1. Germany
- 5.5.2.2. France
- 5.5.2.3. The UK
- 5.5.2.4. Spain
- 5.5.2.5. Italy
- 5.5.2.6. Portugal
- 5.5.2.7. Ireland
- 5.5.2.8. Austria
- 5.5.2.9. Switzerland
- 5.5.2.10. Benelux
- 5.5.2.11. Nordic
- 5.5.2.12. Rest of Western Europe
- 6. Eastern Europe Ready To Use Therapeutic Food Market Analysis, Opportunity and Forecast, 2016-2032
- 6.1. Eastern Europe Ready To Use Therapeutic Food Market Analysis, 2016-2021
- 6.2. Eastern Europe Ready To Use Therapeutic Food Market Opportunity and Forecast, 2023-2032
- 6.3. Eastern Europe Ready To Use Therapeutic Food Market Analysis, Opportunity and Forecast, By By Type, 2016-2032
- 6.3.1. Eastern Europe Ready To Use Therapeutic Food Market Analysis by By Type: Introduction
- 6.3.2. Market Size Absolute $ Opportunity Analysis and Forecast, By By Type, 2016-2032
- 6.3.3. Drinkable therapeutic food
- 6.3.4. Paste
- 6.3.5. Solid
- 6.4. Eastern Europe Ready To Use Therapeutic Food Market Analysis, Opportunity and Forecast, By By End-user, 2016-2032
- 6.4.1. Eastern Europe Ready To Use Therapeutic Food Market Analysis by By End-user: Introduction
- 6.4.2. Market Size Absolute $ Opportunity Analysis and Forecast, By By End-user, 2016-2032
- 6.4.3. SNGOs
- 6.4.4. WFP
- 6.4.5. UNICEF
- 6.4.6. Others
- 6.5. Eastern Europe Ready To Use Therapeutic Food Market Analysis, Opportunity and Forecast, By Country , 2016-2032
- 6.5.1. Eastern Europe Ready To Use Therapeutic Food Market Analysis by Country : Introduction
- 6.5.2. Market Size Absolute $ Opportunity Analysis and Forecast, Country , 2016-2032
- 6.5.2.1. Russia
- 6.5.2.2. Poland
- 6.5.2.3. The Czech Republic
- 6.5.2.4. Greece
- 6.5.2.5. Rest of Eastern Europe
- 7. APAC Ready To Use Therapeutic Food Market Analysis, Opportunity and Forecast, 2016-2032
- 7.1. APAC Ready To Use Therapeutic Food Market Analysis, 2016-2021
- 7.2. APAC Ready To Use Therapeutic Food Market Opportunity and Forecast, 2023-2032
- 7.3. APAC Ready To Use Therapeutic Food Market Analysis, Opportunity and Forecast, By By Type, 2016-2032
- 7.3.1. APAC Ready To Use Therapeutic Food Market Analysis by By Type: Introduction
- 7.3.2. Market Size Absolute $ Opportunity Analysis and Forecast, By By Type, 2016-2032
- 7.3.3. Drinkable therapeutic food
- 7.3.4. Paste
- 7.3.5. Solid
- 7.4. APAC Ready To Use Therapeutic Food Market Analysis, Opportunity and Forecast, By By End-user, 2016-2032
- 7.4.1. APAC Ready To Use Therapeutic Food Market Analysis by By End-user: Introduction
- 7.4.2. Market Size Absolute $ Opportunity Analysis and Forecast, By By End-user, 2016-2032
- 7.4.3. SNGOs
- 7.4.4. WFP
- 7.4.5. UNICEF
- 7.4.6. Others
- 7.5. APAC Ready To Use Therapeutic Food Market Analysis, Opportunity and Forecast, By Country , 2016-2032
- 7.5.1. APAC Ready To Use Therapeutic Food Market Analysis by Country : Introduction
- 7.5.2. Market Size Absolute $ Opportunity Analysis and Forecast, Country , 2016-2032
- 7.5.2.1. China
- 7.5.2.2. Japan
- 7.5.2.3. South Korea
- 7.5.2.4. India
- 7.5.2.5. Australia & New Zeland
- 7.5.2.6. Indonesia
- 7.5.2.7. Malaysia
- 7.5.2.8. Philippines
- 7.5.2.9. Singapore
- 7.5.2.10. Thailand
- 7.5.2.11. Vietnam
- 7.5.2.12. Rest of APAC
- 8. Latin America Ready To Use Therapeutic Food Market Analysis, Opportunity and Forecast, 2016-2032
- 8.1. Latin America Ready To Use Therapeutic Food Market Analysis, 2016-2021
- 8.2. Latin America Ready To Use Therapeutic Food Market Opportunity and Forecast, 2023-2032
- 8.3. Latin America Ready To Use Therapeutic Food Market Analysis, Opportunity and Forecast, By By Type, 2016-2032
- 8.3.1. Latin America Ready To Use Therapeutic Food Market Analysis by By Type: Introduction
- 8.3.2. Market Size Absolute $ Opportunity Analysis and Forecast, By By Type, 2016-2032
- 8.3.3. Drinkable therapeutic food
- 8.3.4. Paste
- 8.3.5. Solid
- 8.4. Latin America Ready To Use Therapeutic Food Market Analysis, Opportunity and Forecast, By By End-user, 2016-2032
- 8.4.1. Latin America Ready To Use Therapeutic Food Market Analysis by By End-user: Introduction
- 8.4.2. Market Size Absolute $ Opportunity Analysis and Forecast, By By End-user, 2016-2032
- 8.4.3. SNGOs
- 8.4.4. WFP
- 8.4.5. UNICEF
- 8.4.6. Others
- 8.5. Latin America Ready To Use Therapeutic Food Market Analysis, Opportunity and Forecast, By Country , 2016-2032
- 8.5.1. Latin America Ready To Use Therapeutic Food Market Analysis by Country : Introduction
- 8.5.2. Market Size Absolute $ Opportunity Analysis and Forecast, Country , 2016-2032
- 8.5.2.1. Brazil
- 8.5.2.2. Colombia
- 8.5.2.3. Chile
- 8.5.2.4. Argentina
- 8.5.2.5. Costa Rica
- 8.5.2.6. Rest of Latin America
- 9. Middle East & Africa Ready To Use Therapeutic Food Market Analysis, Opportunity and Forecast, 2016-2032
- 9.1. Middle East & Africa Ready To Use Therapeutic Food Market Analysis, 2016-2021
- 9.2. Middle East & Africa Ready To Use Therapeutic Food Market Opportunity and Forecast, 2023-2032
- 9.3. Middle East & Africa Ready To Use Therapeutic Food Market Analysis, Opportunity and Forecast, By By Type, 2016-2032
- 9.3.1. Middle East & Africa Ready To Use Therapeutic Food Market Analysis by By Type: Introduction
- 9.3.2. Market Size Absolute $ Opportunity Analysis and Forecast, By By Type, 2016-2032
- 9.3.3. Drinkable therapeutic food
- 9.3.4. Paste
- 9.3.5. Solid
- 9.4. Middle East & Africa Ready To Use Therapeutic Food Market Analysis, Opportunity and Forecast, By By End-user, 2016-2032
- 9.4.1. Middle East & Africa Ready To Use Therapeutic Food Market Analysis by By End-user: Introduction
- 9.4.2. Market Size Absolute $ Opportunity Analysis and Forecast, By By End-user, 2016-2032
- 9.4.3. SNGOs
- 9.4.4. WFP
- 9.4.5. UNICEF
- 9.4.6. Others
- 9.5. Middle East & Africa Ready To Use Therapeutic Food Market Analysis, Opportunity and Forecast, By Country , 2016-2032
- 9.5.1. Middle East & Africa Ready To Use Therapeutic Food Market Analysis by Country : Introduction
- 9.5.2. Market Size Absolute $ Opportunity Analysis and Forecast, Country , 2016-2032
- 9.5.2.1. Algeria
- 9.5.2.2. Egypt
- 9.5.2.3. Israel
- 9.5.2.4. Kuwait
- 9.5.2.5. Nigeria
- 9.5.2.6. Saudi Arabia
- 9.5.2.7. South Africa
- 9.5.2.8. Turkey
- 9.5.2.9. The UAE
- 9.5.2.10. Rest of MEA
- 10. Global Ready To Use Therapeutic Food Market Analysis, Opportunity and Forecast, By Region , 2016-2032
- 10.1. Global Ready To Use Therapeutic Food Market Analysis by Region : Introduction
- 10.2. Market Size Absolute $ Opportunity Analysis and Forecast, By Region , 2016-2032
- 10.2.1. North America
- 10.2.2. Western Europe
- 10.2.3. Eastern Europe
- 10.2.4. APAC
- 10.2.5. Latin America
- 10.2.6. Middle East & Africa
- 11. Global Ready To Use Therapeutic Food Market Competitive Landscape, Market Share Analysis, and Company Profiles
- 11.1. Market Share Analysis
- 11.2. Company Profiles
- 11.3. Nuflower Foods
- 11.3.1. Company Overview
- 11.3.2. Financial Highlights
- 11.3.3. Product Portfolio
- 11.3.4. SWOT Analysis
- 11.3.5. Key Strategies and Developments
- 11.4. GC Rieber Compact AS
- 11.4.1. Company Overview
- 11.4.2. Financial Highlights
- 11.4.3. Product Portfolio
- 11.4.4. SWOT Analysis
- 11.4.5. Key Strategies and Developments
- 11.5. Valid Nutrition
- 11.5.1. Company Overview
- 11.5.2. Financial Highlights
- 11.5.3. Product Portfolio
- 11.5.4. SWOT Analysis
- 11.5.5. Key Strategies and Developments
- 11.6. InnoFaso Corp.
- 11.6.1. Company Overview
- 11.6.2. Financial Highlights
- 11.6.3. Product Portfolio
- 11.6.4. SWOT Analysis
- 11.6.5. Key Strategies and Developments
- 11.7. Edesia Inc.
- 11.7.1. Company Overview
- 11.7.2. Financial Highlights
- 11.7.3. Product Portfolio
- 11.7.4. SWOT Analysis
- 11.7.5. Key Strategies and Developments
- 11.8. Nutrivita Foods Ltd.
- 11.8.1. Company Overview
- 11.8.2. Financial Highlights
- 11.8.3. Product Portfolio
- 11.8.4. SWOT Analysis
- 11.8.5. Key Strategies and Developments
- 11.9. Diva Nutritional Products
- 11.9.1. Company Overview
- 11.9.2. Financial Highlights
- 11.9.3. Product Portfolio
- 11.9.4. SWOT Analysis
- 11.9.5. Key Strategies and Developments
- 11.10. Insta Products Ltd.
- 11.10.1. Company Overview
- 11.10.2. Financial Highlights
- 11.10.3. Product Portfolio
- 11.10.4. SWOT Analysis
- 11.10.5. Key Strategies and Developments
- 11.11. Mana Nutritive Aid Product Inc.
- 11.11.1. Company Overview
- 11.11.2. Financial Highlights
- 11.11.3. Product Portfolio
- 11.11.4. SWOT Analysis
- 11.11.5. Key Strategies and Developments
- 11.12. Meds & Food for Kids Inc.
- 11.12.1. Company Overview
- 11.12.2. Financial Highlights
- 11.12.3. Product Portfolio
- 11.12.4. SWOT Analysis
- 11.12.5. Key Strategies and Developments
- 11.13.1. Company Overview
- 11.13.2. Financial Highlights
- 11.13.3. Product Portfolio
- 11.13.4. SWOT Analysis
- 11.13.5. Key Strategies and Developments
- 11.14. Samil Industrial Co.
- 11.14.1. Company Overview
- 11.14.2. Financial Highlights
- 11.14.3. Product Portfolio
- 11.14.4. SWOT Analysis
- 11.14.5. Key Strategies and Developments
- 11.15. Amul India Inc.
- 11.15.1. Company Overview
- 11.15.2. Financial Highlights
- 11.15.3. Product Portfolio
- 11.15.4. SWOT Analysis
- 11.15.5. Key Strategies and Developments
- 11.16. Hilina Enriched Foods PLC
- 11.16.1. Company Overview
- 11.16.2. Financial Highlights
- 11.16.3. Product Portfolio
- 11.16.4. SWOT Analysis
- 11.16.5. Key Strategies and Developments
- 11.17. Société de Transformation Alimentaire
- 11.17.1. Company Overview
- 11.17.2. Financial Highlights
- 11.17.3. Product Portfolio
- 11.17.4. SWOT Analysis
- 11.17.5. Key Strategies and Developments
- 12. Assumptions and Acronyms
- 13. Research Methodology
- 14. Contact
"
- List of Figures
- "
- Figure 1: Global Ready To Use Therapeutic Food Market Revenue (US$ Mn) Market Share by By Type in 2022
- Figure 2: Global Ready To Use Therapeutic Food Market Market Attractiveness Analysis by By Type, 2016-2032
- Figure 3: Global Ready To Use Therapeutic Food Market Revenue (US$ Mn) Market Share by By End-userin 2022
- Figure 4: Global Ready To Use Therapeutic Food Market Market Attractiveness Analysis by By End-user, 2016-2032
- Figure 5: Global Ready To Use Therapeutic Food Market Revenue (US$ Mn) Market Share by Region in 2022
- Figure 6: Global Ready To Use Therapeutic Food Market Market Attractiveness Analysis by Region, 2016-2032
- Figure 7: Global Ready To Use Therapeutic Food Market Market Revenue (US$ Mn) (2016-2032)
- Figure 8: Global Ready To Use Therapeutic Food Market Market Revenue (US$ Mn) Comparison by Region (2016-2032)
- Figure 9: Global Ready To Use Therapeutic Food Market Market Revenue (US$ Mn) Comparison by By Type (2016-2032)
- Figure 10: Global Ready To Use Therapeutic Food Market Market Revenue (US$ Mn) Comparison by By End-user (2016-2032)
- Figure 11: Global Ready To Use Therapeutic Food Market Market Y-o-Y Growth Rate Comparison by Region (2016-2032)
- Figure 12: Global Ready To Use Therapeutic Food Market Market Y-o-Y Growth Rate Comparison by By Type (2016-2032)
- Figure 13: Global Ready To Use Therapeutic Food Market Market Y-o-Y Growth Rate Comparison by By End-user (2016-2032)
- Figure 14: Global Ready To Use Therapeutic Food Market Market Share Comparison by Region (2016-2032)
- Figure 15: Global Ready To Use Therapeutic Food Market Market Share Comparison by By Type (2016-2032)
- Figure 16: Global Ready To Use Therapeutic Food Market Market Share Comparison by By End-user (2016-2032)
- Figure 17: North America Ready To Use Therapeutic Food Market Revenue (US$ Mn) Market Share by By Typein 2022
- Figure 18: North America Ready To Use Therapeutic Food Market Market Attractiveness Analysis by By Type, 2016-2032
- Figure 19: North America Ready To Use Therapeutic Food Market Revenue (US$ Mn) Market Share by By End-userin 2022
- Figure 20: North America Ready To Use Therapeutic Food Market Market Attractiveness Analysis by By End-user, 2016-2032
- Figure 21: North America Ready To Use Therapeutic Food Market Revenue (US$ Mn) Market Share by Country in 2022
- Figure 22: North America Ready To Use Therapeutic Food Market Market Attractiveness Analysis by Country, 2016-2032
- Figure 23: North America Ready To Use Therapeutic Food Market Market Revenue (US$ Mn) (2016-2032)
- Figure 24: North America Ready To Use Therapeutic Food Market Market Revenue (US$ Mn) Comparison by Country (2016-2032)
- Figure 25: North America Ready To Use Therapeutic Food Market Market Revenue (US$ Mn) Comparison by By Type (2016-2032)
- Figure 26: North America Ready To Use Therapeutic Food Market Market Revenue (US$ Mn) Comparison by By End-user (2016-2032)
- Figure 27: North America Ready To Use Therapeutic Food Market Market Y-o-Y Growth Rate Comparison by Country (2016-2032)
- Figure 28: North America Ready To Use Therapeutic Food Market Market Y-o-Y Growth Rate Comparison by By Type (2016-2032)
- Figure 29: North America Ready To Use Therapeutic Food Market Market Y-o-Y Growth Rate Comparison by By End-user (2016-2032)
- Figure 30: North America Ready To Use Therapeutic Food Market Market Share Comparison by Country (2016-2032)
- Figure 31: North America Ready To Use Therapeutic Food Market Market Share Comparison by By Type (2016-2032)
- Figure 32: North America Ready To Use Therapeutic Food Market Market Share Comparison by By End-user (2016-2032)
- Figure 33: Western Europe Ready To Use Therapeutic Food Market Revenue (US$ Mn) Market Share by By Typein 2022
- Figure 34: Western Europe Ready To Use Therapeutic Food Market Market Attractiveness Analysis by By Type, 2016-2032
- Figure 35: Western Europe Ready To Use Therapeutic Food Market Revenue (US$ Mn) Market Share by By End-userin 2022
- Figure 36: Western Europe Ready To Use Therapeutic Food Market Market Attractiveness Analysis by By End-user, 2016-2032
- Figure 37: Western Europe Ready To Use Therapeutic Food Market Revenue (US$ Mn) Market Share by Country in 2022
- Figure 38: Western Europe Ready To Use Therapeutic Food Market Market Attractiveness Analysis by Country, 2016-2032
- Figure 39: Western Europe Ready To Use Therapeutic Food Market Market Revenue (US$ Mn) (2016-2032)
- Figure 40: Western Europe Ready To Use Therapeutic Food Market Market Revenue (US$ Mn) Comparison by Country (2016-2032)
- Figure 41: Western Europe Ready To Use Therapeutic Food Market Market Revenue (US$ Mn) Comparison by By Type (2016-2032)
- Figure 42: Western Europe Ready To Use Therapeutic Food Market Market Revenue (US$ Mn) Comparison by By End-user (2016-2032)
- Figure 43: Western Europe Ready To Use Therapeutic Food Market Market Y-o-Y Growth Rate Comparison by Country (2016-2032)
- Figure 44: Western Europe Ready To Use Therapeutic Food Market Market Y-o-Y Growth Rate Comparison by By Type (2016-2032)
- Figure 45: Western Europe Ready To Use Therapeutic Food Market Market Y-o-Y Growth Rate Comparison by By End-user (2016-2032)
- Figure 46: Western Europe Ready To Use Therapeutic Food Market Market Share Comparison by Country (2016-2032)
- Figure 47: Western Europe Ready To Use Therapeutic Food Market Market Share Comparison by By Type (2016-2032)
- Figure 48: Western Europe Ready To Use Therapeutic Food Market Market Share Comparison by By End-user (2016-2032)
- Figure 49: Eastern Europe Ready To Use Therapeutic Food Market Revenue (US$ Mn) Market Share by By Typein 2022
- Figure 50: Eastern Europe Ready To Use Therapeutic Food Market Market Attractiveness Analysis by By Type, 2016-2032
- Figure 51: Eastern Europe Ready To Use Therapeutic Food Market Revenue (US$ Mn) Market Share by By End-userin 2022
- Figure 52: Eastern Europe Ready To Use Therapeutic Food Market Market Attractiveness Analysis by By End-user, 2016-2032
- Figure 53: Eastern Europe Ready To Use Therapeutic Food Market Revenue (US$ Mn) Market Share by Country in 2022
- Figure 54: Eastern Europe Ready To Use Therapeutic Food Market Market Attractiveness Analysis by Country, 2016-2032
- Figure 55: Eastern Europe Ready To Use Therapeutic Food Market Market Revenue (US$ Mn) (2016-2032)
- Figure 56: Eastern Europe Ready To Use Therapeutic Food Market Market Revenue (US$ Mn) Comparison by Country (2016-2032)
- Figure 57: Eastern Europe Ready To Use Therapeutic Food Market Market Revenue (US$ Mn) Comparison by By Type (2016-2032)
- Figure 58: Eastern Europe Ready To Use Therapeutic Food Market Market Revenue (US$ Mn) Comparison by By End-user (2016-2032)
- Figure 59: Eastern Europe Ready To Use Therapeutic Food Market Market Y-o-Y Growth Rate Comparison by Country (2016-2032)
- Figure 60: Eastern Europe Ready To Use Therapeutic Food Market Market Y-o-Y Growth Rate Comparison by By Type (2016-2032)
- Figure 61: Eastern Europe Ready To Use Therapeutic Food Market Market Y-o-Y Growth Rate Comparison by By End-user (2016-2032)
- Figure 62: Eastern Europe Ready To Use Therapeutic Food Market Market Share Comparison by Country (2016-2032)
- Figure 63: Eastern Europe Ready To Use Therapeutic Food Market Market Share Comparison by By Type (2016-2032)
- Figure 64: Eastern Europe Ready To Use Therapeutic Food Market Market Share Comparison by By End-user (2016-2032)
- Figure 65: APAC Ready To Use Therapeutic Food Market Revenue (US$ Mn) Market Share by By Typein 2022
- Figure 66: APAC Ready To Use Therapeutic Food Market Market Attractiveness Analysis by By Type, 2016-2032
- Figure 67: APAC Ready To Use Therapeutic Food Market Revenue (US$ Mn) Market Share by By End-userin 2022
- Figure 68: APAC Ready To Use Therapeutic Food Market Market Attractiveness Analysis by By End-user, 2016-2032
- Figure 69: APAC Ready To Use Therapeutic Food Market Revenue (US$ Mn) Market Share by Country in 2022
- Figure 70: APAC Ready To Use Therapeutic Food Market Market Attractiveness Analysis by Country, 2016-2032
- Figure 71: APAC Ready To Use Therapeutic Food Market Market Revenue (US$ Mn) (2016-2032)
- Figure 72: APAC Ready To Use Therapeutic Food Market Market Revenue (US$ Mn) Comparison by Country (2016-2032)
- Figure 73: APAC Ready To Use Therapeutic Food Market Market Revenue (US$ Mn) Comparison by By Type (2016-2032)
- Figure 74: APAC Ready To Use Therapeutic Food Market Market Revenue (US$ Mn) Comparison by By End-user (2016-2032)
- Figure 75: APAC Ready To Use Therapeutic Food Market Market Y-o-Y Growth Rate Comparison by Country (2016-2032)
- Figure 76: APAC Ready To Use Therapeutic Food Market Market Y-o-Y Growth Rate Comparison by By Type (2016-2032)
- Figure 77: APAC Ready To Use Therapeutic Food Market Market Y-o-Y Growth Rate Comparison by By End-user (2016-2032)
- Figure 78: APAC Ready To Use Therapeutic Food Market Market Share Comparison by Country (2016-2032)
- Figure 79: APAC Ready To Use Therapeutic Food Market Market Share Comparison by By Type (2016-2032)
- Figure 80: APAC Ready To Use Therapeutic Food Market Market Share Comparison by By End-user (2016-2032)
- Figure 81: Latin America Ready To Use Therapeutic Food Market Revenue (US$ Mn) Market Share by By Typein 2022
- Figure 82: Latin America Ready To Use Therapeutic Food Market Market Attractiveness Analysis by By Type, 2016-2032
- Figure 83: Latin America Ready To Use Therapeutic Food Market Revenue (US$ Mn) Market Share by By End-userin 2022
- Figure 84: Latin America Ready To Use Therapeutic Food Market Market Attractiveness Analysis by By End-user, 2016-2032
- Figure 85: Latin America Ready To Use Therapeutic Food Market Revenue (US$ Mn) Market Share by Country in 2022
- Figure 86: Latin America Ready To Use Therapeutic Food Market Market Attractiveness Analysis by Country, 2016-2032
- Figure 87: Latin America Ready To Use Therapeutic Food Market Market Revenue (US$ Mn) (2016-2032)
- Figure 88: Latin America Ready To Use Therapeutic Food Market Market Revenue (US$ Mn) Comparison by Country (2016-2032)
- Figure 89: Latin America Ready To Use Therapeutic Food Market Market Revenue (US$ Mn) Comparison by By Type (2016-2032)
- Figure 90: Latin America Ready To Use Therapeutic Food Market Market Revenue (US$ Mn) Comparison by By End-user (2016-2032)
- Figure 91: Latin America Ready To Use Therapeutic Food Market Market Y-o-Y Growth Rate Comparison by Country (2016-2032)
- Figure 92: Latin America Ready To Use Therapeutic Food Market Market Y-o-Y Growth Rate Comparison by By Type (2016-2032)
- Figure 93: Latin America Ready To Use Therapeutic Food Market Market Y-o-Y Growth Rate Comparison by By End-user (2016-2032)
- Figure 94: Latin America Ready To Use Therapeutic Food Market Market Share Comparison by Country (2016-2032)
- Figure 95: Latin America Ready To Use Therapeutic Food Market Market Share Comparison by By Type (2016-2032)
- Figure 96: Latin America Ready To Use Therapeutic Food Market Market Share Comparison by By End-user (2016-2032)
- Figure 97: Middle East & Africa Ready To Use Therapeutic Food Market Revenue (US$ Mn) Market Share by By Typein 2022
- Figure 98: Middle East & Africa Ready To Use Therapeutic Food Market Market Attractiveness Analysis by By Type, 2016-2032
- Figure 99: Middle East & Africa Ready To Use Therapeutic Food Market Revenue (US$ Mn) Market Share by By End-userin 2022
- Figure 100: Middle East & Africa Ready To Use Therapeutic Food Market Market Attractiveness Analysis by By End-user, 2016-2032
- Figure 101: Middle East & Africa Ready To Use Therapeutic Food Market Revenue (US$ Mn) Market Share by Country in 2022
- Figure 102: Middle East & Africa Ready To Use Therapeutic Food Market Market Attractiveness Analysis by Country, 2016-2032
- Figure 103: Middle East & Africa Ready To Use Therapeutic Food Market Market Revenue (US$ Mn) (2016-2032)
- Figure 104: Middle East & Africa Ready To Use Therapeutic Food Market Market Revenue (US$ Mn) Comparison by Country (2016-2032)
- Figure 105: Middle East & Africa Ready To Use Therapeutic Food Market Market Revenue (US$ Mn) Comparison by By Type (2016-2032)
- Figure 106: Middle East & Africa Ready To Use Therapeutic Food Market Market Revenue (US$ Mn) Comparison by By End-user (2016-2032)
- Figure 107: Middle East & Africa Ready To Use Therapeutic Food Market Market Y-o-Y Growth Rate Comparison by Country (2016-2032)
- Figure 108: Middle East & Africa Ready To Use Therapeutic Food Market Market Y-o-Y Growth Rate Comparison by By Type (2016-2032)
- Figure 109: Middle East & Africa Ready To Use Therapeutic Food Market Market Y-o-Y Growth Rate Comparison by By End-user (2016-2032)
- Figure 110: Middle East & Africa Ready To Use Therapeutic Food Market Market Share Comparison by Country (2016-2032)
- Figure 111: Middle East & Africa Ready To Use Therapeutic Food Market Market Share Comparison by By Type (2016-2032)
- Figure 112: Middle East & Africa Ready To Use Therapeutic Food Market Market Share Comparison by By End-user (2016-2032)
"
- List of Tables
- "
- Table 1: Global Ready To Use Therapeutic Food Market Market Comparison by By Type (2016-2032)
- Table 2: Global Ready To Use Therapeutic Food Market Market Comparison by By End-user (2016-2032)
- Table 3: Global Ready To Use Therapeutic Food Market Revenue (US$ Mn) Comparison by Region (2016-2032)
- Table 4: Global Ready To Use Therapeutic Food Market Market Revenue (US$ Mn) (2016-2032)
- Table 5: Global Ready To Use Therapeutic Food Market Market Revenue (US$ Mn) Comparison by Region (2016-2032)
- Table 6: Global Ready To Use Therapeutic Food Market Market Revenue (US$ Mn) Comparison by By Type (2016-2032)
- Table 7: Global Ready To Use Therapeutic Food Market Market Revenue (US$ Mn) Comparison by By End-user (2016-2032)
- Table 8: Global Ready To Use Therapeutic Food Market Market Y-o-Y Growth Rate Comparison by Region (2016-2032)
- Table 9: Global Ready To Use Therapeutic Food Market Market Y-o-Y Growth Rate Comparison by By Type (2016-2032)
- Table 10: Global Ready To Use Therapeutic Food Market Market Y-o-Y Growth Rate Comparison by By End-user (2016-2032)
- Table 11: Global Ready To Use Therapeutic Food Market Market Share Comparison by Region (2016-2032)
- Table 12: Global Ready To Use Therapeutic Food Market Market Share Comparison by By Type (2016-2032)
- Table 13: Global Ready To Use Therapeutic Food Market Market Share Comparison by By End-user (2016-2032)
- Table 14: North America Ready To Use Therapeutic Food Market Market Comparison by By End-user (2016-2032)
- Table 15: North America Ready To Use Therapeutic Food Market Revenue (US$ Mn) Comparison by Country (2016-2032)
- Table 16: North America Ready To Use Therapeutic Food Market Market Revenue (US$ Mn) (2016-2032)
- Table 17: North America Ready To Use Therapeutic Food Market Market Revenue (US$ Mn) Comparison by Country (2016-2032)
- Table 18: North America Ready To Use Therapeutic Food Market Market Revenue (US$ Mn) Comparison by By Type (2016-2032)
- Table 19: North America Ready To Use Therapeutic Food Market Market Revenue (US$ Mn) Comparison by By End-user (2016-2032)
- Table 20: North America Ready To Use Therapeutic Food Market Market Y-o-Y Growth Rate Comparison by Country (2016-2032)
- Table 21: North America Ready To Use Therapeutic Food Market Market Y-o-Y Growth Rate Comparison by By Type (2016-2032)
- Table 22: North America Ready To Use Therapeutic Food Market Market Y-o-Y Growth Rate Comparison by By End-user (2016-2032)
- Table 23: North America Ready To Use Therapeutic Food Market Market Share Comparison by Country (2016-2032)
- Table 24: North America Ready To Use Therapeutic Food Market Market Share Comparison by By Type (2016-2032)
- Table 25: North America Ready To Use Therapeutic Food Market Market Share Comparison by By End-user (2016-2032)
- Table 26: Western Europe Ready To Use Therapeutic Food Market Market Comparison by By Type (2016-2032)
- Table 27: Western Europe Ready To Use Therapeutic Food Market Market Comparison by By End-user (2016-2032)
- Table 28: Western Europe Ready To Use Therapeutic Food Market Revenue (US$ Mn) Comparison by Country (2016-2032)
- Table 29: Western Europe Ready To Use Therapeutic Food Market Market Revenue (US$ Mn) (2016-2032)
- Table 30: Western Europe Ready To Use Therapeutic Food Market Market Revenue (US$ Mn) Comparison by Country (2016-2032)
- Table 31: Western Europe Ready To Use Therapeutic Food Market Market Revenue (US$ Mn) Comparison by By Type (2016-2032)
- Table 32: Western Europe Ready To Use Therapeutic Food Market Market Revenue (US$ Mn) Comparison by By End-user (2016-2032)
- Table 33: Western Europe Ready To Use Therapeutic Food Market Market Y-o-Y Growth Rate Comparison by Country (2016-2032)
- Table 34: Western Europe Ready To Use Therapeutic Food Market Market Y-o-Y Growth Rate Comparison by By Type (2016-2032)
- Table 35: Western Europe Ready To Use Therapeutic Food Market Market Y-o-Y Growth Rate Comparison by By End-user (2016-2032)
- Table 36: Western Europe Ready To Use Therapeutic Food Market Market Share Comparison by Country (2016-2032)
- Table 37: Western Europe Ready To Use Therapeutic Food Market Market Share Comparison by By Type (2016-2032)
- Table 38: Western Europe Ready To Use Therapeutic Food Market Market Share Comparison by By End-user (2016-2032)
- Table 39: Eastern Europe Ready To Use Therapeutic Food Market Market Comparison by By Type (2016-2032)
- Table 40: Eastern Europe Ready To Use Therapeutic Food Market Market Comparison by By End-user (2016-2032)
- Table 41: Eastern Europe Ready To Use Therapeutic Food Market Revenue (US$ Mn) Comparison by Country (2016-2032)
- Table 42: Eastern Europe Ready To Use Therapeutic Food Market Market Revenue (US$ Mn) (2016-2032)
- Table 43: Eastern Europe Ready To Use Therapeutic Food Market Market Revenue (US$ Mn) Comparison by Country (2016-2032)
- Table 44: Eastern Europe Ready To Use Therapeutic Food Market Market Revenue (US$ Mn) Comparison by By Type (2016-2032)
- Table 45: Eastern Europe Ready To Use Therapeutic Food Market Market Revenue (US$ Mn) Comparison by By End-user (2016-2032)
- Table 46: Eastern Europe Ready To Use Therapeutic Food Market Market Y-o-Y Growth Rate Comparison by Country (2016-2032)
- Table 47: Eastern Europe Ready To Use Therapeutic Food Market Market Y-o-Y Growth Rate Comparison by By Type (2016-2032)
- Table 48: Eastern Europe Ready To Use Therapeutic Food Market Market Y-o-Y Growth Rate Comparison by By End-user (2016-2032)
- Table 49: Eastern Europe Ready To Use Therapeutic Food Market Market Share Comparison by Country (2016-2032)
- Table 50: Eastern Europe Ready To Use Therapeutic Food Market Market Share Comparison by By Type (2016-2032)
- Table 51: Eastern Europe Ready To Use Therapeutic Food Market Market Share Comparison by By End-user (2016-2032)
- Table 52: APAC Ready To Use Therapeutic Food Market Market Comparison by By Type (2016-2032)
- Table 53: APAC Ready To Use Therapeutic Food Market Market Comparison by By End-user (2016-2032)
- Table 54: APAC Ready To Use Therapeutic Food Market Revenue (US$ Mn) Comparison by Country (2016-2032)
- Table 55: APAC Ready To Use Therapeutic Food Market Market Revenue (US$ Mn) (2016-2032)
- Table 56: APAC Ready To Use Therapeutic Food Market Market Revenue (US$ Mn) Comparison by Country (2016-2032)
- Table 57: APAC Ready To Use Therapeutic Food Market Market Revenue (US$ Mn) Comparison by By Type (2016-2032)
- Table 58: APAC Ready To Use Therapeutic Food Market Market Revenue (US$ Mn) Comparison by By End-user (2016-2032)
- Table 59: APAC Ready To Use Therapeutic Food Market Market Y-o-Y Growth Rate Comparison by Country (2016-2032)
- Table 60: APAC Ready To Use Therapeutic Food Market Market Y-o-Y Growth Rate Comparison by By Type (2016-2032)
- Table 61: APAC Ready To Use Therapeutic Food Market Market Y-o-Y Growth Rate Comparison by By End-user (2016-2032)
- Table 62: APAC Ready To Use Therapeutic Food Market Market Share Comparison by Country (2016-2032)
- Table 63: APAC Ready To Use Therapeutic Food Market Market Share Comparison by By Type (2016-2032)
- Table 64: APAC Ready To Use Therapeutic Food Market Market Share Comparison by By End-user (2016-2032)
- Table 65: Latin America Ready To Use Therapeutic Food Market Market Comparison by By Type (2016-2032)
- Table 66: Latin America Ready To Use Therapeutic Food Market Market Comparison by By End-user (2016-2032)
- Table 67: Latin America Ready To Use Therapeutic Food Market Revenue (US$ Mn) Comparison by Country (2016-2032)
- Table 68: Latin America Ready To Use Therapeutic Food Market Market Revenue (US$ Mn) (2016-2032)
- Table 69: Latin America Ready To Use Therapeutic Food Market Market Revenue (US$ Mn) Comparison by Country (2016-2032)
- Table 70: Latin America Ready To Use Therapeutic Food Market Market Revenue (US$ Mn) Comparison by By Type (2016-2032)
- Table 71: Latin America Ready To Use Therapeutic Food Market Market Revenue (US$ Mn) Comparison by By End-user (2016-2032)
- Table 72: Latin America Ready To Use Therapeutic Food Market Market Y-o-Y Growth Rate Comparison by Country (2016-2032)
- Table 73: Latin America Ready To Use Therapeutic Food Market Market Y-o-Y Growth Rate Comparison by By Type (2016-2032)
- Table 74: Latin America Ready To Use Therapeutic Food Market Market Y-o-Y Growth Rate Comparison by By End-user (2016-2032)
- Table 75: Latin America Ready To Use Therapeutic Food Market Market Share Comparison by Country (2016-2032)
- Table 76: Latin America Ready To Use Therapeutic Food Market Market Share Comparison by By Type (2016-2032)
- Table 77: Latin America Ready To Use Therapeutic Food Market Market Share Comparison by By End-user (2016-2032)
- Table 78: Middle East & Africa Ready To Use Therapeutic Food Market Market Comparison by By Type (2016-2032)
- Table 79: Middle East & Africa Ready To Use Therapeutic Food Market Market Comparison by By End-user (2016-2032)
- Table 80: Middle East & Africa Ready To Use Therapeutic Food Market Revenue (US$ Mn) Comparison by Country (2016-2032)
- Table 81: Middle East & Africa Ready To Use Therapeutic Food Market Market Revenue (US$ Mn) (2016-2032)
- Table 82: Middle East & Africa Ready To Use Therapeutic Food Market Market Revenue (US$ Mn) Comparison by Country (2016-2032)
- Table 83: Middle East & Africa Ready To Use Therapeutic Food Market Market Revenue (US$ Mn) Comparison by By Type (2016-2032)
- Table 84: Middle East & Africa Ready To Use Therapeutic Food Market Market Revenue (US$ Mn) Comparison by By End-user (2016-2032)
- Table 85: Middle East & Africa Ready To Use Therapeutic Food Market Market Y-o-Y Growth Rate Comparison by Country (2016-2032)
- Table 86: Middle East & Africa Ready To Use Therapeutic Food Market Market Y-o-Y Growth Rate Comparison by By Type (2016-2032)
- Table 87: Middle East & Africa Ready To Use Therapeutic Food Market Market Y-o-Y Growth Rate Comparison by By End-user (2016-2032)
- Table 88: Middle East & Africa Ready To Use Therapeutic Food Market Market Share Comparison by Country (2016-2032)
- Table 89: Middle East & Africa Ready To Use Therapeutic Food Market Market Share Comparison by By Type (2016-2032)
- Table 90: Middle East & Africa Ready To Use Therapeutic Food Market Market Share Comparison by By End-user (2016-2032)
- 1. Executive Summary
-
- Nuflower Foods
- GC Rieber Compact AS
- Valid Nutrition
- InnoFaso Corp.
- Edesia Inc.
- Nutrivita Foods Ltd.
- Diva Nutritional Products
- Insta Products Ltd.
- Mana Nutritive Aid Product Inc.
- Meds & Food for Kids Inc.
- Samil Industrial Co.
- Tabatchnick Fine Foods Inc.
- Amul India Inc.
- Hilina Enriched Foods PLC
- Société de Transformation Alimentaire
Our Clients


View Our Licence Options
