
Psoriasis Treatment Market By Drug Class (Interleukins, TNF Inhibitors, Others), By Treatment Type (Biologic Drugs, Small Molecule Systemic Drugs, Tropical Therapies), By Type (Psoriatic Arthritis, Plaque Psoriasis, Others), By Route of Administration (Oral, Parenteral, Topical), By Distribution Channel (Hospital Pharmacies, Online pharmacies, Retail Pharmacies), By Region And Companies - Industry Segment Outlook, Market Assessment, Competition Scenario, Trends, And Forecast 2024-2033
-
23405
-
July 2024
-
300
-


-
This report was compiled by Trishita Deb Trishita Deb is an experienced market research and consulting professional with over 7 years of expertise across healthcare, consumer goods, and materials, contributing to over 400 healthcare-related reports. Correspondence Team Lead- Healthcare Linkedin | Detailed Market research Methodology Our methodology involves a mix of primary research, including interviews with leading mental health experts, and secondary research from reputable medical journals and databases. View Detailed Methodology Page
-
Quick Navigation
- Report Overview
- Key Takeaways
- Driving factors
- Restraining Factors
- By Drug Class Analysis
- By Treatment Type Analysis
- By Type Analysis
- By Route of Administration Analysis
- By Distribution Channel Analysis
- Key Market Segments
- Growth Opportunity
- Latest Trends
- Regional Analysis
- Key Players Analysis
- Recent Development
- Report Scope
Report Overview
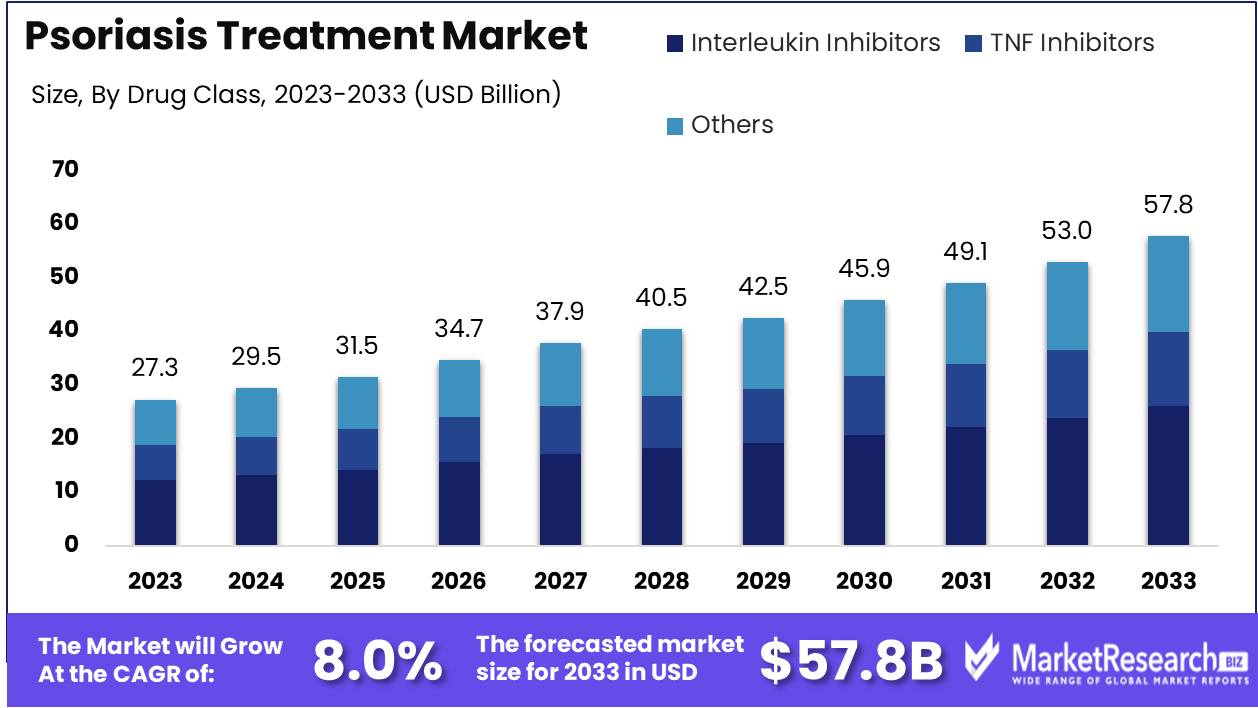
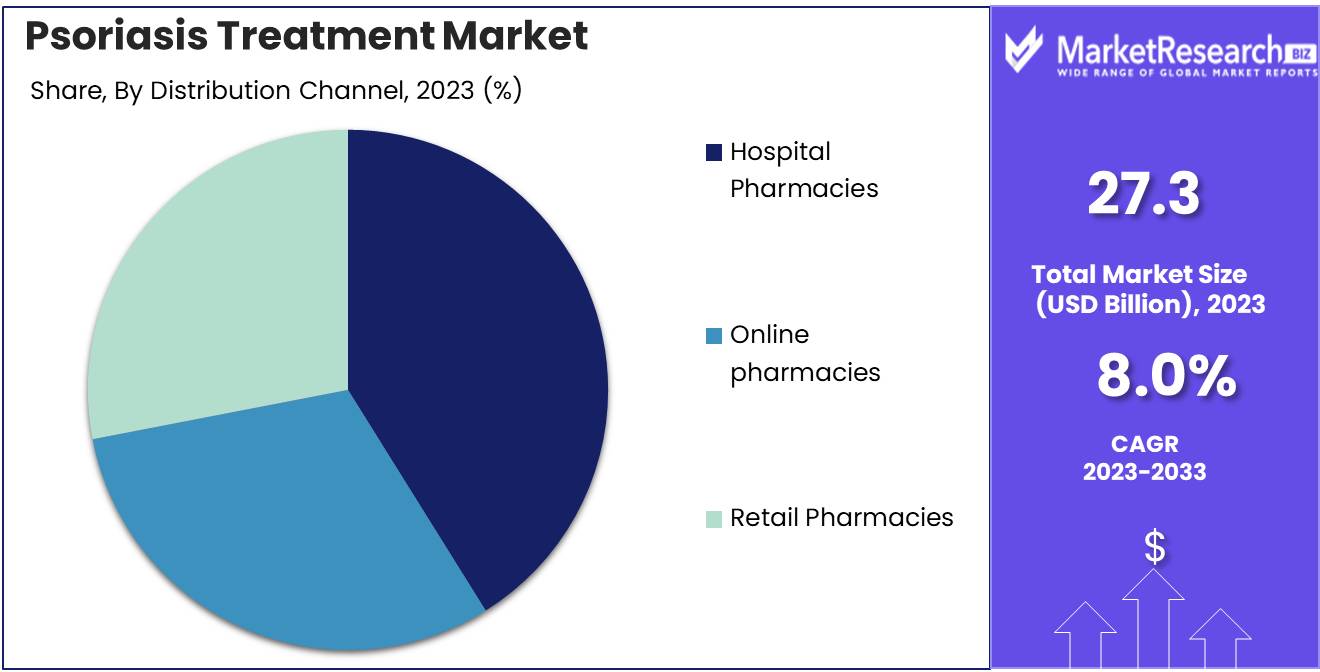
The Psoriasis Treatment Market was valued at USD 27.3 billion in 2023. It is expected to reach USD 57.8 billion by 2033, with a CAGR of 8.0% during the forecast period from 2024 to 2033.
The Psoriasis Treatment Market encompasses a range of therapies and medications designed to manage psoriasis, a chronic autoimmune skin condition characterized by red, scaly patches. This market includes topical treatments, systemic medications, biologics, and phototherapy. Advancements in biologic drugs and personalized medicine are driving market growth, offering improved efficacy and patient outcomes.
The Psoriasis Treatment Market is poised for significant growth, driven by an increasing prevalence of psoriasis and a growing awareness of available treatment options. Recent advancements in biological drugs and personalized medicine are revolutionizing the market, offering more effective and targeted therapies. Government initiatives and increased funding for psoriasis research are further bolstering this growth, facilitating the development of innovative treatments and expanding patient access. Despite these positive trends, the market faces challenges such as the high cost of biologic therapies and the side effects associated with long-term use of certain treatments. These factors underscore the need for continuous innovation and strategic investment to balance efficacy, safety, and affordability.
Advancements in biologic drugs have notably shifted the market landscape, offering a higher efficacy compared to traditional systemic treatments. Personalized medicine, leveraging genetic and biomarker data, is tailoring treatments to individual patient profiles, enhancing outcomes. However, the high cost of biological therapies remains a significant barrier to widespread adoption, impacting patient accessibility and adherence.
Additionally, long-term use of these treatments can lead to adverse effects, necessitating the development of safer alternatives. Government initiatives play a crucial role in addressing these issues, providing funding for research and fostering collaborations between public and private sectors. As the market evolves, stakeholders must focus on improving the cost-effectiveness and safety profile of new treatments to ensure sustainable growth and enhanced patient care.
This strategic perspective is indicative of a robust and dynamic market that requires a balanced approach to innovation, regulation, and cost management to achieve long-term success.
Key Takeaways
- Market Growth: The Psoriasis Treatment Market was valued at USD 27.3 billion in 2023. It is expected to reach USD 57.8 billion by 2033, with a CAGR of 8.0% during the forecast period from 2024 to 2033.
- By Drug Class: Interleukin Inhibitors Segment dominated the Psoriasis Treatment Market by Drug Class.
- By Treatment Type: Biologic Drugs dominated the Psoriasis Treatment Market by type.
- By Type: Psoriatic Arthritis dominated the Psoriasis Treatment Market by type.
- By Route of Administration: Oral treatments dominated the Psoriasis Treatment Market segments.
- By Distribution Channel: Hospital Pharmacies dominated the psoriasis treatment market's distribution channels
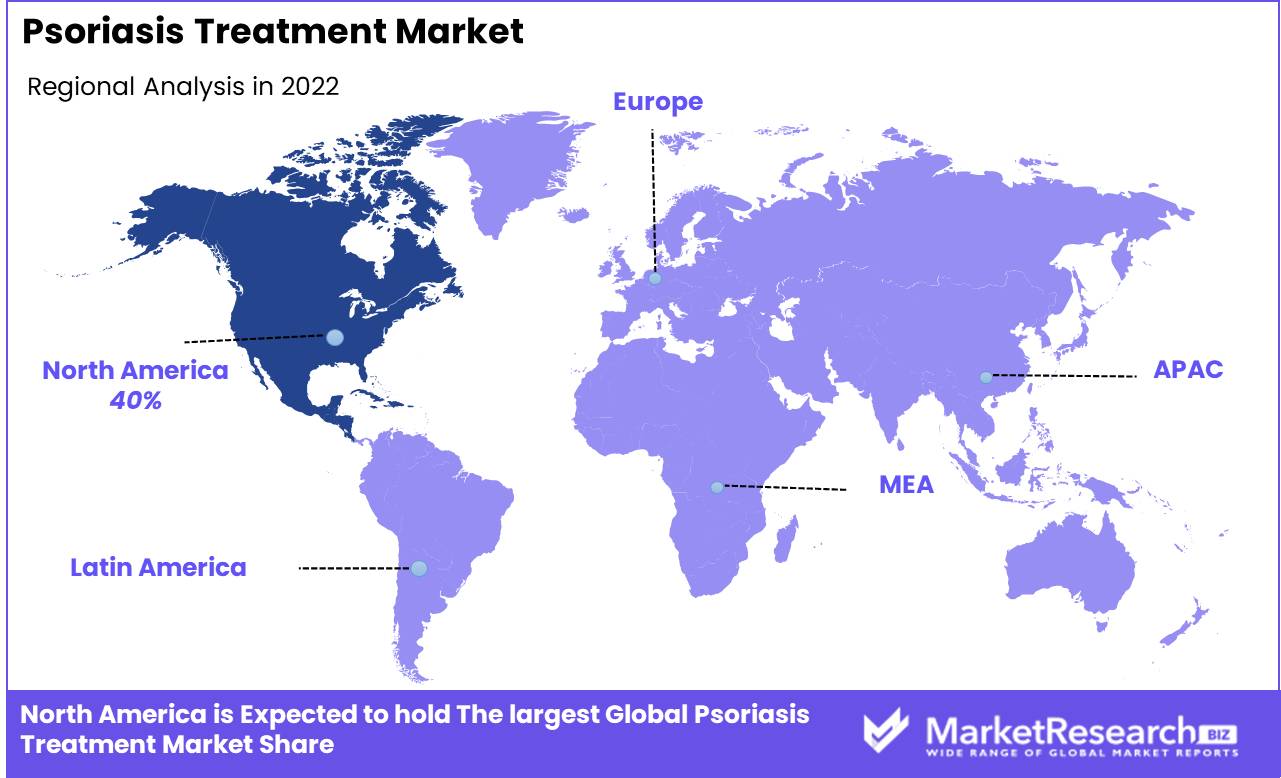
- Regional Dominance: North America dominates the Psoriasis Treatment Market with a 40% largest share.
- Growth Opportunity: The global psoriasis treatment market will grow driven by increasing disease prevalence and significant advancements in research and development.
Driving factors
Rising Prevalence of Plaque Psoriasis and Psoriatic Arthritis Globally
The increasing prevalence of plaque psoriasis and psoriatic arthritis significantly drives the growth of the psoriasis treatment market. Plaque psoriasis, which accounts for approximately 80% to 90% of all psoriasis cases, affects millions of people worldwide. The growing number of individuals diagnosed with these conditions elevates the demand for effective treatment options. For instance, according to the report, over 125 million people globally suffer from psoriasis, which underscores the substantial market potential for therapeutic interventions aimed at managing these chronic conditions. As awareness and diagnosis rates improve, the need for innovative and effective treatments becomes more pronounced, contributing to market expansion.
Increasing Geriatric Population More Susceptible to Psoriasis
The increasing geriatric population, which is more susceptible to psoriasis, is another critical factor fueling the market's growth. As the global population ages, the incidence of psoriasis rises, particularly among individuals aged 50 and above. This demographic shift is pivotal because older adults often experience more severe symptoms and complications, necessitating comprehensive and ongoing treatment strategies. For example, the projects that by 2050, the global population aged 60 years and older will reach nearly 2 billion. This surge in the aging population directly correlates with an uptick in psoriasis cases, thereby escalating the demand for advanced therapeutic solutions tailored to this age group.
Advancements in Psoriasis Treatment Options, Including Biologics and Combination Therapies
Advancements in psoriasis treatment options, particularly the development of biologics and combination therapies, play a substantial role in market growth. Biologics, which target specific components of the immune system, have revolutionized psoriasis treatment by offering highly effective solutions with fewer side effects compared to traditional systemic therapies. The introduction of biologics such as TNF inhibitors, IL-12/23 inhibitors, and IL-17 inhibitors has expanded the therapeutic landscape, providing patients with more effective and durable treatment outcomes. Additionally, combination therapies that integrate biologics with other treatment modalities, such as topical agents and phototherapy, enhance efficacy and patient adherence, leading to improved clinical outcomes. According to market data, the biologics segment is anticipated to witness a compound annual growth rate (CAGR) of over 9% from 2023 to 2030, underscoring the significant impact of these advancements on the psoriasis treatment market.
Restraining Factors
Barriers to Accessibility and Market Expansion
The high cost of advanced biologic therapies is a significant restraining factor in the psoriasis treatment market. Biologic drugs, which are often prescribed for moderate to severe psoriasis, can be prohibitively expensive for many patients. The costs associated with these therapies can exceed thousands of dollars annually, making them inaccessible to a large portion of the population without substantial insurance coverage. According to a report, the annual cost of biologic treatments for psoriasis can range from $10,000 to $30,000 per patient.
This financial burden impacts both patients and healthcare systems, leading to a limited adoption rate of these advanced treatments. Consequently, patients may opt for less effective, traditional therapies, slowing the overall growth of the market. Insurance companies may also impose strict coverage criteria or higher co-pays for biologic treatments, further restricting patient access. The economic barrier posed by high treatment costs thus hampers the market's potential expansion and limits the widespread adoption of cutting-edge therapies.
Impediment to Early Treatment and Market Growth
Lack of awareness and diagnosis of psoriasis is another critical restraining factor affecting market growth. Many individuals with mild to moderate psoriasis remain undiagnosed due to limited public awareness about the disease and its symptoms. This lack of awareness leads to a substantial underreporting of cases, which in turn affects the market dynamics.
Patients who are unaware of their condition are less likely to seek medical advice or treatment, resulting in a lower demand for psoriasis medications. Furthermore, general practitioners and dermatologists may not always prioritize screening for psoriasis, especially in regions with limited healthcare resources.
This underdiagnosis and lack of awareness contribute to delayed initiation of therapy, reducing the potential patient pool for advanced treatments and thereby constraining market growth. Initiatives aimed at increasing public and professional awareness, such as educational campaigns and improved diagnostic guidelines, are essential to address this challenge and enhance the early detection and treatment of psoriasis, fostering market growth.
By Drug Class Analysis
In 2023, The Interleukin Inhibitors Segment dominated the Psoriasis Treatment Market by Drug Class.
In 2023, Interleukins held a dominant market position in the by-drug class segment of the Psoriasis Treatment Market. This dominance is attributed to their targeted mechanism of action, which offers higher efficacy and safety profiles compared to traditional treatments. Interleukins, specifically IL-17 and IL-23 inhibitors, have shown significant clinical success, driving their adoption among healthcare providers and patients.
Meanwhile, TNF Inhibitors, once the cornerstone of psoriasis therapy, have seen a decline in market share due to the emergence of more effective alternatives. However, they still maintain a substantial presence due to their established efficacy and extensive clinical data supporting their use.
The Others category, which includes topical treatments and phototherapy, continues to play a critical role, particularly in mild to moderate cases and in combination therapy approaches. This segment’s market share remains stable, catering to patients seeking non-systemic treatment options.
By Treatment Type Analysis
In 2023, Biologic Drugs dominated the Psoriasis Treatment Market by type.
In 2023, Biologic Drugs held a dominant market position in the By Treatment Type segment of the Psoriasis Treatment Market. Biologic drugs, known for their targeted approach in treating moderate to severe psoriasis, have gained significant traction due to their effectiveness and ability to address the underlying causes of the disease. This segment's prominence can be attributed to the increasing approval of biologics and their adoption among dermatologists.
Small Molecule Systemic Drugs represent another crucial segment, focusing on oral treatments that modulate immune responses. These drugs are often prescribed for patients who do not respond adequately to topical therapies or biologics. Their market share is bolstered by ongoing advancements in drug formulation and the introduction of novel small molecules with improved safety profiles.
Topical Therapies remain integral to the psoriasis treatment landscape, particularly for patients with mild to moderate conditions. These therapies, including corticosteroids and vitamin D analogs, offer a less invasive treatment option and are typically the first line of defense. Despite the growing preference for systemic treatments, topical therapies continue to hold a substantial market share due to their accessibility and cost-effectiveness.
By Type Analysis
In 2023, Psoriatic Arthritis dominated the Psoriasis Treatment Market by type.
In 2023, Psoriatic Arthritis held a dominant market position in the By Type segment of the Psoriasis Treatment Market. This dominance is attributed to the increasing prevalence of psoriatic arthritis among psoriasis patients and the growing awareness about the condition. Psoriatic arthritis is a chronic inflammatory disease that affects the joints and skin, causing significant discomfort and disability if not managed effectively. The market has seen a surge in the adoption of biologics and advanced therapies specifically targeting psoriatic arthritis, which has contributed to its leading position.
Plaque Psoriasis, the most common form of psoriasis, also holds a significant share in the market. This condition is characterized by red, scaly patches on the skin and is managed through a variety of treatment options, including topical therapies, phototherapy, and systemic medications. The demand for effective treatments for plaque psoriasis remains robust due to its high prevalence and the chronic nature of the disease.
Other types of psoriasis, such as guttate, pustular, and erythrodermic psoriasis, account for the remaining market share. While less common, these forms require specialized treatment approaches, driving ongoing research and development in this segment.
By Route of Administration Analysis
In 2023, Psoriatic Arthritis dominated the Psoriasis Treatment Market by type.
In 2023, Psoriatic Arthritis held a dominant market position in the By Type segment of the Psoriasis Treatment Market. This dominance is attributed to the increasing prevalence of psoriatic arthritis among psoriasis patients and the growing awareness about the condition. Psoriatic arthritis is a chronic inflammatory disease that affects the joints and skin, causing significant discomfort and disability if not managed effectively. The market has seen a surge in the adoption of biologics and advanced therapies specifically targeting psoriatic arthritis, which has contributed to its leading position.
Plaque Psoriasis, the most common form of psoriasis, also holds a significant share in the market. This condition is characterized by red, scaly patches on the skin and is managed through a variety of treatment options, including topical therapies, phototherapy, and systemic medications. The demand for effective treatments for plaque psoriasis remains robust due to its high prevalence and the chronic nature of the disease.
Other types of psoriasis, such as guttate, pustular, and erythrodermic psoriasis, account for the remaining market share. While less common, these forms require specialized treatment approaches, driving ongoing research and development in this segment.
By Distribution Channel Analysis
Hospital Pharmacies dominated the psoriasis treatment market's distribution channels in 2023.
In 2023, Hospital Pharmacies held a dominant market position in the distribution channel segment of the Psoriasis Treatment Market. Hospital pharmacies are critical in providing specialized medications, ensuring immediate access to prescribed treatments, and facilitating close monitoring by healthcare professionals, which bolsters their prominence in the market. This segment benefits from integrated healthcare systems that streamline the dispensing process, leading to better patient outcomes.
Online pharmacies, while growing rapidly due to the convenience and accessibility they offer, occupy a secondary position. The rise of e-commerce and advancements in digital health platforms have significantly contributed to the increasing adoption of online pharmacies, providing patients with the ability to procure medications without visiting physical stores.
Retail pharmacies also play a substantial role in the distribution of psoriasis treatments, especially in regions with less developed healthcare infrastructures. They provide essential access to over-the-counter and prescription medications for managing psoriasis, supporting patient adherence to treatment regimens through community-based services.
Each of these channels contributes uniquely to the overall market dynamics, addressing diverse patient needs and preferences in the psoriasis treatment landscape.
Key Market Segments
By Drug Class
- Interleukin Inhibitors
- TNF Inhibitors
- Others
By Treatment Type
- Biologic Drugs
- Small Molecule Systemic Drugs
- Tropical Therapies
By Type
- Psoriatic Arthritis
- Plaque Psoriasis
- Others
By Route of Administration
- Oral
- Parenteral
- Topical
By Distribution Channel
- Hospital Pharmacies
- Online pharmacies
- Retail Pharmacies
Growth Opportunity
Increasing Prevalence of Psoriasis Worldwide
The global psoriasis treatment market is poised for significant growth driven primarily by the increasing prevalence of psoriasis. According to recent statistics, psoriasis affects approximately 125 million people worldwide, representing about 2-3% of the global population. This chronic autoimmune condition has seen a rise in incidence, likely due to various factors including genetic predisposition, environmental triggers, and lifestyle changes. The growing patient pool necessitates more effective and diverse treatment options, creating substantial market opportunities for pharmaceutical companies.
Increased Research and Pipeline Drugs
The landscape of psoriasis treatment is evolving rapidly, with an increased focus on research and the development of pipeline drugs. The market has witnessed a surge in the number of clinical trials and R&D activities aimed at discovering innovative therapies. This is evident from the growing number of biologics and small molecules entering late-stage clinical trials. The introduction of advanced biologics, such as interleukin inhibitors and TNF-alpha inhibitors, has revolutionized psoriasis treatment by offering improved efficacy and safety profiles compared to traditional therapies.
Moreover, the pipeline of potential new treatments is robust, with numerous candidates showing promising results in clinical studies. Companies are investing heavily in research to develop drugs that not only manage symptoms but also target the underlying causes of psoriasis. This trend is expected to drive market growth as new treatments receive regulatory approval and enter the market.
Latest Trends
Increasing Demand for Effective and Safe Treatment Options
The global psoriasis treatment market is anticipated to witness significant growth, driven by the increasing demand for effective and safe treatment options. Patients and healthcare providers are prioritizing therapies that not only manage the symptoms effectively but also have minimal side effects. This shift is largely due to the growing awareness about the long-term implications of using conventional therapies, which often come with a high risk of adverse effects.
Consequently, there is a notable rise in the adoption of biologics and biosimilars, which offer targeted action with improved safety profiles. These biologics, by modulating specific components of the immune system, provide a more refined approach to treatment, reducing the overall burden of the disease on patients.
Advancements in Phototherapy and Targeted Delivery Systems
Advancements in phototherapy and targeted delivery systems are also playing a crucial role in shaping the psoriasis treatment market. Phototherapy, particularly UVB phototherapy, has seen technological enhancements that improve its efficacy and patient compliance. The development of home-based phototherapy devices is another promising trend, offering convenience and accessibility to patients.
Additionally, targeted delivery systems, including nanoparticle-based formulations and microneedles, are being explored to enhance the localized delivery of therapeutic agents. These innovations are designed to maximize the therapeutic benefits while minimizing systemic exposure, thus reducing potential side effects. Such advancements are expected to drive the market forward, offering new avenues for effective management of psoriasis.
Regional Analysis
North America dominates the Psoriasis Treatment Market with a 40% largest share.
The Psoriasis Treatment Market is witnessing significant growth across various regions, including North America, Europe, Asia Pacific, Middle East & Africa, and Latin America. North America dominates the market with an estimated largest market share of 40%, driven by advanced healthcare infrastructure, high awareness, and substantial R&D investments. The U.S. leads in this region due to a robust pipeline of biologics and favorable reimbursement policies. Europe follows closely with a market share of around 30%, supported by the increasing prevalence of psoriasis and the rising adoption of innovative therapies. Germany, France, and the UK are key contributors due to their strong healthcare systems and ongoing clinical research.
In the Asia Pacific region, the market is growing at a rapid pace, accounting for approximately 20% of the global share. The growth is propelled by the increasing patient population, improving healthcare access, and rising disposable incomes. China and India are the major markets in this region, driven by large unmet medical needs and expanding healthcare infrastructure. The Middle East & Africa and Latin America collectively contribute to the remaining 10%, with growth driven by improving healthcare facilities and increasing awareness about psoriasis treatments. However, these regions face challenges such as limited access to advanced therapies and lower healthcare expenditure compared to developed regions.
Key Regions and Countries
North America
- The US
- Canada
- Rest of North America
Europe
- Germany
- France
- The UK
- Spain
- Netherlands
- Russia
- Italy
- Rest of Europe
Asia-Pacific
- China
- Japan
- Singapore
- Thailand
- South Korea
- Vietnam
- India
- New Zealand
- Rest of Asia Pacific
Latin America
- Mexico
- Brazil
- Rest of Latin America
Middle East & Africa
- Saudi Arabia
- South Africa
- UAE
- Rest of the Middle East & Africa
Key Players Analysis
The global psoriasis treatment market in 2024 is characterized by significant advancements and competitive dynamics led by key players. Johnson & Johnson Services, Inc. continues to leverage its extensive portfolio and innovative therapies, maintaining a strong market presence. Pfizer Inc. is expected to enhance its market position through strategic partnerships and the development of novel biologics, addressing unmet needs in psoriasis treatment.
AbbVie Inc., with its leading drug, Humira, remains a dominant force, though competition from biosimilars is anticipated to challenge its market share. Novartis AG's Cosentyx continues to gain traction, benefiting from its strong clinical efficacy and expanded indications. LEO Pharma A/S focuses on expanding its dermatological offerings, aiming to strengthen its position through pipeline advancements.
Merck & Co., Inc. and UCB S.A. are projected to capitalize on their robust R&D capabilities, introducing next-generation treatments that improve patient outcomes. Sun Pharmaceutical Industries Ltd. emphasizes affordability and accessibility, particularly in emerging markets. Amgen Inc. leverages its biological therapies, such as Enbrel, to maintain a significant share.
Eli Lilly and Company is poised to expand its market footprint with innovative therapies like Taltz, targeting various forms of psoriasis. Emerging players like Evelo Biosciences, Inc. are anticipated to disrupt the market with novel oral biologics, offering new therapeutic options and driving competitive pressures.
Overall, the market is expected to witness robust growth driven by continuous innovation, strategic alliances, and a focus on improving patient quality of life.
Market Key Players
- Johnson & Johnson Services, Inc.
- Pfizer Inc.
- AbbVie Inc.
- Novartis AG
- LEO Pharma A/S
- Merck & Co., Inc.
- UCB S.A.
- Sun Pharmaceutical Industries Ltd.
- Amgen Inc.
- Eli Lilly and Company
- Evelo Biosciences, Inc.
Recent Development
- In March 2024, Johnson & Johnson presented findings from the Phase IIb FRONTIER 2 trial of JNJ-2113, an oral peptide designed to inhibit the IL-23 receptor. The trial demonstrated significant skin improvement in 76.2% of patients at the highest dosage, with a 78.6% PASI-75 response by Week 16.
- In December 2023, Roflumilast foam 0.3% was approved by the FDA for treating seborrheic dermatitis. This foam formulation is also being studied for scalp and body psoriasis, showing significant efficacy in reducing symptoms in recent Phase 2b studies.
- In October 2023, AnaptysBio reported positive initial findings from its global Phase III GEMINI-1 trial of imsidolimab, an IL-36R mAb, for patients with generalized pustular psoriasis (GPP). The study achieved its main goal of rapid improvement in symptoms by Week 4 following a single 750mg IV dose, showing a favorable safety and tolerance profile.
Report Scope
Report Features Description Market Value (2023) USD 27.3 Billion Forecast Revenue (2033) USD 57.8 Billion CAGR (2024-2032) 8.0% Base Year for Estimation 2023 Historic Period 2016-2023 Forecast Period 2024-2033 Report Coverage Revenue Forecast, Market Dynamics, COVID-19 Impact, Competitive Landscape, Recent Developments Segments Covered By Drug Class (Interleukins, TNF Inhibitors, Others), By Treatment Type (Biologic Drugs, Small Molecule Systemic Drugs, Tropical Therapies), By Type (Psoriatic Arthritis, Plaque Psoriasis, Others), By Route of Administration (Oral, Parenteral, Topical), By Distribution Channel (Hospital Pharmacies, Online pharmacies, Retail Pharmacies) Regional Analysis North America - The US, Canada, Rest of North America, Europe - Germany, France, The UK, Spain, Italy, Russia, Netherlands, Rest of Europe, Asia-Pacific - China, Japan, South Korea, India, New Zealand, Singapore, Thailand, Vietnam, Rest of Asia Pacific, Latin America - Brazil, Mexico, Rest of Latin America, Middle East & Africa - South Africa, Saudi Arabia, UAE, Rest of Middle East & Africa Competitive Landscape Johnson & Johnson Services, Inc., Pfizer Inc., AbbVie Inc., Novartis AG, LEO Pharma A/S, Merck & Co., Inc., UCB S.A., Sun Pharmaceutical Industries Ltd., Amgen Inc., Eli Lilly and Company, Evelo Biosciences, Inc. Customization Scope Customization for segments, region/country-level will be provided. Moreover, additional customization can be done based on the requirements. Purchase Options We have three licenses to opt for Single User License, Multi-User License (Up to 5 Users), Corporate Use License (Unlimited User and Printable PDF) -
- 1. Executive Summary
- 1.1. Definition
- 1.2. Taxonomy
- 1.3. Research Scope
- 1.4. Key Analysis
- 1.5. Key Findings by Major Segments
- 1.6. Top strategies by Major Players
- 2. Global Psoriasis Treatment Market Overview
- 2.1. Psoriasis Treatment Market Dynamics
- 2.1.1. Drivers
- 2.1.2. Opportunities
- 2.1.3. Restraints
- 2.1.4. Challenges
- 2.2. Macro-economic Factors
- 2.3. Regulatory Framework
- 2.4. Market Investment Feasibility Index
- 2.5. PEST Analysis
- 2.6. PORTER’S Five Force Analysis
- 2.7. Drivers & Restraints Impact Analysis
- 2.8. Industry Chain Analysis
- 2.9. Cost Structure Analysis
- 2.10. Marketing Strategy
- 2.11. Russia-Ukraine War Impact Analysis
- 2.12. Opportunity Map Analysis
- 2.13. Market Competition Scenario Analysis
- 2.14. Product Life Cycle Analysis
- 2.15. Opportunity Orbits
- 2.16. Manufacturer Intensity Map
- 2.17. Major Companies sales by Value & Volume
- 2.1. Psoriasis Treatment Market Dynamics
- 3. Global Psoriasis Treatment Market Analysis, Opportunity and Forecast, 2016-2032
- 3.1. Global Psoriasis Treatment Market Analysis, 2016-2021
- 3.2. Global Psoriasis Treatment Market Opportunity and Forecast, 2023-2032
- 3.3. Global Psoriasis Treatment Market Analysis, Opportunity and Forecast, By Drug Class, 2016-2032
- 3.3.1. Global Psoriasis Treatment Market Analysis by Drug Class: Introduction
- 3.3.2. Market Size Absolute $ Opportunity Analysis and Forecast, By Drug Class, 2016-2032
- 3.3.3. Interleukins
- 3.3.4. TNF Inhibitors
- 3.3.5. Others
- 3.4. Global Psoriasis Treatment Market Analysis, Opportunity and Forecast, By Treatment Type, 2016-2032
- 3.4.1. Global Psoriasis Treatment Market Analysis by Treatment Type: Introduction
- 3.4.2. Market Size Absolute $ Opportunity Analysis and Forecast, By Treatment Type, 2016-2032
- 3.4.3. Biologic Drugs
- 3.4.4. Small Molecule Systemic Drugs
- 3.4.5. Tropical Therapies
- 3.5. Global Psoriasis Treatment Market Analysis, Opportunity and Forecast, By Type, 2016-2032
- 3.5.1. Global Psoriasis Treatment Market Analysis by Type: Introduction
- 3.5.2. Market Size Absolute $ Opportunity Analysis and Forecast, By Type, 2016-2032
- 3.5.3. Psoriatic Arthritis
- 3.5.4. Plaque Psoriasis
- 3.5.5. Others
- 3.6. Global Psoriasis Treatment Market Analysis, Opportunity and Forecast, By Route of Administration, 2016-2032
- 3.6.1. Global Psoriasis Treatment Market Analysis by Route of Administration: Introduction
- 3.6.2. Market Size Absolute $ Opportunity Analysis and Forecast, By Route of Administration, 2016-2032
- 3.6.3. Oral
- 3.6.4. Parenteral
- 3.6.5. Topical
- 3.7. Global Psoriasis Treatment Market Analysis, Opportunity and Forecast, By Distribution Channel, 2016-2032
- 3.7.1. Global Psoriasis Treatment Market Analysis by Distribution Channel: Introduction
- 3.7.2. Market Size Absolute $ Opportunity Analysis and Forecast, By Distribution Channel, 2016-2032
- 3.7.3. Hospital Pharmacies
- 3.7.4. Online pharmacies
- 3.7.5. Retail Pharmacies
- 4. North America Psoriasis Treatment Market Analysis, Opportunity and Forecast, 2016-2032
- 4.1. North America Psoriasis Treatment Market Analysis, 2016-2021
- 4.2. North America Psoriasis Treatment Market Opportunity and Forecast, 2023-2032
- 4.3. North America Psoriasis Treatment Market Analysis, Opportunity and Forecast, By Drug Class, 2016-2032
- 4.3.1. North America Psoriasis Treatment Market Analysis by Drug Class: Introduction
- 4.3.2. Market Size Absolute $ Opportunity Analysis and Forecast, By Drug Class, 2016-2032
- 4.3.3. Interleukins
- 4.3.4. TNF Inhibitors
- 4.3.5. Others
- 4.4. North America Psoriasis Treatment Market Analysis, Opportunity and Forecast, By Treatment Type, 2016-2032
- 4.4.1. North America Psoriasis Treatment Market Analysis by Treatment Type: Introduction
- 4.4.2. Market Size Absolute $ Opportunity Analysis and Forecast, By Treatment Type, 2016-2032
- 4.4.3. Biologic Drugs
- 4.4.4. Small Molecule Systemic Drugs
- 4.4.5. Tropical Therapies
- 4.5. North America Psoriasis Treatment Market Analysis, Opportunity and Forecast, By Type, 2016-2032
- 4.5.1. North America Psoriasis Treatment Market Analysis by Type: Introduction
- 4.5.2. Market Size Absolute $ Opportunity Analysis and Forecast, By Type, 2016-2032
- 4.5.3. Psoriatic Arthritis
- 4.5.4. Plaque Psoriasis
- 4.5.5. Others
- 4.6. North America Psoriasis Treatment Market Analysis, Opportunity and Forecast, By Route of Administration, 2016-2032
- 4.6.1. North America Psoriasis Treatment Market Analysis by Route of Administration: Introduction
- 4.6.2. Market Size Absolute $ Opportunity Analysis and Forecast, By Route of Administration, 2016-2032
- 4.6.3. Oral
- 4.6.4. Parenteral
- 4.6.5. Topical
- 4.7. North America Psoriasis Treatment Market Analysis, Opportunity and Forecast, By Distribution Channel, 2016-2032
- 4.7.1. North America Psoriasis Treatment Market Analysis by Distribution Channel: Introduction
- 4.7.2. Market Size Absolute $ Opportunity Analysis and Forecast, By Distribution Channel, 2016-2032
- 4.7.3. Hospital Pharmacies
- 4.7.4. Online pharmacies
- 4.7.5. Retail Pharmacies
- 4.8. North America Psoriasis Treatment Market Analysis, Opportunity and Forecast, By Country , 2016-2032
- 4.8.1. North America Psoriasis Treatment Market Analysis by Country : Introduction
- 4.8.2. Market Size Absolute $ Opportunity Analysis and Forecast, Country , 2016-2032
- 4.8.2.1. The US
- 4.8.2.2. Canada
- 4.8.2.3. Mexico
- 5. Western Europe Psoriasis Treatment Market Analysis, Opportunity and Forecast, 2016-2032
- 5.1. Western Europe Psoriasis Treatment Market Analysis, 2016-2021
- 5.2. Western Europe Psoriasis Treatment Market Opportunity and Forecast, 2023-2032
- 5.3. Western Europe Psoriasis Treatment Market Analysis, Opportunity and Forecast, By Drug Class, 2016-2032
- 5.3.1. Western Europe Psoriasis Treatment Market Analysis by Drug Class: Introduction
- 5.3.2. Market Size Absolute $ Opportunity Analysis and Forecast, By Drug Class, 2016-2032
- 5.3.3. Interleukins
- 5.3.4. TNF Inhibitors
- 5.3.5. Others
- 5.4. Western Europe Psoriasis Treatment Market Analysis, Opportunity and Forecast, By Treatment Type, 2016-2032
- 5.4.1. Western Europe Psoriasis Treatment Market Analysis by Treatment Type: Introduction
- 5.4.2. Market Size Absolute $ Opportunity Analysis and Forecast, By Treatment Type, 2016-2032
- 5.4.3. Biologic Drugs
- 5.4.4. Small Molecule Systemic Drugs
- 5.4.5. Tropical Therapies
- 5.5. Western Europe Psoriasis Treatment Market Analysis, Opportunity and Forecast, By Type, 2016-2032
- 5.5.1. Western Europe Psoriasis Treatment Market Analysis by Type: Introduction
- 5.5.2. Market Size Absolute $ Opportunity Analysis and Forecast, By Type, 2016-2032
- 5.5.3. Psoriatic Arthritis
- 5.5.4. Plaque Psoriasis
- 5.5.5. Others
- 5.6. Western Europe Psoriasis Treatment Market Analysis, Opportunity and Forecast, By Route of Administration, 2016-2032
- 5.6.1. Western Europe Psoriasis Treatment Market Analysis by Route of Administration: Introduction
- 5.6.2. Market Size Absolute $ Opportunity Analysis and Forecast, By Route of Administration, 2016-2032
- 5.6.3. Oral
- 5.6.4. Parenteral
- 5.6.5. Topical
- 5.7. Western Europe Psoriasis Treatment Market Analysis, Opportunity and Forecast, By Distribution Channel, 2016-2032
- 5.7.1. Western Europe Psoriasis Treatment Market Analysis by Distribution Channel: Introduction
- 5.7.2. Market Size Absolute $ Opportunity Analysis and Forecast, By Distribution Channel, 2016-2032
- 5.7.3. Hospital Pharmacies
- 5.7.4. Online pharmacies
- 5.7.5. Retail Pharmacies
- 5.8. Western Europe Psoriasis Treatment Market Analysis, Opportunity and Forecast, By Country , 2016-2032
- 5.8.1. Western Europe Psoriasis Treatment Market Analysis by Country : Introduction
- 5.8.2. Market Size Absolute $ Opportunity Analysis and Forecast, Country , 2016-2032
- 5.8.2.1. Germany
- 5.8.2.2. France
- 5.8.2.3. The UK
- 5.8.2.4. Spain
- 5.8.2.5. Italy
- 5.8.2.6. Portugal
- 5.8.2.7. Ireland
- 5.8.2.8. Austria
- 5.8.2.9. Switzerland
- 5.8.2.10. Benelux
- 5.8.2.11. Nordic
- 5.8.2.12. Rest of Western Europe
- 6. Eastern Europe Psoriasis Treatment Market Analysis, Opportunity and Forecast, 2016-2032
- 6.1. Eastern Europe Psoriasis Treatment Market Analysis, 2016-2021
- 6.2. Eastern Europe Psoriasis Treatment Market Opportunity and Forecast, 2023-2032
- 6.3. Eastern Europe Psoriasis Treatment Market Analysis, Opportunity and Forecast, By Drug Class, 2016-2032
- 6.3.1. Eastern Europe Psoriasis Treatment Market Analysis by Drug Class: Introduction
- 6.3.2. Market Size Absolute $ Opportunity Analysis and Forecast, By Drug Class, 2016-2032
- 6.3.3. Interleukins
- 6.3.4. TNF Inhibitors
- 6.3.5. Others
- 6.4. Eastern Europe Psoriasis Treatment Market Analysis, Opportunity and Forecast, By Treatment Type, 2016-2032
- 6.4.1. Eastern Europe Psoriasis Treatment Market Analysis by Treatment Type: Introduction
- 6.4.2. Market Size Absolute $ Opportunity Analysis and Forecast, By Treatment Type, 2016-2032
- 6.4.3. Biologic Drugs
- 6.4.4. Small Molecule Systemic Drugs
- 6.4.5. Tropical Therapies
- 6.5. Eastern Europe Psoriasis Treatment Market Analysis, Opportunity and Forecast, By Type, 2016-2032
- 6.5.1. Eastern Europe Psoriasis Treatment Market Analysis by Type: Introduction
- 6.5.2. Market Size Absolute $ Opportunity Analysis and Forecast, By Type, 2016-2032
- 6.5.3. Psoriatic Arthritis
- 6.5.4. Plaque Psoriasis
- 6.5.5. Others
- 6.6. Eastern Europe Psoriasis Treatment Market Analysis, Opportunity and Forecast, By Route of Administration, 2016-2032
- 6.6.1. Eastern Europe Psoriasis Treatment Market Analysis by Route of Administration: Introduction
- 6.6.2. Market Size Absolute $ Opportunity Analysis and Forecast, By Route of Administration, 2016-2032
- 6.6.3. Oral
- 6.6.4. Parenteral
- 6.6.5. Topical
- 6.7. Eastern Europe Psoriasis Treatment Market Analysis, Opportunity and Forecast, By Distribution Channel, 2016-2032
- 6.7.1. Eastern Europe Psoriasis Treatment Market Analysis by Distribution Channel: Introduction
- 6.7.2. Market Size Absolute $ Opportunity Analysis and Forecast, By Distribution Channel, 2016-2032
- 6.7.3. Hospital Pharmacies
- 6.7.4. Online pharmacies
- 6.7.5. Retail Pharmacies
- 6.8. Eastern Europe Psoriasis Treatment Market Analysis, Opportunity and Forecast, By Country , 2016-2032
- 6.8.1. Eastern Europe Psoriasis Treatment Market Analysis by Country : Introduction
- 6.8.2. Market Size Absolute $ Opportunity Analysis and Forecast, Country , 2016-2032
- 6.8.2.1. Russia
- 6.8.2.2. Poland
- 6.8.2.3. The Czech Republic
- 6.8.2.4. Greece
- 6.8.2.5. Rest of Eastern Europe
- 7. APAC Psoriasis Treatment Market Analysis, Opportunity and Forecast, 2016-2032
- 7.1. APAC Psoriasis Treatment Market Analysis, 2016-2021
- 7.2. APAC Psoriasis Treatment Market Opportunity and Forecast, 2023-2032
- 7.3. APAC Psoriasis Treatment Market Analysis, Opportunity and Forecast, By Drug Class, 2016-2032
- 7.3.1. APAC Psoriasis Treatment Market Analysis by Drug Class: Introduction
- 7.3.2. Market Size Absolute $ Opportunity Analysis and Forecast, By Drug Class, 2016-2032
- 7.3.3. Interleukins
- 7.3.4. TNF Inhibitors
- 7.3.5. Others
- 7.4. APAC Psoriasis Treatment Market Analysis, Opportunity and Forecast, By Treatment Type, 2016-2032
- 7.4.1. APAC Psoriasis Treatment Market Analysis by Treatment Type: Introduction
- 7.4.2. Market Size Absolute $ Opportunity Analysis and Forecast, By Treatment Type, 2016-2032
- 7.4.3. Biologic Drugs
- 7.4.4. Small Molecule Systemic Drugs
- 7.4.5. Tropical Therapies
- 7.5. APAC Psoriasis Treatment Market Analysis, Opportunity and Forecast, By Type, 2016-2032
- 7.5.1. APAC Psoriasis Treatment Market Analysis by Type: Introduction
- 7.5.2. Market Size Absolute $ Opportunity Analysis and Forecast, By Type, 2016-2032
- 7.5.3. Psoriatic Arthritis
- 7.5.4. Plaque Psoriasis
- 7.5.5. Others
- 7.6. APAC Psoriasis Treatment Market Analysis, Opportunity and Forecast, By Route of Administration, 2016-2032
- 7.6.1. APAC Psoriasis Treatment Market Analysis by Route of Administration: Introduction
- 7.6.2. Market Size Absolute $ Opportunity Analysis and Forecast, By Route of Administration, 2016-2032
- 7.6.3. Oral
- 7.6.4. Parenteral
- 7.6.5. Topical
- 7.7. APAC Psoriasis Treatment Market Analysis, Opportunity and Forecast, By Distribution Channel, 2016-2032
- 7.7.1. APAC Psoriasis Treatment Market Analysis by Distribution Channel: Introduction
- 7.7.2. Market Size Absolute $ Opportunity Analysis and Forecast, By Distribution Channel, 2016-2032
- 7.7.3. Hospital Pharmacies
- 7.7.4. Online pharmacies
- 7.7.5. Retail Pharmacies
- 7.8. APAC Psoriasis Treatment Market Analysis, Opportunity and Forecast, By Country , 2016-2032
- 7.8.1. APAC Psoriasis Treatment Market Analysis by Country : Introduction
- 7.8.2. Market Size Absolute $ Opportunity Analysis and Forecast, Country , 2016-2032
- 7.8.2.1. China
- 7.8.2.2. Japan
- 7.8.2.3. South Korea
- 7.8.2.4. India
- 7.8.2.5. Australia & New Zeland
- 7.8.2.6. Indonesia
- 7.8.2.7. Malaysia
- 7.8.2.8. Philippines
- 7.8.2.9. Singapore
- 7.8.2.10. Thailand
- 7.8.2.11. Vietnam
- 7.8.2.12. Rest of APAC
- 8. Latin America Psoriasis Treatment Market Analysis, Opportunity and Forecast, 2016-2032
- 8.1. Latin America Psoriasis Treatment Market Analysis, 2016-2021
- 8.2. Latin America Psoriasis Treatment Market Opportunity and Forecast, 2023-2032
- 8.3. Latin America Psoriasis Treatment Market Analysis, Opportunity and Forecast, By Drug Class, 2016-2032
- 8.3.1. Latin America Psoriasis Treatment Market Analysis by Drug Class: Introduction
- 8.3.2. Market Size Absolute $ Opportunity Analysis and Forecast, By Drug Class, 2016-2032
- 8.3.3. Interleukins
- 8.3.4. TNF Inhibitors
- 8.3.5. Others
- 8.4. Latin America Psoriasis Treatment Market Analysis, Opportunity and Forecast, By Treatment Type, 2016-2032
- 8.4.1. Latin America Psoriasis Treatment Market Analysis by Treatment Type: Introduction
- 8.4.2. Market Size Absolute $ Opportunity Analysis and Forecast, By Treatment Type, 2016-2032
- 8.4.3. Biologic Drugs
- 8.4.4. Small Molecule Systemic Drugs
- 8.4.5. Tropical Therapies
- 8.5. Latin America Psoriasis Treatment Market Analysis, Opportunity and Forecast, By Type, 2016-2032
- 8.5.1. Latin America Psoriasis Treatment Market Analysis by Type: Introduction
- 8.5.2. Market Size Absolute $ Opportunity Analysis and Forecast, By Type, 2016-2032
- 8.5.3. Psoriatic Arthritis
- 8.5.4. Plaque Psoriasis
- 8.5.5. Others
- 8.6. Latin America Psoriasis Treatment Market Analysis, Opportunity and Forecast, By Route of Administration, 2016-2032
- 8.6.1. Latin America Psoriasis Treatment Market Analysis by Route of Administration: Introduction
- 8.6.2. Market Size Absolute $ Opportunity Analysis and Forecast, By Route of Administration, 2016-2032
- 8.6.3. Oral
- 8.6.4. Parenteral
- 8.6.5. Topical
- 8.7. Latin America Psoriasis Treatment Market Analysis, Opportunity and Forecast, By Distribution Channel, 2016-2032
- 8.7.1. Latin America Psoriasis Treatment Market Analysis by Distribution Channel: Introduction
- 8.7.2. Market Size Absolute $ Opportunity Analysis and Forecast, By Distribution Channel, 2016-2032
- 8.7.3. Hospital Pharmacies
- 8.7.4. Online pharmacies
- 8.7.5. Retail Pharmacies
- 8.8. Latin America Psoriasis Treatment Market Analysis, Opportunity and Forecast, By Country , 2016-2032
- 8.8.1. Latin America Psoriasis Treatment Market Analysis by Country : Introduction
- 8.8.2. Market Size Absolute $ Opportunity Analysis and Forecast, Country , 2016-2032
- 8.8.2.1. Brazil
- 8.8.2.2. Colombia
- 8.8.2.3. Chile
- 8.8.2.4. Argentina
- 8.8.2.5. Costa Rica
- 8.8.2.6. Rest of Latin America
- 9. Middle East & Africa Psoriasis Treatment Market Analysis, Opportunity and Forecast, 2016-2032
- 9.1. Middle East & Africa Psoriasis Treatment Market Analysis, 2016-2021
- 9.2. Middle East & Africa Psoriasis Treatment Market Opportunity and Forecast, 2023-2032
- 9.3. Middle East & Africa Psoriasis Treatment Market Analysis, Opportunity and Forecast, By Drug Class, 2016-2032
- 9.3.1. Middle East & Africa Psoriasis Treatment Market Analysis by Drug Class: Introduction
- 9.3.2. Market Size Absolute $ Opportunity Analysis and Forecast, By Drug Class, 2016-2032
- 9.3.3. Interleukins
- 9.3.4. TNF Inhibitors
- 9.3.5. Others
- 9.4. Middle East & Africa Psoriasis Treatment Market Analysis, Opportunity and Forecast, By Treatment Type, 2016-2032
- 9.4.1. Middle East & Africa Psoriasis Treatment Market Analysis by Treatment Type: Introduction
- 9.4.2. Market Size Absolute $ Opportunity Analysis and Forecast, By Treatment Type, 2016-2032
- 9.4.3. Biologic Drugs
- 9.4.4. Small Molecule Systemic Drugs
- 9.4.5. Tropical Therapies
- 9.5. Middle East & Africa Psoriasis Treatment Market Analysis, Opportunity and Forecast, By Type, 2016-2032
- 9.5.1. Middle East & Africa Psoriasis Treatment Market Analysis by Type: Introduction
- 9.5.2. Market Size Absolute $ Opportunity Analysis and Forecast, By Type, 2016-2032
- 9.5.3. Psoriatic Arthritis
- 9.5.4. Plaque Psoriasis
- 9.5.5. Others
- 9.6. Middle East & Africa Psoriasis Treatment Market Analysis, Opportunity and Forecast, By Route of Administration, 2016-2032
- 9.6.1. Middle East & Africa Psoriasis Treatment Market Analysis by Route of Administration: Introduction
- 9.6.2. Market Size Absolute $ Opportunity Analysis and Forecast, By Route of Administration, 2016-2032
- 9.6.3. Oral
- 9.6.4. Parenteral
- 9.6.5. Topical
- 9.7. Middle East & Africa Psoriasis Treatment Market Analysis, Opportunity and Forecast, By Distribution Channel, 2016-2032
- 9.7.1. Middle East & Africa Psoriasis Treatment Market Analysis by Distribution Channel: Introduction
- 9.7.2. Market Size Absolute $ Opportunity Analysis and Forecast, By Distribution Channel, 2016-2032
- 9.7.3. Hospital Pharmacies
- 9.7.4. Online pharmacies
- 9.7.5. Retail Pharmacies
- 9.8. Middle East & Africa Psoriasis Treatment Market Analysis, Opportunity and Forecast, By Country , 2016-2032
- 9.8.1. Middle East & Africa Psoriasis Treatment Market Analysis by Country : Introduction
- 9.8.2. Market Size Absolute $ Opportunity Analysis and Forecast, Country , 2016-2032
- 9.8.2.1. Algeria
- 9.8.2.2. Egypt
- 9.8.2.3. Israel
- 9.8.2.4. Kuwait
- 9.8.2.5. Nigeria
- 9.8.2.6. Saudi Arabia
- 9.8.2.7. South Africa
- 9.8.2.8. Turkey
- 9.8.2.9. The UAE
- 9.8.2.10. Rest of MEA
- 10. Global Psoriasis Treatment Market Analysis, Opportunity and Forecast, By Region , 2016-2032
- 10.1. Global Psoriasis Treatment Market Analysis by Region : Introduction
- 10.2. Market Size Absolute $ Opportunity Analysis and Forecast, By Region , 2016-2032
- 10.2.1. North America
- 10.2.2. Western Europe
- 10.2.3. Eastern Europe
- 10.2.4. APAC
- 10.2.5. Latin America
- 10.2.6. Middle East & Africa
- 11. Global Psoriasis Treatment Market Competitive Landscape, Market Share Analysis, and Company Profiles
- 11.1. Market Share Analysis
- 11.2. Company Profiles
- 11.3. Johnson & Johnson Services, Inc.
- 11.3.1. Company Overview
- 11.3.2. Financial Highlights
- 11.3.3. Product Portfolio
- 11.3.4. SWOT Analysis
- 11.3.5. Key Strategies and Developments
- 11.4. Pfizer Inc.
- 11.4.1. Company Overview
- 11.4.2. Financial Highlights
- 11.4.3. Product Portfolio
- 11.4.4. SWOT Analysis
- 11.4.5. Key Strategies and Developments
- 11.5. AbbVie Inc.
- 11.5.1. Company Overview
- 11.5.2. Financial Highlights
- 11.5.3. Product Portfolio
- 11.5.4. SWOT Analysis
- 11.5.5. Key Strategies and Developments
- 11.6. Novartis AG
- 11.6.1. Company Overview
- 11.6.2. Financial Highlights
- 11.6.3. Product Portfolio
- 11.6.4. SWOT Analysis
- 11.6.5. Key Strategies and Developments
- 11.7. LEO Pharma A/S
- 11.7.1. Company Overview
- 11.7.2. Financial Highlights
- 11.7.3. Product Portfolio
- 11.7.4. SWOT Analysis
- 11.7.5. Key Strategies and Developments
- 11.8. Merck & Co., Inc.
- 11.8.1. Company Overview
- 11.8.2. Financial Highlights
- 11.8.3. Product Portfolio
- 11.8.4. SWOT Analysis
- 11.8.5. Key Strategies and Developments
- 11.9. UCB S.A.
- 11.9.1. Company Overview
- 11.9.2. Financial Highlights
- 11.9.3. Product Portfolio
- 11.9.4. SWOT Analysis
- 11.9.5. Key Strategies and Developments
- 11.10. Sun Pharmaceutical Industries Ltd.
- 11.10.1. Company Overview
- 11.10.2. Financial Highlights
- 11.10.3. Product Portfolio
- 11.10.4. SWOT Analysis
- 11.10.5. Key Strategies and Developments
- 11.11. Amgen Inc.
- 11.11.1. Company Overview
- 11.11.2. Financial Highlights
- 11.11.3. Product Portfolio
- 11.11.4. SWOT Analysis
- 11.11.5. Key Strategies and Developments
- 11.12. Eli Lilly and Company
- 11.12.1. Company Overview
- 11.12.2. Financial Highlights
- 11.12.3. Product Portfolio
- 11.12.4. SWOT Analysis
- 11.12.5. Key Strategies and Developments
- 11.13.1. Company Overview
- 11.13.2. Financial Highlights
- 11.13.3. Product Portfolio
- 11.13.4. SWOT Analysis
- 11.13.5. Key Strategies and Developments
- 11.14. Evelo Biosciences, Inc.
- 11.14.1. Company Overview
- 11.14.2. Financial Highlights
- 11.14.3. Product Portfolio
- 11.14.4. SWOT Analysis
- 11.14.5. Key Strategies and Developments
- 12. Assumptions and Acronyms
- 13. Research Methodology
- 14. Contact
"
- List of Figures
- "
- Figure 1: Global Psoriasis Treatment Market Revenue (US$ Mn) Market Share by Drug Class in 2022
- Figure 2: Global Psoriasis Treatment Market Market Attractiveness Analysis by Drug Class, 2016-2032
- Figure 3: Global Psoriasis Treatment Market Revenue (US$ Mn) Market Share by Treatment Typein 2022
- Figure 4: Global Psoriasis Treatment Market Market Attractiveness Analysis by Treatment Type, 2016-2032
- Figure 5: Global Psoriasis Treatment Market Revenue (US$ Mn) Market Share by Typein 2022
- Figure 6: Global Psoriasis Treatment Market Market Attractiveness Analysis by Type, 2016-2032
- Figure 7: Global Psoriasis Treatment Market Revenue (US$ Mn) Market Share by Route of Administrationin 2022
- Figure 8: Global Psoriasis Treatment Market Market Attractiveness Analysis by Route of Administration, 2016-2032
- Figure 9: Global Psoriasis Treatment Market Revenue (US$ Mn) Market Share by Distribution Channelin 2022
- Figure 10: Global Psoriasis Treatment Market Market Attractiveness Analysis by Distribution Channel, 2016-2032
- Figure 11: Global Psoriasis Treatment Market Revenue (US$ Mn) Market Share by Region in 2022
- Figure 12: Global Psoriasis Treatment Market Market Attractiveness Analysis by Region, 2016-2032
- Figure 13: Global Psoriasis Treatment Market Market Revenue (US$ Mn) (2016-2032)
- Figure 14: Global Psoriasis Treatment Market Market Revenue (US$ Mn) Comparison by Region (2016-2032)
- Figure 15: Global Psoriasis Treatment Market Market Revenue (US$ Mn) Comparison by Drug Class (2016-2032)
- Figure 16: Global Psoriasis Treatment Market Market Revenue (US$ Mn) Comparison by Treatment Type (2016-2032)
- Figure 17: Global Psoriasis Treatment Market Market Revenue (US$ Mn) Comparison by Type (2016-2032)
- Figure 18: Global Psoriasis Treatment Market Market Revenue (US$ Mn) Comparison by Route of Administration (2016-2032)
- Figure 19: Global Psoriasis Treatment Market Market Revenue (US$ Mn) Comparison by Distribution Channel (2016-2032)
- Figure 20: Global Psoriasis Treatment Market Market Y-o-Y Growth Rate Comparison by Region (2016-2032)
- Figure 21: Global Psoriasis Treatment Market Market Y-o-Y Growth Rate Comparison by Drug Class (2016-2032)
- Figure 22: Global Psoriasis Treatment Market Market Y-o-Y Growth Rate Comparison by Treatment Type (2016-2032)
- Figure 23: Global Psoriasis Treatment Market Market Y-o-Y Growth Rate Comparison by Type (2016-2032)
- Figure 24: Global Psoriasis Treatment Market Market Y-o-Y Growth Rate Comparison by Route of Administration (2016-2032)
- Figure 25: Global Psoriasis Treatment Market Market Y-o-Y Growth Rate Comparison by Distribution Channel (2016-2032)
- Figure 26: Global Psoriasis Treatment Market Market Share Comparison by Region (2016-2032)
- Figure 27: Global Psoriasis Treatment Market Market Share Comparison by Drug Class (2016-2032)
- Figure 28: Global Psoriasis Treatment Market Market Share Comparison by Treatment Type (2016-2032)
- Figure 29: Global Psoriasis Treatment Market Market Share Comparison by Type (2016-2032)
- Figure 30: Global Psoriasis Treatment Market Market Share Comparison by Route of Administration (2016-2032)
- Figure 31: Global Psoriasis Treatment Market Market Share Comparison by Distribution Channel (2016-2032)
- Figure 32: North America Psoriasis Treatment Market Revenue (US$ Mn) Market Share by Drug Classin 2022
- Figure 33: North America Psoriasis Treatment Market Market Attractiveness Analysis by Drug Class, 2016-2032
- Figure 34: North America Psoriasis Treatment Market Revenue (US$ Mn) Market Share by Treatment Typein 2022
- Figure 35: North America Psoriasis Treatment Market Market Attractiveness Analysis by Treatment Type, 2016-2032
- Figure 36: North America Psoriasis Treatment Market Revenue (US$ Mn) Market Share by Typein 2022
- Figure 37: North America Psoriasis Treatment Market Market Attractiveness Analysis by Type, 2016-2032
- Figure 38: North America Psoriasis Treatment Market Revenue (US$ Mn) Market Share by Route of Administrationin 2022
- Figure 39: North America Psoriasis Treatment Market Market Attractiveness Analysis by Route of Administration, 2016-2032
- Figure 40: North America Psoriasis Treatment Market Revenue (US$ Mn) Market Share by Distribution Channelin 2022
- Figure 41: North America Psoriasis Treatment Market Market Attractiveness Analysis by Distribution Channel, 2016-2032
- Figure 42: North America Psoriasis Treatment Market Revenue (US$ Mn) Market Share by Country in 2022
- Figure 43: North America Psoriasis Treatment Market Market Attractiveness Analysis by Country, 2016-2032
- Figure 44: North America Psoriasis Treatment Market Market Revenue (US$ Mn) (2016-2032)
- Figure 45: North America Psoriasis Treatment Market Market Revenue (US$ Mn) Comparison by Country (2016-2032)
- Figure 46: North America Psoriasis Treatment Market Market Revenue (US$ Mn) Comparison by Drug Class (2016-2032)
- Figure 47: North America Psoriasis Treatment Market Market Revenue (US$ Mn) Comparison by Treatment Type (2016-2032)
- Figure 48: North America Psoriasis Treatment Market Market Revenue (US$ Mn) Comparison by Type (2016-2032)
- Figure 49: North America Psoriasis Treatment Market Market Revenue (US$ Mn) Comparison by Route of Administration (2016-2032)
- Figure 50: North America Psoriasis Treatment Market Market Revenue (US$ Mn) Comparison by Distribution Channel (2016-2032)
- Figure 51: North America Psoriasis Treatment Market Market Y-o-Y Growth Rate Comparison by Country (2016-2032)
- Figure 52: North America Psoriasis Treatment Market Market Y-o-Y Growth Rate Comparison by Drug Class (2016-2032)
- Figure 53: North America Psoriasis Treatment Market Market Y-o-Y Growth Rate Comparison by Treatment Type (2016-2032)
- Figure 54: North America Psoriasis Treatment Market Market Y-o-Y Growth Rate Comparison by Type (2016-2032)
- Figure 55: North America Psoriasis Treatment Market Market Y-o-Y Growth Rate Comparison by Route of Administration (2016-2032)
- Figure 56: North America Psoriasis Treatment Market Market Y-o-Y Growth Rate Comparison by Distribution Channel (2016-2032)
- Figure 57: North America Psoriasis Treatment Market Market Share Comparison by Country (2016-2032)
- Figure 58: North America Psoriasis Treatment Market Market Share Comparison by Drug Class (2016-2032)
- Figure 59: North America Psoriasis Treatment Market Market Share Comparison by Treatment Type (2016-2032)
- Figure 60: North America Psoriasis Treatment Market Market Share Comparison by Type (2016-2032)
- Figure 61: North America Psoriasis Treatment Market Market Share Comparison by Route of Administration (2016-2032)
- Figure 62: North America Psoriasis Treatment Market Market Share Comparison by Distribution Channel (2016-2032)
- Figure 63: Western Europe Psoriasis Treatment Market Revenue (US$ Mn) Market Share by Drug Classin 2022
- Figure 64: Western Europe Psoriasis Treatment Market Market Attractiveness Analysis by Drug Class, 2016-2032
- Figure 65: Western Europe Psoriasis Treatment Market Revenue (US$ Mn) Market Share by Treatment Typein 2022
- Figure 66: Western Europe Psoriasis Treatment Market Market Attractiveness Analysis by Treatment Type, 2016-2032
- Figure 67: Western Europe Psoriasis Treatment Market Revenue (US$ Mn) Market Share by Typein 2022
- Figure 68: Western Europe Psoriasis Treatment Market Market Attractiveness Analysis by Type, 2016-2032
- Figure 69: Western Europe Psoriasis Treatment Market Revenue (US$ Mn) Market Share by Route of Administrationin 2022
- Figure 70: Western Europe Psoriasis Treatment Market Market Attractiveness Analysis by Route of Administration, 2016-2032
- Figure 71: Western Europe Psoriasis Treatment Market Revenue (US$ Mn) Market Share by Distribution Channelin 2022
- Figure 72: Western Europe Psoriasis Treatment Market Market Attractiveness Analysis by Distribution Channel, 2016-2032
- Figure 73: Western Europe Psoriasis Treatment Market Revenue (US$ Mn) Market Share by Country in 2022
- Figure 74: Western Europe Psoriasis Treatment Market Market Attractiveness Analysis by Country, 2016-2032
- Figure 75: Western Europe Psoriasis Treatment Market Market Revenue (US$ Mn) (2016-2032)
- Figure 76: Western Europe Psoriasis Treatment Market Market Revenue (US$ Mn) Comparison by Country (2016-2032)
- Figure 77: Western Europe Psoriasis Treatment Market Market Revenue (US$ Mn) Comparison by Drug Class (2016-2032)
- Figure 78: Western Europe Psoriasis Treatment Market Market Revenue (US$ Mn) Comparison by Treatment Type (2016-2032)
- Figure 79: Western Europe Psoriasis Treatment Market Market Revenue (US$ Mn) Comparison by Type (2016-2032)
- Figure 80: Western Europe Psoriasis Treatment Market Market Revenue (US$ Mn) Comparison by Route of Administration (2016-2032)
- Figure 81: Western Europe Psoriasis Treatment Market Market Revenue (US$ Mn) Comparison by Distribution Channel (2016-2032)
- Figure 82: Western Europe Psoriasis Treatment Market Market Y-o-Y Growth Rate Comparison by Country (2016-2032)
- Figure 83: Western Europe Psoriasis Treatment Market Market Y-o-Y Growth Rate Comparison by Drug Class (2016-2032)
- Figure 84: Western Europe Psoriasis Treatment Market Market Y-o-Y Growth Rate Comparison by Treatment Type (2016-2032)
- Figure 85: Western Europe Psoriasis Treatment Market Market Y-o-Y Growth Rate Comparison by Type (2016-2032)
- Figure 86: Western Europe Psoriasis Treatment Market Market Y-o-Y Growth Rate Comparison by Route of Administration (2016-2032)
- Figure 87: Western Europe Psoriasis Treatment Market Market Y-o-Y Growth Rate Comparison by Distribution Channel (2016-2032)
- Figure 88: Western Europe Psoriasis Treatment Market Market Share Comparison by Country (2016-2032)
- Figure 89: Western Europe Psoriasis Treatment Market Market Share Comparison by Drug Class (2016-2032)
- Figure 90: Western Europe Psoriasis Treatment Market Market Share Comparison by Treatment Type (2016-2032)
- Figure 91: Western Europe Psoriasis Treatment Market Market Share Comparison by Type (2016-2032)
- Figure 92: Western Europe Psoriasis Treatment Market Market Share Comparison by Route of Administration (2016-2032)
- Figure 93: Western Europe Psoriasis Treatment Market Market Share Comparison by Distribution Channel (2016-2032)
- Figure 94: Eastern Europe Psoriasis Treatment Market Revenue (US$ Mn) Market Share by Drug Classin 2022
- Figure 95: Eastern Europe Psoriasis Treatment Market Market Attractiveness Analysis by Drug Class, 2016-2032
- Figure 96: Eastern Europe Psoriasis Treatment Market Revenue (US$ Mn) Market Share by Treatment Typein 2022
- Figure 97: Eastern Europe Psoriasis Treatment Market Market Attractiveness Analysis by Treatment Type, 2016-2032
- Figure 98: Eastern Europe Psoriasis Treatment Market Revenue (US$ Mn) Market Share by Typein 2022
- Figure 99: Eastern Europe Psoriasis Treatment Market Market Attractiveness Analysis by Type, 2016-2032
- Figure 100: Eastern Europe Psoriasis Treatment Market Revenue (US$ Mn) Market Share by Route of Administrationin 2022
- Figure 101: Eastern Europe Psoriasis Treatment Market Market Attractiveness Analysis by Route of Administration, 2016-2032
- Figure 102: Eastern Europe Psoriasis Treatment Market Revenue (US$ Mn) Market Share by Distribution Channelin 2022
- Figure 103: Eastern Europe Psoriasis Treatment Market Market Attractiveness Analysis by Distribution Channel, 2016-2032
- Figure 104: Eastern Europe Psoriasis Treatment Market Revenue (US$ Mn) Market Share by Country in 2022
- Figure 105: Eastern Europe Psoriasis Treatment Market Market Attractiveness Analysis by Country, 2016-2032
- Figure 106: Eastern Europe Psoriasis Treatment Market Market Revenue (US$ Mn) (2016-2032)
- Figure 107: Eastern Europe Psoriasis Treatment Market Market Revenue (US$ Mn) Comparison by Country (2016-2032)
- Figure 108: Eastern Europe Psoriasis Treatment Market Market Revenue (US$ Mn) Comparison by Drug Class (2016-2032)
- Figure 109: Eastern Europe Psoriasis Treatment Market Market Revenue (US$ Mn) Comparison by Treatment Type (2016-2032)
- Figure 110: Eastern Europe Psoriasis Treatment Market Market Revenue (US$ Mn) Comparison by Type (2016-2032)
- Figure 111: Eastern Europe Psoriasis Treatment Market Market Revenue (US$ Mn) Comparison by Route of Administration (2016-2032)
- Figure 112: Eastern Europe Psoriasis Treatment Market Market Revenue (US$ Mn) Comparison by Distribution Channel (2016-2032)
- Figure 113: Eastern Europe Psoriasis Treatment Market Market Y-o-Y Growth Rate Comparison by Country (2016-2032)
- Figure 114: Eastern Europe Psoriasis Treatment Market Market Y-o-Y Growth Rate Comparison by Drug Class (2016-2032)
- Figure 115: Eastern Europe Psoriasis Treatment Market Market Y-o-Y Growth Rate Comparison by Treatment Type (2016-2032)
- Figure 116: Eastern Europe Psoriasis Treatment Market Market Y-o-Y Growth Rate Comparison by Type (2016-2032)
- Figure 117: Eastern Europe Psoriasis Treatment Market Market Y-o-Y Growth Rate Comparison by Route of Administration (2016-2032)
- Figure 118: Eastern Europe Psoriasis Treatment Market Market Y-o-Y Growth Rate Comparison by Distribution Channel (2016-2032)
- Figure 119: Eastern Europe Psoriasis Treatment Market Market Share Comparison by Country (2016-2032)
- Figure 120: Eastern Europe Psoriasis Treatment Market Market Share Comparison by Drug Class (2016-2032)
- Figure 121: Eastern Europe Psoriasis Treatment Market Market Share Comparison by Treatment Type (2016-2032)
- Figure 122: Eastern Europe Psoriasis Treatment Market Market Share Comparison by Type (2016-2032)
- Figure 123: Eastern Europe Psoriasis Treatment Market Market Share Comparison by Route of Administration (2016-2032)
- Figure 124: Eastern Europe Psoriasis Treatment Market Market Share Comparison by Distribution Channel (2016-2032)
- Figure 125: APAC Psoriasis Treatment Market Revenue (US$ Mn) Market Share by Drug Classin 2022
- Figure 126: APAC Psoriasis Treatment Market Market Attractiveness Analysis by Drug Class, 2016-2032
- Figure 127: APAC Psoriasis Treatment Market Revenue (US$ Mn) Market Share by Treatment Typein 2022
- Figure 128: APAC Psoriasis Treatment Market Market Attractiveness Analysis by Treatment Type, 2016-2032
- Figure 129: APAC Psoriasis Treatment Market Revenue (US$ Mn) Market Share by Typein 2022
- Figure 130: APAC Psoriasis Treatment Market Market Attractiveness Analysis by Type, 2016-2032
- Figure 131: APAC Psoriasis Treatment Market Revenue (US$ Mn) Market Share by Route of Administrationin 2022
- Figure 132: APAC Psoriasis Treatment Market Market Attractiveness Analysis by Route of Administration, 2016-2032
- Figure 133: APAC Psoriasis Treatment Market Revenue (US$ Mn) Market Share by Distribution Channelin 2022
- Figure 134: APAC Psoriasis Treatment Market Market Attractiveness Analysis by Distribution Channel, 2016-2032
- Figure 135: APAC Psoriasis Treatment Market Revenue (US$ Mn) Market Share by Country in 2022
- Figure 136: APAC Psoriasis Treatment Market Market Attractiveness Analysis by Country, 2016-2032
- Figure 137: APAC Psoriasis Treatment Market Market Revenue (US$ Mn) (2016-2032)
- Figure 138: APAC Psoriasis Treatment Market Market Revenue (US$ Mn) Comparison by Country (2016-2032)
- Figure 139: APAC Psoriasis Treatment Market Market Revenue (US$ Mn) Comparison by Drug Class (2016-2032)
- Figure 140: APAC Psoriasis Treatment Market Market Revenue (US$ Mn) Comparison by Treatment Type (2016-2032)
- Figure 141: APAC Psoriasis Treatment Market Market Revenue (US$ Mn) Comparison by Type (2016-2032)
- Figure 142: APAC Psoriasis Treatment Market Market Revenue (US$ Mn) Comparison by Route of Administration (2016-2032)
- Figure 143: APAC Psoriasis Treatment Market Market Revenue (US$ Mn) Comparison by Distribution Channel (2016-2032)
- Figure 144: APAC Psoriasis Treatment Market Market Y-o-Y Growth Rate Comparison by Country (2016-2032)
- Figure 145: APAC Psoriasis Treatment Market Market Y-o-Y Growth Rate Comparison by Drug Class (2016-2032)
- Figure 146: APAC Psoriasis Treatment Market Market Y-o-Y Growth Rate Comparison by Treatment Type (2016-2032)
- Figure 147: APAC Psoriasis Treatment Market Market Y-o-Y Growth Rate Comparison by Type (2016-2032)
- Figure 148: APAC Psoriasis Treatment Market Market Y-o-Y Growth Rate Comparison by Route of Administration (2016-2032)
- Figure 149: APAC Psoriasis Treatment Market Market Y-o-Y Growth Rate Comparison by Distribution Channel (2016-2032)
- Figure 150: APAC Psoriasis Treatment Market Market Share Comparison by Country (2016-2032)
- Figure 151: APAC Psoriasis Treatment Market Market Share Comparison by Drug Class (2016-2032)
- Figure 152: APAC Psoriasis Treatment Market Market Share Comparison by Treatment Type (2016-2032)
- Figure 153: APAC Psoriasis Treatment Market Market Share Comparison by Type (2016-2032)
- Figure 154: APAC Psoriasis Treatment Market Market Share Comparison by Route of Administration (2016-2032)
- Figure 155: APAC Psoriasis Treatment Market Market Share Comparison by Distribution Channel (2016-2032)
- Figure 156: Latin America Psoriasis Treatment Market Revenue (US$ Mn) Market Share by Drug Classin 2022
- Figure 157: Latin America Psoriasis Treatment Market Market Attractiveness Analysis by Drug Class, 2016-2032
- Figure 158: Latin America Psoriasis Treatment Market Revenue (US$ Mn) Market Share by Treatment Typein 2022
- Figure 159: Latin America Psoriasis Treatment Market Market Attractiveness Analysis by Treatment Type, 2016-2032
- Figure 160: Latin America Psoriasis Treatment Market Revenue (US$ Mn) Market Share by Typein 2022
- Figure 161: Latin America Psoriasis Treatment Market Market Attractiveness Analysis by Type, 2016-2032
- Figure 162: Latin America Psoriasis Treatment Market Revenue (US$ Mn) Market Share by Route of Administrationin 2022
- Figure 163: Latin America Psoriasis Treatment Market Market Attractiveness Analysis by Route of Administration, 2016-2032
- Figure 164: Latin America Psoriasis Treatment Market Revenue (US$ Mn) Market Share by Distribution Channelin 2022
- Figure 165: Latin America Psoriasis Treatment Market Market Attractiveness Analysis by Distribution Channel, 2016-2032
- Figure 166: Latin America Psoriasis Treatment Market Revenue (US$ Mn) Market Share by Country in 2022
- Figure 167: Latin America Psoriasis Treatment Market Market Attractiveness Analysis by Country, 2016-2032
- Figure 168: Latin America Psoriasis Treatment Market Market Revenue (US$ Mn) (2016-2032)
- Figure 169: Latin America Psoriasis Treatment Market Market Revenue (US$ Mn) Comparison by Country (2016-2032)
- Figure 170: Latin America Psoriasis Treatment Market Market Revenue (US$ Mn) Comparison by Drug Class (2016-2032)
- Figure 171: Latin America Psoriasis Treatment Market Market Revenue (US$ Mn) Comparison by Treatment Type (2016-2032)
- Figure 172: Latin America Psoriasis Treatment Market Market Revenue (US$ Mn) Comparison by Type (2016-2032)
- Figure 173: Latin America Psoriasis Treatment Market Market Revenue (US$ Mn) Comparison by Route of Administration (2016-2032)
- Figure 174: Latin America Psoriasis Treatment Market Market Revenue (US$ Mn) Comparison by Distribution Channel (2016-2032)
- Figure 175: Latin America Psoriasis Treatment Market Market Y-o-Y Growth Rate Comparison by Country (2016-2032)
- Figure 176: Latin America Psoriasis Treatment Market Market Y-o-Y Growth Rate Comparison by Drug Class (2016-2032)
- Figure 177: Latin America Psoriasis Treatment Market Market Y-o-Y Growth Rate Comparison by Treatment Type (2016-2032)
- Figure 178: Latin America Psoriasis Treatment Market Market Y-o-Y Growth Rate Comparison by Type (2016-2032)
- Figure 179: Latin America Psoriasis Treatment Market Market Y-o-Y Growth Rate Comparison by Route of Administration (2016-2032)
- Figure 180: Latin America Psoriasis Treatment Market Market Y-o-Y Growth Rate Comparison by Distribution Channel (2016-2032)
- Figure 181: Latin America Psoriasis Treatment Market Market Share Comparison by Country (2016-2032)
- Figure 182: Latin America Psoriasis Treatment Market Market Share Comparison by Drug Class (2016-2032)
- Figure 183: Latin America Psoriasis Treatment Market Market Share Comparison by Treatment Type (2016-2032)
- Figure 184: Latin America Psoriasis Treatment Market Market Share Comparison by Type (2016-2032)
- Figure 185: Latin America Psoriasis Treatment Market Market Share Comparison by Route of Administration (2016-2032)
- Figure 186: Latin America Psoriasis Treatment Market Market Share Comparison by Distribution Channel (2016-2032)
- Figure 187: Middle East & Africa Psoriasis Treatment Market Revenue (US$ Mn) Market Share by Drug Classin 2022
- Figure 188: Middle East & Africa Psoriasis Treatment Market Market Attractiveness Analysis by Drug Class, 2016-2032
- Figure 189: Middle East & Africa Psoriasis Treatment Market Revenue (US$ Mn) Market Share by Treatment Typein 2022
- Figure 190: Middle East & Africa Psoriasis Treatment Market Market Attractiveness Analysis by Treatment Type, 2016-2032
- Figure 191: Middle East & Africa Psoriasis Treatment Market Revenue (US$ Mn) Market Share by Typein 2022
- Figure 192: Middle East & Africa Psoriasis Treatment Market Market Attractiveness Analysis by Type, 2016-2032
- Figure 193: Middle East & Africa Psoriasis Treatment Market Revenue (US$ Mn) Market Share by Route of Administrationin 2022
- Figure 194: Middle East & Africa Psoriasis Treatment Market Market Attractiveness Analysis by Route of Administration, 2016-2032
- Figure 195: Middle East & Africa Psoriasis Treatment Market Revenue (US$ Mn) Market Share by Distribution Channelin 2022
- Figure 196: Middle East & Africa Psoriasis Treatment Market Market Attractiveness Analysis by Distribution Channel, 2016-2032
- Figure 197: Middle East & Africa Psoriasis Treatment Market Revenue (US$ Mn) Market Share by Country in 2022
- Figure 198: Middle East & Africa Psoriasis Treatment Market Market Attractiveness Analysis by Country, 2016-2032
- Figure 199: Middle East & Africa Psoriasis Treatment Market Market Revenue (US$ Mn) (2016-2032)
- Figure 200: Middle East & Africa Psoriasis Treatment Market Market Revenue (US$ Mn) Comparison by Country (2016-2032)
- Figure 201: Middle East & Africa Psoriasis Treatment Market Market Revenue (US$ Mn) Comparison by Drug Class (2016-2032)
- Figure 202: Middle East & Africa Psoriasis Treatment Market Market Revenue (US$ Mn) Comparison by Treatment Type (2016-2032)
- Figure 203: Middle East & Africa Psoriasis Treatment Market Market Revenue (US$ Mn) Comparison by Type (2016-2032)
- Figure 204: Middle East & Africa Psoriasis Treatment Market Market Revenue (US$ Mn) Comparison by Route of Administration (2016-2032)
- Figure 205: Middle East & Africa Psoriasis Treatment Market Market Revenue (US$ Mn) Comparison by Distribution Channel (2016-2032)
- Figure 206: Middle East & Africa Psoriasis Treatment Market Market Y-o-Y Growth Rate Comparison by Country (2016-2032)
- Figure 207: Middle East & Africa Psoriasis Treatment Market Market Y-o-Y Growth Rate Comparison by Drug Class (2016-2032)
- Figure 208: Middle East & Africa Psoriasis Treatment Market Market Y-o-Y Growth Rate Comparison by Treatment Type (2016-2032)
- Figure 209: Middle East & Africa Psoriasis Treatment Market Market Y-o-Y Growth Rate Comparison by Type (2016-2032)
- Figure 210: Middle East & Africa Psoriasis Treatment Market Market Y-o-Y Growth Rate Comparison by Route of Administration (2016-2032)
- Figure 211: Middle East & Africa Psoriasis Treatment Market Market Y-o-Y Growth Rate Comparison by Distribution Channel (2016-2032)
- Figure 212: Middle East & Africa Psoriasis Treatment Market Market Share Comparison by Country (2016-2032)
- Figure 213: Middle East & Africa Psoriasis Treatment Market Market Share Comparison by Drug Class (2016-2032)
- Figure 214: Middle East & Africa Psoriasis Treatment Market Market Share Comparison by Treatment Type (2016-2032)
- Figure 215: Middle East & Africa Psoriasis Treatment Market Market Share Comparison by Type (2016-2032)
- Figure 216: Middle East & Africa Psoriasis Treatment Market Market Share Comparison by Route of Administration (2016-2032)
- Figure 217: Middle East & Africa Psoriasis Treatment Market Market Share Comparison by Distribution Channel (2016-2032)
"
- List of Tables
- "
- Table 1: Global Psoriasis Treatment Market Market Comparison by Drug Class (2016-2032)
- Table 2: Global Psoriasis Treatment Market Market Comparison by Treatment Type (2016-2032)
- Table 3: Global Psoriasis Treatment Market Market Comparison by Type (2016-2032)
- Table 4: Global Psoriasis Treatment Market Market Comparison by Route of Administration (2016-2032)
- Table 5: Global Psoriasis Treatment Market Market Comparison by Distribution Channel (2016-2032)
- Table 6: Global Psoriasis Treatment Market Revenue (US$ Mn) Comparison by Region (2016-2032)
- Table 7: Global Psoriasis Treatment Market Market Revenue (US$ Mn) (2016-2032)
- Table 8: Global Psoriasis Treatment Market Market Revenue (US$ Mn) Comparison by Region (2016-2032)
- Table 9: Global Psoriasis Treatment Market Market Revenue (US$ Mn) Comparison by Drug Class (2016-2032)
- Table 10: Global Psoriasis Treatment Market Market Revenue (US$ Mn) Comparison by Treatment Type (2016-2032)
- Table 11: Global Psoriasis Treatment Market Market Revenue (US$ Mn) Comparison by Type (2016-2032)
- Table 12: Global Psoriasis Treatment Market Market Revenue (US$ Mn) Comparison by Route of Administration (2016-2032)
- Table 13: Global Psoriasis Treatment Market Market Revenue (US$ Mn) Comparison by Distribution Channel (2016-2032)
- Table 14: Global Psoriasis Treatment Market Market Y-o-Y Growth Rate Comparison by Region (2016-2032)
- Table 15: Global Psoriasis Treatment Market Market Y-o-Y Growth Rate Comparison by Drug Class (2016-2032)
- Table 16: Global Psoriasis Treatment Market Market Y-o-Y Growth Rate Comparison by Treatment Type (2016-2032)
- Table 17: Global Psoriasis Treatment Market Market Y-o-Y Growth Rate Comparison by Type (2016-2032)
- Table 18: Global Psoriasis Treatment Market Market Y-o-Y Growth Rate Comparison by Route of Administration (2016-2032)
- Table 19: Global Psoriasis Treatment Market Market Y-o-Y Growth Rate Comparison by Distribution Channel (2016-2032)
- Table 20: Global Psoriasis Treatment Market Market Share Comparison by Region (2016-2032)
- Table 21: Global Psoriasis Treatment Market Market Share Comparison by Drug Class (2016-2032)
- Table 22: Global Psoriasis Treatment Market Market Share Comparison by Treatment Type (2016-2032)
- Table 23: Global Psoriasis Treatment Market Market Share Comparison by Type (2016-2032)
- Table 24: Global Psoriasis Treatment Market Market Share Comparison by Route of Administration (2016-2032)
- Table 25: Global Psoriasis Treatment Market Market Share Comparison by Distribution Channel (2016-2032)
- Table 26: North America Psoriasis Treatment Market Market Comparison by Treatment Type (2016-2032)
- Table 27: North America Psoriasis Treatment Market Market Comparison by Type (2016-2032)
- Table 28: North America Psoriasis Treatment Market Market Comparison by Route of Administration (2016-2032)
- Table 29: North America Psoriasis Treatment Market Market Comparison by Distribution Channel (2016-2032)
- Table 30: North America Psoriasis Treatment Market Revenue (US$ Mn) Comparison by Country (2016-2032)
- Table 31: North America Psoriasis Treatment Market Market Revenue (US$ Mn) (2016-2032)
- Table 32: North America Psoriasis Treatment Market Market Revenue (US$ Mn) Comparison by Country (2016-2032)
- Table 33: North America Psoriasis Treatment Market Market Revenue (US$ Mn) Comparison by Drug Class (2016-2032)
- Table 34: North America Psoriasis Treatment Market Market Revenue (US$ Mn) Comparison by Treatment Type (2016-2032)
- Table 35: North America Psoriasis Treatment Market Market Revenue (US$ Mn) Comparison by Type (2016-2032)
- Table 36: North America Psoriasis Treatment Market Market Revenue (US$ Mn) Comparison by Route of Administration (2016-2032)
- Table 37: North America Psoriasis Treatment Market Market Revenue (US$ Mn) Comparison by Distribution Channel (2016-2032)
- Table 38: North America Psoriasis Treatment Market Market Y-o-Y Growth Rate Comparison by Country (2016-2032)
- Table 39: North America Psoriasis Treatment Market Market Y-o-Y Growth Rate Comparison by Drug Class (2016-2032)
- Table 40: North America Psoriasis Treatment Market Market Y-o-Y Growth Rate Comparison by Treatment Type (2016-2032)
- Table 41: North America Psoriasis Treatment Market Market Y-o-Y Growth Rate Comparison by Type (2016-2032)
- Table 42: North America Psoriasis Treatment Market Market Y-o-Y Growth Rate Comparison by Route of Administration (2016-2032)
- Table 43: North America Psoriasis Treatment Market Market Y-o-Y Growth Rate Comparison by Distribution Channel (2016-2032)
- Table 44: North America Psoriasis Treatment Market Market Share Comparison by Country (2016-2032)
- Table 45: North America Psoriasis Treatment Market Market Share Comparison by Drug Class (2016-2032)
- Table 46: North America Psoriasis Treatment Market Market Share Comparison by Treatment Type (2016-2032)
- Table 47: North America Psoriasis Treatment Market Market Share Comparison by Type (2016-2032)
- Table 48: North America Psoriasis Treatment Market Market Share Comparison by Route of Administration (2016-2032)
- Table 49: North America Psoriasis Treatment Market Market Share Comparison by Distribution Channel (2016-2032)
- Table 50: Western Europe Psoriasis Treatment Market Market Comparison by Drug Class (2016-2032)
- Table 51: Western Europe Psoriasis Treatment Market Market Comparison by Treatment Type (2016-2032)
- Table 52: Western Europe Psoriasis Treatment Market Market Comparison by Type (2016-2032)
- Table 53: Western Europe Psoriasis Treatment Market Market Comparison by Route of Administration (2016-2032)
- Table 54: Western Europe Psoriasis Treatment Market Market Comparison by Distribution Channel (2016-2032)
- Table 55: Western Europe Psoriasis Treatment Market Revenue (US$ Mn) Comparison by Country (2016-2032)
- Table 56: Western Europe Psoriasis Treatment Market Market Revenue (US$ Mn) (2016-2032)
- Table 57: Western Europe Psoriasis Treatment Market Market Revenue (US$ Mn) Comparison by Country (2016-2032)
- Table 58: Western Europe Psoriasis Treatment Market Market Revenue (US$ Mn) Comparison by Drug Class (2016-2032)
- Table 59: Western Europe Psoriasis Treatment Market Market Revenue (US$ Mn) Comparison by Treatment Type (2016-2032)
- Table 60: Western Europe Psoriasis Treatment Market Market Revenue (US$ Mn) Comparison by Type (2016-2032)
- Table 61: Western Europe Psoriasis Treatment Market Market Revenue (US$ Mn) Comparison by Route of Administration (2016-2032)
- Table 62: Western Europe Psoriasis Treatment Market Market Revenue (US$ Mn) Comparison by Distribution Channel (2016-2032)
- Table 63: Western Europe Psoriasis Treatment Market Market Y-o-Y Growth Rate Comparison by Country (2016-2032)
- Table 64: Western Europe Psoriasis Treatment Market Market Y-o-Y Growth Rate Comparison by Drug Class (2016-2032)
- Table 65: Western Europe Psoriasis Treatment Market Market Y-o-Y Growth Rate Comparison by Treatment Type (2016-2032)
- Table 66: Western Europe Psoriasis Treatment Market Market Y-o-Y Growth Rate Comparison by Type (2016-2032)
- Table 67: Western Europe Psoriasis Treatment Market Market Y-o-Y Growth Rate Comparison by Route of Administration (2016-2032)
- Table 68: Western Europe Psoriasis Treatment Market Market Y-o-Y Growth Rate Comparison by Distribution Channel (2016-2032)
- Table 69: Western Europe Psoriasis Treatment Market Market Share Comparison by Country (2016-2032)
- Table 70: Western Europe Psoriasis Treatment Market Market Share Comparison by Drug Class (2016-2032)
- Table 71: Western Europe Psoriasis Treatment Market Market Share Comparison by Treatment Type (2016-2032)
- Table 72: Western Europe Psoriasis Treatment Market Market Share Comparison by Type (2016-2032)
- Table 73: Western Europe Psoriasis Treatment Market Market Share Comparison by Route of Administration (2016-2032)
- Table 74: Western Europe Psoriasis Treatment Market Market Share Comparison by Distribution Channel (2016-2032)
- Table 75: Eastern Europe Psoriasis Treatment Market Market Comparison by Drug Class (2016-2032)
- Table 76: Eastern Europe Psoriasis Treatment Market Market Comparison by Treatment Type (2016-2032)
- Table 77: Eastern Europe Psoriasis Treatment Market Market Comparison by Type (2016-2032)
- Table 78: Eastern Europe Psoriasis Treatment Market Market Comparison by Route of Administration (2016-2032)
- Table 79: Eastern Europe Psoriasis Treatment Market Market Comparison by Distribution Channel (2016-2032)
- Table 80: Eastern Europe Psoriasis Treatment Market Revenue (US$ Mn) Comparison by Country (2016-2032)
- Table 81: Eastern Europe Psoriasis Treatment Market Market Revenue (US$ Mn) (2016-2032)
- Table 82: Eastern Europe Psoriasis Treatment Market Market Revenue (US$ Mn) Comparison by Country (2016-2032)
- Table 83: Eastern Europe Psoriasis Treatment Market Market Revenue (US$ Mn) Comparison by Drug Class (2016-2032)
- Table 84: Eastern Europe Psoriasis Treatment Market Market Revenue (US$ Mn) Comparison by Treatment Type (2016-2032)
- Table 85: Eastern Europe Psoriasis Treatment Market Market Revenue (US$ Mn) Comparison by Type (2016-2032)
- Table 86: Eastern Europe Psoriasis Treatment Market Market Revenue (US$ Mn) Comparison by Route of Administration (2016-2032)
- Table 87: Eastern Europe Psoriasis Treatment Market Market Revenue (US$ Mn) Comparison by Distribution Channel (2016-2032)
- Table 88: Eastern Europe Psoriasis Treatment Market Market Y-o-Y Growth Rate Comparison by Country (2016-2032)
- Table 89: Eastern Europe Psoriasis Treatment Market Market Y-o-Y Growth Rate Comparison by Drug Class (2016-2032)
- Table 90: Eastern Europe Psoriasis Treatment Market Market Y-o-Y Growth Rate Comparison by Treatment Type (2016-2032)
- Table 91: Eastern Europe Psoriasis Treatment Market Market Y-o-Y Growth Rate Comparison by Type (2016-2032)
- Table 92: Eastern Europe Psoriasis Treatment Market Market Y-o-Y Growth Rate Comparison by Route of Administration (2016-2032)
- Table 93: Eastern Europe Psoriasis Treatment Market Market Y-o-Y Growth Rate Comparison by Distribution Channel (2016-2032)
- Table 94: Eastern Europe Psoriasis Treatment Market Market Share Comparison by Country (2016-2032)
- Table 95: Eastern Europe Psoriasis Treatment Market Market Share Comparison by Drug Class (2016-2032)
- Table 96: Eastern Europe Psoriasis Treatment Market Market Share Comparison by Treatment Type (2016-2032)
- Table 97: Eastern Europe Psoriasis Treatment Market Market Share Comparison by Type (2016-2032)
- Table 98: Eastern Europe Psoriasis Treatment Market Market Share Comparison by Route of Administration (2016-2032)
- Table 99: Eastern Europe Psoriasis Treatment Market Market Share Comparison by Distribution Channel (2016-2032)
- Table 100: APAC Psoriasis Treatment Market Market Comparison by Drug Class (2016-2032)
- Table 101: APAC Psoriasis Treatment Market Market Comparison by Treatment Type (2016-2032)
- Table 102: APAC Psoriasis Treatment Market Market Comparison by Type (2016-2032)
- Table 103: APAC Psoriasis Treatment Market Market Comparison by Route of Administration (2016-2032)
- Table 104: APAC Psoriasis Treatment Market Market Comparison by Distribution Channel (2016-2032)
- Table 105: APAC Psoriasis Treatment Market Revenue (US$ Mn) Comparison by Country (2016-2032)
- Table 106: APAC Psoriasis Treatment Market Market Revenue (US$ Mn) (2016-2032)
- Table 107: APAC Psoriasis Treatment Market Market Revenue (US$ Mn) Comparison by Country (2016-2032)
- Table 108: APAC Psoriasis Treatment Market Market Revenue (US$ Mn) Comparison by Drug Class (2016-2032)
- Table 109: APAC Psoriasis Treatment Market Market Revenue (US$ Mn) Comparison by Treatment Type (2016-2032)
- Table 110: APAC Psoriasis Treatment Market Market Revenue (US$ Mn) Comparison by Type (2016-2032)
- Table 111: APAC Psoriasis Treatment Market Market Revenue (US$ Mn) Comparison by Route of Administration (2016-2032)
- Table 112: APAC Psoriasis Treatment Market Market Revenue (US$ Mn) Comparison by Distribution Channel (2016-2032)
- Table 113: APAC Psoriasis Treatment Market Market Y-o-Y Growth Rate Comparison by Country (2016-2032)
- Table 114: APAC Psoriasis Treatment Market Market Y-o-Y Growth Rate Comparison by Drug Class (2016-2032)
- Table 115: APAC Psoriasis Treatment Market Market Y-o-Y Growth Rate Comparison by Treatment Type (2016-2032)
- Table 116: APAC Psoriasis Treatment Market Market Y-o-Y Growth Rate Comparison by Type (2016-2032)
- Table 117: APAC Psoriasis Treatment Market Market Y-o-Y Growth Rate Comparison by Route of Administration (2016-2032)
- Table 118: APAC Psoriasis Treatment Market Market Y-o-Y Growth Rate Comparison by Distribution Channel (2016-2032)
- Table 119: APAC Psoriasis Treatment Market Market Share Comparison by Country (2016-2032)
- Table 120: APAC Psoriasis Treatment Market Market Share Comparison by Drug Class (2016-2032)
- Table 121: APAC Psoriasis Treatment Market Market Share Comparison by Treatment Type (2016-2032)
- Table 122: APAC Psoriasis Treatment Market Market Share Comparison by Type (2016-2032)
- Table 123: APAC Psoriasis Treatment Market Market Share Comparison by Route of Administration (2016-2032)
- Table 124: APAC Psoriasis Treatment Market Market Share Comparison by Distribution Channel (2016-2032)
- Table 125: Latin America Psoriasis Treatment Market Market Comparison by Drug Class (2016-2032)
- Table 126: Latin America Psoriasis Treatment Market Market Comparison by Treatment Type (2016-2032)
- Table 127: Latin America Psoriasis Treatment Market Market Comparison by Type (2016-2032)
- Table 128: Latin America Psoriasis Treatment Market Market Comparison by Route of Administration (2016-2032)
- Table 129: Latin America Psoriasis Treatment Market Market Comparison by Distribution Channel (2016-2032)
- Table 130: Latin America Psoriasis Treatment Market Revenue (US$ Mn) Comparison by Country (2016-2032)
- Table 131: Latin America Psoriasis Treatment Market Market Revenue (US$ Mn) (2016-2032)
- Table 132: Latin America Psoriasis Treatment Market Market Revenue (US$ Mn) Comparison by Country (2016-2032)
- Table 133: Latin America Psoriasis Treatment Market Market Revenue (US$ Mn) Comparison by Drug Class (2016-2032)
- Table 134: Latin America Psoriasis Treatment Market Market Revenue (US$ Mn) Comparison by Treatment Type (2016-2032)
- Table 135: Latin America Psoriasis Treatment Market Market Revenue (US$ Mn) Comparison by Type (2016-2032)
- Table 136: Latin America Psoriasis Treatment Market Market Revenue (US$ Mn) Comparison by Route of Administration (2016-2032)
- Table 137: Latin America Psoriasis Treatment Market Market Revenue (US$ Mn) Comparison by Distribution Channel (2016-2032)
- Table 138: Latin America Psoriasis Treatment Market Market Y-o-Y Growth Rate Comparison by Country (2016-2032)
- Table 139: Latin America Psoriasis Treatment Market Market Y-o-Y Growth Rate Comparison by Drug Class (2016-2032)
- Table 140: Latin America Psoriasis Treatment Market Market Y-o-Y Growth Rate Comparison by Treatment Type (2016-2032)
- Table 141: Latin America Psoriasis Treatment Market Market Y-o-Y Growth Rate Comparison by Type (2016-2032)
- Table 142: Latin America Psoriasis Treatment Market Market Y-o-Y Growth Rate Comparison by Route of Administration (2016-2032)
- Table 143: Latin America Psoriasis Treatment Market Market Y-o-Y Growth Rate Comparison by Distribution Channel (2016-2032)
- Table 144: Latin America Psoriasis Treatment Market Market Share Comparison by Country (2016-2032)
- Table 145: Latin America Psoriasis Treatment Market Market Share Comparison by Drug Class (2016-2032)
- Table 146: Latin America Psoriasis Treatment Market Market Share Comparison by Treatment Type (2016-2032)
- Table 147: Latin America Psoriasis Treatment Market Market Share Comparison by Type (2016-2032)
- Table 148: Latin America Psoriasis Treatment Market Market Share Comparison by Route of Administration (2016-2032)
- Table 149: Latin America Psoriasis Treatment Market Market Share Comparison by Distribution Channel (2016-2032)
- Table 150: Middle East & Africa Psoriasis Treatment Market Market Comparison by Drug Class (2016-2032)
- Table 151: Middle East & Africa Psoriasis Treatment Market Market Comparison by Treatment Type (2016-2032)
- Table 152: Middle East & Africa Psoriasis Treatment Market Market Comparison by Type (2016-2032)
- Table 153: Middle East & Africa Psoriasis Treatment Market Market Comparison by Route of Administration (2016-2032)
- Table 154: Middle East & Africa Psoriasis Treatment Market Market Comparison by Distribution Channel (2016-2032)
- Table 155: Middle East & Africa Psoriasis Treatment Market Revenue (US$ Mn) Comparison by Country (2016-2032)
- Table 156: Middle East & Africa Psoriasis Treatment Market Market Revenue (US$ Mn) (2016-2032)
- Table 157: Middle East & Africa Psoriasis Treatment Market Market Revenue (US$ Mn) Comparison by Country (2016-2032)
- Table 158: Middle East & Africa Psoriasis Treatment Market Market Revenue (US$ Mn) Comparison by Drug Class (2016-2032)
- Table 159: Middle East & Africa Psoriasis Treatment Market Market Revenue (US$ Mn) Comparison by Treatment Type (2016-2032)
- Table 160: Middle East & Africa Psoriasis Treatment Market Market Revenue (US$ Mn) Comparison by Type (2016-2032)
- Table 161: Middle East & Africa Psoriasis Treatment Market Market Revenue (US$ Mn) Comparison by Route of Administration (2016-2032)
- Table 162: Middle East & Africa Psoriasis Treatment Market Market Revenue (US$ Mn) Comparison by Distribution Channel (2016-2032)
- Table 163: Middle East & Africa Psoriasis Treatment Market Market Y-o-Y Growth Rate Comparison by Country (2016-2032)
- Table 164: Middle East & Africa Psoriasis Treatment Market Market Y-o-Y Growth Rate Comparison by Drug Class (2016-2032)
- Table 165: Middle East & Africa Psoriasis Treatment Market Market Y-o-Y Growth Rate Comparison by Treatment Type (2016-2032)
- Table 166: Middle East & Africa Psoriasis Treatment Market Market Y-o-Y Growth Rate Comparison by Type (2016-2032)
- Table 167: Middle East & Africa Psoriasis Treatment Market Market Y-o-Y Growth Rate Comparison by Route of Administration (2016-2032)
- Table 168: Middle East & Africa Psoriasis Treatment Market Market Y-o-Y Growth Rate Comparison by Distribution Channel (2016-2032)
- Table 169: Middle East & Africa Psoriasis Treatment Market Market Share Comparison by Country (2016-2032)
- Table 170: Middle East & Africa Psoriasis Treatment Market Market Share Comparison by Drug Class (2016-2032)
- Table 171: Middle East & Africa Psoriasis Treatment Market Market Share Comparison by Treatment Type (2016-2032)
- Table 172: Middle East & Africa Psoriasis Treatment Market Market Share Comparison by Type (2016-2032)
- Table 173: Middle East & Africa Psoriasis Treatment Market Market Share Comparison by Route of Administration (2016-2032)
- Table 174: Middle East & Africa Psoriasis Treatment Market Market Share Comparison by Distribution Channel (2016-2032)
- 1. Executive Summary
-
- Johnson & Johnson Services, Inc.
- Pfizer Inc.
- AbbVie Inc.
- Novartis AG
- LEO Pharma A/S
- Merck & Co., Inc.
- UCB S.A.
- Sun Pharmaceutical Industries Ltd.
- Amgen Inc.
- Eli Lilly and Company
- Evelo Biosciences, Inc.
Our Clients


View Our Licence Options
