
Pro Av (Audio Visual) Market By Type (Products, Services), By Application (Entertainment, Hospitality, Corporate, Transportation, Other), By Distribution Channel (Direct sales, Distributors), By Region And Companies - Industry Segment Outlook, Market Assessment, Competition Scenario, Trends, And Forecast 2023-2032
-
40550
-
Aug 2023
-
137
-


-
This report was compiled by Vishwa Gaul Vishwa is an experienced market research and consulting professional with over 8 years of expertise in the ICT industry, contributing to over 700 reports across telecommunications, software, hardware, and digital solutions. Correspondence Team Lead- ICT Linkedin | Detailed Market research Methodology Our methodology involves a mix of primary research, including interviews with leading mental health experts, and secondary research from reputable medical journals and databases. View Detailed Methodology Page
-
Quick Navigation
Report Overview
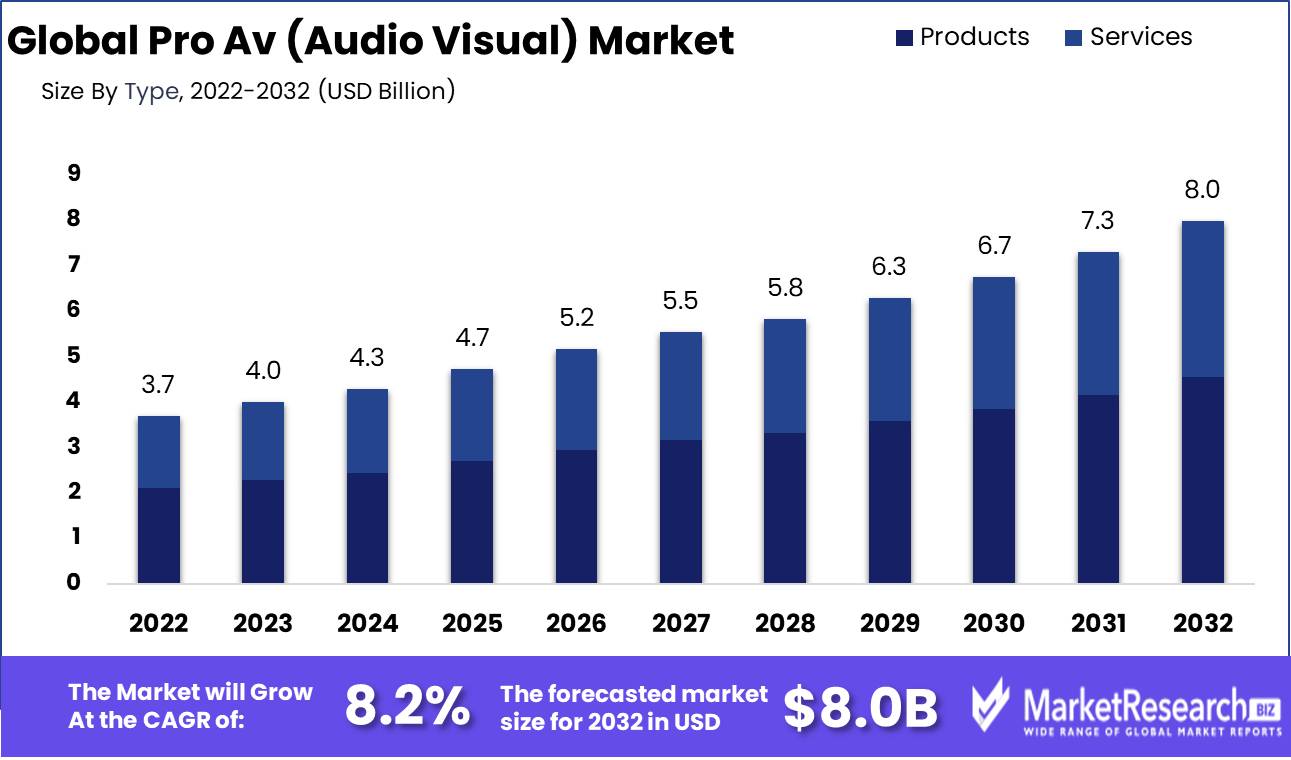
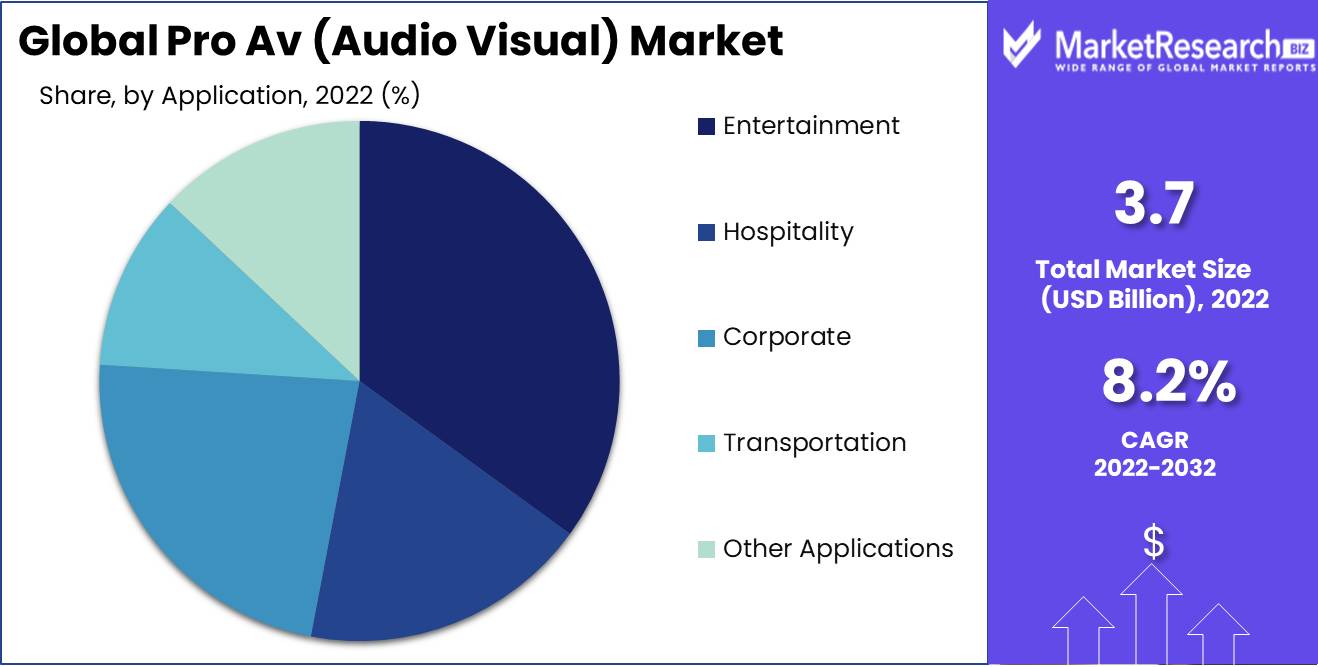
Pro Av (Audio Visual) Market size is expected to be worth around USD 8.0 Bn by 2032 from USD 3.7 Bn in 2022, growing at a CAGR of 8.2% during the forecast period from 2023 to 2032.
The pro AV (audio visual) market, characterized by its ability to enhance communication and deliver immersive experiences, is experiencing significant growth. It encompasses a wide range of devices and services that are specifically designed for the delivery of high-quality audio and video content in professional settings. This market caters to a wide range of sectors including entertainment, education, corporate, retail, healthcare, and others. The primary objective of the market is to enhance communication and deliver engaging user experiences.
The capacity of the pro AV (audio visual) market to captivate and effectively convey information is of paramount importance. Engaging with consumers, employees, and stakeholders is of paramount importance for businesses. The pro AV (audio visual) market offers numerous advantages. Firstly, it provides a visual medium that is readily comprehensible and memorable. Organizations have the ability to create compelling presentations, advertisements, and training materials utilizing this tool. Furthermore, the provision of clear and high-quality audio enhances the efficacy of communication. Ultimately, this capability enables firms to effectively respond to dynamic shifts in consumer demands and preferences, exhibiting adaptability and expandability.
Significant advancements have transpired within the pro AV (audio visual) market. High-resolution displays, such as LED and OLED screens, represent a significant technological innovation. These displays offer vibrant colors, sharp images, and strong contrast, enabling businesses to generate exceptional visual experiences. Another invention in the field of audio technology is immersive sound systems. The integration of 3D audio technology and Dolby Atmos has significantly enhanced the realism and immersion of sound experiences.
Significant investments and integration of pro AV (audio visual) technology into various sectors have been observed. In order to cultivate interactive and engaging educational settings, educational institutions are allocating resources towards the integration of audiovisual (AV) technologies. The healthcare industry has also implemented professional audio-visual (AV) solutions to enhance patient care, training, and diagnostics. Retailers are employing audiovisual (AV) technologies as a means to actively involve customers and enhance sales performance.
Like any other technological advancement, the pro AV (audio visual) market gives rise to ethical concerns. The topic of privacy presents a significant concern. The widespread availability of audio and visual recording devices has raised concerns regarding potential infringements on privacy. The topic of ethical autonomous vehicle (AV) advertising presents itself as a significant concern. It is imperative for marketers to demonstrate a high level of regard for the limitations of their target audience and refrain from engaging in deceptive practices.
Driving factors
Display Technologies
The rapid advancements in display technologies have revolutionized the pro AV (audio visual) market. High-definition screens, ultra-high-definition displays, and flexible screens have become increasingly common, providing unparalleled visual experiences. These advancements have not only enhanced the quality of presentations, performances, and exhibitions but have also enabled businesses to enhance their branding and communication strategies. The adoption of LED lighting and OLED technology has played a significant role in transforming the way visual experiences are perceived.
Audio Technologies
Alongside visual advancements, the pro AV (audio visual) market has also witnessed remarkable advancements in audio technologies. High-quality sound systems, immersive audio experiences, and cutting-edge audio devices have become crucial components in delivering exceptional auditory experiences. Technological advancements have led to the development of advanced audio equipment, such as surround sound systems, soundbars, and portable bluetooth speakers, which have revolutionized the audio-visual landscape.
Events and Entertainment Industries
The pro AV (audio visual) market has experienced tremendous growth due to the increasing adoption of audio-visual technologies in the events and entertainment industries. Events such as conferences, exhibitions, concerts, and trade shows heavily rely on cutting-edge AV equipment to deliver captivating experiences to attendees. Event organizers have recognized the importance of audio-visual technologies in creating memorable and impactful events. From large LED video walls to advanced sound systems, these technologies enhance the immersive experience for participants, creating a lasting impression.
Implications for Businesses and Consumers
The growing demand for enhanced visual and audio experiences, driven by advancements in display and audio technologies, as well as the increasing adoption in events and entertainment industries, has significant implications for businesses and consumers alike. Businesses operating in the pro AV (audio visual) market have a tremendous opportunity to expand their offerings and cater to the evolving needs of the industry. By staying at the forefront of technological advancements, they can provide innovative solutions that fulfill the demands for enhanced visual and audio experiences. This can lead to increased revenue, brand recognition, and customer loyalty.
Restraining Factors
Budget Constraints
One of the biggest challenges faced by companies involved in the pro AV (audio visual) market is budget constraints. Implementing cutting-edge audio visual solutions requires substantial investment in equipment, installation, and post-installation support. Many businesses, particularly those operating on tight budgets, often struggle to allocate adequate funds for comprehensive audio visual solutions. Costly hardware, software, and licensing fees can pose a significant obstacle for organizations looking to integrate pro AV systems into their infrastructure.
Compatibility and Integration Challenges
Another significant restraining factor in the pro AV (audio visual) market is the challenge of compatibility and integration. The market is flooded with a wide range of audio visual products offered by different manufacturers, each with their own unique specifications and protocols. This heterogeneity makes compatibility and seamless integration a highly complex task. Integrating new technologies with existing infrastructure can be a daunting process, often requiring additional resources, time, and expertise. For organizations seeking to implement pro AV systems, compatibility issues can result in delays, increased costs, and compromised functionality.
Installation and Maintenance Limitations
When it comes to implementing pro AV audio visual solutions, installation and ongoing maintenance present their own set of limitations. The installation process involves intricate wiring, routing, and configuration, which can be time-consuming and require specialized expertise. Inadequate planning and execution can lead to technical issues, poor performance, and lengthy downtime. Furthermore, the constantly evolving nature of technology introduces a challenge in terms of system updates and maintenance. New software updates, hardware components, and emerging standards all require regular attention and support.
Type Analysis
The pro AV audiovisual market is a thriving industry, and within this market, the Products Segment dominates. This segment comprises various devices and equipment used for professional audio and visual purposes. It includes products such as speakers, microphones, projectors, and displays.
Understanding consumer trends and behavior towards the Products Segment is crucial in assessing its potential growth prospects. Consumers today are increasingly relying on audiovisual solutions to enhance their communication and entertainment experiences. With advancements in technology, consumers expect high-quality audio and visuals that provide immersive and engaging experiences. This shift in consumer expectations has led to a surge in demand for products in the pro AV audiovisual market.
Application Analysis
Within the pro AV audiovisual market, the Entertainment Segment holds a dominant position. This segment encompasses various audiovisual solutions used in the entertainment industry, including sound systems, lighting equipment, and visual displays.
Consumer trends and behavior towards the Entertainment Segment also contribute to its strong growth. Consumers today are seeking unique and engaging entertainment experiences. As a result, entertainment venues, such as concert halls, movie theaters, and theme parks, are investing in high-quality audiovisual solutions to create memorable experiences for their visitors. Additionally, consumers are increasingly adopting audiovisual equipment for personal entertainment purposes, such as home theaters and gaming setups.
Distribution Channel Analysis
In the pro AV audiovisual market, the Direct Sales Segment holds a dominant position as the primary distribution channel. Direct sales involve selling products directly to end-users without involving intermediaries such as retailers or wholesalers.
Consumer trends and behavior also influence the dominance of the Direct Sales Segment in the pro AV audiovisual market. With the rise of e-commerce platforms and online marketplaces, consumers are increasingly opting for direct purchases from manufacturers. This allows them to access a wider range of products, compare prices, and benefit from manufacturer warranties and after-sales support. The Direct Sales Segment is anticipated to register the fastest growth rate over the forthcoming years due to various factors.
Key Market Segments
By Type
- Products
- Services
By Application
- Entertainment
- Hospitality
- Corporate
- Transportation
- Other Applications
By Distribution Channel
- Direct sales
- Distributors
Growth Opportunity
Integration of Artificial Intelligence
With the advent of artificial intelligence (AI), the pro AV (audio visual) market has witnessed a significant transformation. Integrating AI into AV display and audio solutions offers unique opportunities for customization, personalization, and enhanced user experiences. Imagine attending a conference where AI-powered cameras automatically adjust and frame the speakers, delivering a seamless and captivating visual experience. Furthermore, AI-driven audio systems can tailor the audio output to the specific needs and preferences of the audience, ensuring optimal clarity and quality.
Diversification into Virtual and Augmented Reality
As the boundaries between physical and virtual worlds blur, there is an increasing demand for immersive experiences that go beyond what traditional AV displays can offer. Virtual Reality (VR) and Augmented Reality (AR) technologies present lucrative growth opportunities for the pro AV (audio visual) market. In addition to creating immersive environments for gaming and entertainment, VR and AR have found valuable applications in industries such as education, healthcare, and engineering.
Embracing Sustainable Practices
In an era where sustainability and environmental consciousness are of utmost importance, the pro AV (audio visual) market has the potential to become a frontrunner in adopting green practices. By investing in energy-efficient solutions, recyclable materials, and responsible manufacturing processes, the industry can position itself as an environmentally responsible choice for businesses and consumers alike. Pro AV audio visual companies can explore the use of renewable energy sources, such as solar panels, to power their systems, reducing both their carbon footprint and operational costs.
Latest Trends
LED and OLED Displays
LED (Light Emitting Diode) and OLED (Organic Light Emitting Diode) displays have revolutionized the way we interact with visual content. These display technologies offer enhanced brightness, contrast, and color accuracy, providing a stunning visual experience for viewers. LED displays, in particular, have gained significant popularity in various sectors, including retail, advertising, and hospitality. Their versatility and flexibility allow for seamless integration into different environments, making them a top choice for modern audio visual installations.
High-Resolution and Large-Format Displays
As technology progresses, higher resolution displays have become the norm. Businesses and consumers alike crave visually stunning content with exceptional clarity and detail. This demand has driven the development of high-resolution displays, such as 4K and 8K, which offer four and eight times the pixel count of Full HD, respectively. The rise of large-format displays has transformed the audio visual landscape. From video walls in control rooms to giant LED screens in stadiums, these displays provide an immersive viewing experience, making content more engaging and impactful.
Immersive and Projection Mapping Technologies
Immersive technologies, such as virtual reality (VR) and augmented reality (AR), are disrupting the pro AV audio visual industry. They offer a unique and interactive way for audiences to engage with content, whether it's exploring a virtual world or overlaying digital information onto real-life environments. Projection mapping is another innovative technique that has gained traction in recent years. By using sophisticated software to align projected images with irregular surfaces, this technology transforms ordinary objects into dynamic display surfaces.
Audio and Visual Experiences
In today's audio visual landscape, the integration of audio and visual experiences is paramount. High-quality sound enhances the overall immersion and impact of visual content, creating a multisensory experience that captivates audiences. As businesses and institutions increasingly invest in audio visual solutions, they look for seamless integration of audio and visual components, ensuring a coherent and impactful presentation. Advancements in audio technology, such as spatial audio systems and immersive soundscapes, contribute to the creation of fully immersive environments.
Regional Analysis
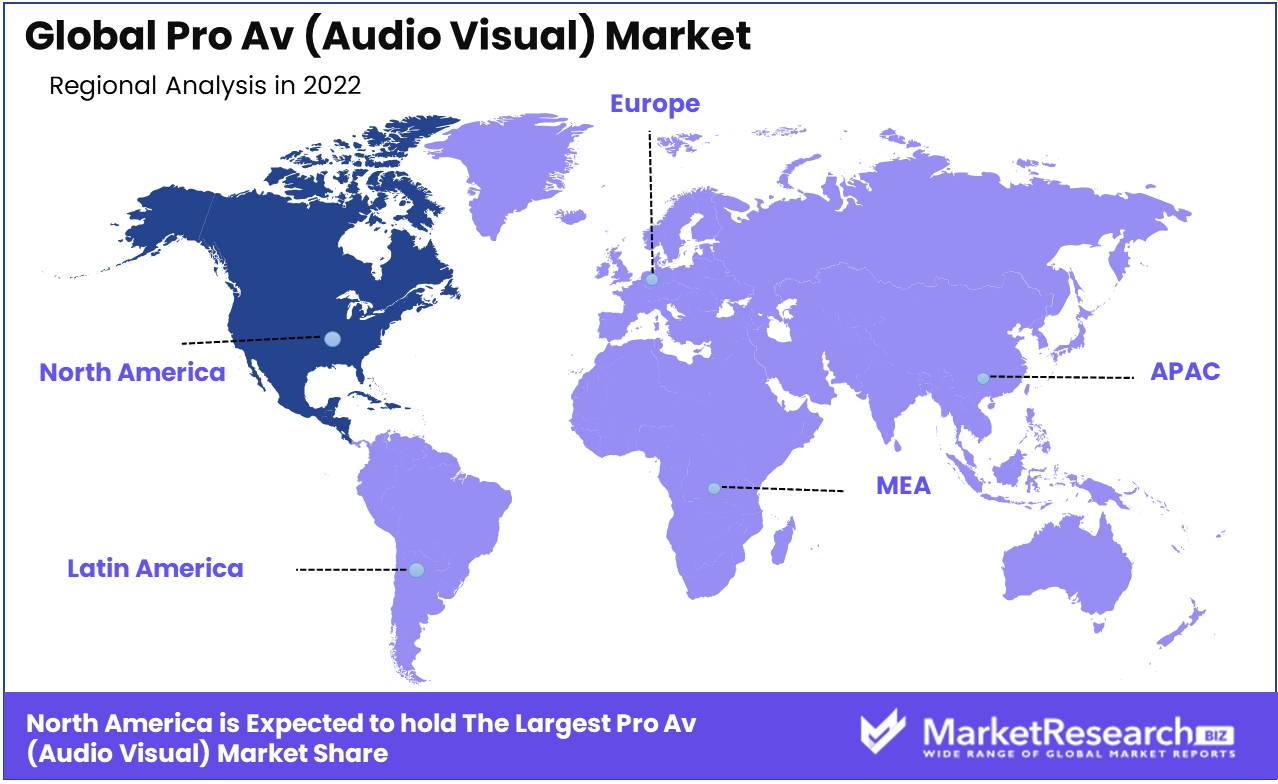
North America Region Dominates the Pro AV (Audio Visual) Market. In today's fast-paced digital landscape, the market has gained immense popularity and has become a significant part of various industries. From corporate events to educational institutions, the demand for cutting-edge audiovisual technology has soared. However, when it comes to ruling this market, one region stands out above the rest – North America. With its robust infrastructure, technological advancements, and thriving economy, North America has established itself as the leader in the Pro AV industry.
North America's dominance in the Pro AV market can be attributed to several key factors. Firstly, the region boasts a strong and well-developed infrastructure. With state-of-the-art venues, exhibition centers, and conference halls, North America offers top-notch facilities that cater to the increasing demand for high-quality audiovisual experiences. This infrastructure advantage gives North America a competitive edge over other regions.
The technological advancements in North America have played a vital role in its dominance in the Pro AV market. The region is home to many renowned technology companies, constantly pushing the boundaries of innovation. North America's thriving economy has fostered a conducive environment for the Pro AV industry to flourish. The region's stable economic conditions, coupled with a strong consumer base, create ample opportunities for growth and expansion. This economic stability allows businesses to invest in advanced audiovisual solutions, driving the demand for Pro AV products and services in North America.
North America in the Pro AV market extends beyond domestic boundaries. In fact, the region has established itself as a global leader, exporting its technological expertise and audiovisual solutions to markets worldwide. North American companies have successfully penetrated international markets, leveraging their superior products and extensive industry knowledge. This global reach further solidifies North America's position as the dominant force in the Pro AV industry.
Key Regions and Countries
North America
- US
- Canada
- Mexico
Western Europe
- Germany
- France
- The UK
- Spain
- Italy
- Portugal
- Ireland
- Austria
- Switzerland
- Benelux
- Nordic
- Rest of Western Europe
Eastern Europe
- Russia
- Poland
- The Czech Republic
- Greece
- Rest of Eastern Europe
APAC
- China
- Japan
- South Korea
- India
- Australia & New Zealand
- Indonesia
- Malaysia
- Philippines
- Singapore
- Thailand
- Vietnam
- Rest of APAC
Latin America
- Brazil
- Colombia
- Chile
- Argentina
- Costa Rica
- Rest of Latin America
Middle East & Africa
- Algeria
- Egypt
- Israel
- Kuwait
- Nigeria
- Saudi Arabia
- South Africa
- Turkey
- United Arab Emirates
- Rest of MEA
Key Players Analysis
In the fast-paced world of audio and visual technology, the pro AV (audio visual) market has seen significant growth over the years. From corporate events and conferences to entertainment venues and educational institutions, the demand for high-quality audio visual solutions has escalated. As businesses and organizations strive to create immersive and engaging experiences, the need for cutting-edge AV solutions has become paramount.
Sony, a household name in the consumer electronics industry, also has a strong presence in the pro AV (audio visual) market. Known for its exceptional picture and sound quality, Sony offers a diverse range of AV products and solutions. Whether it's high-resolution projectors, professional video cameras, or robust sound systems, Sony's offerings cater to various sectors, including broadcasting, surveillance, and live events.
Barco, a Belgian-based company, has gained a solid reputation for its state-of-the-art AV solutions. Specializing in large-scale visualization and collaboration technology, Barco provides cutting-edge projection systems, LED video walls, and collaborative software. Their products find extensive usage in arenas, cinemas, boardrooms, and command centers, providing stunning visuals and seamless collaboration experiences.
Crestron, a leading name in the pro AV (audio visual) market, is renowned for its integrated control and automation solutions. From simplifying audio video conferencing to managing complex multi-room audio systems, Crestron offers a comprehensive suite of products and technologies. Their proficiency in control systems, digital media, and room scheduling solutions has made them a preferred choice among businesses and institutions worldwide.
With a wide portfolio of AV solutions, Panasonic has established itself as a dominant player. From professional displays and projectors to advanced visual systems, their products are known for their reliability and performance. Panasonic's innovations also extend to immersive 3D projection mapping and interactive displays, transforming spaces into captivating environments.
Cisco, a multinational technology conglomerate, has made significant strides in the pro AV (audio visual) market. Their collaboration technologies enable seamless video conferencing, content sharing, and remote collaboration across diverse platforms. With their expertise in network infrastructure and unified communication solutions, Cisco has emerged as a key player in the AV industry.
Shure, a renowned manufacturer of professional audio equipment, has a significant presence. With a legacy spanning over 95 years, Shure offers an extensive range of microphones, wireless systems, and audio processors. Their products cater to live performances, conferencing, broadcasting, and recording studios, delivering exceptional sound quality and reliability.
Top Key Players in Pro Av (Audio Visual) Market
- Anixter Inc. (U.S.)
- Wesco (U.S.)
- AVI Systems (U.S.)
- AVI-SPL LLC (U.S.)
- Biamp Systems (U.S.)
- CCS Presentation Systems (U.S.)
Recent Development
In 2023, Crestron, a pioneer in control and automation, has entered the metaverse. A new range of pro AV gadgets for this new virtual environment stunned the AV market. The metaverse industry eagerly expects Crestron's cutting-edge technologies, which will transform audiovisual technology in this digital environment.
in 2022, Pioneering audiovisual brand JVC Professional Products aims to provide top-notch professional AV solutions. The company announced its ambitious Japanese pro AV production expansion. JVC's ambition to expand manufacturing reflects its commitment to customer satisfaction and the growing high-end audiovisual sector. JVC Professional Products will dominate AV and beyond with this savvy approach.
In 2021, Google and Sony Professional Solutions are modernizing pro AV. This remarkable collaboration will build an enterprise audiovisual ecosystem. Sony's professional AV equipment knowledge with Google's innovation will build game-changing solutions that improve businesses' visual experiences and communication. Sony Professional Solutions and Google will pioneer business pro AV.
In 2020, Panasonic's Christie Digital Systems acquisition shook pro AV. Panasonic's move enhanced its position and opened new opportunities for providing cutting-edge audiovisual solutions to consumers, acknowledging Christie's exceptional professional AV track record. Christie's strong pro AV capabilities allowed Panasonic to expand its offerings in 2020 and beyond. Panasonic and Christie Digital Systems offer high-quality, high-performance pro AV products.
Report Scope:
Report Features Description Market Value (2022) USD 3.7 Bn Forecast Revenue (2032) USD 8.0 Bn CAGR (2023-2032) 8.2% Base Year for Estimation 2022 Historic Period 2016-2022 Forecast Period 2023-2032 Report Coverage Revenue Forecast, Market Dynamics, COVID-19 Impact, Competitive Landscape, Recent Developments Segments Covered By Type (Products, Services), By Application (Entertainment, Hospitality, Corporate, Transportation, Other Applications), By Distribution Channel (Direct sales, Distributors) Regional Analysis North America – The US, Canada, & Mexico; Western Europe – Germany, France, The UK, Spain, Italy, Portugal, Ireland, Austria, Switzerland, Benelux, Nordic, & Rest of Western Europe; Eastern Europe – Russia, Poland, The Czech Republic, Greece, & Rest of Eastern Europe; APAC – China, Japan, South Korea, India, Australia & New Zealand, Indonesia, Malaysia, Philippines, Singapore, Thailand, Vietnam, & Rest of APAC; Latin America – Brazil, Colombia, Chile, Argentina, Costa Rica, & Rest of Latin America; Middle East & Africa – Algeria, Egypt, Israel, Kuwait, Nigeria, Saudi Arabia, South Africa, Turkey, United Arab Emirates, & Rest of MEA Competitive Landscape Anixter Inc. (U.S.), Wesco (U.S.), AVI Systems (U.S.), AVI-SPL LLC (U.S.), Biamp Systems (U.S.), CCS Presentation Systems (U.S.) Customization Scope Customization for segments, region/country-level will be provided. Moreover, additional customization can be done based on the requirements. Purchase Options We have three licenses to opt for: Single User License, Multi-User License (Up to 5 Users), Corporate Use License (Unlimited User and Printable PDF) -
- 1. Executive Summary
- 1.1. Definition
- 1.2. Taxonomy
- 1.3. Research Scope
- 1.4. Key Analysis
- 1.5. Key Findings by Major Segments
- 1.6. Top strategies by Major Players
- 2. Global Pro Av (Audio Visual) Market Overview
- 2.1. Pro Av (Audio Visual) Market Dynamics
- 2.1.1. Drivers
- 2.1.2. Opportunities
- 2.1.3. Restraints
- 2.1.4. Challenges
- 2.2. Macro-economic Factors
- 2.3. Regulatory Framework
- 2.4. Market Investment Feasibility Index
- 2.5. PEST Analysis
- 2.6. PORTER’S Five Force Analysis
- 2.7. Drivers & Restraints Impact Analysis
- 2.8. Industry Chain Analysis
- 2.9. Cost Structure Analysis
- 2.10. Marketing Strategy
- 2.11. Russia-Ukraine War Impact Analysis
- 2.12. Opportunity Map Analysis
- 2.13. Market Competition Scenario Analysis
- 2.14. Product Life Cycle Analysis
- 2.15. Opportunity Orbits
- 2.16. Manufacturer Intensity Map
- 2.17. Major Companies sales by Value & Volume
- 2.1. Pro Av (Audio Visual) Market Dynamics
- 3. Global Pro Av (Audio Visual) Market Analysis, Opportunity and Forecast, 2016-2032
- 3.1. Global Pro Av (Audio Visual) Market Analysis, 2016-2021
- 3.2. Global Pro Av (Audio Visual) Market Opportunity and Forecast, 2023-2032
- 3.3. Global Pro Av (Audio Visual) Market Analysis, Opportunity and Forecast, By By Type, 2016-2032
- 3.3.1. Global Pro Av (Audio Visual) Market Analysis by By Type: Introduction
- 3.3.2. Market Size Absolute $ Opportunity Analysis and Forecast, By By Type, 2016-2032
- 3.3.3. Products
- 3.3.4. Services
- 3.4. Global Pro Av (Audio Visual) Market Analysis, Opportunity and Forecast, By By Application, 2016-2032
- 3.4.1. Global Pro Av (Audio Visual) Market Analysis by By Application: Introduction
- 3.4.2. Market Size Absolute $ Opportunity Analysis and Forecast, By By Application, 2016-2032
- 3.4.3. Entertainment
- 3.4.4. Hospitality
- 3.4.5. Corporate
- 3.4.6. Transportation
- 3.4.7. Other Applications
- 3.5. Global Pro Av (Audio Visual) Market Analysis, Opportunity and Forecast, By By Distribution Channel, 2016-2032
- 3.5.1. Global Pro Av (Audio Visual) Market Analysis by By Distribution Channel: Introduction
- 3.5.2. Market Size Absolute $ Opportunity Analysis and Forecast, By By Distribution Channel, 2016-2032
- 3.5.3. Direct sales
- 3.5.4. Distributors
- 4. North America Pro Av (Audio Visual) Market Analysis, Opportunity and Forecast, 2016-2032
- 4.1. North America Pro Av (Audio Visual) Market Analysis, 2016-2021
- 4.2. North America Pro Av (Audio Visual) Market Opportunity and Forecast, 2023-2032
- 4.3. North America Pro Av (Audio Visual) Market Analysis, Opportunity and Forecast, By By Type, 2016-2032
- 4.3.1. North America Pro Av (Audio Visual) Market Analysis by By Type: Introduction
- 4.3.2. Market Size Absolute $ Opportunity Analysis and Forecast, By By Type, 2016-2032
- 4.3.3. Products
- 4.3.4. Services
- 4.4. North America Pro Av (Audio Visual) Market Analysis, Opportunity and Forecast, By By Application, 2016-2032
- 4.4.1. North America Pro Av (Audio Visual) Market Analysis by By Application: Introduction
- 4.4.2. Market Size Absolute $ Opportunity Analysis and Forecast, By By Application, 2016-2032
- 4.4.3. Entertainment
- 4.4.4. Hospitality
- 4.4.5. Corporate
- 4.4.6. Transportation
- 4.4.7. Other Applications
- 4.5. North America Pro Av (Audio Visual) Market Analysis, Opportunity and Forecast, By By Distribution Channel, 2016-2032
- 4.5.1. North America Pro Av (Audio Visual) Market Analysis by By Distribution Channel: Introduction
- 4.5.2. Market Size Absolute $ Opportunity Analysis and Forecast, By By Distribution Channel, 2016-2032
- 4.5.3. Direct sales
- 4.5.4. Distributors
- 4.6. North America Pro Av (Audio Visual) Market Analysis, Opportunity and Forecast, By Country , 2016-2032
- 4.6.1. North America Pro Av (Audio Visual) Market Analysis by Country : Introduction
- 4.6.2. Market Size Absolute $ Opportunity Analysis and Forecast, Country , 2016-2032
- 4.6.2.1. The US
- 4.6.2.2. Canada
- 4.6.2.3. Mexico
- 5. Western Europe Pro Av (Audio Visual) Market Analysis, Opportunity and Forecast, 2016-2032
- 5.1. Western Europe Pro Av (Audio Visual) Market Analysis, 2016-2021
- 5.2. Western Europe Pro Av (Audio Visual) Market Opportunity and Forecast, 2023-2032
- 5.3. Western Europe Pro Av (Audio Visual) Market Analysis, Opportunity and Forecast, By By Type, 2016-2032
- 5.3.1. Western Europe Pro Av (Audio Visual) Market Analysis by By Type: Introduction
- 5.3.2. Market Size Absolute $ Opportunity Analysis and Forecast, By By Type, 2016-2032
- 5.3.3. Products
- 5.3.4. Services
- 5.4. Western Europe Pro Av (Audio Visual) Market Analysis, Opportunity and Forecast, By By Application, 2016-2032
- 5.4.1. Western Europe Pro Av (Audio Visual) Market Analysis by By Application: Introduction
- 5.4.2. Market Size Absolute $ Opportunity Analysis and Forecast, By By Application, 2016-2032
- 5.4.3. Entertainment
- 5.4.4. Hospitality
- 5.4.5. Corporate
- 5.4.6. Transportation
- 5.4.7. Other Applications
- 5.5. Western Europe Pro Av (Audio Visual) Market Analysis, Opportunity and Forecast, By By Distribution Channel, 2016-2032
- 5.5.1. Western Europe Pro Av (Audio Visual) Market Analysis by By Distribution Channel: Introduction
- 5.5.2. Market Size Absolute $ Opportunity Analysis and Forecast, By By Distribution Channel, 2016-2032
- 5.5.3. Direct sales
- 5.5.4. Distributors
- 5.6. Western Europe Pro Av (Audio Visual) Market Analysis, Opportunity and Forecast, By Country , 2016-2032
- 5.6.1. Western Europe Pro Av (Audio Visual) Market Analysis by Country : Introduction
- 5.6.2. Market Size Absolute $ Opportunity Analysis and Forecast, Country , 2016-2032
- 5.6.2.1. Germany
- 5.6.2.2. France
- 5.6.2.3. The UK
- 5.6.2.4. Spain
- 5.6.2.5. Italy
- 5.6.2.6. Portugal
- 5.6.2.7. Ireland
- 5.6.2.8. Austria
- 5.6.2.9. Switzerland
- 5.6.2.10. Benelux
- 5.6.2.11. Nordic
- 5.6.2.12. Rest of Western Europe
- 6. Eastern Europe Pro Av (Audio Visual) Market Analysis, Opportunity and Forecast, 2016-2032
- 6.1. Eastern Europe Pro Av (Audio Visual) Market Analysis, 2016-2021
- 6.2. Eastern Europe Pro Av (Audio Visual) Market Opportunity and Forecast, 2023-2032
- 6.3. Eastern Europe Pro Av (Audio Visual) Market Analysis, Opportunity and Forecast, By By Type, 2016-2032
- 6.3.1. Eastern Europe Pro Av (Audio Visual) Market Analysis by By Type: Introduction
- 6.3.2. Market Size Absolute $ Opportunity Analysis and Forecast, By By Type, 2016-2032
- 6.3.3. Products
- 6.3.4. Services
- 6.4. Eastern Europe Pro Av (Audio Visual) Market Analysis, Opportunity and Forecast, By By Application, 2016-2032
- 6.4.1. Eastern Europe Pro Av (Audio Visual) Market Analysis by By Application: Introduction
- 6.4.2. Market Size Absolute $ Opportunity Analysis and Forecast, By By Application, 2016-2032
- 6.4.3. Entertainment
- 6.4.4. Hospitality
- 6.4.5. Corporate
- 6.4.6. Transportation
- 6.4.7. Other Applications
- 6.5. Eastern Europe Pro Av (Audio Visual) Market Analysis, Opportunity and Forecast, By By Distribution Channel, 2016-2032
- 6.5.1. Eastern Europe Pro Av (Audio Visual) Market Analysis by By Distribution Channel: Introduction
- 6.5.2. Market Size Absolute $ Opportunity Analysis and Forecast, By By Distribution Channel, 2016-2032
- 6.5.3. Direct sales
- 6.5.4. Distributors
- 6.6. Eastern Europe Pro Av (Audio Visual) Market Analysis, Opportunity and Forecast, By Country , 2016-2032
- 6.6.1. Eastern Europe Pro Av (Audio Visual) Market Analysis by Country : Introduction
- 6.6.2. Market Size Absolute $ Opportunity Analysis and Forecast, Country , 2016-2032
- 6.6.2.1. Russia
- 6.6.2.2. Poland
- 6.6.2.3. The Czech Republic
- 6.6.2.4. Greece
- 6.6.2.5. Rest of Eastern Europe
- 7. APAC Pro Av (Audio Visual) Market Analysis, Opportunity and Forecast, 2016-2032
- 7.1. APAC Pro Av (Audio Visual) Market Analysis, 2016-2021
- 7.2. APAC Pro Av (Audio Visual) Market Opportunity and Forecast, 2023-2032
- 7.3. APAC Pro Av (Audio Visual) Market Analysis, Opportunity and Forecast, By By Type, 2016-2032
- 7.3.1. APAC Pro Av (Audio Visual) Market Analysis by By Type: Introduction
- 7.3.2. Market Size Absolute $ Opportunity Analysis and Forecast, By By Type, 2016-2032
- 7.3.3. Products
- 7.3.4. Services
- 7.4. APAC Pro Av (Audio Visual) Market Analysis, Opportunity and Forecast, By By Application, 2016-2032
- 7.4.1. APAC Pro Av (Audio Visual) Market Analysis by By Application: Introduction
- 7.4.2. Market Size Absolute $ Opportunity Analysis and Forecast, By By Application, 2016-2032
- 7.4.3. Entertainment
- 7.4.4. Hospitality
- 7.4.5. Corporate
- 7.4.6. Transportation
- 7.4.7. Other Applications
- 7.5. APAC Pro Av (Audio Visual) Market Analysis, Opportunity and Forecast, By By Distribution Channel, 2016-2032
- 7.5.1. APAC Pro Av (Audio Visual) Market Analysis by By Distribution Channel: Introduction
- 7.5.2. Market Size Absolute $ Opportunity Analysis and Forecast, By By Distribution Channel, 2016-2032
- 7.5.3. Direct sales
- 7.5.4. Distributors
- 7.6. APAC Pro Av (Audio Visual) Market Analysis, Opportunity and Forecast, By Country , 2016-2032
- 7.6.1. APAC Pro Av (Audio Visual) Market Analysis by Country : Introduction
- 7.6.2. Market Size Absolute $ Opportunity Analysis and Forecast, Country , 2016-2032
- 7.6.2.1. China
- 7.6.2.2. Japan
- 7.6.2.3. South Korea
- 7.6.2.4. India
- 7.6.2.5. Australia & New Zeland
- 7.6.2.6. Indonesia
- 7.6.2.7. Malaysia
- 7.6.2.8. Philippines
- 7.6.2.9. Singapore
- 7.6.2.10. Thailand
- 7.6.2.11. Vietnam
- 7.6.2.12. Rest of APAC
- 8. Latin America Pro Av (Audio Visual) Market Analysis, Opportunity and Forecast, 2016-2032
- 8.1. Latin America Pro Av (Audio Visual) Market Analysis, 2016-2021
- 8.2. Latin America Pro Av (Audio Visual) Market Opportunity and Forecast, 2023-2032
- 8.3. Latin America Pro Av (Audio Visual) Market Analysis, Opportunity and Forecast, By By Type, 2016-2032
- 8.3.1. Latin America Pro Av (Audio Visual) Market Analysis by By Type: Introduction
- 8.3.2. Market Size Absolute $ Opportunity Analysis and Forecast, By By Type, 2016-2032
- 8.3.3. Products
- 8.3.4. Services
- 8.4. Latin America Pro Av (Audio Visual) Market Analysis, Opportunity and Forecast, By By Application, 2016-2032
- 8.4.1. Latin America Pro Av (Audio Visual) Market Analysis by By Application: Introduction
- 8.4.2. Market Size Absolute $ Opportunity Analysis and Forecast, By By Application, 2016-2032
- 8.4.3. Entertainment
- 8.4.4. Hospitality
- 8.4.5. Corporate
- 8.4.6. Transportation
- 8.4.7. Other Applications
- 8.5. Latin America Pro Av (Audio Visual) Market Analysis, Opportunity and Forecast, By By Distribution Channel, 2016-2032
- 8.5.1. Latin America Pro Av (Audio Visual) Market Analysis by By Distribution Channel: Introduction
- 8.5.2. Market Size Absolute $ Opportunity Analysis and Forecast, By By Distribution Channel, 2016-2032
- 8.5.3. Direct sales
- 8.5.4. Distributors
- 8.6. Latin America Pro Av (Audio Visual) Market Analysis, Opportunity and Forecast, By Country , 2016-2032
- 8.6.1. Latin America Pro Av (Audio Visual) Market Analysis by Country : Introduction
- 8.6.2. Market Size Absolute $ Opportunity Analysis and Forecast, Country , 2016-2032
- 8.6.2.1. Brazil
- 8.6.2.2. Colombia
- 8.6.2.3. Chile
- 8.6.2.4. Argentina
- 8.6.2.5. Costa Rica
- 8.6.2.6. Rest of Latin America
- 9. Middle East & Africa Pro Av (Audio Visual) Market Analysis, Opportunity and Forecast, 2016-2032
- 9.1. Middle East & Africa Pro Av (Audio Visual) Market Analysis, 2016-2021
- 9.2. Middle East & Africa Pro Av (Audio Visual) Market Opportunity and Forecast, 2023-2032
- 9.3. Middle East & Africa Pro Av (Audio Visual) Market Analysis, Opportunity and Forecast, By By Type, 2016-2032
- 9.3.1. Middle East & Africa Pro Av (Audio Visual) Market Analysis by By Type: Introduction
- 9.3.2. Market Size Absolute $ Opportunity Analysis and Forecast, By By Type, 2016-2032
- 9.3.3. Products
- 9.3.4. Services
- 9.4. Middle East & Africa Pro Av (Audio Visual) Market Analysis, Opportunity and Forecast, By By Application, 2016-2032
- 9.4.1. Middle East & Africa Pro Av (Audio Visual) Market Analysis by By Application: Introduction
- 9.4.2. Market Size Absolute $ Opportunity Analysis and Forecast, By By Application, 2016-2032
- 9.4.3. Entertainment
- 9.4.4. Hospitality
- 9.4.5. Corporate
- 9.4.6. Transportation
- 9.4.7. Other Applications
- 9.5. Middle East & Africa Pro Av (Audio Visual) Market Analysis, Opportunity and Forecast, By By Distribution Channel, 2016-2032
- 9.5.1. Middle East & Africa Pro Av (Audio Visual) Market Analysis by By Distribution Channel: Introduction
- 9.5.2. Market Size Absolute $ Opportunity Analysis and Forecast, By By Distribution Channel, 2016-2032
- 9.5.3. Direct sales
- 9.5.4. Distributors
- 9.6. Middle East & Africa Pro Av (Audio Visual) Market Analysis, Opportunity and Forecast, By Country , 2016-2032
- 9.6.1. Middle East & Africa Pro Av (Audio Visual) Market Analysis by Country : Introduction
- 9.6.2. Market Size Absolute $ Opportunity Analysis and Forecast, Country , 2016-2032
- 9.6.2.1. Algeria
- 9.6.2.2. Egypt
- 9.6.2.3. Israel
- 9.6.2.4. Kuwait
- 9.6.2.5. Nigeria
- 9.6.2.6. Saudi Arabia
- 9.6.2.7. South Africa
- 9.6.2.8. Turkey
- 9.6.2.9. The UAE
- 9.6.2.10. Rest of MEA
- 10. Global Pro Av (Audio Visual) Market Analysis, Opportunity and Forecast, By Region , 2016-2032
- 10.1. Global Pro Av (Audio Visual) Market Analysis by Region : Introduction
- 10.2. Market Size Absolute $ Opportunity Analysis and Forecast, By Region , 2016-2032
- 10.2.1. North America
- 10.2.2. Western Europe
- 10.2.3. Eastern Europe
- 10.2.4. APAC
- 10.2.5. Latin America
- 10.2.6. Middle East & Africa
- 11. Global Pro Av (Audio Visual) Market Competitive Landscape, Market Share Analysis, and Company Profiles
- 11.1. Market Share Analysis
- 11.2. Company Profiles
- 11.3. Anixter Inc. (U.S.)
- 11.3.1. Company Overview
- 11.3.2. Financial Highlights
- 11.3.3. Product Portfolio
- 11.3.4. SWOT Analysis
- 11.3.5. Key Strategies and Developments
- 11.4. Wesco (U.S.)
- 11.4.1. Company Overview
- 11.4.2. Financial Highlights
- 11.4.3. Product Portfolio
- 11.4.4. SWOT Analysis
- 11.4.5. Key Strategies and Developments
- 11.5. AVI Systems (U.S.)
- 11.5.1. Company Overview
- 11.5.2. Financial Highlights
- 11.5.3. Product Portfolio
- 11.5.4. SWOT Analysis
- 11.5.5. Key Strategies and Developments
- 11.6. AVI-SPL LLC (U.S.)
- 11.6.1. Company Overview
- 11.6.2. Financial Highlights
- 11.6.3. Product Portfolio
- 11.6.4. SWOT Analysis
- 11.6.5. Key Strategies and Developments
- 11.7. Biamp Systems (U.S.)
- 11.7.1. Company Overview
- 11.7.2. Financial Highlights
- 11.7.3. Product Portfolio
- 11.7.4. SWOT Analysis
- 11.7.5. Key Strategies and Developments
- 11.8. CCS Presentation Systems (U.S.)
- 11.8.1. Company Overview
- 11.8.2. Financial Highlights
- 11.8.3. Product Portfolio
- 11.8.4. SWOT Analysis
- 11.8.5. Key Strategies and Developments
- 12. Assumptions and Acronyms
- 13. Research Methodology
- 14. Contact
- List of Figures
- Figure 1: Global Pro Av (Audio Visual) Market Revenue (US$ Mn) Market Share by By Type in 2022
- Figure 2: Global Pro Av (Audio Visual) Market Attractiveness Analysis by By Type, 2016-2032
- Figure 3: Global Pro Av (Audio Visual) Market Revenue (US$ Mn) Market Share by By Applicationin 2022
- Figure 4: Global Pro Av (Audio Visual) Market Attractiveness Analysis by By Application, 2016-2032
- Figure 5: Global Pro Av (Audio Visual) Market Revenue (US$ Mn) Market Share by By Distribution Channelin 2022
- Figure 6: Global Pro Av (Audio Visual) Market Attractiveness Analysis by By Distribution Channel, 2016-2032
- Figure 7: Global Pro Av (Audio Visual) Market Revenue (US$ Mn) Market Share by Region in 2022
- Figure 8: Global Pro Av (Audio Visual) Market Attractiveness Analysis by Region, 2016-2032
- Figure 9: Global Pro Av (Audio Visual) Market Revenue (US$ Mn) (2016-2032)
- Figure 10: Global Pro Av (Audio Visual) Market Revenue (US$ Mn) Comparison by Region (2016-2032)
- Figure 11: Global Pro Av (Audio Visual) Market Revenue (US$ Mn) Comparison by By Type (2016-2032)
- Figure 12: Global Pro Av (Audio Visual) Market Revenue (US$ Mn) Comparison by By Application (2016-2032)
- Figure 13: Global Pro Av (Audio Visual) Market Revenue (US$ Mn) Comparison by By Distribution Channel (2016-2032)
- Figure 14: Global Pro Av (Audio Visual) Market Y-o-Y Growth Rate Comparison by Region (2016-2032)
- Figure 15: Global Pro Av (Audio Visual) Market Y-o-Y Growth Rate Comparison by By Type (2016-2032)
- Figure 16: Global Pro Av (Audio Visual) Market Y-o-Y Growth Rate Comparison by By Application (2016-2032)
- Figure 17: Global Pro Av (Audio Visual) Market Y-o-Y Growth Rate Comparison by By Distribution Channel (2016-2032)
- Figure 18: Global Pro Av (Audio Visual) Market Share Comparison by Region (2016-2032)
- Figure 19: Global Pro Av (Audio Visual) Market Share Comparison by By Type (2016-2032)
- Figure 20: Global Pro Av (Audio Visual) Market Share Comparison by By Application (2016-2032)
- Figure 21: Global Pro Av (Audio Visual) Market Share Comparison by By Distribution Channel (2016-2032)
- Figure 22: North America Pro Av (Audio Visual) Market Revenue (US$ Mn) Market Share by By Typein 2022
- Figure 23: North America Pro Av (Audio Visual) Market Attractiveness Analysis by By Type, 2016-2032
- Figure 24: North America Pro Av (Audio Visual) Market Revenue (US$ Mn) Market Share by By Applicationin 2022
- Figure 25: North America Pro Av (Audio Visual) Market Attractiveness Analysis by By Application, 2016-2032
- Figure 26: North America Pro Av (Audio Visual) Market Revenue (US$ Mn) Market Share by By Distribution Channelin 2022
- Figure 27: North America Pro Av (Audio Visual) Market Attractiveness Analysis by By Distribution Channel, 2016-2032
- Figure 28: North America Pro Av (Audio Visual) Market Revenue (US$ Mn) Market Share by Country in 2022
- Figure 29: North America Pro Av (Audio Visual) Market Attractiveness Analysis by Country, 2016-2032
- Figure 30: North America Pro Av (Audio Visual) Market Revenue (US$ Mn) (2016-2032)
- Figure 31: North America Pro Av (Audio Visual) Market Revenue (US$ Mn) Comparison by Country (2016-2032)
- Figure 32: North America Pro Av (Audio Visual) Market Revenue (US$ Mn) Comparison by By Type (2016-2032)
- Figure 33: North America Pro Av (Audio Visual) Market Revenue (US$ Mn) Comparison by By Application (2016-2032)
- Figure 34: North America Pro Av (Audio Visual) Market Revenue (US$ Mn) Comparison by By Distribution Channel (2016-2032)
- Figure 35: North America Pro Av (Audio Visual) Market Y-o-Y Growth Rate Comparison by Country (2016-2032)
- Figure 36: North America Pro Av (Audio Visual) Market Y-o-Y Growth Rate Comparison by By Type (2016-2032)
- Figure 37: North America Pro Av (Audio Visual) Market Y-o-Y Growth Rate Comparison by By Application (2016-2032)
- Figure 38: North America Pro Av (Audio Visual) Market Y-o-Y Growth Rate Comparison by By Distribution Channel (2016-2032)
- Figure 39: North America Pro Av (Audio Visual) Market Share Comparison by Country (2016-2032)
- Figure 40: North America Pro Av (Audio Visual) Market Share Comparison by By Type (2016-2032)
- Figure 41: North America Pro Av (Audio Visual) Market Share Comparison by By Application (2016-2032)
- Figure 42: North America Pro Av (Audio Visual) Market Share Comparison by By Distribution Channel (2016-2032)
- Figure 43: Western Europe Pro Av (Audio Visual) Market Revenue (US$ Mn) Market Share by By Typein 2022
- Figure 44: Western Europe Pro Av (Audio Visual) Market Attractiveness Analysis by By Type, 2016-2032
- Figure 45: Western Europe Pro Av (Audio Visual) Market Revenue (US$ Mn) Market Share by By Applicationin 2022
- Figure 46: Western Europe Pro Av (Audio Visual) Market Attractiveness Analysis by By Application, 2016-2032
- Figure 47: Western Europe Pro Av (Audio Visual) Market Revenue (US$ Mn) Market Share by By Distribution Channelin 2022
- Figure 48: Western Europe Pro Av (Audio Visual) Market Attractiveness Analysis by By Distribution Channel, 2016-2032
- Figure 49: Western Europe Pro Av (Audio Visual) Market Revenue (US$ Mn) Market Share by Country in 2022
- Figure 50: Western Europe Pro Av (Audio Visual) Market Attractiveness Analysis by Country, 2016-2032
- Figure 51: Western Europe Pro Av (Audio Visual) Market Revenue (US$ Mn) (2016-2032)
- Figure 52: Western Europe Pro Av (Audio Visual) Market Revenue (US$ Mn) Comparison by Country (2016-2032)
- Figure 53: Western Europe Pro Av (Audio Visual) Market Revenue (US$ Mn) Comparison by By Type (2016-2032)
- Figure 54: Western Europe Pro Av (Audio Visual) Market Revenue (US$ Mn) Comparison by By Application (2016-2032)
- Figure 55: Western Europe Pro Av (Audio Visual) Market Revenue (US$ Mn) Comparison by By Distribution Channel (2016-2032)
- Figure 56: Western Europe Pro Av (Audio Visual) Market Y-o-Y Growth Rate Comparison by Country (2016-2032)
- Figure 57: Western Europe Pro Av (Audio Visual) Market Y-o-Y Growth Rate Comparison by By Type (2016-2032)
- Figure 58: Western Europe Pro Av (Audio Visual) Market Y-o-Y Growth Rate Comparison by By Application (2016-2032)
- Figure 59: Western Europe Pro Av (Audio Visual) Market Y-o-Y Growth Rate Comparison by By Distribution Channel (2016-2032)
- Figure 60: Western Europe Pro Av (Audio Visual) Market Share Comparison by Country (2016-2032)
- Figure 61: Western Europe Pro Av (Audio Visual) Market Share Comparison by By Type (2016-2032)
- Figure 62: Western Europe Pro Av (Audio Visual) Market Share Comparison by By Application (2016-2032)
- Figure 63: Western Europe Pro Av (Audio Visual) Market Share Comparison by By Distribution Channel (2016-2032)
- Figure 64: Eastern Europe Pro Av (Audio Visual) Market Revenue (US$ Mn) Market Share by By Typein 2022
- Figure 65: Eastern Europe Pro Av (Audio Visual) Market Attractiveness Analysis by By Type, 2016-2032
- Figure 66: Eastern Europe Pro Av (Audio Visual) Market Revenue (US$ Mn) Market Share by By Applicationin 2022
- Figure 67: Eastern Europe Pro Av (Audio Visual) Market Attractiveness Analysis by By Application, 2016-2032
- Figure 68: Eastern Europe Pro Av (Audio Visual) Market Revenue (US$ Mn) Market Share by By Distribution Channelin 2022
- Figure 69: Eastern Europe Pro Av (Audio Visual) Market Attractiveness Analysis by By Distribution Channel, 2016-2032
- Figure 70: Eastern Europe Pro Av (Audio Visual) Market Revenue (US$ Mn) Market Share by Country in 2022
- Figure 71: Eastern Europe Pro Av (Audio Visual) Market Attractiveness Analysis by Country, 2016-2032
- Figure 72: Eastern Europe Pro Av (Audio Visual) Market Revenue (US$ Mn) (2016-2032)
- Figure 73: Eastern Europe Pro Av (Audio Visual) Market Revenue (US$ Mn) Comparison by Country (2016-2032)
- Figure 74: Eastern Europe Pro Av (Audio Visual) Market Revenue (US$ Mn) Comparison by By Type (2016-2032)
- Figure 75: Eastern Europe Pro Av (Audio Visual) Market Revenue (US$ Mn) Comparison by By Application (2016-2032)
- Figure 76: Eastern Europe Pro Av (Audio Visual) Market Revenue (US$ Mn) Comparison by By Distribution Channel (2016-2032)
- Figure 77: Eastern Europe Pro Av (Audio Visual) Market Y-o-Y Growth Rate Comparison by Country (2016-2032)
- Figure 78: Eastern Europe Pro Av (Audio Visual) Market Y-o-Y Growth Rate Comparison by By Type (2016-2032)
- Figure 79: Eastern Europe Pro Av (Audio Visual) Market Y-o-Y Growth Rate Comparison by By Application (2016-2032)
- Figure 80: Eastern Europe Pro Av (Audio Visual) Market Y-o-Y Growth Rate Comparison by By Distribution Channel (2016-2032)
- Figure 81: Eastern Europe Pro Av (Audio Visual) Market Share Comparison by Country (2016-2032)
- Figure 82: Eastern Europe Pro Av (Audio Visual) Market Share Comparison by By Type (2016-2032)
- Figure 83: Eastern Europe Pro Av (Audio Visual) Market Share Comparison by By Application (2016-2032)
- Figure 84: Eastern Europe Pro Av (Audio Visual) Market Share Comparison by By Distribution Channel (2016-2032)
- Figure 85: APAC Pro Av (Audio Visual) Market Revenue (US$ Mn) Market Share by By Typein 2022
- Figure 86: APAC Pro Av (Audio Visual) Market Attractiveness Analysis by By Type, 2016-2032
- Figure 87: APAC Pro Av (Audio Visual) Market Revenue (US$ Mn) Market Share by By Applicationin 2022
- Figure 88: APAC Pro Av (Audio Visual) Market Attractiveness Analysis by By Application, 2016-2032
- Figure 89: APAC Pro Av (Audio Visual) Market Revenue (US$ Mn) Market Share by By Distribution Channelin 2022
- Figure 90: APAC Pro Av (Audio Visual) Market Attractiveness Analysis by By Distribution Channel, 2016-2032
- Figure 91: APAC Pro Av (Audio Visual) Market Revenue (US$ Mn) Market Share by Country in 2022
- Figure 92: APAC Pro Av (Audio Visual) Market Attractiveness Analysis by Country, 2016-2032
- Figure 93: APAC Pro Av (Audio Visual) Market Revenue (US$ Mn) (2016-2032)
- Figure 94: APAC Pro Av (Audio Visual) Market Revenue (US$ Mn) Comparison by Country (2016-2032)
- Figure 95: APAC Pro Av (Audio Visual) Market Revenue (US$ Mn) Comparison by By Type (2016-2032)
- Figure 96: APAC Pro Av (Audio Visual) Market Revenue (US$ Mn) Comparison by By Application (2016-2032)
- Figure 97: APAC Pro Av (Audio Visual) Market Revenue (US$ Mn) Comparison by By Distribution Channel (2016-2032)
- Figure 98: APAC Pro Av (Audio Visual) Market Y-o-Y Growth Rate Comparison by Country (2016-2032)
- Figure 99: APAC Pro Av (Audio Visual) Market Y-o-Y Growth Rate Comparison by By Type (2016-2032)
- Figure 100: APAC Pro Av (Audio Visual) Market Y-o-Y Growth Rate Comparison by By Application (2016-2032)
- Figure 101: APAC Pro Av (Audio Visual) Market Y-o-Y Growth Rate Comparison by By Distribution Channel (2016-2032)
- Figure 102: APAC Pro Av (Audio Visual) Market Share Comparison by Country (2016-2032)
- Figure 103: APAC Pro Av (Audio Visual) Market Share Comparison by By Type (2016-2032)
- Figure 104: APAC Pro Av (Audio Visual) Market Share Comparison by By Application (2016-2032)
- Figure 105: APAC Pro Av (Audio Visual) Market Share Comparison by By Distribution Channel (2016-2032)
- Figure 106: Latin America Pro Av (Audio Visual) Market Revenue (US$ Mn) Market Share by By Typein 2022
- Figure 107: Latin America Pro Av (Audio Visual) Market Attractiveness Analysis by By Type, 2016-2032
- Figure 108: Latin America Pro Av (Audio Visual) Market Revenue (US$ Mn) Market Share by By Applicationin 2022
- Figure 109: Latin America Pro Av (Audio Visual) Market Attractiveness Analysis by By Application, 2016-2032
- Figure 110: Latin America Pro Av (Audio Visual) Market Revenue (US$ Mn) Market Share by By Distribution Channelin 2022
- Figure 111: Latin America Pro Av (Audio Visual) Market Attractiveness Analysis by By Distribution Channel, 2016-2032
- Figure 112: Latin America Pro Av (Audio Visual) Market Revenue (US$ Mn) Market Share by Country in 2022
- Figure 113: Latin America Pro Av (Audio Visual) Market Attractiveness Analysis by Country, 2016-2032
- Figure 114: Latin America Pro Av (Audio Visual) Market Revenue (US$ Mn) (2016-2032)
- Figure 115: Latin America Pro Av (Audio Visual) Market Revenue (US$ Mn) Comparison by Country (2016-2032)
- Figure 116: Latin America Pro Av (Audio Visual) Market Revenue (US$ Mn) Comparison by By Type (2016-2032)
- Figure 117: Latin America Pro Av (Audio Visual) Market Revenue (US$ Mn) Comparison by By Application (2016-2032)
- Figure 118: Latin America Pro Av (Audio Visual) Market Revenue (US$ Mn) Comparison by By Distribution Channel (2016-2032)
- Figure 119: Latin America Pro Av (Audio Visual) Market Y-o-Y Growth Rate Comparison by Country (2016-2032)
- Figure 120: Latin America Pro Av (Audio Visual) Market Y-o-Y Growth Rate Comparison by By Type (2016-2032)
- Figure 121: Latin America Pro Av (Audio Visual) Market Y-o-Y Growth Rate Comparison by By Application (2016-2032)
- Figure 122: Latin America Pro Av (Audio Visual) Market Y-o-Y Growth Rate Comparison by By Distribution Channel (2016-2032)
- Figure 123: Latin America Pro Av (Audio Visual) Market Share Comparison by Country (2016-2032)
- Figure 124: Latin America Pro Av (Audio Visual) Market Share Comparison by By Type (2016-2032)
- Figure 125: Latin America Pro Av (Audio Visual) Market Share Comparison by By Application (2016-2032)
- Figure 126: Latin America Pro Av (Audio Visual) Market Share Comparison by By Distribution Channel (2016-2032)
- Figure 127: Middle East & Africa Pro Av (Audio Visual) Market Revenue (US$ Mn) Market Share by By Typein 2022
- Figure 128: Middle East & Africa Pro Av (Audio Visual) Market Attractiveness Analysis by By Type, 2016-2032
- Figure 129: Middle East & Africa Pro Av (Audio Visual) Market Revenue (US$ Mn) Market Share by By Applicationin 2022
- Figure 130: Middle East & Africa Pro Av (Audio Visual) Market Attractiveness Analysis by By Application, 2016-2032
- Figure 131: Middle East & Africa Pro Av (Audio Visual) Market Revenue (US$ Mn) Market Share by By Distribution Channelin 2022
- Figure 132: Middle East & Africa Pro Av (Audio Visual) Market Attractiveness Analysis by By Distribution Channel, 2016-2032
- Figure 133: Middle East & Africa Pro Av (Audio Visual) Market Revenue (US$ Mn) Market Share by Country in 2022
- Figure 134: Middle East & Africa Pro Av (Audio Visual) Market Attractiveness Analysis by Country, 2016-2032
- Figure 135: Middle East & Africa Pro Av (Audio Visual) Market Revenue (US$ Mn) (2016-2032)
- Figure 136: Middle East & Africa Pro Av (Audio Visual) Market Revenue (US$ Mn) Comparison by Country (2016-2032)
- Figure 137: Middle East & Africa Pro Av (Audio Visual) Market Revenue (US$ Mn) Comparison by By Type (2016-2032)
- Figure 138: Middle East & Africa Pro Av (Audio Visual) Market Revenue (US$ Mn) Comparison by By Application (2016-2032)
- Figure 139: Middle East & Africa Pro Av (Audio Visual) Market Revenue (US$ Mn) Comparison by By Distribution Channel (2016-2032)
- Figure 140: Middle East & Africa Pro Av (Audio Visual) Market Y-o-Y Growth Rate Comparison by Country (2016-2032)
- Figure 141: Middle East & Africa Pro Av (Audio Visual) Market Y-o-Y Growth Rate Comparison by By Type (2016-2032)
- Figure 142: Middle East & Africa Pro Av (Audio Visual) Market Y-o-Y Growth Rate Comparison by By Application (2016-2032)
- Figure 143: Middle East & Africa Pro Av (Audio Visual) Market Y-o-Y Growth Rate Comparison by By Distribution Channel (2016-2032)
- Figure 144: Middle East & Africa Pro Av (Audio Visual) Market Share Comparison by Country (2016-2032)
- Figure 145: Middle East & Africa Pro Av (Audio Visual) Market Share Comparison by By Type (2016-2032)
- Figure 146: Middle East & Africa Pro Av (Audio Visual) Market Share Comparison by By Application (2016-2032)
- Figure 147: Middle East & Africa Pro Av (Audio Visual) Market Share Comparison by By Distribution Channel (2016-2032)
- List of Tables
- Table 1: Global Pro Av (Audio Visual) Market Comparison by By Type (2016-2032)
- Table 2: Global Pro Av (Audio Visual) Market Comparison by By Application (2016-2032)
- Table 3: Global Pro Av (Audio Visual) Market Comparison by By Distribution Channel (2016-2032)
- Table 4: Global Pro Av (Audio Visual) Market Revenue (US$ Mn) Comparison by Region (2016-2032)
- Table 5: Global Pro Av (Audio Visual) Market Revenue (US$ Mn) (2016-2032)
- Table 6: Global Pro Av (Audio Visual) Market Revenue (US$ Mn) Comparison by Region (2016-2032)
- Table 7: Global Pro Av (Audio Visual) Market Revenue (US$ Mn) Comparison by By Type (2016-2032)
- Table 8: Global Pro Av (Audio Visual) Market Revenue (US$ Mn) Comparison by By Application (2016-2032)
- Table 9: Global Pro Av (Audio Visual) Market Revenue (US$ Mn) Comparison by By Distribution Channel (2016-2032)
- Table 10: Global Pro Av (Audio Visual) Market Y-o-Y Growth Rate Comparison by Region (2016-2032)
- Table 11: Global Pro Av (Audio Visual) Market Y-o-Y Growth Rate Comparison by By Type (2016-2032)
- Table 12: Global Pro Av (Audio Visual) Market Y-o-Y Growth Rate Comparison by By Application (2016-2032)
- Table 13: Global Pro Av (Audio Visual) Market Y-o-Y Growth Rate Comparison by By Distribution Channel (2016-2032)
- Table 14: Global Pro Av (Audio Visual) Market Share Comparison by Region (2016-2032)
- Table 15: Global Pro Av (Audio Visual) Market Share Comparison by By Type (2016-2032)
- Table 16: Global Pro Av (Audio Visual) Market Share Comparison by By Application (2016-2032)
- Table 17: Global Pro Av (Audio Visual) Market Share Comparison by By Distribution Channel (2016-2032)
- Table 18: North America Pro Av (Audio Visual) Market Comparison by By Application (2016-2032)
- Table 19: North America Pro Av (Audio Visual) Market Comparison by By Distribution Channel (2016-2032)
- Table 20: North America Pro Av (Audio Visual) Market Revenue (US$ Mn) Comparison by Country (2016-2032)
- Table 21: North America Pro Av (Audio Visual) Market Revenue (US$ Mn) (2016-2032)
- Table 22: North America Pro Av (Audio Visual) Market Revenue (US$ Mn) Comparison by Country (2016-2032)
- Table 23: North America Pro Av (Audio Visual) Market Revenue (US$ Mn) Comparison by By Type (2016-2032)
- Table 24: North America Pro Av (Audio Visual) Market Revenue (US$ Mn) Comparison by By Application (2016-2032)
- Table 25: North America Pro Av (Audio Visual) Market Revenue (US$ Mn) Comparison by By Distribution Channel (2016-2032)
- Table 26: North America Pro Av (Audio Visual) Market Y-o-Y Growth Rate Comparison by Country (2016-2032)
- Table 27: North America Pro Av (Audio Visual) Market Y-o-Y Growth Rate Comparison by By Type (2016-2032)
- Table 28: North America Pro Av (Audio Visual) Market Y-o-Y Growth Rate Comparison by By Application (2016-2032)
- Table 29: North America Pro Av (Audio Visual) Market Y-o-Y Growth Rate Comparison by By Distribution Channel (2016-2032)
- Table 30: North America Pro Av (Audio Visual) Market Share Comparison by Country (2016-2032)
- Table 31: North America Pro Av (Audio Visual) Market Share Comparison by By Type (2016-2032)
- Table 32: North America Pro Av (Audio Visual) Market Share Comparison by By Application (2016-2032)
- Table 33: North America Pro Av (Audio Visual) Market Share Comparison by By Distribution Channel (2016-2032)
- Table 34: Western Europe Pro Av (Audio Visual) Market Comparison by By Type (2016-2032)
- Table 35: Western Europe Pro Av (Audio Visual) Market Comparison by By Application (2016-2032)
- Table 36: Western Europe Pro Av (Audio Visual) Market Comparison by By Distribution Channel (2016-2032)
- Table 37: Western Europe Pro Av (Audio Visual) Market Revenue (US$ Mn) Comparison by Country (2016-2032)
- Table 38: Western Europe Pro Av (Audio Visual) Market Revenue (US$ Mn) (2016-2032)
- Table 39: Western Europe Pro Av (Audio Visual) Market Revenue (US$ Mn) Comparison by Country (2016-2032)
- Table 40: Western Europe Pro Av (Audio Visual) Market Revenue (US$ Mn) Comparison by By Type (2016-2032)
- Table 41: Western Europe Pro Av (Audio Visual) Market Revenue (US$ Mn) Comparison by By Application (2016-2032)
- Table 42: Western Europe Pro Av (Audio Visual) Market Revenue (US$ Mn) Comparison by By Distribution Channel (2016-2032)
- Table 43: Western Europe Pro Av (Audio Visual) Market Y-o-Y Growth Rate Comparison by Country (2016-2032)
- Table 44: Western Europe Pro Av (Audio Visual) Market Y-o-Y Growth Rate Comparison by By Type (2016-2032)
- Table 45: Western Europe Pro Av (Audio Visual) Market Y-o-Y Growth Rate Comparison by By Application (2016-2032)
- Table 46: Western Europe Pro Av (Audio Visual) Market Y-o-Y Growth Rate Comparison by By Distribution Channel (2016-2032)
- Table 47: Western Europe Pro Av (Audio Visual) Market Share Comparison by Country (2016-2032)
- Table 48: Western Europe Pro Av (Audio Visual) Market Share Comparison by By Type (2016-2032)
- Table 49: Western Europe Pro Av (Audio Visual) Market Share Comparison by By Application (2016-2032)
- Table 50: Western Europe Pro Av (Audio Visual) Market Share Comparison by By Distribution Channel (2016-2032)
- Table 51: Eastern Europe Pro Av (Audio Visual) Market Comparison by By Type (2016-2032)
- Table 52: Eastern Europe Pro Av (Audio Visual) Market Comparison by By Application (2016-2032)
- Table 53: Eastern Europe Pro Av (Audio Visual) Market Comparison by By Distribution Channel (2016-2032)
- Table 54: Eastern Europe Pro Av (Audio Visual) Market Revenue (US$ Mn) Comparison by Country (2016-2032)
- Table 55: Eastern Europe Pro Av (Audio Visual) Market Revenue (US$ Mn) (2016-2032)
- Table 56: Eastern Europe Pro Av (Audio Visual) Market Revenue (US$ Mn) Comparison by Country (2016-2032)
- Table 57: Eastern Europe Pro Av (Audio Visual) Market Revenue (US$ Mn) Comparison by By Type (2016-2032)
- Table 58: Eastern Europe Pro Av (Audio Visual) Market Revenue (US$ Mn) Comparison by By Application (2016-2032)
- Table 59: Eastern Europe Pro Av (Audio Visual) Market Revenue (US$ Mn) Comparison by By Distribution Channel (2016-2032)
- Table 60: Eastern Europe Pro Av (Audio Visual) Market Y-o-Y Growth Rate Comparison by Country (2016-2032)
- Table 61: Eastern Europe Pro Av (Audio Visual) Market Y-o-Y Growth Rate Comparison by By Type (2016-2032)
- Table 62: Eastern Europe Pro Av (Audio Visual) Market Y-o-Y Growth Rate Comparison by By Application (2016-2032)
- Table 63: Eastern Europe Pro Av (Audio Visual) Market Y-o-Y Growth Rate Comparison by By Distribution Channel (2016-2032)
- Table 64: Eastern Europe Pro Av (Audio Visual) Market Share Comparison by Country (2016-2032)
- Table 65: Eastern Europe Pro Av (Audio Visual) Market Share Comparison by By Type (2016-2032)
- Table 66: Eastern Europe Pro Av (Audio Visual) Market Share Comparison by By Application (2016-2032)
- Table 67: Eastern Europe Pro Av (Audio Visual) Market Share Comparison by By Distribution Channel (2016-2032)
- Table 68: APAC Pro Av (Audio Visual) Market Comparison by By Type (2016-2032)
- Table 69: APAC Pro Av (Audio Visual) Market Comparison by By Application (2016-2032)
- Table 70: APAC Pro Av (Audio Visual) Market Comparison by By Distribution Channel (2016-2032)
- Table 71: APAC Pro Av (Audio Visual) Market Revenue (US$ Mn) Comparison by Country (2016-2032)
- Table 72: APAC Pro Av (Audio Visual) Market Revenue (US$ Mn) (2016-2032)
- Table 73: APAC Pro Av (Audio Visual) Market Revenue (US$ Mn) Comparison by Country (2016-2032)
- Table 74: APAC Pro Av (Audio Visual) Market Revenue (US$ Mn) Comparison by By Type (2016-2032)
- Table 75: APAC Pro Av (Audio Visual) Market Revenue (US$ Mn) Comparison by By Application (2016-2032)
- Table 76: APAC Pro Av (Audio Visual) Market Revenue (US$ Mn) Comparison by By Distribution Channel (2016-2032)
- Table 77: APAC Pro Av (Audio Visual) Market Y-o-Y Growth Rate Comparison by Country (2016-2032)
- Table 78: APAC Pro Av (Audio Visual) Market Y-o-Y Growth Rate Comparison by By Type (2016-2032)
- Table 79: APAC Pro Av (Audio Visual) Market Y-o-Y Growth Rate Comparison by By Application (2016-2032)
- Table 80: APAC Pro Av (Audio Visual) Market Y-o-Y Growth Rate Comparison by By Distribution Channel (2016-2032)
- Table 81: APAC Pro Av (Audio Visual) Market Share Comparison by Country (2016-2032)
- Table 82: APAC Pro Av (Audio Visual) Market Share Comparison by By Type (2016-2032)
- Table 83: APAC Pro Av (Audio Visual) Market Share Comparison by By Application (2016-2032)
- Table 84: APAC Pro Av (Audio Visual) Market Share Comparison by By Distribution Channel (2016-2032)
- Table 85: Latin America Pro Av (Audio Visual) Market Comparison by By Type (2016-2032)
- Table 86: Latin America Pro Av (Audio Visual) Market Comparison by By Application (2016-2032)
- Table 87: Latin America Pro Av (Audio Visual) Market Comparison by By Distribution Channel (2016-2032)
- Table 88: Latin America Pro Av (Audio Visual) Market Revenue (US$ Mn) Comparison by Country (2016-2032)
- Table 89: Latin America Pro Av (Audio Visual) Market Revenue (US$ Mn) (2016-2032)
- Table 90: Latin America Pro Av (Audio Visual) Market Revenue (US$ Mn) Comparison by Country (2016-2032)
- Table 91: Latin America Pro Av (Audio Visual) Market Revenue (US$ Mn) Comparison by By Type (2016-2032)
- Table 92: Latin America Pro Av (Audio Visual) Market Revenue (US$ Mn) Comparison by By Application (2016-2032)
- Table 93: Latin America Pro Av (Audio Visual) Market Revenue (US$ Mn) Comparison by By Distribution Channel (2016-2032)
- Table 94: Latin America Pro Av (Audio Visual) Market Y-o-Y Growth Rate Comparison by Country (2016-2032)
- Table 95: Latin America Pro Av (Audio Visual) Market Y-o-Y Growth Rate Comparison by By Type (2016-2032)
- Table 96: Latin America Pro Av (Audio Visual) Market Y-o-Y Growth Rate Comparison by By Application (2016-2032)
- Table 97: Latin America Pro Av (Audio Visual) Market Y-o-Y Growth Rate Comparison by By Distribution Channel (2016-2032)
- Table 98: Latin America Pro Av (Audio Visual) Market Share Comparison by Country (2016-2032)
- Table 99: Latin America Pro Av (Audio Visual) Market Share Comparison by By Type (2016-2032)
- Table 100: Latin America Pro Av (Audio Visual) Market Share Comparison by By Application (2016-2032)
- Table 101: Latin America Pro Av (Audio Visual) Market Share Comparison by By Distribution Channel (2016-2032)
- Table 102: Middle East & Africa Pro Av (Audio Visual) Market Comparison by By Type (2016-2032)
- Table 103: Middle East & Africa Pro Av (Audio Visual) Market Comparison by By Application (2016-2032)
- Table 104: Middle East & Africa Pro Av (Audio Visual) Market Comparison by By Distribution Channel (2016-2032)
- Table 105: Middle East & Africa Pro Av (Audio Visual) Market Revenue (US$ Mn) Comparison by Country (2016-2032)
- Table 106: Middle East & Africa Pro Av (Audio Visual) Market Revenue (US$ Mn) (2016-2032)
- Table 107: Middle East & Africa Pro Av (Audio Visual) Market Revenue (US$ Mn) Comparison by Country (2016-2032)
- Table 108: Middle East & Africa Pro Av (Audio Visual) Market Revenue (US$ Mn) Comparison by By Type (2016-2032)
- Table 109: Middle East & Africa Pro Av (Audio Visual) Market Revenue (US$ Mn) Comparison by By Application (2016-2032)
- Table 110: Middle East & Africa Pro Av (Audio Visual) Market Revenue (US$ Mn) Comparison by By Distribution Channel (2016-2032)
- Table 111: Middle East & Africa Pro Av (Audio Visual) Market Y-o-Y Growth Rate Comparison by Country (2016-2032)
- Table 112: Middle East & Africa Pro Av (Audio Visual) Market Y-o-Y Growth Rate Comparison by By Type (2016-2032)
- Table 113: Middle East & Africa Pro Av (Audio Visual) Market Y-o-Y Growth Rate Comparison by By Application (2016-2032)
- Table 114: Middle East & Africa Pro Av (Audio Visual) Market Y-o-Y Growth Rate Comparison by By Distribution Channel (2016-2032)
- Table 115: Middle East & Africa Pro Av (Audio Visual) Market Share Comparison by Country (2016-2032)
- Table 116: Middle East & Africa Pro Av (Audio Visual) Market Share Comparison by By Type (2016-2032)
- Table 117: Middle East & Africa Pro Av (Audio Visual) Market Share Comparison by By Application (2016-2032)
- Table 118: Middle East & Africa Pro Av (Audio Visual) Market Share Comparison by By Distribution Channel (2016-2032)
- 1. Executive Summary
-
- Anixter Inc. (U.S.)
- Wesco (U.S.)
- AVI Systems (U.S.)
- AVI-SPL LLC (U.S.)
- Biamp Systems (U.S.)
- CCS Presentation Systems (U.S.)
Our Clients


View Our Licence Options
