
Plasma Fractionation Market By Product Type (Immunoglobulins, Albumin, Coagulation Factor Concentrates), By Application (Neurology, Hematology, Immunology, Critical Care), By Region And Companies - Industry Segment Outlook, Market Assessment, Competition Scenario, Trends, And Forecast 2023-2032
-
3090
-
June 2023
-
185
-


-
This report was compiled by Trishita Deb Trishita Deb is an experienced market research and consulting professional with over 7 years of expertise across healthcare, consumer goods, and materials, contributing to over 400 healthcare-related reports. Correspondence Team Lead- Healthcare Linkedin | Detailed Market research Methodology Our methodology involves a mix of primary research, including interviews with leading mental health experts, and secondary research from reputable medical journals and databases. View Detailed Methodology Page
-
Quick Navigation
Report Overview
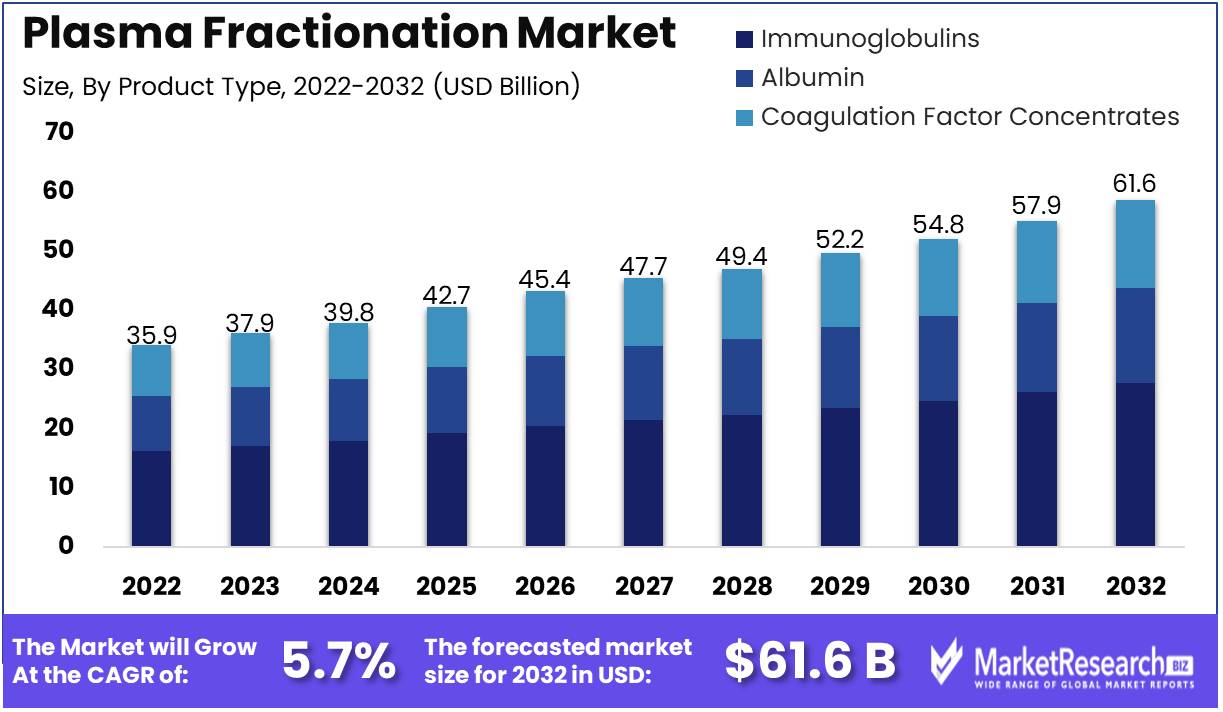
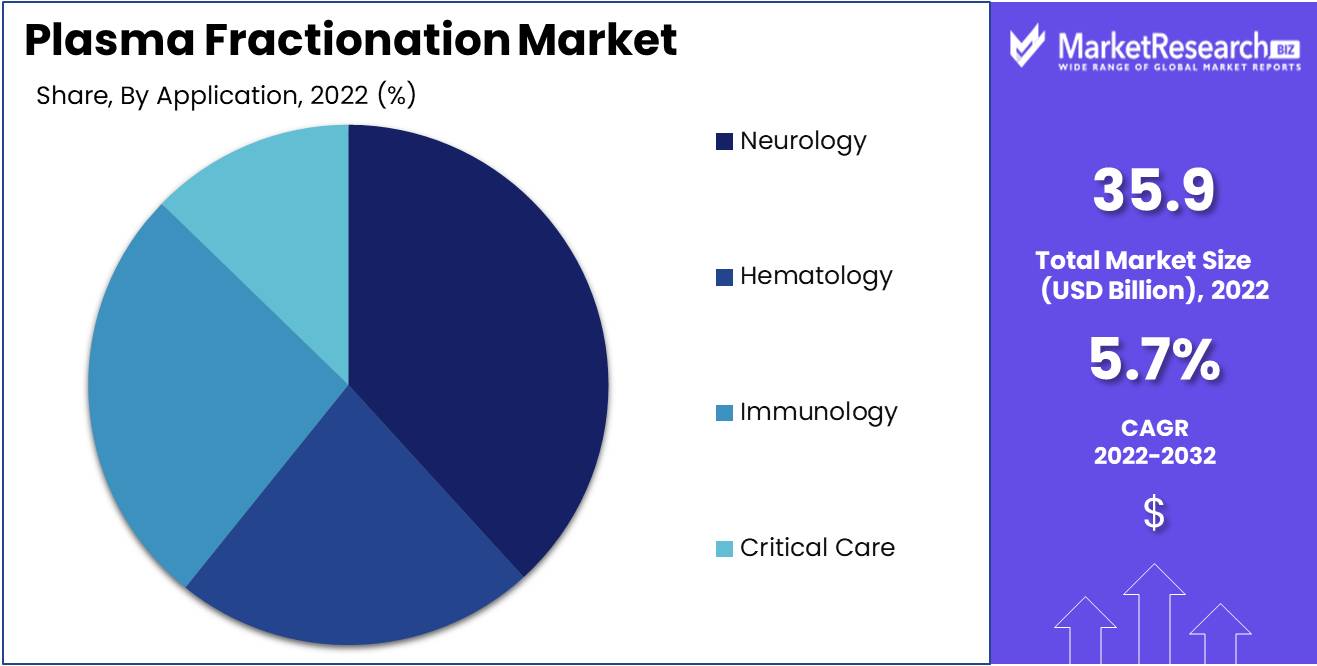
The Plasma Fractionation Market size is expected to be worth around USD 61.6 Bn by 2032 from USD 35.9 Bn in 2022, growing at a CAGR of 5.7% during the forecast period from 2023 to 2032.
The Plasma Fractionation Market report provides a comprehensive analysis of the industry, delving into numerous aspects such as the market's size, prevailing trends, and unbounded growth potential. Plasma fractionation, a complex procedure involving the separation of plasma from blood, is followed by the fractionation of plasma into numerous components, including immunoglobulins, albumin, and coagulation factors. Subsequently, these discrete components are utilized for a vast array of medical applications, including the treatment of immune system disorders, coagulation disorders, and various other medical conditions.
Increasing demand for immunoglobulins and other plasma-derived products is driving the market for plasma fractionation, which has experienced a meteoric rise in recent years. This market demonstrates indomitable tenacity and a steady ascent, fueled by an exponential increase in the incidence of immune system disorders and bleeding disorders, the relentless march of fractionation technology, and the unwavering commitment demonstrated by key industry players as they increase their investments in the sector.
Plasma fractionation is significant because of its inherent ability to provide a comprehensive pantheon of therapeutic remedies for a vast spectrum of diseases, including hemophilia, immune deficiencies, and hepatic disorders. These exceptional therapies are veritable touchstones of efficacy, penetrating the lives of patients and significantly enhancing their quality of life. Moreover, plasma fractionation has deftly made new inroads in the domain of research and development, reshaping the treatment landscape for formerly incurable diseases. The concomitant advantages of plasma fractionation reverberate in the provision of treatments that are safe, effective, and exceedingly dependable, thereby meeting the urgent needs of patients who are truly deserving.
CSL Behring, Grifols, and Baxter International's innovative forays into the field of plasma fractionation have resulted in an unprecedented influx of capital. These monumental investments have unleashed a veritable symphony of innovative products and technologies, which are seamlessly woven into the very fabric of the services provided by these illustrious organizations. CSL Behring, for example, is a paragon of progress, having pioneered the development of a diverse array of plasma-derived products, including immunoglobulins, albumin, and clotting factors, all of which find a home in the annals of disease alleviation, fighting the good fight against a wide variety of diseases.
The growth trajectory of plasma fractionation can be attributed to a multitude of factors, including an exponential increase in the prevalence of immune system disorders and bleeding disorders, which are relentlessly complemented by pioneering advances in fractionation technology and a catalytic influx of capital into the industry. Plasma fractionation has a wide range of applications, including the effective treatment of immune deficiencies, blood coagulation disorders, and a vast array of hepatic diseases that span the medical landscape. In addition, plasma fractionation marches in lockstep with the field of research and development, serving as a potent weapon in the pursuit of novel therapies to combat a variety of human ailments.
Driving Factors
Prevalence of Bleeding and Immune Disorders Drives the Plasma Fractionation Market
The rising prevalence of hemorrhage and immune disorders has become a key factor in the expansion of the plasma fractionation market. Immunoglobulin products, which are derived through a complex procedure called plasma fractionation, are in high demand as a result of the increase in these diseases. In addition, the growing geriatric population has contributed to the rise in demand for plasma-derived products, as older adults are more susceptible to illness and require more medical care.
Expanding Applications of Plasma Derived Products Fuel Market Growth
Diversification of applications for plasma-derived products is a significant factor fueling the expansion of the plasma fractionation market. The increasing demand for protein therapies is a result of their remarkable efficacy in treating a variety of medical conditions.
Increased awareness and supply of plasma contribute to market growth
Rising awareness of plasma donation has had a positive effect on the plasma fractionation market by increasing the plasma supply. This increase in plasma availability has facilitated the growth of the market. In addition, the rising prevalence of alpha-1 antitrypsin deficiency and the expanding use of recombinant coagulation factors are driving the growth of the plasma fractionation market.
Regulatory Changes and Emerging Technologies Pose Challenges and Opportunities
While the plasma fractionation market is thriving, regulatory changes may pose potential obstacles. The implementation of the EU's new Medical Device Regulation (MDR) and In Vitro Diagnostic Regulation (IVDR) may increase the regulatory burden and have an effect on the market access of plasma-derived pharmaceuticals. In addition, emerging technologies such as gene therapy and stem cell therapy may pose a long-term threat to the plasma fractionation market by providing alternative treatments for a variety of medical conditions and thereby reducing the demand for plasma-derived products.
The Market is Influenced by Disruptors and Shifting Trends
Mergers and acquisitions, the emergence of new market participants, and the expanding use of biosimilars may have a disruptive effect on the plasma fractionation market's competitive landscape. In addition, emergent trends and changes in consumer behavior, such as the growing demand for personalized medicine and the expansion of the e-commerce industry, can have a significant impact on the plasma fractionation market.
Restraining Factors
High Cost of Plasma Fractionation Products
The high price of plasma fractionation products is one of the most significant factors that restrict their availability and accessibility. Unlike other medications, plasma fractionation products require a complex manufacturing process involving the collection, processing, and testing of plasma samples from donors. Regulatory requirements that ensure the safety and efficacy of these products further increase the expense of producing plasma-derived products due to their complexity and costliness.
Strict Regulations for Products Derived from Plasma
The stringent regulations that govern the production and distribution of plasma fractionation products are another factor that hinders their global availability. The regulatory authorities require pharmaceutical companies to adhere to stringent guidelines and standards to ensure the safety and efficacy of plasma-derived products. This regulatory burden not only results in higher costs but also hinders the market penetration of lesser businesses.
Limited Availability of Plasma Donors
Another significant factor that affects the production and availability of plasma fractionation products is the limited availability of plasma donors. Plasma donors are screened, making it more difficult to secure a constant supply of plasma for the manufacturing of these products. In addition, the availability of plasma can vary geographically and seasonally, limiting the production and distribution of products derived from plasma.
Risk of Transfusion Transmitted Infections
The potential risk of transfusion-transmitted infections (TTIs) is an additional factor limiting the use of plasma-derived products. There is still a potential risk of TTIs associated with the use of plasma-derived products, despite significant advancements in testing, screening, and processing. Due to the nature of the plasma collection procedure, plasma samples may become contaminated by accident. As a result, some patients may be hesitant to utilize plasma fractionation products, thereby restricting their intake and distribution.
Alternative Therapies as Competition for the Plasma Fractionation Market
Alternative therapies present substantial competition in the plasma fractionation market, impeding the utilization and availability of plasma-derived products. These alternative treatments include recombinant proteins, biosimilars, and gene therapies, which are gaining popularity due to their affordability and safety profiles. Despite the fact that plasma fractionation products continue to be an essential treatment option for a number of conditions, competition from these alternative therapies can have a significant impact on their marketability and utilization.
Product Analysis
Immunoglobulins Segment is the market leader in the Plasma Fractionation Market. This segment has proved to be highly profitable and is driving the market for plasma fractionation forward in a continuous manner. As the number of diseases and disorders increases, the demand for immunoglobulins skyrockets. These proteins are responsible for defending the human body against infections and other maladies.
The economic growth of emerging economies has had a significant impact on the growth of the immunoglobulins market segment. Numerous emerging economies have experienced substantial GDP growth, which has led to an increase in healthcare spending. With a greater emphasis on healthcare, the demand for immunoglobulins to address unmet medical needs in these regions has increased.
Positive consumer trends and behavior have also been observed in the immunoglobulins market segment. A greater understanding of the significance of immunoglobulins in maintaining good health has increased demand for this market segment. Sales of immunoglobulins have increased as a result of the growing acceptance of preventative healthcare practices by consumers.
Process Analysis
The Fractionation Segment predominates the Plasma Fractionation Market. This section entails the separation of plasma into its numerous constituents, including albumins, coagulation factors, and immunoglobulins. Critical to the production of plasma fractionation products.
The adoption of the Fractionation Segment has been influenced by economic growth in emerging economies. The rise in healthcare expenditures and expansion of healthcare infrastructure in these regions has resulted in a rise in plasma fractionation product production. This has aided the expansion of the Fractionation Segment.
Positive consumer trends and conduct have been observed in the Fractionation Segment. Increased demand for plasma fractionation products has resulted from a greater understanding of the significance of preventive healthcare. This has aided the expansion of the Fractionation Segment.
End-User Analysis
Hospitals Segment Dominates Plasma Fractionation Market. The preponderance of end-users of plasma fractionation products are hospitals. These institutions require plasma products to treat a variety of medical conditions, such as trauma, burns, and liver disorders.
The adoption of the Hospitals Segment has been fueled by economic growth in emerging economies. The number of hospitals has increased due to the expansion of healthcare infrastructure, the rise in healthcare spending, and the expanding preference for in-patient treatment. This has aided the expansion of the hospital's Segment.
The Hospitals Segment has experienced favorable consumer trends and behavior. Hospital visits have increased as a result of the preference of many consumers for dependable and high-quality health care. As older individuals require more frequent medical care, the aging of the population has also contributed to the expansion of this market segment.
Application Analysis
The Neurology Segment dominates the Plasma Fractionation Market. This segment offers essential products for the treatment of neurological diseases and disorders. These products include albumins, coagulation factors, and immunoglobulins, which are essential components for treating neurological disorders.
The adoption of the Neurology Segment has been spurred by economic growth in emerging economies. The increase in neurological disorders and maladies in these regions has increased the demand for neurology-related products. The expansion of healthcare infrastructure and the increase in healthcare expenditures in these regions have played a significant role in the growth of this segment.
Positive consumer trends and behavior have been observed in the Neurology Segment. There is a growing awareness of neurological disorders, and an increasing number of consumers seek early diagnosis and treatment. Increasing rates of Alzheimer's, Parkinson's, and Epilepsy have also contributed to the expansion of this market segment.
Key Market Segments
By Product Type
- Immunoglobulins
- Albumin
- Coagulation Factor Concentrates
By Process
- Fractionation Process
- Precipitation Method
- Chromatography Technique
- Recombinant DNA Technology
By End User
- Hospitals And Clinics
- Clinical Research Laboratories
- Academic Institutes
By Application
- Neurology
- Hematology
- Immunology
- Critical Care
Growth Opportunity
Growing demand for plasma-derived therapies in emerging economies
As the global population continues to increase, so does the demand for plasma-derived therapies. This is especially true in emerging economies where healthcare access is expanding. The prevalence of chronic diseases such as cancer and diabetes is increasing in countries such as China and India. These diseases are increasingly treated with plasma-derived therapies, which can be more effective than conventional treatments.
Increasing investment in R & D for the development of new plasma fractionation products
Key to the growth of the Plasma Fractionation Market is the introduction of novel plasma fractionation products. Companies are investing significantly in research and development to bring new products that can treat a variety of diseases to market. This investment is especially crucial for rare disease remedies, for which there is a substantial unmet demand. New therapies for these diseases have the potential to significantly enhance patient outcomes and stimulate market expansion.
Rising adoption of subcutaneous immunoglobulin therapies
Immunodeficiencies are becoming increasingly treated with subcutaneous immunoglobulin therapies. These treatments are administered subcutaneously and are more patient-friendly than traditional intravenous treatments. Additionally, they have the potential to reduce healthcare expenditures by decreasing the need for hospitalization. Demand for plasma fractionation products will increase as subcutaneous immunoglobulin therapies become more prevalent.
Expanding use of plasma-derived products in the treatment of rare diseases
Increased utilization of plasma-derived products in the treatment of rare diseases. Although these diseases affect a limited number of patients, there is frequently a substantial unmet demand for effective treatments. As a result of the fact that plasma-derived products offer a viable treatment option for numerous rare diseases, their use is on the rise. This trend is likely to persist over the next few years, driving the demand for plasma fractionation products even higher.
Demand for point-of-care plasma fractionation devices is growing
Point-of-care plasma fractionation devices are gaining popularity due to their numerous advantages over conventional fractionation methods. These devices can produce high-quality plasma-derived products swiftly and efficiently in a variety of settings. As the demand for these devices increases, the demand for plasma fractionation products will increase proportionally.
Latest Trends
Growing adoption of nanofiltration and chromatography technologies
The increasing adoption of nanofiltration and chromatography technologies is a major trend that is shaping the Plasma Fractionation Market. These technologies have revolutionized plasma fractionation, allowing businesses to produce highly purified products with outstanding yields. To separate plasma proteins into distinct fractions, nanofiltration employs ultrafine filters, whereas chromatography employs molecular adsorbents to isolate specific proteins. In recent years, these technologies have gained popularity due to their high efficacy, reproducibility, and scalability.
Increasing use of recombinant DNA technology in plasma fractionation
Increasing use of recombinant DNA technology is a second trend that is driving the Plasma Fractionation Market. This technology enables the production of extremely purified and specific protein products, which are utilized for a variety of medical applications. Using recombinant DNA technology, genes from one organism are inserted into bacteria or yeast, which are then used to produce the desired protein product. This technology has revolutionized the plasma fractionation industry, enabling the production of numerous life-saving treatments for a broad spectrum of diseases and disorders.
The Emergence of New Plasma Fractionation Techniques
In addition to the aforementioned tendencies, the emergence of new plasma fractionation techniques is shaping the Plasma Fractionation Market. For instance, businesses are currently investigating the use of adsorption techniques, which involve the use of specialized materials to remove impurities from plasma in a selective manner. Other businesses are experimenting with membrane filtration, which uses membranes with specific pore diameters to remove unwanted molecules from plasma. In the future years, these emerging techniques are anticipated to play an increasingly vital role in the industry.
Increasing focus on developing plasma-derived products for regenerative medicine
Increasing emphasis on developing plasma-derived products for regenerative medicine is also shaping the Plasma Fractionation Market. Plasma contains numerous proteins and growth factors that can promote tissue repair and regeneration. Scientists are currently investigating the implementation of these molecules in a variety of fields, including wound healing, bone regeneration, and tissue engineering. As companies develop new products and therapies based on plasma-derived proteins and growth factors, this trend is expected to drive significant growth in the Plasma Fractionation Market.
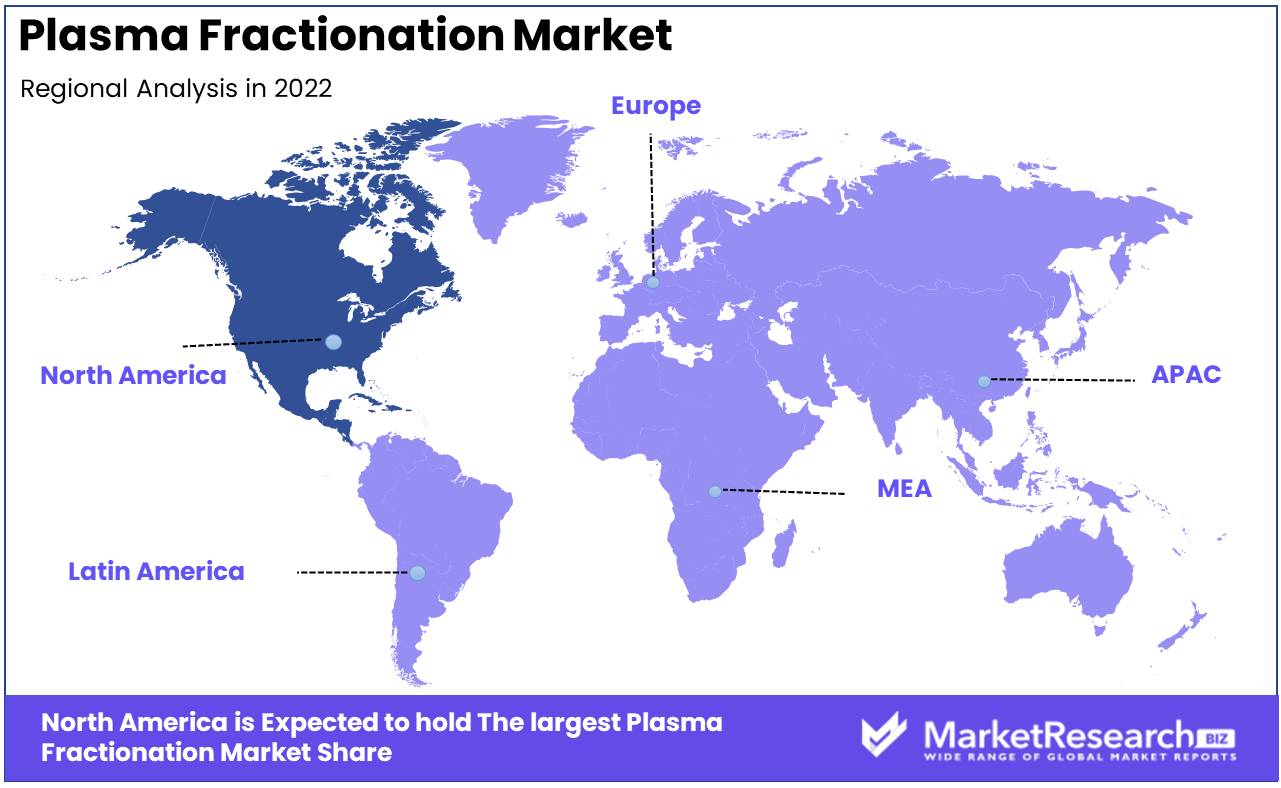
Regional Analysis
The market for Plasma-Derived Therapies Dominated by North AmericaAt the turn of the century, the market for plasma-derived therapeutics had expanded exponentially, primarily as a result of the rising prevalence of bleeding and immunologic disorders. In recent years, the plasma-derived product manufacturing and refining industry has undergone significant development. Global demand for biotherapeutic products has increased as a result of the proliferation of highly effective treatments spawned by the application of sophisticated technologies and novel techniques.
Geographically, North America dominates the plasma-derived therapies market with an approximate 45% market share. This dominance is attributable, in part, to the high uptake of these therapies and favorable reimbursement policies.
The favorable regulatory policies governing the biopharmaceutical industry contribute significantly to North America's dominant market position. In this region, plasma-derived therapies are utilized safely and effectively due to the FDA's stringent regulations. The Food and Drug Administration regulates the production, processing, distribution, and marketing of biological products, including plasma derivatives. In addition, the agency ensures that all products adhere to the guidelines for current good manufacturing practices (cGMPs).
This stringent regulatory framework has resulted in the creation of safer and more effective therapies, which have benefited patients across the country. The FDA's recommendations promote compliance and quality assurance in the biopharmaceutical industry and inspire consumer confidence in the efficacy of plasma-derived therapies.
The rapid adoption of these therapies also contributes significantly to North America's dominance in the plasma-derived therapies market. The United States is the main consumer of plasma products in North America, accounting for roughly 75% of the market share. A well-established network of distribution channels and access to sophisticated facilities and technologies that improve the production and processing efficiency of biotherapeutic products drive the increased use of these products.
Key Regions and Countries
North America
- US
- Canada
- Mexico
Western Europe
- Germany
- France
- The UK
- Spain
- Italy
- Portugal
- Ireland
- Austria
- Switzerland
- Benelux
- Nordic
- Rest of Western Europe
Eastern Europe
- Russia
- Poland
- The Czech Republic
- Greece
- Rest of Eastern Europe
APAC
- China
- Japan
- South Korea
- India
- Australia & New Zealand
- Indonesia
- Malaysia
- Philippines
- Singapore
- Thailand
- Vietnam
- Rest of APAC
Latin America
- Brazil
- Colombia
- Chile
- Argentina
- Costa Rica
- Rest of Latin America
Middle East & Africa
- Algeria
- Egypt
- Israel
- Kuwait
- Nigeria
- Saudi Arabia
- South Africa
- Turkey
- United Arab Emirates
- Rest of MEA
Key Players Analysis
CSL Behring and Grifols are the dominant companies in the global plasma fractionation market, accounting for a significant share of market revenue. Albumin, immunoglobulins, and coagulation factors are just a few of the plasma-derived products offered by CSL Behring. The business has a significant presence in North America, Europe, and the Asia-Pacific region. Grifols is an additional significant player in the plasma fractionation market with a portfolio of plasma-derived and recombinant products. The corporation is well-established in North America, Europe, and Latin America.
Shire and Octapharma are also major participants in the plasma fractionation market, offering a vast selection of plasma-derived products including clotting factors, immunoglobulins, and albumin. Shire has an extensive presence in North America and Europe, whereas Octapharma has an extensive presence in Europe, Asia-Pacific, and Latin America.
Due to their innovative products, robust distribution networks, and strategic partnerships, Kedrion Biopharma, Bio Product Laboratory, Sanquin, China Biologic Products, Baxalta, and LFB S.A. are also leaders in the plasma fractionation market. These businesses are concentrating on expanding their geographic reach and developing new plasma-derived products in order to maintain their market position.
Top Key Players in Plasma Fractionation Market
- CSL Plasma Inc.
- Grifols
- Shire (BioLife Plasma Services)
- Octapharma Plasma Inc.
- Kedrion S.p.A
- Bio Product Laboratory Ltd.
- LFB S.A.
- Biotest Pharmaceuticals Corporation
- Japan Blood Products Organization
- China Biologic Products Holdings Inc.
Recent Development
- In 2021, Grifols, for instance, has recently completed the acquisition of Biotest US Corporation, which is anticipated to position Grifols as a prominent provider of essential plasma-based medicines in the United States.
- In 2022, Octapharma introduced a new human fibrinogen concentrate in Europe. The purported safety and efficacy of the concentrate for treating bleeding and coagulation disorders make it a valuable addition to the market.
- In 2021, The approval of CSL Behring's new albumin product by the FDA is expected to expand the treatment options for rare and life-threatening conditions caused by low blood volume.
- In 2022, Takeda, an additional major actor in the plasma fractionation market, will expand its plasma fractionation facility. The facility will increase Takeda's capacity to collect plasma in the United States, resulting in a more consistent supply of vital plasma products for patients worldwide.
- In 2021, the LFB Group will initiate a Phase III clinical trial for its recombinant human fibrinogen product, increasing its efforts in the market. The product is intended for use in the treatment of bleeding disorders, and the Phase III trial represents a significant milestone for the company in its efforts to bring the product to market.
Report Scope
Report Features Description Market Value (2022) USD 35.9 Bn Forecast Revenue (2032) USD 61.6 Bn CAGR (2023-2032) 5.7% Base Year for Estimation 2022 Historic Period 2016-2022 Forecast Period 2023-2032 Report Coverage Revenue Forecast, Market Dynamics, COVID-19 Impact, Competitive Landscape, Recent Developments Segments Covered By Product Type (Immunoglobulins, Albumin, Coagulation Factor Concentrates)
By Process (Fractionation Process, Precipitation Method, Chromatography Technique, Recombinant DNA Technology)
By End Users (Hospitals And Clinics, Clinical Research Laboratories, Academic Institutes)
By Application (Neurology, Hematology, Immunology, Critical Care)Regional Analysis North America – The US, Canada, & Mexico; Western Europe – Germany, France, The UK, Spain, Italy, Portugal, Ireland, Austria, Switzerland, Benelux, Nordic, & Rest of Western Europe; Eastern Europe – Russia, Poland, The Czech Republic, Greece, & Rest of Eastern Europe; APAC – China, Japan, South Korea, India, Australia & New Zealand, Indonesia, Malaysia, Philippines, Singapore, Thailand, Vietnam, & Rest of APAC; Latin America – Brazil, Colombia, Chile, Argentina, Costa Rica, & Rest of Latin America; the Middle East & Africa – Algeria, Egypt, Israel, Kuwait, Nigeria, Saudi Arabia, South Africa, Turkey, United Arab Emirates, & Rest of MEA Competitive Landscape CSL Plasma Inc., Grifols, Shire (BioLife Plasma Services), Octapharma Plasma Inc., Kedrion S.p.A, Bio Product Laboratory Ltd., LFB S.A., Biotest Pharmaceuticals Corporation, Japan Blood Products Organization, China Biologic Products Holdings Inc. Customization Scope Customization for segments, region/country-level will be provided. Moreover, additional customization can be done based on the requirements. Purchase Options We have three licenses to opt for Single User License, Multi-User License (Up to 5 Users), Corporate Use License (Unlimited User and Printable PDF) -
- 1. Executive Summary
- 1.1. Definition
- 1.2. Taxonomy
- 1.3. Research Scope
- 1.4. Key Analysis
- 1.5. Key Findings by Major Segments
- 1.6. Top strategies by Major Players
- 2. Global Plasma Fractionation Market Overview
- 2.1. Plasma Fractionation Market Dynamics
- 2.1.1. Drivers
- 2.1.2. Opportunities
- 2.1.3. Restraints
- 2.1.4. Challenges
- 2.2. Macro-economic Factors
- 2.3. Regulatory Framework
- 2.4. Market Investment Feasibility Index
- 2.5. PEST Analysis
- 2.6. PORTER’S Five Force Analysis
- 2.7. Drivers & Restraints Impact Analysis
- 2.8. Industry Chain Analysis
- 2.9. Cost Structure Analysis
- 2.10. Marketing Strategy
- 2.11. Russia-Ukraine War Impact Analysis
- 2.12. Opportunity Map Analysis
- 2.13. Market Competition Scenario Analysis
- 2.14. Product Life Cycle Analysis
- 2.15. Opportunity Orbits
- 2.16. Manufacturer Intensity Map
- 2.17. Major Companies sales by Value & Volume
- 2.1. Plasma Fractionation Market Dynamics
- 3. Global Plasma Fractionation Market Analysis, Opportunity and Forecast, 2016-2032
- 3.1. Global Plasma Fractionation Market Analysis, 2016-2021
- 3.2. Global Plasma Fractionation Market Opportunity and Forecast, 2023-2032
- 3.3. Global Plasma Fractionation Market Analysis, Opportunity and Forecast, By By Product Type, 2016-2032
- 3.3.1. Global Plasma Fractionation Market Analysis by By Product Type: Introduction
- 3.3.2. Market Size Absolute $ Opportunity Analysis and Forecast, By By Product Type, 2016-2032
- 3.3.3. Immunoglobulins
- 3.3.4. Albumin
- 3.3.5. Coagulation Factor Concentrates
- 3.4. Global Plasma Fractionation Market Analysis, Opportunity and Forecast, By By Process, 2016-2032
- 3.4.1. Global Plasma Fractionation Market Analysis by By Process: Introduction
- 3.4.2. Market Size Absolute $ Opportunity Analysis and Forecast, By By Process, 2016-2032
- 3.4.3. Fractionation Process
- 3.4.4. Precipitation Method
- 3.4.5. Chromatography Technique
- 3.4.6. Recombinant DNA Technology
- 3.5. Global Plasma Fractionation Market Analysis, Opportunity and Forecast, By By End User, 2016-2032
- 3.5.1. Global Plasma Fractionation Market Analysis by By End User: Introduction
- 3.5.2. Market Size Absolute $ Opportunity Analysis and Forecast, By By End User, 2016-2032
- 3.5.3. Hospitals And Clinics
- 3.5.4. Clinical Research Laboratories
- 3.5.5. Academic Institutes
- 3.6. Global Plasma Fractionation Market Analysis, Opportunity and Forecast, By By Application, 2016-2032
- 3.6.1. Global Plasma Fractionation Market Analysis by By Application: Introduction
- 3.6.2. Market Size Absolute $ Opportunity Analysis and Forecast, By By Application, 2016-2032
- 3.6.3. Neurology
- 3.6.4. Hematology
- 3.6.5. Immunology
- 3.6.6. Critical Care
- 4. North America Plasma Fractionation Market Analysis, Opportunity and Forecast, 2016-2032
- 4.1. North America Plasma Fractionation Market Analysis, 2016-2021
- 4.2. North America Plasma Fractionation Market Opportunity and Forecast, 2023-2032
- 4.3. North America Plasma Fractionation Market Analysis, Opportunity and Forecast, By By Product Type, 2016-2032
- 4.3.1. North America Plasma Fractionation Market Analysis by By Product Type: Introduction
- 4.3.2. Market Size Absolute $ Opportunity Analysis and Forecast, By By Product Type, 2016-2032
- 4.3.3. Immunoglobulins
- 4.3.4. Albumin
- 4.3.5. Coagulation Factor Concentrates
- 4.4. North America Plasma Fractionation Market Analysis, Opportunity and Forecast, By By Process, 2016-2032
- 4.4.1. North America Plasma Fractionation Market Analysis by By Process: Introduction
- 4.4.2. Market Size Absolute $ Opportunity Analysis and Forecast, By By Process, 2016-2032
- 4.4.3. Fractionation Process
- 4.4.4. Precipitation Method
- 4.4.5. Chromatography Technique
- 4.4.6. Recombinant DNA Technology
- 4.5. North America Plasma Fractionation Market Analysis, Opportunity and Forecast, By By End User, 2016-2032
- 4.5.1. North America Plasma Fractionation Market Analysis by By End User: Introduction
- 4.5.2. Market Size Absolute $ Opportunity Analysis and Forecast, By By End User, 2016-2032
- 4.5.3. Hospitals And Clinics
- 4.5.4. Clinical Research Laboratories
- 4.5.5. Academic Institutes
- 4.6. North America Plasma Fractionation Market Analysis, Opportunity and Forecast, By By Application, 2016-2032
- 4.6.1. North America Plasma Fractionation Market Analysis by By Application: Introduction
- 4.6.2. Market Size Absolute $ Opportunity Analysis and Forecast, By By Application, 2016-2032
- 4.6.3. Neurology
- 4.6.4. Hematology
- 4.6.5. Immunology
- 4.6.6. Critical Care
- 4.7. North America Plasma Fractionation Market Analysis, Opportunity and Forecast, By Country , 2016-2032
- 4.7.1. North America Plasma Fractionation Market Analysis by Country : Introduction
- 4.7.2. Market Size Absolute $ Opportunity Analysis and Forecast, Country , 2016-2032
- 4.7.2.1. The US
- 4.7.2.2. Canada
- 4.7.2.3. Mexico
- 5. Western Europe Plasma Fractionation Market Analysis, Opportunity and Forecast, 2016-2032
- 5.1. Western Europe Plasma Fractionation Market Analysis, 2016-2021
- 5.2. Western Europe Plasma Fractionation Market Opportunity and Forecast, 2023-2032
- 5.3. Western Europe Plasma Fractionation Market Analysis, Opportunity and Forecast, By By Product Type, 2016-2032
- 5.3.1. Western Europe Plasma Fractionation Market Analysis by By Product Type: Introduction
- 5.3.2. Market Size Absolute $ Opportunity Analysis and Forecast, By By Product Type, 2016-2032
- 5.3.3. Immunoglobulins
- 5.3.4. Albumin
- 5.3.5. Coagulation Factor Concentrates
- 5.4. Western Europe Plasma Fractionation Market Analysis, Opportunity and Forecast, By By Process, 2016-2032
- 5.4.1. Western Europe Plasma Fractionation Market Analysis by By Process: Introduction
- 5.4.2. Market Size Absolute $ Opportunity Analysis and Forecast, By By Process, 2016-2032
- 5.4.3. Fractionation Process
- 5.4.4. Precipitation Method
- 5.4.5. Chromatography Technique
- 5.4.6. Recombinant DNA Technology
- 5.5. Western Europe Plasma Fractionation Market Analysis, Opportunity and Forecast, By By End User, 2016-2032
- 5.5.1. Western Europe Plasma Fractionation Market Analysis by By End User: Introduction
- 5.5.2. Market Size Absolute $ Opportunity Analysis and Forecast, By By End User, 2016-2032
- 5.5.3. Hospitals And Clinics
- 5.5.4. Clinical Research Laboratories
- 5.5.5. Academic Institutes
- 5.6. Western Europe Plasma Fractionation Market Analysis, Opportunity and Forecast, By By Application, 2016-2032
- 5.6.1. Western Europe Plasma Fractionation Market Analysis by By Application: Introduction
- 5.6.2. Market Size Absolute $ Opportunity Analysis and Forecast, By By Application, 2016-2032
- 5.6.3. Neurology
- 5.6.4. Hematology
- 5.6.5. Immunology
- 5.6.6. Critical Care
- 5.7. Western Europe Plasma Fractionation Market Analysis, Opportunity and Forecast, By Country , 2016-2032
- 5.7.1. Western Europe Plasma Fractionation Market Analysis by Country : Introduction
- 5.7.2. Market Size Absolute $ Opportunity Analysis and Forecast, Country , 2016-2032
- 5.7.2.1. Germany
- 5.7.2.2. France
- 5.7.2.3. The UK
- 5.7.2.4. Spain
- 5.7.2.5. Italy
- 5.7.2.6. Portugal
- 5.7.2.7. Ireland
- 5.7.2.8. Austria
- 5.7.2.9. Switzerland
- 5.7.2.10. Benelux
- 5.7.2.11. Nordic
- 5.7.2.12. Rest of Western Europe
- 6. Eastern Europe Plasma Fractionation Market Analysis, Opportunity and Forecast, 2016-2032
- 6.1. Eastern Europe Plasma Fractionation Market Analysis, 2016-2021
- 6.2. Eastern Europe Plasma Fractionation Market Opportunity and Forecast, 2023-2032
- 6.3. Eastern Europe Plasma Fractionation Market Analysis, Opportunity and Forecast, By By Product Type, 2016-2032
- 6.3.1. Eastern Europe Plasma Fractionation Market Analysis by By Product Type: Introduction
- 6.3.2. Market Size Absolute $ Opportunity Analysis and Forecast, By By Product Type, 2016-2032
- 6.3.3. Immunoglobulins
- 6.3.4. Albumin
- 6.3.5. Coagulation Factor Concentrates
- 6.4. Eastern Europe Plasma Fractionation Market Analysis, Opportunity and Forecast, By By Process, 2016-2032
- 6.4.1. Eastern Europe Plasma Fractionation Market Analysis by By Process: Introduction
- 6.4.2. Market Size Absolute $ Opportunity Analysis and Forecast, By By Process, 2016-2032
- 6.4.3. Fractionation Process
- 6.4.4. Precipitation Method
- 6.4.5. Chromatography Technique
- 6.4.6. Recombinant DNA Technology
- 6.5. Eastern Europe Plasma Fractionation Market Analysis, Opportunity and Forecast, By By End User, 2016-2032
- 6.5.1. Eastern Europe Plasma Fractionation Market Analysis by By End User: Introduction
- 6.5.2. Market Size Absolute $ Opportunity Analysis and Forecast, By By End User, 2016-2032
- 6.5.3. Hospitals And Clinics
- 6.5.4. Clinical Research Laboratories
- 6.5.5. Academic Institutes
- 6.6. Eastern Europe Plasma Fractionation Market Analysis, Opportunity and Forecast, By By Application, 2016-2032
- 6.6.1. Eastern Europe Plasma Fractionation Market Analysis by By Application: Introduction
- 6.6.2. Market Size Absolute $ Opportunity Analysis and Forecast, By By Application, 2016-2032
- 6.6.3. Neurology
- 6.6.4. Hematology
- 6.6.5. Immunology
- 6.6.6. Critical Care
- 6.7. Eastern Europe Plasma Fractionation Market Analysis, Opportunity and Forecast, By Country , 2016-2032
- 6.7.1. Eastern Europe Plasma Fractionation Market Analysis by Country : Introduction
- 6.7.2. Market Size Absolute $ Opportunity Analysis and Forecast, Country , 2016-2032
- 6.7.2.1. Russia
- 6.7.2.2. Poland
- 6.7.2.3. The Czech Republic
- 6.7.2.4. Greece
- 6.7.2.5. Rest of Eastern Europe
- 7. APAC Plasma Fractionation Market Analysis, Opportunity and Forecast, 2016-2032
- 7.1. APAC Plasma Fractionation Market Analysis, 2016-2021
- 7.2. APAC Plasma Fractionation Market Opportunity and Forecast, 2023-2032
- 7.3. APAC Plasma Fractionation Market Analysis, Opportunity and Forecast, By By Product Type, 2016-2032
- 7.3.1. APAC Plasma Fractionation Market Analysis by By Product Type: Introduction
- 7.3.2. Market Size Absolute $ Opportunity Analysis and Forecast, By By Product Type, 2016-2032
- 7.3.3. Immunoglobulins
- 7.3.4. Albumin
- 7.3.5. Coagulation Factor Concentrates
- 7.4. APAC Plasma Fractionation Market Analysis, Opportunity and Forecast, By By Process, 2016-2032
- 7.4.1. APAC Plasma Fractionation Market Analysis by By Process: Introduction
- 7.4.2. Market Size Absolute $ Opportunity Analysis and Forecast, By By Process, 2016-2032
- 7.4.3. Fractionation Process
- 7.4.4. Precipitation Method
- 7.4.5. Chromatography Technique
- 7.4.6. Recombinant DNA Technology
- 7.5. APAC Plasma Fractionation Market Analysis, Opportunity and Forecast, By By End User, 2016-2032
- 7.5.1. APAC Plasma Fractionation Market Analysis by By End User: Introduction
- 7.5.2. Market Size Absolute $ Opportunity Analysis and Forecast, By By End User, 2016-2032
- 7.5.3. Hospitals And Clinics
- 7.5.4. Clinical Research Laboratories
- 7.5.5. Academic Institutes
- 7.6. APAC Plasma Fractionation Market Analysis, Opportunity and Forecast, By By Application, 2016-2032
- 7.6.1. APAC Plasma Fractionation Market Analysis by By Application: Introduction
- 7.6.2. Market Size Absolute $ Opportunity Analysis and Forecast, By By Application, 2016-2032
- 7.6.3. Neurology
- 7.6.4. Hematology
- 7.6.5. Immunology
- 7.6.6. Critical Care
- 7.7. APAC Plasma Fractionation Market Analysis, Opportunity and Forecast, By Country , 2016-2032
- 7.7.1. APAC Plasma Fractionation Market Analysis by Country : Introduction
- 7.7.2. Market Size Absolute $ Opportunity Analysis and Forecast, Country , 2016-2032
- 7.7.2.1. China
- 7.7.2.2. Japan
- 7.7.2.3. South Korea
- 7.7.2.4. India
- 7.7.2.5. Australia & New Zeland
- 7.7.2.6. Indonesia
- 7.7.2.7. Malaysia
- 7.7.2.8. Philippines
- 7.7.2.9. Singapore
- 7.7.2.10. Thailand
- 7.7.2.11. Vietnam
- 7.7.2.12. Rest of APAC
- 8. Latin America Plasma Fractionation Market Analysis, Opportunity and Forecast, 2016-2032
- 8.1. Latin America Plasma Fractionation Market Analysis, 2016-2021
- 8.2. Latin America Plasma Fractionation Market Opportunity and Forecast, 2023-2032
- 8.3. Latin America Plasma Fractionation Market Analysis, Opportunity and Forecast, By By Product Type, 2016-2032
- 8.3.1. Latin America Plasma Fractionation Market Analysis by By Product Type: Introduction
- 8.3.2. Market Size Absolute $ Opportunity Analysis and Forecast, By By Product Type, 2016-2032
- 8.3.3. Immunoglobulins
- 8.3.4. Albumin
- 8.3.5. Coagulation Factor Concentrates
- 8.4. Latin America Plasma Fractionation Market Analysis, Opportunity and Forecast, By By Process, 2016-2032
- 8.4.1. Latin America Plasma Fractionation Market Analysis by By Process: Introduction
- 8.4.2. Market Size Absolute $ Opportunity Analysis and Forecast, By By Process, 2016-2032
- 8.4.3. Fractionation Process
- 8.4.4. Precipitation Method
- 8.4.5. Chromatography Technique
- 8.4.6. Recombinant DNA Technology
- 8.5. Latin America Plasma Fractionation Market Analysis, Opportunity and Forecast, By By End User, 2016-2032
- 8.5.1. Latin America Plasma Fractionation Market Analysis by By End User: Introduction
- 8.5.2. Market Size Absolute $ Opportunity Analysis and Forecast, By By End User, 2016-2032
- 8.5.3. Hospitals And Clinics
- 8.5.4. Clinical Research Laboratories
- 8.5.5. Academic Institutes
- 8.6. Latin America Plasma Fractionation Market Analysis, Opportunity and Forecast, By By Application, 2016-2032
- 8.6.1. Latin America Plasma Fractionation Market Analysis by By Application: Introduction
- 8.6.2. Market Size Absolute $ Opportunity Analysis and Forecast, By By Application, 2016-2032
- 8.6.3. Neurology
- 8.6.4. Hematology
- 8.6.5. Immunology
- 8.6.6. Critical Care
- 8.7. Latin America Plasma Fractionation Market Analysis, Opportunity and Forecast, By Country , 2016-2032
- 8.7.1. Latin America Plasma Fractionation Market Analysis by Country : Introduction
- 8.7.2. Market Size Absolute $ Opportunity Analysis and Forecast, Country , 2016-2032
- 8.7.2.1. Brazil
- 8.7.2.2. Colombia
- 8.7.2.3. Chile
- 8.7.2.4. Argentina
- 8.7.2.5. Costa Rica
- 8.7.2.6. Rest of Latin America
- 9. Middle East & Africa Plasma Fractionation Market Analysis, Opportunity and Forecast, 2016-2032
- 9.1. Middle East & Africa Plasma Fractionation Market Analysis, 2016-2021
- 9.2. Middle East & Africa Plasma Fractionation Market Opportunity and Forecast, 2023-2032
- 9.3. Middle East & Africa Plasma Fractionation Market Analysis, Opportunity and Forecast, By By Product Type, 2016-2032
- 9.3.1. Middle East & Africa Plasma Fractionation Market Analysis by By Product Type: Introduction
- 9.3.2. Market Size Absolute $ Opportunity Analysis and Forecast, By By Product Type, 2016-2032
- 9.3.3. Immunoglobulins
- 9.3.4. Albumin
- 9.3.5. Coagulation Factor Concentrates
- 9.4. Middle East & Africa Plasma Fractionation Market Analysis, Opportunity and Forecast, By By Process, 2016-2032
- 9.4.1. Middle East & Africa Plasma Fractionation Market Analysis by By Process: Introduction
- 9.4.2. Market Size Absolute $ Opportunity Analysis and Forecast, By By Process, 2016-2032
- 9.4.3. Fractionation Process
- 9.4.4. Precipitation Method
- 9.4.5. Chromatography Technique
- 9.4.6. Recombinant DNA Technology
- 9.5. Middle East & Africa Plasma Fractionation Market Analysis, Opportunity and Forecast, By By End User, 2016-2032
- 9.5.1. Middle East & Africa Plasma Fractionation Market Analysis by By End User: Introduction
- 9.5.2. Market Size Absolute $ Opportunity Analysis and Forecast, By By End User, 2016-2032
- 9.5.3. Hospitals And Clinics
- 9.5.4. Clinical Research Laboratories
- 9.5.5. Academic Institutes
- 9.6. Middle East & Africa Plasma Fractionation Market Analysis, Opportunity and Forecast, By By Application, 2016-2032
- 9.6.1. Middle East & Africa Plasma Fractionation Market Analysis by By Application: Introduction
- 9.6.2. Market Size Absolute $ Opportunity Analysis and Forecast, By By Application, 2016-2032
- 9.6.3. Neurology
- 9.6.4. Hematology
- 9.6.5. Immunology
- 9.6.6. Critical Care
- 9.7. Middle East & Africa Plasma Fractionation Market Analysis, Opportunity and Forecast, By Country , 2016-2032
- 9.7.1. Middle East & Africa Plasma Fractionation Market Analysis by Country : Introduction
- 9.7.2. Market Size Absolute $ Opportunity Analysis and Forecast, Country , 2016-2032
- 9.7.2.1. Algeria
- 9.7.2.2. Egypt
- 9.7.2.3. Israel
- 9.7.2.4. Kuwait
- 9.7.2.5. Nigeria
- 9.7.2.6. Saudi Arabia
- 9.7.2.7. South Africa
- 9.7.2.8. Turkey
- 9.7.2.9. The UAE
- 9.7.2.10. Rest of MEA
- 10. Global Plasma Fractionation Market Analysis, Opportunity and Forecast, By Region , 2016-2032
- 10.1. Global Plasma Fractionation Market Analysis by Region : Introduction
- 10.2. Market Size Absolute $ Opportunity Analysis and Forecast, By Region , 2016-2032
- 10.2.1. North America
- 10.2.2. Western Europe
- 10.2.3. Eastern Europe
- 10.2.4. APAC
- 10.2.5. Latin America
- 10.2.6. Middle East & Africa
- 11. Global Plasma Fractionation Market Competitive Landscape, Market Share Analysis, and Company Profiles
- 11.1. Market Share Analysis
- 11.2. Company Profiles
- 11.3. CSL Plasma Inc.
- 11.3.1. Company Overview
- 11.3.2. Financial Highlights
- 11.3.3. Product Portfolio
- 11.3.4. SWOT Analysis
- 11.3.5. Key Strategies and Developments
- 11.4. Grifols
- 11.4.1. Company Overview
- 11.4.2. Financial Highlights
- 11.4.3. Product Portfolio
- 11.4.4. SWOT Analysis
- 11.4.5. Key Strategies and Developments
- 11.5. Shire (BioLife Plasma Services)
- 11.5.1. Company Overview
- 11.5.2. Financial Highlights
- 11.5.3. Product Portfolio
- 11.5.4. SWOT Analysis
- 11.5.5. Key Strategies and Developments
- 11.6. Octapharma Plasma Inc.
- 11.6.1. Company Overview
- 11.6.2. Financial Highlights
- 11.6.3. Product Portfolio
- 11.6.4. SWOT Analysis
- 11.6.5. Key Strategies and Developments
- 11.7. Kedrion S.p.A
- 11.7.1. Company Overview
- 11.7.2. Financial Highlights
- 11.7.3. Product Portfolio
- 11.7.4. SWOT Analysis
- 11.7.5. Key Strategies and Developments
- 11.8. Bio Product Laboratory Ltd.
- 11.8.1. Company Overview
- 11.8.2. Financial Highlights
- 11.8.3. Product Portfolio
- 11.8.4. SWOT Analysis
- 11.8.5. Key Strategies and Developments
- 11.9. LFB S.A.
- 11.9.1. Company Overview
- 11.9.2. Financial Highlights
- 11.9.3. Product Portfolio
- 11.9.4. SWOT Analysis
- 11.9.5. Key Strategies and Developments
- 11.10. Biotest Pharmaceuticals Corporation
- 11.10.1. Company Overview
- 11.10.2. Financial Highlights
- 11.10.3. Product Portfolio
- 11.10.4. SWOT Analysis
- 11.10.5. Key Strategies and Developments
- 11.11. Japan Blood Products Organization
- 11.11.1. Company Overview
- 11.11.2. Financial Highlights
- 11.11.3. Product Portfolio
- 11.11.4. SWOT Analysis
- 11.11.5. Key Strategies and Developments
- 11.12. China Biologic Products Holdings Inc.
- 11.12.1. Company Overview
- 11.12.2. Financial Highlights
- 11.12.3. Product Portfolio
- 11.12.4. SWOT Analysis
- 11.12.5. Key Strategies and Developments
- 12. Assumptions and Acronyms
- 13. Research Methodology
- 14. Contact
List of Figures
- Figure 1: Global Plasma Fractionation Market Revenue (US$ Mn) Market Share by By Product Type in 2022
- Figure 2: Global Plasma Fractionation Market Attractiveness Analysis by By Product Type, 2016-2032
- Figure 3: Global Plasma Fractionation Market Revenue (US$ Mn) Market Share by By Processin 2022
- Figure 4: Global Plasma Fractionation Market Attractiveness Analysis by By Process, 2016-2032
- Figure 5: Global Plasma Fractionation Market Revenue (US$ Mn) Market Share by By End Userin 2022
- Figure 6: Global Plasma Fractionation Market Attractiveness Analysis by By End User, 2016-2032
- Figure 7: Global Plasma Fractionation Market Revenue (US$ Mn) Market Share by By Applicationin 2022
- Figure 8: Global Plasma Fractionation Market Attractiveness Analysis by By Application, 2016-2032
- Figure 9: Global Plasma Fractionation Market Revenue (US$ Mn) Market Share by Region in 2022
- Figure 10: Global Plasma Fractionation Market Attractiveness Analysis by Region, 2016-2032
- Figure 11: Global Plasma Fractionation Market Revenue (US$ Mn) (2016-2032)
- Figure 12: Global Plasma Fractionation Market Revenue (US$ Mn) Comparison by Region (2016-2032)
- Figure 13: Global Plasma Fractionation Market Revenue (US$ Mn) Comparison by By Product Type (2016-2032)
- Figure 14: Global Plasma Fractionation Market Revenue (US$ Mn) Comparison by By Process (2016-2032)
- Figure 15: Global Plasma Fractionation Market Revenue (US$ Mn) Comparison by By End User (2016-2032)
- Figure 16: Global Plasma Fractionation Market Revenue (US$ Mn) Comparison by By Application (2016-2032)
- Figure 17: Global Plasma Fractionation Market Y-o-Y Growth Rate Comparison by Region (2016-2032)
- Figure 18: Global Plasma Fractionation Market Y-o-Y Growth Rate Comparison by By Product Type (2016-2032)
- Figure 19: Global Plasma Fractionation Market Y-o-Y Growth Rate Comparison by By Process (2016-2032)
- Figure 20: Global Plasma Fractionation Market Y-o-Y Growth Rate Comparison by By End User (2016-2032)
- Figure 21: Global Plasma Fractionation Market Y-o-Y Growth Rate Comparison by By Application (2016-2032)
- Figure 22: Global Plasma Fractionation Market Share Comparison by Region (2016-2032)
- Figure 23: Global Plasma Fractionation Market Share Comparison by By Product Type (2016-2032)
- Figure 24: Global Plasma Fractionation Market Share Comparison by By Process (2016-2032)
- Figure 25: Global Plasma Fractionation Market Share Comparison by By End User (2016-2032)
- Figure 26: Global Plasma Fractionation Market Share Comparison by By Application (2016-2032)
- Figure 27: North America Plasma Fractionation Market Revenue (US$ Mn) Market Share by By Product Typein 2022
- Figure 28: North America Plasma Fractionation Market Attractiveness Analysis by By Product Type, 2016-2032
- Figure 29: North America Plasma Fractionation Market Revenue (US$ Mn) Market Share by By Processin 2022
- Figure 30: North America Plasma Fractionation Market Attractiveness Analysis by By Process, 2016-2032
- Figure 31: North America Plasma Fractionation Market Revenue (US$ Mn) Market Share by By End Userin 2022
- Figure 32: North America Plasma Fractionation Market Attractiveness Analysis by By End User, 2016-2032
- Figure 33: North America Plasma Fractionation Market Revenue (US$ Mn) Market Share by By Applicationin 2022
- Figure 34: North America Plasma Fractionation Market Attractiveness Analysis by By Application, 2016-2032
- Figure 35: North America Plasma Fractionation Market Revenue (US$ Mn) Market Share by Country in 2022
- Figure 36: North America Plasma Fractionation Market Attractiveness Analysis by Country, 2016-2032
- Figure 37: North America Plasma Fractionation Market Revenue (US$ Mn) (2016-2032)
- Figure 38: North America Plasma Fractionation Market Revenue (US$ Mn) Comparison by Country (2016-2032)
- Figure 39: North America Plasma Fractionation Market Revenue (US$ Mn) Comparison by By Product Type (2016-2032)
- Figure 40: North America Plasma Fractionation Market Revenue (US$ Mn) Comparison by By Process (2016-2032)
- Figure 41: North America Plasma Fractionation Market Revenue (US$ Mn) Comparison by By End User (2016-2032)
- Figure 42: North America Plasma Fractionation Market Revenue (US$ Mn) Comparison by By Application (2016-2032)
- Figure 43: North America Plasma Fractionation Market Y-o-Y Growth Rate Comparison by Country (2016-2032)
- Figure 44: North America Plasma Fractionation Market Y-o-Y Growth Rate Comparison by By Product Type (2016-2032)
- Figure 45: North America Plasma Fractionation Market Y-o-Y Growth Rate Comparison by By Process (2016-2032)
- Figure 46: North America Plasma Fractionation Market Y-o-Y Growth Rate Comparison by By End User (2016-2032)
- Figure 47: North America Plasma Fractionation Market Y-o-Y Growth Rate Comparison by By Application (2016-2032)
- Figure 48: North America Plasma Fractionation Market Share Comparison by Country (2016-2032)
- Figure 49: North America Plasma Fractionation Market Share Comparison by By Product Type (2016-2032)
- Figure 50: North America Plasma Fractionation Market Share Comparison by By Process (2016-2032)
- Figure 51: North America Plasma Fractionation Market Share Comparison by By End User (2016-2032)
- Figure 52: North America Plasma Fractionation Market Share Comparison by By Application (2016-2032)
- Figure 53: Western Europe Plasma Fractionation Market Revenue (US$ Mn) Market Share by By Product Typein 2022
- Figure 54: Western Europe Plasma Fractionation Market Attractiveness Analysis by By Product Type, 2016-2032
- Figure 55: Western Europe Plasma Fractionation Market Revenue (US$ Mn) Market Share by By Processin 2022
- Figure 56: Western Europe Plasma Fractionation Market Attractiveness Analysis by By Process, 2016-2032
- Figure 57: Western Europe Plasma Fractionation Market Revenue (US$ Mn) Market Share by By End Userin 2022
- Figure 58: Western Europe Plasma Fractionation Market Attractiveness Analysis by By End User, 2016-2032
- Figure 59: Western Europe Plasma Fractionation Market Revenue (US$ Mn) Market Share by By Applicationin 2022
- Figure 60: Western Europe Plasma Fractionation Market Attractiveness Analysis by By Application, 2016-2032
- Figure 61: Western Europe Plasma Fractionation Market Revenue (US$ Mn) Market Share by Country in 2022
- Figure 62: Western Europe Plasma Fractionation Market Attractiveness Analysis by Country, 2016-2032
- Figure 63: Western Europe Plasma Fractionation Market Revenue (US$ Mn) (2016-2032)
- Figure 64: Western Europe Plasma Fractionation Market Revenue (US$ Mn) Comparison by Country (2016-2032)
- Figure 65: Western Europe Plasma Fractionation Market Revenue (US$ Mn) Comparison by By Product Type (2016-2032)
- Figure 66: Western Europe Plasma Fractionation Market Revenue (US$ Mn) Comparison by By Process (2016-2032)
- Figure 67: Western Europe Plasma Fractionation Market Revenue (US$ Mn) Comparison by By End User (2016-2032)
- Figure 68: Western Europe Plasma Fractionation Market Revenue (US$ Mn) Comparison by By Application (2016-2032)
- Figure 69: Western Europe Plasma Fractionation Market Y-o-Y Growth Rate Comparison by Country (2016-2032)
- Figure 70: Western Europe Plasma Fractionation Market Y-o-Y Growth Rate Comparison by By Product Type (2016-2032)
- Figure 71: Western Europe Plasma Fractionation Market Y-o-Y Growth Rate Comparison by By Process (2016-2032)
- Figure 72: Western Europe Plasma Fractionation Market Y-o-Y Growth Rate Comparison by By End User (2016-2032)
- Figure 73: Western Europe Plasma Fractionation Market Y-o-Y Growth Rate Comparison by By Application (2016-2032)
- Figure 74: Western Europe Plasma Fractionation Market Share Comparison by Country (2016-2032)
- Figure 75: Western Europe Plasma Fractionation Market Share Comparison by By Product Type (2016-2032)
- Figure 76: Western Europe Plasma Fractionation Market Share Comparison by By Process (2016-2032)
- Figure 77: Western Europe Plasma Fractionation Market Share Comparison by By End User (2016-2032)
- Figure 78: Western Europe Plasma Fractionation Market Share Comparison by By Application (2016-2032)
- Figure 79: Eastern Europe Plasma Fractionation Market Revenue (US$ Mn) Market Share by By Product Typein 2022
- Figure 80: Eastern Europe Plasma Fractionation Market Attractiveness Analysis by By Product Type, 2016-2032
- Figure 81: Eastern Europe Plasma Fractionation Market Revenue (US$ Mn) Market Share by By Processin 2022
- Figure 82: Eastern Europe Plasma Fractionation Market Attractiveness Analysis by By Process, 2016-2032
- Figure 83: Eastern Europe Plasma Fractionation Market Revenue (US$ Mn) Market Share by By End Userin 2022
- Figure 84: Eastern Europe Plasma Fractionation Market Attractiveness Analysis by By End User, 2016-2032
- Figure 85: Eastern Europe Plasma Fractionation Market Revenue (US$ Mn) Market Share by By Applicationin 2022
- Figure 86: Eastern Europe Plasma Fractionation Market Attractiveness Analysis by By Application, 2016-2032
- Figure 87: Eastern Europe Plasma Fractionation Market Revenue (US$ Mn) Market Share by Country in 2022
- Figure 88: Eastern Europe Plasma Fractionation Market Attractiveness Analysis by Country, 2016-2032
- Figure 89: Eastern Europe Plasma Fractionation Market Revenue (US$ Mn) (2016-2032)
- Figure 90: Eastern Europe Plasma Fractionation Market Revenue (US$ Mn) Comparison by Country (2016-2032)
- Figure 91: Eastern Europe Plasma Fractionation Market Revenue (US$ Mn) Comparison by By Product Type (2016-2032)
- Figure 92: Eastern Europe Plasma Fractionation Market Revenue (US$ Mn) Comparison by By Process (2016-2032)
- Figure 93: Eastern Europe Plasma Fractionation Market Revenue (US$ Mn) Comparison by By End User (2016-2032)
- Figure 94: Eastern Europe Plasma Fractionation Market Revenue (US$ Mn) Comparison by By Application (2016-2032)
- Figure 95: Eastern Europe Plasma Fractionation Market Y-o-Y Growth Rate Comparison by Country (2016-2032)
- Figure 96: Eastern Europe Plasma Fractionation Market Y-o-Y Growth Rate Comparison by By Product Type (2016-2032)
- Figure 97: Eastern Europe Plasma Fractionation Market Y-o-Y Growth Rate Comparison by By Process (2016-2032)
- Figure 98: Eastern Europe Plasma Fractionation Market Y-o-Y Growth Rate Comparison by By End User (2016-2032)
- Figure 99: Eastern Europe Plasma Fractionation Market Y-o-Y Growth Rate Comparison by By Application (2016-2032)
- Figure 100: Eastern Europe Plasma Fractionation Market Share Comparison by Country (2016-2032)
- Figure 101: Eastern Europe Plasma Fractionation Market Share Comparison by By Product Type (2016-2032)
- Figure 102: Eastern Europe Plasma Fractionation Market Share Comparison by By Process (2016-2032)
- Figure 103: Eastern Europe Plasma Fractionation Market Share Comparison by By End User (2016-2032)
- Figure 104: Eastern Europe Plasma Fractionation Market Share Comparison by By Application (2016-2032)
- Figure 105: APAC Plasma Fractionation Market Revenue (US$ Mn) Market Share by By Product Typein 2022
- Figure 106: APAC Plasma Fractionation Market Attractiveness Analysis by By Product Type, 2016-2032
- Figure 107: APAC Plasma Fractionation Market Revenue (US$ Mn) Market Share by By Processin 2022
- Figure 108: APAC Plasma Fractionation Market Attractiveness Analysis by By Process, 2016-2032
- Figure 109: APAC Plasma Fractionation Market Revenue (US$ Mn) Market Share by By End Userin 2022
- Figure 110: APAC Plasma Fractionation Market Attractiveness Analysis by By End User, 2016-2032
- Figure 111: APAC Plasma Fractionation Market Revenue (US$ Mn) Market Share by By Applicationin 2022
- Figure 112: APAC Plasma Fractionation Market Attractiveness Analysis by By Application, 2016-2032
- Figure 113: APAC Plasma Fractionation Market Revenue (US$ Mn) Market Share by Country in 2022
- Figure 114: APAC Plasma Fractionation Market Attractiveness Analysis by Country, 2016-2032
- Figure 115: APAC Plasma Fractionation Market Revenue (US$ Mn) (2016-2032)
- Figure 116: APAC Plasma Fractionation Market Revenue (US$ Mn) Comparison by Country (2016-2032)
- Figure 117: APAC Plasma Fractionation Market Revenue (US$ Mn) Comparison by By Product Type (2016-2032)
- Figure 118: APAC Plasma Fractionation Market Revenue (US$ Mn) Comparison by By Process (2016-2032)
- Figure 119: APAC Plasma Fractionation Market Revenue (US$ Mn) Comparison by By End User (2016-2032)
- Figure 120: APAC Plasma Fractionation Market Revenue (US$ Mn) Comparison by By Application (2016-2032)
- Figure 121: APAC Plasma Fractionation Market Y-o-Y Growth Rate Comparison by Country (2016-2032)
- Figure 122: APAC Plasma Fractionation Market Y-o-Y Growth Rate Comparison by By Product Type (2016-2032)
- Figure 123: APAC Plasma Fractionation Market Y-o-Y Growth Rate Comparison by By Process (2016-2032)
- Figure 124: APAC Plasma Fractionation Market Y-o-Y Growth Rate Comparison by By End User (2016-2032)
- Figure 125: APAC Plasma Fractionation Market Y-o-Y Growth Rate Comparison by By Application (2016-2032)
- Figure 126: APAC Plasma Fractionation Market Share Comparison by Country (2016-2032)
- Figure 127: APAC Plasma Fractionation Market Share Comparison by By Product Type (2016-2032)
- Figure 128: APAC Plasma Fractionation Market Share Comparison by By Process (2016-2032)
- Figure 129: APAC Plasma Fractionation Market Share Comparison by By End User (2016-2032)
- Figure 130: APAC Plasma Fractionation Market Share Comparison by By Application (2016-2032)
- Figure 131: Latin America Plasma Fractionation Market Revenue (US$ Mn) Market Share by By Product Typein 2022
- Figure 132: Latin America Plasma Fractionation Market Attractiveness Analysis by By Product Type, 2016-2032
- Figure 133: Latin America Plasma Fractionation Market Revenue (US$ Mn) Market Share by By Processin 2022
- Figure 134: Latin America Plasma Fractionation Market Attractiveness Analysis by By Process, 2016-2032
- Figure 135: Latin America Plasma Fractionation Market Revenue (US$ Mn) Market Share by By End Userin 2022
- Figure 136: Latin America Plasma Fractionation Market Attractiveness Analysis by By End User, 2016-2032
- Figure 137: Latin America Plasma Fractionation Market Revenue (US$ Mn) Market Share by By Applicationin 2022
- Figure 138: Latin America Plasma Fractionation Market Attractiveness Analysis by By Application, 2016-2032
- Figure 139: Latin America Plasma Fractionation Market Revenue (US$ Mn) Market Share by Country in 2022
- Figure 140: Latin America Plasma Fractionation Market Attractiveness Analysis by Country, 2016-2032
- Figure 141: Latin America Plasma Fractionation Market Revenue (US$ Mn) (2016-2032)
- Figure 142: Latin America Plasma Fractionation Market Revenue (US$ Mn) Comparison by Country (2016-2032)
- Figure 143: Latin America Plasma Fractionation Market Revenue (US$ Mn) Comparison by By Product Type (2016-2032)
- Figure 144: Latin America Plasma Fractionation Market Revenue (US$ Mn) Comparison by By Process (2016-2032)
- Figure 145: Latin America Plasma Fractionation Market Revenue (US$ Mn) Comparison by By End User (2016-2032)
- Figure 146: Latin America Plasma Fractionation Market Revenue (US$ Mn) Comparison by By Application (2016-2032)
- Figure 147: Latin America Plasma Fractionation Market Y-o-Y Growth Rate Comparison by Country (2016-2032)
- Figure 148: Latin America Plasma Fractionation Market Y-o-Y Growth Rate Comparison by By Product Type (2016-2032)
- Figure 149: Latin America Plasma Fractionation Market Y-o-Y Growth Rate Comparison by By Process (2016-2032)
- Figure 150: Latin America Plasma Fractionation Market Y-o-Y Growth Rate Comparison by By End User (2016-2032)
- Figure 151: Latin America Plasma Fractionation Market Y-o-Y Growth Rate Comparison by By Application (2016-2032)
- Figure 152: Latin America Plasma Fractionation Market Share Comparison by Country (2016-2032)
- Figure 153: Latin America Plasma Fractionation Market Share Comparison by By Product Type (2016-2032)
- Figure 154: Latin America Plasma Fractionation Market Share Comparison by By Process (2016-2032)
- Figure 155: Latin America Plasma Fractionation Market Share Comparison by By End User (2016-2032)
- Figure 156: Latin America Plasma Fractionation Market Share Comparison by By Application (2016-2032)
- Figure 157: Middle East & Africa Plasma Fractionation Market Revenue (US$ Mn) Market Share by By Product Typein 2022
- Figure 158: Middle East & Africa Plasma Fractionation Market Attractiveness Analysis by By Product Type, 2016-2032
- Figure 159: Middle East & Africa Plasma Fractionation Market Revenue (US$ Mn) Market Share by By Processin 2022
- Figure 160: Middle East & Africa Plasma Fractionation Market Attractiveness Analysis by By Process, 2016-2032
- Figure 161: Middle East & Africa Plasma Fractionation Market Revenue (US$ Mn) Market Share by By End Userin 2022
- Figure 162: Middle East & Africa Plasma Fractionation Market Attractiveness Analysis by By End User, 2016-2032
- Figure 163: Middle East & Africa Plasma Fractionation Market Revenue (US$ Mn) Market Share by By Applicationin 2022
- Figure 164: Middle East & Africa Plasma Fractionation Market Attractiveness Analysis by By Application, 2016-2032
- Figure 165: Middle East & Africa Plasma Fractionation Market Revenue (US$ Mn) Market Share by Country in 2022
- Figure 166: Middle East & Africa Plasma Fractionation Market Attractiveness Analysis by Country, 2016-2032
- Figure 167: Middle East & Africa Plasma Fractionation Market Revenue (US$ Mn) (2016-2032)
- Figure 168: Middle East & Africa Plasma Fractionation Market Revenue (US$ Mn) Comparison by Country (2016-2032)
- Figure 169: Middle East & Africa Plasma Fractionation Market Revenue (US$ Mn) Comparison by By Product Type (2016-2032)
- Figure 170: Middle East & Africa Plasma Fractionation Market Revenue (US$ Mn) Comparison by By Process (2016-2032)
- Figure 171: Middle East & Africa Plasma Fractionation Market Revenue (US$ Mn) Comparison by By End User (2016-2032)
- Figure 172: Middle East & Africa Plasma Fractionation Market Revenue (US$ Mn) Comparison by By Application (2016-2032)
- Figure 173: Middle East & Africa Plasma Fractionation Market Y-o-Y Growth Rate Comparison by Country (2016-2032)
- Figure 174: Middle East & Africa Plasma Fractionation Market Y-o-Y Growth Rate Comparison by By Product Type (2016-2032)
- Figure 175: Middle East & Africa Plasma Fractionation Market Y-o-Y Growth Rate Comparison by By Process (2016-2032)
- Figure 176: Middle East & Africa Plasma Fractionation Market Y-o-Y Growth Rate Comparison by By End User (2016-2032)
- Figure 177: Middle East & Africa Plasma Fractionation Market Y-o-Y Growth Rate Comparison by By Application (2016-2032)
- Figure 178: Middle East & Africa Plasma Fractionation Market Share Comparison by Country (2016-2032)
- Figure 179: Middle East & Africa Plasma Fractionation Market Share Comparison by By Product Type (2016-2032)
- Figure 180: Middle East & Africa Plasma Fractionation Market Share Comparison by By Process (2016-2032)
- Figure 181: Middle East & Africa Plasma Fractionation Market Share Comparison by By End User (2016-2032)
- Figure 182: Middle East & Africa Plasma Fractionation Market Share Comparison by By Application (2016-2032)
List of Tables
- Table 1: Global Plasma Fractionation Market Comparison by By Product Type (2016-2032)
- Table 2: Global Plasma Fractionation Market Comparison by By Process (2016-2032)
- Table 3: Global Plasma Fractionation Market Comparison by By End User (2016-2032)
- Table 4: Global Plasma Fractionation Market Comparison by By Application (2016-2032)
- Table 5: Global Plasma Fractionation Market Revenue (US$ Mn) Comparison by Region (2016-2032)
- Table 6: Global Plasma Fractionation Market Revenue (US$ Mn) (2016-2032)
- Table 7: Global Plasma Fractionation Market Revenue (US$ Mn) Comparison by Region (2016-2032)
- Table 8: Global Plasma Fractionation Market Revenue (US$ Mn) Comparison by By Product Type (2016-2032)
- Table 9: Global Plasma Fractionation Market Revenue (US$ Mn) Comparison by By Process (2016-2032)
- Table 10: Global Plasma Fractionation Market Revenue (US$ Mn) Comparison by By End User (2016-2032)
- Table 11: Global Plasma Fractionation Market Revenue (US$ Mn) Comparison by By Application (2016-2032)
- Table 12: Global Plasma Fractionation Market Y-o-Y Growth Rate Comparison by Region (2016-2032)
- Table 13: Global Plasma Fractionation Market Y-o-Y Growth Rate Comparison by By Product Type (2016-2032)
- Table 14: Global Plasma Fractionation Market Y-o-Y Growth Rate Comparison by By Process (2016-2032)
- Table 15: Global Plasma Fractionation Market Y-o-Y Growth Rate Comparison by By End User (2016-2032)
- Table 16: Global Plasma Fractionation Market Y-o-Y Growth Rate Comparison by By Application (2016-2032)
- Table 17: Global Plasma Fractionation Market Share Comparison by Region (2016-2032)
- Table 18: Global Plasma Fractionation Market Share Comparison by By Product Type (2016-2032)
- Table 19: Global Plasma Fractionation Market Share Comparison by By Process (2016-2032)
- Table 20: Global Plasma Fractionation Market Share Comparison by By End User (2016-2032)
- Table 21: Global Plasma Fractionation Market Share Comparison by By Application (2016-2032)
- Table 22: North America Plasma Fractionation Market Comparison by By Process (2016-2032)
- Table 23: North America Plasma Fractionation Market Comparison by By End User (2016-2032)
- Table 24: North America Plasma Fractionation Market Comparison by By Application (2016-2032)
- Table 25: North America Plasma Fractionation Market Revenue (US$ Mn) Comparison by Country (2016-2032)
- Table 26: North America Plasma Fractionation Market Revenue (US$ Mn) (2016-2032)
- Table 27: North America Plasma Fractionation Market Revenue (US$ Mn) Comparison by Country (2016-2032)
- Table 28: North America Plasma Fractionation Market Revenue (US$ Mn) Comparison by By Product Type (2016-2032)
- Table 29: North America Plasma Fractionation Market Revenue (US$ Mn) Comparison by By Process (2016-2032)
- Table 30: North America Plasma Fractionation Market Revenue (US$ Mn) Comparison by By End User (2016-2032)
- Table 31: North America Plasma Fractionation Market Revenue (US$ Mn) Comparison by By Application (2016-2032)
- Table 32: North America Plasma Fractionation Market Y-o-Y Growth Rate Comparison by Country (2016-2032)
- Table 33: North America Plasma Fractionation Market Y-o-Y Growth Rate Comparison by By Product Type (2016-2032)
- Table 34: North America Plasma Fractionation Market Y-o-Y Growth Rate Comparison by By Process (2016-2032)
- Table 35: North America Plasma Fractionation Market Y-o-Y Growth Rate Comparison by By End User (2016-2032)
- Table 36: North America Plasma Fractionation Market Y-o-Y Growth Rate Comparison by By Application (2016-2032)
- Table 37: North America Plasma Fractionation Market Share Comparison by Country (2016-2032)
- Table 38: North America Plasma Fractionation Market Share Comparison by By Product Type (2016-2032)
- Table 39: North America Plasma Fractionation Market Share Comparison by By Process (2016-2032)
- Table 40: North America Plasma Fractionation Market Share Comparison by By End User (2016-2032)
- Table 41: North America Plasma Fractionation Market Share Comparison by By Application (2016-2032)
- Table 42: Western Europe Plasma Fractionation Market Comparison by By Product Type (2016-2032)
- Table 43: Western Europe Plasma Fractionation Market Comparison by By Process (2016-2032)
- Table 44: Western Europe Plasma Fractionation Market Comparison by By End User (2016-2032)
- Table 45: Western Europe Plasma Fractionation Market Comparison by By Application (2016-2032)
- Table 46: Western Europe Plasma Fractionation Market Revenue (US$ Mn) Comparison by Country (2016-2032)
- Table 47: Western Europe Plasma Fractionation Market Revenue (US$ Mn) (2016-2032)
- Table 48: Western Europe Plasma Fractionation Market Revenue (US$ Mn) Comparison by Country (2016-2032)
- Table 49: Western Europe Plasma Fractionation Market Revenue (US$ Mn) Comparison by By Product Type (2016-2032)
- Table 50: Western Europe Plasma Fractionation Market Revenue (US$ Mn) Comparison by By Process (2016-2032)
- Table 51: Western Europe Plasma Fractionation Market Revenue (US$ Mn) Comparison by By End User (2016-2032)
- Table 52: Western Europe Plasma Fractionation Market Revenue (US$ Mn) Comparison by By Application (2016-2032)
- Table 53: Western Europe Plasma Fractionation Market Y-o-Y Growth Rate Comparison by Country (2016-2032)
- Table 54: Western Europe Plasma Fractionation Market Y-o-Y Growth Rate Comparison by By Product Type (2016-2032)
- Table 55: Western Europe Plasma Fractionation Market Y-o-Y Growth Rate Comparison by By Process (2016-2032)
- Table 56: Western Europe Plasma Fractionation Market Y-o-Y Growth Rate Comparison by By End User (2016-2032)
- Table 57: Western Europe Plasma Fractionation Market Y-o-Y Growth Rate Comparison by By Application (2016-2032)
- Table 58: Western Europe Plasma Fractionation Market Share Comparison by Country (2016-2032)
- Table 59: Western Europe Plasma Fractionation Market Share Comparison by By Product Type (2016-2032)
- Table 60: Western Europe Plasma Fractionation Market Share Comparison by By Process (2016-2032)
- Table 61: Western Europe Plasma Fractionation Market Share Comparison by By End User (2016-2032)
- Table 62: Western Europe Plasma Fractionation Market Share Comparison by By Application (2016-2032)
- Table 63: Eastern Europe Plasma Fractionation Market Comparison by By Product Type (2016-2032)
- Table 64: Eastern Europe Plasma Fractionation Market Comparison by By Process (2016-2032)
- Table 65: Eastern Europe Plasma Fractionation Market Comparison by By End User (2016-2032)
- Table 66: Eastern Europe Plasma Fractionation Market Comparison by By Application (2016-2032)
- Table 67: Eastern Europe Plasma Fractionation Market Revenue (US$ Mn) Comparison by Country (2016-2032)
- Table 68: Eastern Europe Plasma Fractionation Market Revenue (US$ Mn) (2016-2032)
- Table 69: Eastern Europe Plasma Fractionation Market Revenue (US$ Mn) Comparison by Country (2016-2032)
- Table 70: Eastern Europe Plasma Fractionation Market Revenue (US$ Mn) Comparison by By Product Type (2016-2032)
- Table 71: Eastern Europe Plasma Fractionation Market Revenue (US$ Mn) Comparison by By Process (2016-2032)
- Table 72: Eastern Europe Plasma Fractionation Market Revenue (US$ Mn) Comparison by By End User (2016-2032)
- Table 73: Eastern Europe Plasma Fractionation Market Revenue (US$ Mn) Comparison by By Application (2016-2032)
- Table 74: Eastern Europe Plasma Fractionation Market Y-o-Y Growth Rate Comparison by Country (2016-2032)
- Table 75: Eastern Europe Plasma Fractionation Market Y-o-Y Growth Rate Comparison by By Product Type (2016-2032)
- Table 76: Eastern Europe Plasma Fractionation Market Y-o-Y Growth Rate Comparison by By Process (2016-2032)
- Table 77: Eastern Europe Plasma Fractionation Market Y-o-Y Growth Rate Comparison by By End User (2016-2032)
- Table 78: Eastern Europe Plasma Fractionation Market Y-o-Y Growth Rate Comparison by By Application (2016-2032)
- Table 79: Eastern Europe Plasma Fractionation Market Share Comparison by Country (2016-2032)
- Table 80: Eastern Europe Plasma Fractionation Market Share Comparison by By Product Type (2016-2032)
- Table 81: Eastern Europe Plasma Fractionation Market Share Comparison by By Process (2016-2032)
- Table 82: Eastern Europe Plasma Fractionation Market Share Comparison by By End User (2016-2032)
- Table 83: Eastern Europe Plasma Fractionation Market Share Comparison by By Application (2016-2032)
- Table 84: APAC Plasma Fractionation Market Comparison by By Product Type (2016-2032)
- Table 85: APAC Plasma Fractionation Market Comparison by By Process (2016-2032)
- Table 86: APAC Plasma Fractionation Market Comparison by By End User (2016-2032)
- Table 87: APAC Plasma Fractionation Market Comparison by By Application (2016-2032)
- Table 88: APAC Plasma Fractionation Market Revenue (US$ Mn) Comparison by Country (2016-2032)
- Table 89: APAC Plasma Fractionation Market Revenue (US$ Mn) (2016-2032)
- Table 90: APAC Plasma Fractionation Market Revenue (US$ Mn) Comparison by Country (2016-2032)
- Table 91: APAC Plasma Fractionation Market Revenue (US$ Mn) Comparison by By Product Type (2016-2032)
- Table 92: APAC Plasma Fractionation Market Revenue (US$ Mn) Comparison by By Process (2016-2032)
- Table 93: APAC Plasma Fractionation Market Revenue (US$ Mn) Comparison by By End User (2016-2032)
- Table 94: APAC Plasma Fractionation Market Revenue (US$ Mn) Comparison by By Application (2016-2032)
- Table 95: APAC Plasma Fractionation Market Y-o-Y Growth Rate Comparison by Country (2016-2032)
- Table 96: APAC Plasma Fractionation Market Y-o-Y Growth Rate Comparison by By Product Type (2016-2032)
- Table 97: APAC Plasma Fractionation Market Y-o-Y Growth Rate Comparison by By Process (2016-2032)
- Table 98: APAC Plasma Fractionation Market Y-o-Y Growth Rate Comparison by By End User (2016-2032)
- Table 99: APAC Plasma Fractionation Market Y-o-Y Growth Rate Comparison by By Application (2016-2032)
- Table 100: APAC Plasma Fractionation Market Share Comparison by Country (2016-2032)
- Table 101: APAC Plasma Fractionation Market Share Comparison by By Product Type (2016-2032)
- Table 102: APAC Plasma Fractionation Market Share Comparison by By Process (2016-2032)
- Table 103: APAC Plasma Fractionation Market Share Comparison by By End User (2016-2032)
- Table 104: APAC Plasma Fractionation Market Share Comparison by By Application (2016-2032)
- Table 105: Latin America Plasma Fractionation Market Comparison by By Product Type (2016-2032)
- Table 106: Latin America Plasma Fractionation Market Comparison by By Process (2016-2032)
- Table 107: Latin America Plasma Fractionation Market Comparison by By End User (2016-2032)
- Table 108: Latin America Plasma Fractionation Market Comparison by By Application (2016-2032)
- Table 109: Latin America Plasma Fractionation Market Revenue (US$ Mn) Comparison by Country (2016-2032)
- Table 110: Latin America Plasma Fractionation Market Revenue (US$ Mn) (2016-2032)
- Table 111: Latin America Plasma Fractionation Market Revenue (US$ Mn) Comparison by Country (2016-2032)
- Table 112: Latin America Plasma Fractionation Market Revenue (US$ Mn) Comparison by By Product Type (2016-2032)
- Table 113: Latin America Plasma Fractionation Market Revenue (US$ Mn) Comparison by By Process (2016-2032)
- Table 114: Latin America Plasma Fractionation Market Revenue (US$ Mn) Comparison by By End User (2016-2032)
- Table 115: Latin America Plasma Fractionation Market Revenue (US$ Mn) Comparison by By Application (2016-2032)
- Table 116: Latin America Plasma Fractionation Market Y-o-Y Growth Rate Comparison by Country (2016-2032)
- Table 117: Latin America Plasma Fractionation Market Y-o-Y Growth Rate Comparison by By Product Type (2016-2032)
- Table 118: Latin America Plasma Fractionation Market Y-o-Y Growth Rate Comparison by By Process (2016-2032)
- Table 119: Latin America Plasma Fractionation Market Y-o-Y Growth Rate Comparison by By End User (2016-2032)
- Table 120: Latin America Plasma Fractionation Market Y-o-Y Growth Rate Comparison by By Application (2016-2032)
- Table 121: Latin America Plasma Fractionation Market Share Comparison by Country (2016-2032)
- Table 122: Latin America Plasma Fractionation Market Share Comparison by By Product Type (2016-2032)
- Table 123: Latin America Plasma Fractionation Market Share Comparison by By Process (2016-2032)
- Table 124: Latin America Plasma Fractionation Market Share Comparison by By End User (2016-2032)
- Table 125: Latin America Plasma Fractionation Market Share Comparison by By Application (2016-2032)
- Table 126: Middle East & Africa Plasma Fractionation Market Comparison by By Product Type (2016-2032)
- Table 127: Middle East & Africa Plasma Fractionation Market Comparison by By Process (2016-2032)
- Table 128: Middle East & Africa Plasma Fractionation Market Comparison by By End User (2016-2032)
- Table 129: Middle East & Africa Plasma Fractionation Market Comparison by By Application (2016-2032)
- Table 130: Middle East & Africa Plasma Fractionation Market Revenue (US$ Mn) Comparison by Country (2016-2032)
- Table 131: Middle East & Africa Plasma Fractionation Market Revenue (US$ Mn) (2016-2032)
- Table 132: Middle East & Africa Plasma Fractionation Market Revenue (US$ Mn) Comparison by Country (2016-2032)
- Table 133: Middle East & Africa Plasma Fractionation Market Revenue (US$ Mn) Comparison by By Product Type (2016-2032)
- Table 134: Middle East & Africa Plasma Fractionation Market Revenue (US$ Mn) Comparison by By Process (2016-2032)
- Table 135: Middle East & Africa Plasma Fractionation Market Revenue (US$ Mn) Comparison by By End User (2016-2032)
- Table 136: Middle East & Africa Plasma Fractionation Market Revenue (US$ Mn) Comparison by By Application (2016-2032)
- Table 137: Middle East & Africa Plasma Fractionation Market Y-o-Y Growth Rate Comparison by Country (2016-2032)
- Table 138: Middle East & Africa Plasma Fractionation Market Y-o-Y Growth Rate Comparison by By Product Type (2016-2032)
- Table 139: Middle East & Africa Plasma Fractionation Market Y-o-Y Growth Rate Comparison by By Process (2016-2032)
- Table 140: Middle East & Africa Plasma Fractionation Market Y-o-Y Growth Rate Comparison by By End User (2016-2032)
- Table 141: Middle East & Africa Plasma Fractionation Market Y-o-Y Growth Rate Comparison by By Application (2016-2032)
- Table 142: Middle East & Africa Plasma Fractionation Market Share Comparison by Country (2016-2032)
- Table 143: Middle East & Africa Plasma Fractionation Market Share Comparison by By Product Type (2016-2032)
- Table 144: Middle East & Africa Plasma Fractionation Market Share Comparison by By Process (2016-2032)
- Table 145: Middle East & Africa Plasma Fractionation Market Share Comparison by By End User (2016-2032)
- Table 146: Middle East & Africa Plasma Fractionation Market Share Comparison by By Application (2016-2032)
- 1. Executive Summary
-
- CSL Plasma Inc.
- Grifols
- Shire (BioLife Plasma Services)
- Octapharma Plasma Inc.
- Kedrion S.p.A
- Bio Product Laboratory Ltd.
- LFB S.A.
- Biotest Pharmaceuticals Corporation
- Japan Blood Products Organization
- China Biologic Products Holdings Inc.
Our Clients


View Our Licence Options
