
Global Physical Therapy Market By Application (Orthopedic Therapy, Pediatric Therapy, And Others), By Demography (Geriatric And Non-Geriatric), By End-Use (Hospitals & Clinics, Community Centers, And Other) By Region And Companies - Industry Segment Outlook, Market Assessment, Competition Scenario, Trends, And Forecast 2023-2032
-
36193
-
April 2023
-
96
-


-
This report was compiled by Correspondence Linkedin | Detailed Market research Methodology Our methodology involves a mix of primary research, including interviews with leading mental health experts, and secondary research from reputable medical journals and databases. View Detailed Methodology Page
-
Quick Navigation
Report Overview
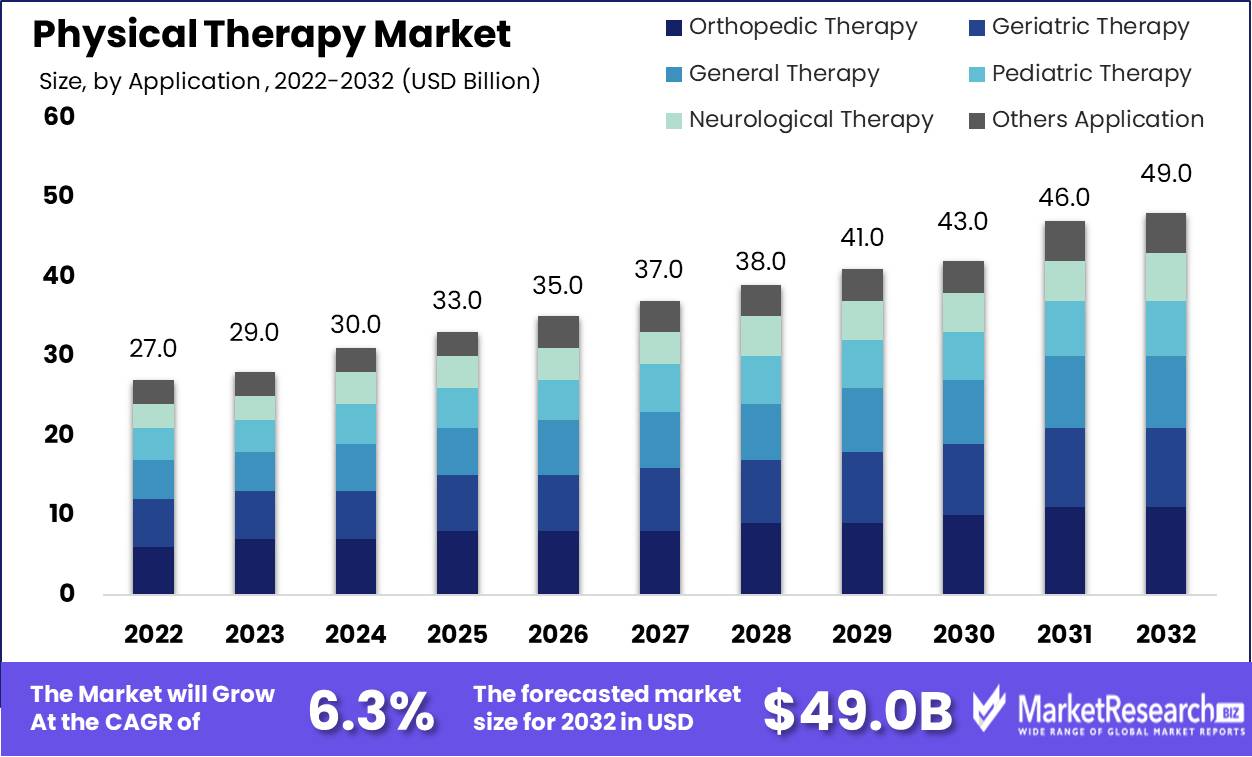
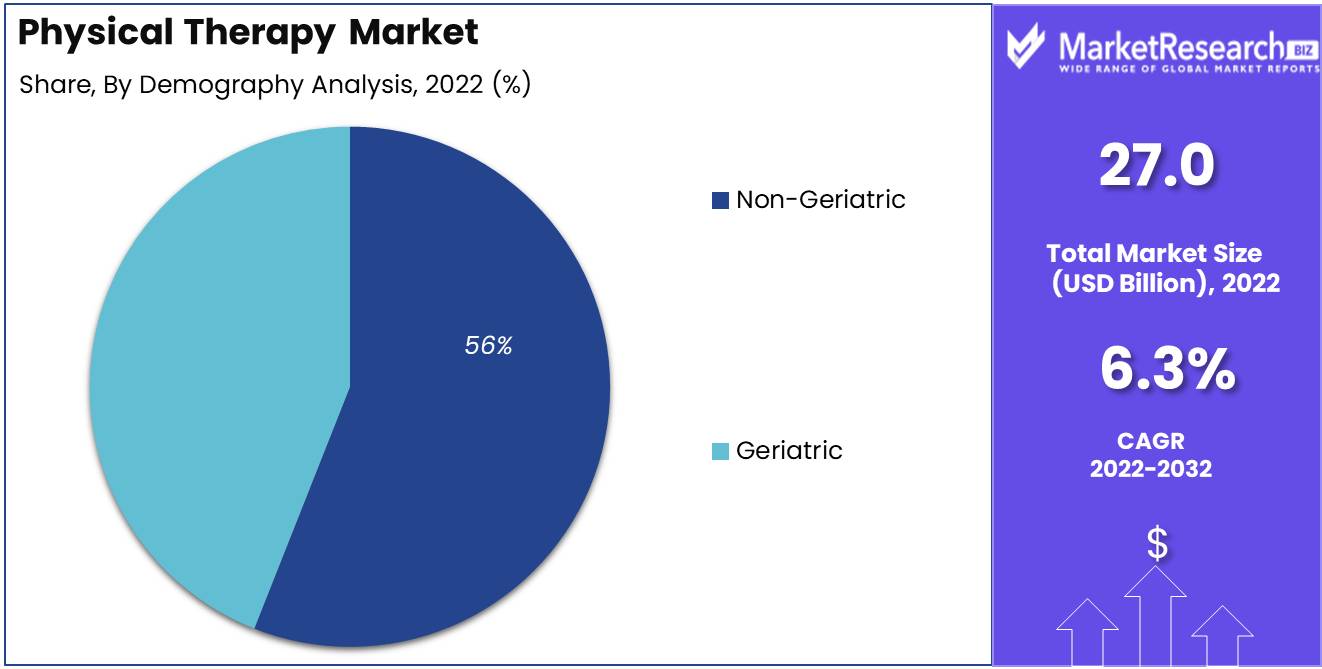
Global Physical Therapy Market size is expected to be worth around USD 49.0 Bn by 2032 from USD 27.0 Bn in 2022, growing at a CAGR of 6.3% during the forecast period from 2023 to 2032.
Physical therapy is an actual therapy that helps to reduce pain and aids in better movement or making weak muscles strong. Another important goals are to show patients to do their activities to advance their health. Furthermore, these activities are not only done in practice or hospital but also done at home by yourself. Moreover, it is also used on patients after procedures such as the replacement of joints and restoration of muscle from which the bodily part is immobilized for a long period. Therefore, medical improvements have advanced treatment and evaluation for physical disorders. Hence, it is expected to increase the market growth from 2023 to 2032.
Market Scope
Application Analysis
Orthopedic Therapy Segment is the Most Lucrative in the Global Physical Therapy Market
Based on application, the market for physical therapy is segmented into orthopedic therapy, pediatric therapy, general therapy, geriatric therapy, neurological therapy, and others application. Among these applications, the orthopedic therapy segment is the most lucrative in the global physical therapy market with a market share of 23% across the globe. Owing to the treatment of the musculoskeletal system is in high demand in the market. Musculoskeletal system includes tendons, muscles, bones, joints, and ligaments. Owing to the stoppage of functional mobility and motion and any issue in these regions can further make daily tasks hard to do. Geriatric physical therapy helps old people with their conditions. It helps to reduce pain and increase movement with various exercises and treatments. Moreover, some main issues are osteoporosis, arthritis, and chronic ailments. Orthopedic therapy and geriatric therapy are rising owing to the rising geriatric population.
Demography Analysis
Non-geriatric Segment is Estimated to be the Most Lucrative Segment
By demography, the physical therapy market is further divided into geriatric and non-geriatric. Among them, the non-geriatric segment is estimated to be the most lucrative segment in the global physical therapy market with a market share of 56% and is anticipated to grow during the forecasted period. Owing to increase in hospital stays of non-geriatric people is going to increase the non-geriatric market growth in the forecasted period. Moreover, non-geriatric patients are significantly adults with spinal cord issues across the globe. These are increased due to domestic or various accidents creating health issues.
End-Use Analysis
Hospitals & Clinics Segment is Estimated to be the Most Lucrative Segment
By end-use, the physical therapy market is further divided into hospitals & clinics, community centers, sports centers, convalescent homes, schools & sports academies, and other end-use. Among these, the hospitals & clinics segment is estimated to be the most lucrative segment in the global physical therapy market with a market share of 44%, and is anticipated to grow at a constant CAGR during the forecast period. Owing to a lot of patients and the installation of several programs by different hospitals. Moreover, hospitals and clinics are increasing medical facilities to a specific unit that concentrates on physical therapies or after-surgery recovery programs. Other segments are expected to grow at a rate of 9% CAGR during the forecast period.
Key Market Segments
Based on Application
- Orthopedic Therapy
- Pediatric Therapy
- General Therapy
- Geriatric Therapy
- Neurological Therapy
- Others Application
Based on Demography
- Geriatric
- Non-Geriatric
Based on End-Use
- Hospitals & Clinics
- Community Centers
- Sports Centers
- Convalescent Homes
- Schools & Sports Academies
- Other End-Use
Market Dynamics
Drivers
Development in the Healthcare Departments, the Increasing Age of Individuals, and the Rising number of Various People Suffering from Diseases are Driver of the Market
The market is expected to increase due to the increasing number of patients across the globe. Furthermore, development in the healthcare departments and making available several types of therapy to cure by facilities like private places, hospitals, and others. The increasing number of aged individuals and the rising number of various people suffering from diseases are anticipated to increase the market growth in the forecast period. Moreover, less treatment of cost for the rehabilitation of various physical therapy. Increasing collaborations and partnerships between several players are increasing market growth. The need for physical therapy is high in various schools and especially in the sports and fitness section.
Restraints
High Spending and High Cost Sports Related Medicine Are Giving Several Issues to Reduce Increase of the Market
High spending on physical therapy related to research and development which needs infrastructure, high cost attached price tag to sports-related medicine, and less knowledge about physical therapy are restraining the market growth. Moreover, lack of remuneration states and technology in various developing countries.
Opportunity
Sports Interest, Rising Awareness Are Opportunities
A lot of people are interested in sports that are spread across the globe. They are contributing to the market growth. Furthermore, it is the main reason for the market growth. Moreover, geriatric people are more common in outdoor and indoor settings due to the increasing number of older people rapidly. This gives rise to physical therapy. Rising awareness among the people about several advantages without any fewer issues or fewer side effects is expected to increase the market growth in the forecast period. Various individuals get physical therapy in several places such as outpatient clinics, hospitals, sports & fitness activities, private offices, and others.
Trends
Artificial Technology, Wearable Technologies, and Telerehabilitation are Some of the Trends
The high need for telerehabilitation, AI & ML assisted in physiotherapy, physical therapy reimbursement, wearable technologies, and patient safety concentration are some of the latest trends in the market. Advancing technology is important in the market hence, the need for investment in research and development is important.
Regional Analysis
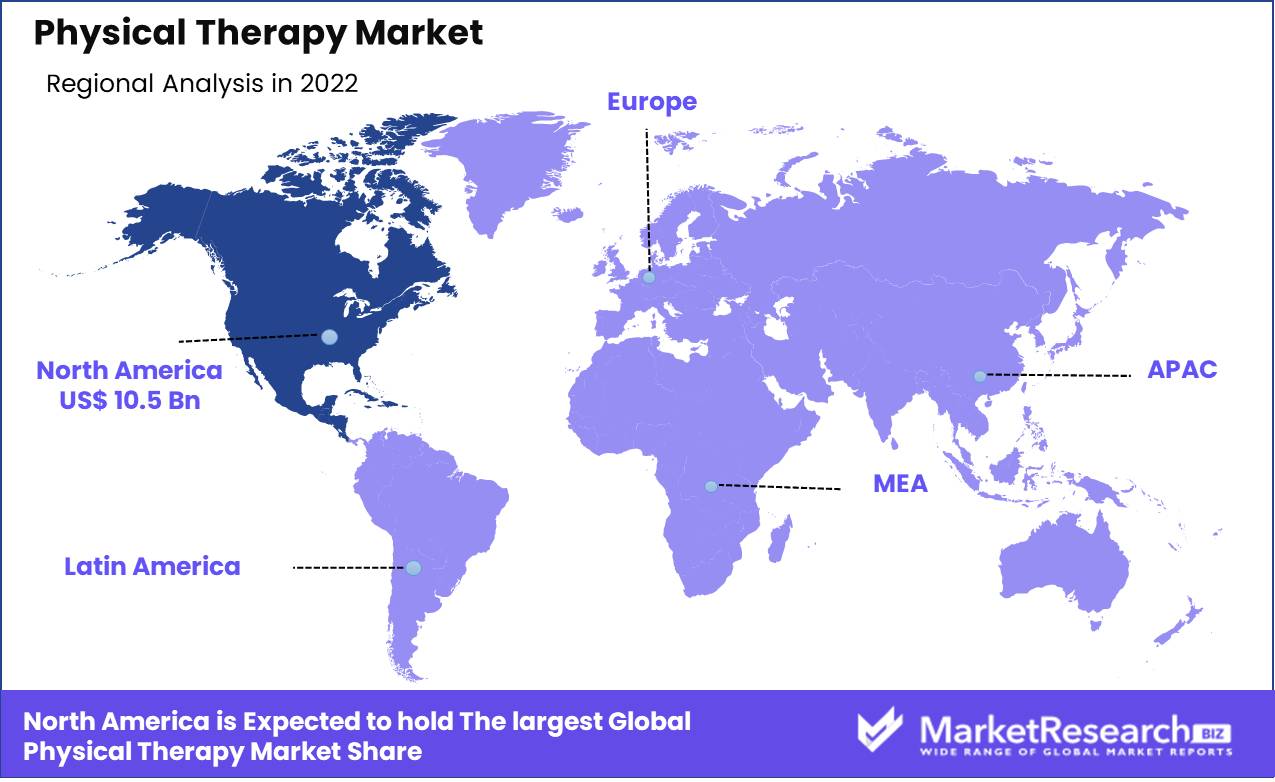
North America is Estimated to be the Most Lucrative Market
Global physical therapy market based on region segmented into MEA, Latin America, North America, Europe, and APAC. In 2022, North America is dominating with a market of 39% and will likely grow at a high CAGR rate in the forecast period from 2023 to 2032. Owing to increasing various accidents & several issues, rising osteoporosis, and rising geriatric individuals. Moreover, the increasing number of hospitals and at-home care is increasing the market growth. Physical therapy need is expected to grow owing to diseases such as stroke, spinal injury, paralysis, etc. In the Asia-Pacific region, it is going to show the highest CAGR with 9% during the forecasted period from 2023 to 2032. Owing to rising to reimburse, increasing age of Individuals, and increasing cardiovascular, & musculoskeletal disorders in the APAC regional market.
Key Regions
- North America
- The US
- Canada
- Mexico
- Western Europe
- Germany
- France
- The UK
- Spain
- Italy
- Portugal
- Ireland
- Austria
- Switzerland
- Benelux
- Nordic
- Rest of Western Europe
- Eastern Europe
- Russia
- Poland
- The Czech Republic
- Greece
- Rest of Eastern Europe
- APAC
- China
- Japan
- South Korea
- India
- Australia & New Zealand
- Indonesia
- Malaysia
- Philippines
- Singapore
- Thailand
- Vietnam
- Rest of APAC
- Latin America
- Brazil
- Colombia
- Chile
- Argentina
- Costa Rica
- Rest of Latin America
- Middle East & Africa
- Algeria
- Egypt
- Israel
- Kuwait
- Nigeria
- Saudi Arabia
- South Africa
- Turkey
- United Arab Emirates
- Rest of MEA
Key Players Analysis
Strong key players in the market are using strategies like mergers, collaborations, expansion, and acquisitions which are expected to increase competition in the market. These strategies are helping to grow its reach and quality in the market. Significant key players are adopting these strategies to help to improve their market and boost their business.
Listed below are some of the most prominent bio-based surface disinfectant industry players.
Market Key Players
- BTL
- Zimmer MedizinSysteme GmbH
- Whitehall Manufacturing
- Storz Medical AG
- RICHMAR
- Rehab Alternatives PLLC
- PIVOT Physical Therapy
- Performance Health
- ITO Co., Ltd.
- Enraf-Nonius B.V.
- EMS Physio Ltd.
- Dynatronics Corporation
- DJO LLC
- AmeriCare Physical Therapy
- Other Key Players
Recent Developments
- In Apr 2020, ATI Physical Therapy a private institution that is recognized in the US healthcare organization depending on the United States that specifically in outpatient rehabilitation and its related healthcare services, advanced an online or virtual physical therapy service.
Report Scope
Report Features Description Market Value (2022) USD 27.0 Bn Forecast Revenue (2032) USD 49.0 Bn CAGR (2023-2032) 6.3% Base Year for Estimation 2022 Historic Period 2016-2022 Forecast Period 2023-2032 Report Coverage Revenue Forecast, Market Dynamics, COVID-19 Impact, Competitive Landscape, Recent Developments Segments Covered By Application (Orthopedic Therapy, Pediatric Therapy, General Therapy, Geriatric Therapy, Neurological Therapy, and Others Application), By Location (Geriatric and Non-Geriatric), By Type (Hospitals & Clinics, Community Centers, Sports Centers, Convalescent Homes, Schools & Sports Academies, and Other End-Use) Regional Analysis North America – The US, Canada, & Mexico; Western Europe – Germany, France, The UK, Spain, Italy, Portugal, Ireland, Austria, Switzerland, Benelux, Nordic, & Rest of Western Europe; Eastern Europe – Russia, Poland, The Czech Republic, Greece, & Rest of Eastern Europe; APAC – China, Japan, South Korea, India, Australia & New Zealand, Indonesia, Malaysia, Philippines, Singapore, Thailand, Vietnam, & Rest of APAC; Latin America – Brazil, Colombia, Chile, Argentina, Costa Rica, & Rest of Latin America; Middle East & Africa – Algeria, Egypt, Israel, Kuwait, Nigeria, Saudi Arabia, South Africa, Turkey, United Arab Emirates, & Rest of MEA Competitive Landscape BTL, Zimmer Medizin Systeme GmbH, Whitehall Manufacturing, Storz Medical AG, RICHMAR, Rehab Alternatives PLLC, PIVOT Physical Therapy, Performance Health, ITO Co., Ltd., Enraf-Nonius B.V., EMS Physio Ltd., Dynatronics Corporation, DJO LLC, AmeriCare Physical Therapy, and Others Key Players Customization Scope Customization for segments, region/country-level will be provided. Moreover, additional customization can be done based on the requirements. Purchase Options We have three licenses to opt for: Single User License, Multi-User License (Up to 5 Users), Corporate Use License (Unlimited User and Printable PDF) -
- 1. Executive Summary
- 1.1. Definition
- 1.2. Taxonomy
- 1.3. Research Scope
- 1.4. Key Analysis
- 1.5. Key Findings by Major Segments
- 1.6. Top strategies by Major Players
- 2. Global Physical Therapy Market Overview
- 2.1. Physical Therapy Market Dynamics
- 2.1.1. Drivers
- 2.1.2. Opportunities
- 2.1.3. Restraints
- 2.1.4. Challenges
- 2.2. Macro-economic Factors
- 2.3. Regulatory Framework
- 2.4. Market Investment Feasibility Index
- 2.5. PEST Analysis
- 2.6. PORTER’S Five Force Analysis
- 2.7. Drivers & Restraints Impact Analysis
- 2.8. Industry Chain Analysis
- 2.9. Cost Structure Analysis
- 2.10. Marketing Strategy
- 2.11. Russia-Ukraine War Impact Analysis
- 2.12. Opportunity Map Analysis
- 2.13. Market Competition Scenario Analysis
- 2.14. Product Life Cycle Analysis
- 2.15. Opportunity Orbits
- 2.16. Manufacturer Intensity Map
- 2.17. Major Companies sales by Value & Volume
- 2.1. Physical Therapy Market Dynamics
- 3. Global Physical Therapy Market Analysis, Opportunity and Forecast, 2016-2032
- 3.1. Global Physical Therapy Market Analysis, 2016-2021
- 3.2. Global Physical Therapy Market Opportunity and Forecast, 2023-2032
- 3.3. Global Physical Therapy Market Analysis, Opportunity and Forecast, By Type , 2016-2032
- 3.3.1. Global Physical Therapy Market Analysis by Type : Introduction
- 3.3.2. Market Size Absolute $ Opportunity Analysis and Forecast, By Type , 2016-2032
- 3.3.3. Ultrasound
- 3.3.4. Thermoelectric Stimulation
- 3.3.5. Hydrotherapy
- 3.3.6. Other Types
- 3.4. Global Physical Therapy Market Analysis, Opportunity and Forecast, By Application, 2016-2032
- 3.4.1. Global Physical Therapy Market Analysis by Application: Introduction
- 3.4.2. Market Size Absolute $ Opportunity Analysis and Forecast, By Application, 2016-2032
- 3.4.3. Orthopedic Therapy
- 3.4.4. Pediatric Therapy
- 3.4.5. General Therapy
- 3.4.6. Geriatric Therapy
- 3.4.7. Neurological Therapy
- 3.4.8. Others Application
- 3.5. Global Physical Therapy Market Analysis, Opportunity and Forecast, By Demography, 2016-2032
- 3.5.1. Global Physical Therapy Market Analysis by Demography: Introduction
- 3.5.2. Market Size Absolute $ Opportunity Analysis and Forecast, By Demography, 2016-2032
- 3.5.3. Geriatric
- 3.5.4. Non-Geriatric
- 3.6. Global Physical Therapy Market Analysis, Opportunity and Forecast, By End-Use, 2016-2032
- 3.6.1. Global Physical Therapy Market Analysis by End-Use: Introduction
- 3.6.2. Market Size Absolute $ Opportunity Analysis and Forecast, By End-Use, 2016-2032
- 3.6.3. Hospitals & Clinics
- 3.6.4. Community Centers
- 3.6.5. Sports Centers
- 3.6.6. Convalescent Homes
- 3.6.7. Schools & Sports Academies
- 3.6.8. Other End-Use
- 4. North America Physical Therapy Market Analysis, Opportunity and Forecast, 2016-2032
- 4.1. North America Physical Therapy Market Analysis, 2016-2021
- 4.2. North America Physical Therapy Market Opportunity and Forecast, 2023-2032
- 4.3. North America Physical Therapy Market Analysis, Opportunity and Forecast, By Type , 2016-2032
- 4.3.1. North America Physical Therapy Market Analysis by Type : Introduction
- 4.3.2. Market Size Absolute $ Opportunity Analysis and Forecast, By Type , 2016-2032
- 4.3.3. Ultrasound
- 4.3.4. Thermoelectric Stimulation
- 4.3.5. Hydrotherapy
- 4.3.6. Other Types
- 4.4. North America Physical Therapy Market Analysis, Opportunity and Forecast, By Application, 2016-2032
- 4.4.1. North America Physical Therapy Market Analysis by Application: Introduction
- 4.4.2. Market Size Absolute $ Opportunity Analysis and Forecast, By Application, 2016-2032
- 4.4.3. Orthopedic Therapy
- 4.4.4. Pediatric Therapy
- 4.4.5. General Therapy
- 4.4.6. Geriatric Therapy
- 4.4.7. Neurological Therapy
- 4.4.8. Others Application
- 4.5. North America Physical Therapy Market Analysis, Opportunity and Forecast, By Demography, 2016-2032
- 4.5.1. North America Physical Therapy Market Analysis by Demography: Introduction
- 4.5.2. Market Size Absolute $ Opportunity Analysis and Forecast, By Demography, 2016-2032
- 4.5.3. Geriatric
- 4.5.4. Non-Geriatric
- 4.6. North America Physical Therapy Market Analysis, Opportunity and Forecast, By End-Use, 2016-2032
- 4.6.1. North America Physical Therapy Market Analysis by End-Use: Introduction
- 4.6.2. Market Size Absolute $ Opportunity Analysis and Forecast, By End-Use, 2016-2032
- 4.6.3. Hospitals & Clinics
- 4.6.4. Community Centers
- 4.6.5. Sports Centers
- 4.6.6. Convalescent Homes
- 4.6.7. Schools & Sports Academies
- 4.6.8. Other End-Use
- 4.7. North America Physical Therapy Market Analysis, Opportunity and Forecast, By Country , 2016-2032
- 4.7.1. North America Physical Therapy Market Analysis by Country : Introduction
- 4.7.2. Market Size Absolute $ Opportunity Analysis and Forecast, Country , 2016-2032
- 4.7.2.1. The US
- 4.7.2.2. Canada
- 4.7.2.3. Mexico
- 5. Western Europe Physical Therapy Market Analysis, Opportunity and Forecast, 2016-2032
- 5.1. Western Europe Physical Therapy Market Analysis, 2016-2021
- 5.2. Western Europe Physical Therapy Market Opportunity and Forecast, 2023-2032
- 5.3. Western Europe Physical Therapy Market Analysis, Opportunity and Forecast, By Type , 2016-2032
- 5.3.1. Western Europe Physical Therapy Market Analysis by Type : Introduction
- 5.3.2. Market Size Absolute $ Opportunity Analysis and Forecast, By Type , 2016-2032
- 5.3.3. Ultrasound
- 5.3.4. Thermoelectric Stimulation
- 5.3.5. Hydrotherapy
- 5.3.6. Other Types
- 5.4. Western Europe Physical Therapy Market Analysis, Opportunity and Forecast, By Application, 2016-2032
- 5.4.1. Western Europe Physical Therapy Market Analysis by Application: Introduction
- 5.4.2. Market Size Absolute $ Opportunity Analysis and Forecast, By Application, 2016-2032
- 5.4.3. Orthopedic Therapy
- 5.4.4. Pediatric Therapy
- 5.4.5. General Therapy
- 5.4.6. Geriatric Therapy
- 5.4.7. Neurological Therapy
- 5.4.8. Others Application
- 5.5. Western Europe Physical Therapy Market Analysis, Opportunity and Forecast, By Demography, 2016-2032
- 5.5.1. Western Europe Physical Therapy Market Analysis by Demography: Introduction
- 5.5.2. Market Size Absolute $ Opportunity Analysis and Forecast, By Demography, 2016-2032
- 5.5.3. Geriatric
- 5.5.4. Non-Geriatric
- 5.6. Western Europe Physical Therapy Market Analysis, Opportunity and Forecast, By End-Use, 2016-2032
- 5.6.1. Western Europe Physical Therapy Market Analysis by End-Use: Introduction
- 5.6.2. Market Size Absolute $ Opportunity Analysis and Forecast, By End-Use, 2016-2032
- 5.6.3. Hospitals & Clinics
- 5.6.4. Community Centers
- 5.6.5. Sports Centers
- 5.6.6. Convalescent Homes
- 5.6.7. Schools & Sports Academies
- 5.6.8. Other End-Use
- 5.7. Western Europe Physical Therapy Market Analysis, Opportunity and Forecast, By Country , 2016-2032
- 5.7.1. Western Europe Physical Therapy Market Analysis by Country : Introduction
- 5.7.2. Market Size Absolute $ Opportunity Analysis and Forecast, Country , 2016-2032
- 5.7.2.1. Germany
- 5.7.2.2. France
- 5.7.2.3. The UK
- 5.7.2.4. Spain
- 5.7.2.5. Italy
- 5.7.2.6. Portugal
- 5.7.2.7. Ireland
- 5.7.2.8. Austria
- 5.7.2.9. Switzerland
- 5.7.2.10. Benelux
- 5.7.2.11. Nordic
- 5.7.2.12. Rest of Western Europe
- 6. Eastern Europe Physical Therapy Market Analysis, Opportunity and Forecast, 2016-2032
- 6.1. Eastern Europe Physical Therapy Market Analysis, 2016-2021
- 6.2. Eastern Europe Physical Therapy Market Opportunity and Forecast, 2023-2032
- 6.3. Eastern Europe Physical Therapy Market Analysis, Opportunity and Forecast, By Type , 2016-2032
- 6.3.1. Eastern Europe Physical Therapy Market Analysis by Type : Introduction
- 6.3.2. Market Size Absolute $ Opportunity Analysis and Forecast, By Type , 2016-2032
- 6.3.3. Ultrasound
- 6.3.4. Thermoelectric Stimulation
- 6.3.5. Hydrotherapy
- 6.3.6. Other Types
- 6.4. Eastern Europe Physical Therapy Market Analysis, Opportunity and Forecast, By Application, 2016-2032
- 6.4.1. Eastern Europe Physical Therapy Market Analysis by Application: Introduction
- 6.4.2. Market Size Absolute $ Opportunity Analysis and Forecast, By Application, 2016-2032
- 6.4.3. Orthopedic Therapy
- 6.4.4. Pediatric Therapy
- 6.4.5. General Therapy
- 6.4.6. Geriatric Therapy
- 6.4.7. Neurological Therapy
- 6.4.8. Others Application
- 6.5. Eastern Europe Physical Therapy Market Analysis, Opportunity and Forecast, By Demography, 2016-2032
- 6.5.1. Eastern Europe Physical Therapy Market Analysis by Demography: Introduction
- 6.5.2. Market Size Absolute $ Opportunity Analysis and Forecast, By Demography, 2016-2032
- 6.5.3. Geriatric
- 6.5.4. Non-Geriatric
- 6.6. Eastern Europe Physical Therapy Market Analysis, Opportunity and Forecast, By End-Use, 2016-2032
- 6.6.1. Eastern Europe Physical Therapy Market Analysis by End-Use: Introduction
- 6.6.2. Market Size Absolute $ Opportunity Analysis and Forecast, By End-Use, 2016-2032
- 6.6.3. Hospitals & Clinics
- 6.6.4. Community Centers
- 6.6.5. Sports Centers
- 6.6.6. Convalescent Homes
- 6.6.7. Schools & Sports Academies
- 6.6.8. Other End-Use
- 6.7. Eastern Europe Physical Therapy Market Analysis, Opportunity and Forecast, By Country , 2016-2032
- 6.7.1. Eastern Europe Physical Therapy Market Analysis by Country : Introduction
- 6.7.2. Market Size Absolute $ Opportunity Analysis and Forecast, Country , 2016-2032
- 6.7.2.1. Russia
- 6.7.2.2. Poland
- 6.7.2.3. The Czech Republic
- 6.7.2.4. Greece
- 6.7.2.5. Rest of Eastern Europe
- 7. APAC Physical Therapy Market Analysis, Opportunity and Forecast, 2016-2032
- 7.1. APAC Physical Therapy Market Analysis, 2016-2021
- 7.2. APAC Physical Therapy Market Opportunity and Forecast, 2023-2032
- 7.3. APAC Physical Therapy Market Analysis, Opportunity and Forecast, By Type , 2016-2032
- 7.3.1. APAC Physical Therapy Market Analysis by Type : Introduction
- 7.3.2. Market Size Absolute $ Opportunity Analysis and Forecast, By Type , 2016-2032
- 7.3.3. Ultrasound
- 7.3.4. Thermoelectric Stimulation
- 7.3.5. Hydrotherapy
- 7.3.6. Other Types
- 7.4. APAC Physical Therapy Market Analysis, Opportunity and Forecast, By Application, 2016-2032
- 7.4.1. APAC Physical Therapy Market Analysis by Application: Introduction
- 7.4.2. Market Size Absolute $ Opportunity Analysis and Forecast, By Application, 2016-2032
- 7.4.3. Orthopedic Therapy
- 7.4.4. Pediatric Therapy
- 7.4.5. General Therapy
- 7.4.6. Geriatric Therapy
- 7.4.7. Neurological Therapy
- 7.4.8. Others Application
- 7.5. APAC Physical Therapy Market Analysis, Opportunity and Forecast, By Demography, 2016-2032
- 7.5.1. APAC Physical Therapy Market Analysis by Demography: Introduction
- 7.5.2. Market Size Absolute $ Opportunity Analysis and Forecast, By Demography, 2016-2032
- 7.5.3. Geriatric
- 7.5.4. Non-Geriatric
- 7.6. APAC Physical Therapy Market Analysis, Opportunity and Forecast, By End-Use, 2016-2032
- 7.6.1. APAC Physical Therapy Market Analysis by End-Use: Introduction
- 7.6.2. Market Size Absolute $ Opportunity Analysis and Forecast, By End-Use, 2016-2032
- 7.6.3. Hospitals & Clinics
- 7.6.4. Community Centers
- 7.6.5. Sports Centers
- 7.6.6. Convalescent Homes
- 7.6.7. Schools & Sports Academies
- 7.6.8. Other End-Use
- 7.7. APAC Physical Therapy Market Analysis, Opportunity and Forecast, By Country , 2016-2032
- 7.7.1. APAC Physical Therapy Market Analysis by Country : Introduction
- 7.7.2. Market Size Absolute $ Opportunity Analysis and Forecast, Country , 2016-2032
- 7.7.2.1. China
- 7.7.2.2. Japan
- 7.7.2.3. South Korea
- 7.7.2.4. India
- 7.7.2.5. Australia & New Zeland
- 7.7.2.6. Indonesia
- 7.7.2.7. Malaysia
- 7.7.2.8. Philippines
- 7.7.2.9. Singapore
- 7.7.2.10. Thailand
- 7.7.2.11. Vietnam
- 7.7.2.12. Rest of APAC
- 8. Latin America Physical Therapy Market Analysis, Opportunity and Forecast, 2016-2032
- 8.1. Latin America Physical Therapy Market Analysis, 2016-2021
- 8.2. Latin America Physical Therapy Market Opportunity and Forecast, 2023-2032
- 8.3. Latin America Physical Therapy Market Analysis, Opportunity and Forecast, By Type , 2016-2032
- 8.3.1. Latin America Physical Therapy Market Analysis by Type : Introduction
- 8.3.2. Market Size Absolute $ Opportunity Analysis and Forecast, By Type , 2016-2032
- 8.3.3. Ultrasound
- 8.3.4. Thermoelectric Stimulation
- 8.3.5. Hydrotherapy
- 8.3.6. Other Types
- 8.4. Latin America Physical Therapy Market Analysis, Opportunity and Forecast, By Application, 2016-2032
- 8.4.1. Latin America Physical Therapy Market Analysis by Application: Introduction
- 8.4.2. Market Size Absolute $ Opportunity Analysis and Forecast, By Application, 2016-2032
- 8.4.3. Orthopedic Therapy
- 8.4.4. Pediatric Therapy
- 8.4.5. General Therapy
- 8.4.6. Geriatric Therapy
- 8.4.7. Neurological Therapy
- 8.4.8. Others Application
- 8.5. Latin America Physical Therapy Market Analysis, Opportunity and Forecast, By Demography, 2016-2032
- 8.5.1. Latin America Physical Therapy Market Analysis by Demography: Introduction
- 8.5.2. Market Size Absolute $ Opportunity Analysis and Forecast, By Demography, 2016-2032
- 8.5.3. Geriatric
- 8.5.4. Non-Geriatric
- 8.6. Latin America Physical Therapy Market Analysis, Opportunity and Forecast, By End-Use, 2016-2032
- 8.6.1. Latin America Physical Therapy Market Analysis by End-Use: Introduction
- 8.6.2. Market Size Absolute $ Opportunity Analysis and Forecast, By End-Use, 2016-2032
- 8.6.3. Hospitals & Clinics
- 8.6.4. Community Centers
- 8.6.5. Sports Centers
- 8.6.6. Convalescent Homes
- 8.6.7. Schools & Sports Academies
- 8.6.8. Other End-Use
- 8.7. Latin America Physical Therapy Market Analysis, Opportunity and Forecast, By Country , 2016-2032
- 8.7.1. Latin America Physical Therapy Market Analysis by Country : Introduction
- 8.7.2. Market Size Absolute $ Opportunity Analysis and Forecast, Country , 2016-2032
- 8.7.2.1. Brazil
- 8.7.2.2. Colombia
- 8.7.2.3. Chile
- 8.7.2.4. Argentina
- 8.7.2.5. Costa Rica
- 8.7.2.6. Rest of Latin America
- 9. Middle East & Africa Physical Therapy Market Analysis, Opportunity and Forecast, 2016-2032
- 9.1. Middle East & Africa Physical Therapy Market Analysis, 2016-2021
- 9.2. Middle East & Africa Physical Therapy Market Opportunity and Forecast, 2023-2032
- 9.3. Middle East & Africa Physical Therapy Market Analysis, Opportunity and Forecast, By Type , 2016-2032
- 9.3.1. Middle East & Africa Physical Therapy Market Analysis by Type : Introduction
- 9.3.2. Market Size Absolute $ Opportunity Analysis and Forecast, By Type , 2016-2032
- 9.3.3. Ultrasound
- 9.3.4. Thermoelectric Stimulation
- 9.3.5. Hydrotherapy
- 9.3.6. Other Types
- 9.4. Middle East & Africa Physical Therapy Market Analysis, Opportunity and Forecast, By Application, 2016-2032
- 9.4.1. Middle East & Africa Physical Therapy Market Analysis by Application: Introduction
- 9.4.2. Market Size Absolute $ Opportunity Analysis and Forecast, By Application, 2016-2032
- 9.4.3. Orthopedic Therapy
- 9.4.4. Pediatric Therapy
- 9.4.5. General Therapy
- 9.4.6. Geriatric Therapy
- 9.4.7. Neurological Therapy
- 9.4.8. Others Application
- 9.5. Middle East & Africa Physical Therapy Market Analysis, Opportunity and Forecast, By Demography, 2016-2032
- 9.5.1. Middle East & Africa Physical Therapy Market Analysis by Demography: Introduction
- 9.5.2. Market Size Absolute $ Opportunity Analysis and Forecast, By Demography, 2016-2032
- 9.5.3. Geriatric
- 9.5.4. Non-Geriatric
- 9.6. Middle East & Africa Physical Therapy Market Analysis, Opportunity and Forecast, By End-Use, 2016-2032
- 9.6.1. Middle East & Africa Physical Therapy Market Analysis by End-Use: Introduction
- 9.6.2. Market Size Absolute $ Opportunity Analysis and Forecast, By End-Use, 2016-2032
- 9.6.3. Hospitals & Clinics
- 9.6.4. Community Centers
- 9.6.5. Sports Centers
- 9.6.6. Convalescent Homes
- 9.6.7. Schools & Sports Academies
- 9.6.8. Other End-Use
- 9.7. Middle East & Africa Physical Therapy Market Analysis, Opportunity and Forecast, By Country , 2016-2032
- 9.7.1. Middle East & Africa Physical Therapy Market Analysis by Country : Introduction
- 9.7.2. Market Size Absolute $ Opportunity Analysis and Forecast, Country , 2016-2032
- 9.7.2.1. Algeria
- 9.7.2.2. Egypt
- 9.7.2.3. Israel
- 9.7.2.4. Kuwait
- 9.7.2.5. Nigeria
- 9.7.2.6. Saudi Arabia
- 9.7.2.7. South Africa
- 9.7.2.8. Turkey
- 9.7.2.9. The UAE
- 9.7.2.10. Rest of MEA
- 10. Global Physical Therapy Market Analysis, Opportunity and Forecast, By Region , 2016-2032
- 10.1. Global Physical Therapy Market Analysis by Region : Introduction
- 10.2. Market Size Absolute $ Opportunity Analysis and Forecast, By Region , 2016-2032
- 10.2.1. North America
- 10.2.2. Western Europe
- 10.2.3. Eastern Europe
- 10.2.4. APAC
- 10.2.5. Latin America
- 10.2.6. Middle East & Africa
- 11. Global Physical Therapy Market Competitive Landscape, Market Share Analysis, and Company Profiles
- 11.1. Market Share Analysis
- 11.2. Company Profiles
- 11.3. BTL
- 11.3.1. Company Overview
- 11.3.2. Financial Highlights
- 11.3.3. Product Portfolio
- 11.3.4. SWOT Analysis
- 11.3.5. Key Strategies and Developments
- 11.4. Zimmer MedizinSysteme GmbH
- 11.4.1. Company Overview
- 11.4.2. Financial Highlights
- 11.4.3. Product Portfolio
- 11.4.4. SWOT Analysis
- 11.4.5. Key Strategies and Developments
- 11.5. Whitehall Manufacturing
- 11.5.1. Company Overview
- 11.5.2. Financial Highlights
- 11.5.3. Product Portfolio
- 11.5.4. SWOT Analysis
- 11.5.5. Key Strategies and Developments
- 11.6. Storz Medical AG
- 11.6.1. Company Overview
- 11.6.2. Financial Highlights
- 11.6.3. Product Portfolio
- 11.6.4. SWOT Analysis
- 11.6.5. Key Strategies and Developments
- 11.7. RICHMAR
- 11.7.1. Company Overview
- 11.7.2. Financial Highlights
- 11.7.3. Product Portfolio
- 11.7.4. SWOT Analysis
- 11.7.5. Key Strategies and Developments
- 11.8. Rehab Alternatives PLLC
- 11.8.1. Company Overview
- 11.8.2. Financial Highlights
- 11.8.3. Product Portfolio
- 11.8.4. SWOT Analysis
- 11.8.5. Key Strategies and Developments
- 11.9. PIVOT Physical Therapy
- 11.9.1. Company Overview
- 11.9.2. Financial Highlights
- 11.9.3. Product Portfolio
- 11.9.4. SWOT Analysis
- 11.9.5. Key Strategies and Developments
- 11.10. Performance Health
- 11.10.1. Company Overview
- 11.10.2. Financial Highlights
- 11.10.3. Product Portfolio
- 11.10.4. SWOT Analysis
- 11.10.5. Key Strategies and Developments
- 11.11. ITO Co., Ltd.
- 11.11.1. Company Overview
- 11.11.2. Financial Highlights
- 11.11.3. Product Portfolio
- 11.11.4. SWOT Analysis
- 11.11.5. Key Strategies and Developments
- 11.12. Enraf-Nonius B.V.
- 11.12.1. Company Overview
- 11.12.2. Financial Highlights
- 11.12.3. Product Portfolio
- 11.12.4. SWOT Analysis
- 11.12.5. Key Strategies and Developments
- 11.13. EMS Physio Ltd.
- 11.13.1. Company Overview
- 11.13.2. Financial Highlights
- 11.13.3. Product Portfolio
- 11.13.4. SWOT Analysis
- 11.13.5. Key Strategies and Developments
- 11.14. Other Key Players
- 11.14.1. Company Overview
- 11.14.2. Financial Highlights
- 11.14.3. Product Portfolio
- 11.14.4. SWOT Analysis
- 11.14.5. Key Strategies and Developments
- 12. Assumptions and Acronyms
- 13. Research Methodology
- 14. Contact
-
- List of Figures
- Figure 1: Global Physical Therapy Market Revenue (US$ Mn) Market Share by Type in 2022
- Figure 2: Global Physical Therapy Market Attractiveness Analysis by Type , 2016-2032
- Figure 3: Global Physical Therapy Market Revenue (US$ Mn) Market Share by Applicationin 2022
- Figure 4: Global Physical Therapy Market Attractiveness Analysis by Application, 2016-2032
- Figure 5: Global Physical Therapy Market Revenue (US$ Mn) Market Share by Demographyin 2022
- Figure 6: Global Physical Therapy Market Attractiveness Analysis by Demography, 2016-2032
- Figure 7: Global Physical Therapy Market Revenue (US$ Mn) Market Share by End-Usein 2022
- Figure 8: Global Physical Therapy Market Attractiveness Analysis by End-Use, 2016-2032
- Figure 9: Global Physical Therapy Market Revenue (US$ Mn) Market Share by Region in 2022
- Figure 10: Global Physical Therapy Market Attractiveness Analysis by Region, 2016-2032
- Figure 11: Global Physical Therapy Market Revenue (US$ Mn) (2016-2032)
- Figure 12: Global Physical Therapy Market Revenue (US$ Mn) Comparison by Region (2016-2032)
- Figure 13: Global Physical Therapy Market Revenue (US$ Mn) Comparison by Type (2016-2032)
- Figure 14: Global Physical Therapy Market Revenue (US$ Mn) Comparison by Application (2016-2032)
- Figure 15: Global Physical Therapy Market Revenue (US$ Mn) Comparison by Demography (2016-2032)
- Figure 16: Global Physical Therapy Market Revenue (US$ Mn) Comparison by End-Use (2016-2032)
- Figure 17: Global Physical Therapy Market Y-o-Y Growth Rate Comparison by Region (2016-2032)
- Figure 18: Global Physical Therapy Market Y-o-Y Growth Rate Comparison by Type (2016-2032)
- Figure 19: Global Physical Therapy Market Y-o-Y Growth Rate Comparison by Application (2016-2032)
- Figure 20: Global Physical Therapy Market Y-o-Y Growth Rate Comparison by Demography (2016-2032)
- Figure 21: Global Physical Therapy Market Y-o-Y Growth Rate Comparison by End-Use (2016-2032)
- Figure 22: Global Physical Therapy Market Share Comparison by Region (2016-2032)
- Figure 23: Global Physical Therapy Market Share Comparison by Type (2016-2032)
- Figure 24: Global Physical Therapy Market Share Comparison by Application (2016-2032)
- Figure 25: Global Physical Therapy Market Share Comparison by Demography (2016-2032)
- Figure 26: Global Physical Therapy Market Share Comparison by End-Use (2016-2032)
- Figure 27: North America Physical Therapy Market Revenue (US$ Mn) Market Share by Type in 2022
- Figure 28: North America Physical Therapy Market Attractiveness Analysis by Type , 2016-2032
- Figure 29: North America Physical Therapy Market Revenue (US$ Mn) Market Share by Applicationin 2022
- Figure 30: North America Physical Therapy Market Attractiveness Analysis by Application, 2016-2032
- Figure 31: North America Physical Therapy Market Revenue (US$ Mn) Market Share by Demographyin 2022
- Figure 32: North America Physical Therapy Market Attractiveness Analysis by Demography, 2016-2032
- Figure 33: North America Physical Therapy Market Revenue (US$ Mn) Market Share by End-Usein 2022
- Figure 34: North America Physical Therapy Market Attractiveness Analysis by End-Use, 2016-2032
- Figure 35: North America Physical Therapy Market Revenue (US$ Mn) Market Share by Country in 2022
- Figure 36: North America Physical Therapy Market Attractiveness Analysis by Country, 2016-2032
- Figure 37: North America Physical Therapy Market Revenue (US$ Mn) (2016-2032)
- Figure 38: North America Physical Therapy Market Revenue (US$ Mn) Comparison by Country (2016-2032)
- Figure 39: North America Physical Therapy Market Revenue (US$ Mn) Comparison by Type (2016-2032)
- Figure 40: North America Physical Therapy Market Revenue (US$ Mn) Comparison by Application (2016-2032)
- Figure 41: North America Physical Therapy Market Revenue (US$ Mn) Comparison by Demography (2016-2032)
- Figure 42: North America Physical Therapy Market Revenue (US$ Mn) Comparison by End-Use (2016-2032)
- Figure 43: North America Physical Therapy Market Y-o-Y Growth Rate Comparison by Country (2016-2032)
- Figure 44: North America Physical Therapy Market Y-o-Y Growth Rate Comparison by Type (2016-2032)
- Figure 45: North America Physical Therapy Market Y-o-Y Growth Rate Comparison by Application (2016-2032)
- Figure 46: North America Physical Therapy Market Y-o-Y Growth Rate Comparison by Demography (2016-2032)
- Figure 47: North America Physical Therapy Market Y-o-Y Growth Rate Comparison by End-Use (2016-2032)
- Figure 48: North America Physical Therapy Market Share Comparison by Country (2016-2032)
- Figure 49: North America Physical Therapy Market Share Comparison by Type (2016-2032)
- Figure 50: North America Physical Therapy Market Share Comparison by Application (2016-2032)
- Figure 51: North America Physical Therapy Market Share Comparison by Demography (2016-2032)
- Figure 52: North America Physical Therapy Market Share Comparison by End-Use (2016-2032)
- Figure 53: Western Europe Physical Therapy Market Revenue (US$ Mn) Market Share by Type in 2022
- Figure 54: Western Europe Physical Therapy Market Attractiveness Analysis by Type , 2016-2032
- Figure 55: Western Europe Physical Therapy Market Revenue (US$ Mn) Market Share by Applicationin 2022
- Figure 56: Western Europe Physical Therapy Market Attractiveness Analysis by Application, 2016-2032
- Figure 57: Western Europe Physical Therapy Market Revenue (US$ Mn) Market Share by Demographyin 2022
- Figure 58: Western Europe Physical Therapy Market Attractiveness Analysis by Demography, 2016-2032
- Figure 59: Western Europe Physical Therapy Market Revenue (US$ Mn) Market Share by End-Usein 2022
- Figure 60: Western Europe Physical Therapy Market Attractiveness Analysis by End-Use, 2016-2032
- Figure 61: Western Europe Physical Therapy Market Revenue (US$ Mn) Market Share by Country in 2022
- Figure 62: Western Europe Physical Therapy Market Attractiveness Analysis by Country, 2016-2032
- Figure 63: Western Europe Physical Therapy Market Revenue (US$ Mn) (2016-2032)
- Figure 64: Western Europe Physical Therapy Market Revenue (US$ Mn) Comparison by Country (2016-2032)
- Figure 65: Western Europe Physical Therapy Market Revenue (US$ Mn) Comparison by Type (2016-2032)
- Figure 66: Western Europe Physical Therapy Market Revenue (US$ Mn) Comparison by Application (2016-2032)
- Figure 67: Western Europe Physical Therapy Market Revenue (US$ Mn) Comparison by Demography (2016-2032)
- Figure 68: Western Europe Physical Therapy Market Revenue (US$ Mn) Comparison by End-Use (2016-2032)
- Figure 69: Western Europe Physical Therapy Market Y-o-Y Growth Rate Comparison by Country (2016-2032)
- Figure 70: Western Europe Physical Therapy Market Y-o-Y Growth Rate Comparison by Type (2016-2032)
- Figure 71: Western Europe Physical Therapy Market Y-o-Y Growth Rate Comparison by Application (2016-2032)
- Figure 72: Western Europe Physical Therapy Market Y-o-Y Growth Rate Comparison by Demography (2016-2032)
- Figure 73: Western Europe Physical Therapy Market Y-o-Y Growth Rate Comparison by End-Use (2016-2032)
- Figure 74: Western Europe Physical Therapy Market Share Comparison by Country (2016-2032)
- Figure 75: Western Europe Physical Therapy Market Share Comparison by Type (2016-2032)
- Figure 76: Western Europe Physical Therapy Market Share Comparison by Application (2016-2032)
- Figure 77: Western Europe Physical Therapy Market Share Comparison by Demography (2016-2032)
- Figure 78: Western Europe Physical Therapy Market Share Comparison by End-Use (2016-2032)
- Figure 79: Eastern Europe Physical Therapy Market Revenue (US$ Mn) Market Share by Type in 2022
- Figure 80: Eastern Europe Physical Therapy Market Attractiveness Analysis by Type , 2016-2032
- Figure 81: Eastern Europe Physical Therapy Market Revenue (US$ Mn) Market Share by Applicationin 2022
- Figure 82: Eastern Europe Physical Therapy Market Attractiveness Analysis by Application, 2016-2032
- Figure 83: Eastern Europe Physical Therapy Market Revenue (US$ Mn) Market Share by Demographyin 2022
- Figure 84: Eastern Europe Physical Therapy Market Attractiveness Analysis by Demography, 2016-2032
- Figure 85: Eastern Europe Physical Therapy Market Revenue (US$ Mn) Market Share by End-Usein 2022
- Figure 86: Eastern Europe Physical Therapy Market Attractiveness Analysis by End-Use, 2016-2032
- Figure 87: Eastern Europe Physical Therapy Market Revenue (US$ Mn) Market Share by Country in 2022
- Figure 88: Eastern Europe Physical Therapy Market Attractiveness Analysis by Country, 2016-2032
- Figure 89: Eastern Europe Physical Therapy Market Revenue (US$ Mn) (2016-2032)
- Figure 90: Eastern Europe Physical Therapy Market Revenue (US$ Mn) Comparison by Country (2016-2032)
- Figure 91: Eastern Europe Physical Therapy Market Revenue (US$ Mn) Comparison by Type (2016-2032)
- Figure 92: Eastern Europe Physical Therapy Market Revenue (US$ Mn) Comparison by Application (2016-2032)
- Figure 93: Eastern Europe Physical Therapy Market Revenue (US$ Mn) Comparison by Demography (2016-2032)
- Figure 94: Eastern Europe Physical Therapy Market Revenue (US$ Mn) Comparison by End-Use (2016-2032)
- Figure 95: Eastern Europe Physical Therapy Market Y-o-Y Growth Rate Comparison by Country (2016-2032)
- Figure 96: Eastern Europe Physical Therapy Market Y-o-Y Growth Rate Comparison by Type (2016-2032)
- Figure 97: Eastern Europe Physical Therapy Market Y-o-Y Growth Rate Comparison by Application (2016-2032)
- Figure 98: Eastern Europe Physical Therapy Market Y-o-Y Growth Rate Comparison by Demography (2016-2032)
- Figure 99: Eastern Europe Physical Therapy Market Y-o-Y Growth Rate Comparison by End-Use (2016-2032)
- Figure 100: Eastern Europe Physical Therapy Market Share Comparison by Country (2016-2032)
- Figure 101: Eastern Europe Physical Therapy Market Share Comparison by Type (2016-2032)
- Figure 102: Eastern Europe Physical Therapy Market Share Comparison by Application (2016-2032)
- Figure 103: Eastern Europe Physical Therapy Market Share Comparison by Demography (2016-2032)
- Figure 104: Eastern Europe Physical Therapy Market Share Comparison by End-Use (2016-2032)
- Figure 105: APAC Physical Therapy Market Revenue (US$ Mn) Market Share by Type in 2022
- Figure 106: APAC Physical Therapy Market Attractiveness Analysis by Type , 2016-2032
- Figure 107: APAC Physical Therapy Market Revenue (US$ Mn) Market Share by Applicationin 2022
- Figure 108: APAC Physical Therapy Market Attractiveness Analysis by Application, 2016-2032
- Figure 109: APAC Physical Therapy Market Revenue (US$ Mn) Market Share by Demographyin 2022
- Figure 110: APAC Physical Therapy Market Attractiveness Analysis by Demography, 2016-2032
- Figure 111: APAC Physical Therapy Market Revenue (US$ Mn) Market Share by End-Usein 2022
- Figure 112: APAC Physical Therapy Market Attractiveness Analysis by End-Use, 2016-2032
- Figure 113: APAC Physical Therapy Market Revenue (US$ Mn) Market Share by Country in 2022
- Figure 114: APAC Physical Therapy Market Attractiveness Analysis by Country, 2016-2032
- Figure 115: APAC Physical Therapy Market Revenue (US$ Mn) (2016-2032)
- Figure 116: APAC Physical Therapy Market Revenue (US$ Mn) Comparison by Country (2016-2032)
- Figure 117: APAC Physical Therapy Market Revenue (US$ Mn) Comparison by Type (2016-2032)
- Figure 118: APAC Physical Therapy Market Revenue (US$ Mn) Comparison by Application (2016-2032)
- Figure 119: APAC Physical Therapy Market Revenue (US$ Mn) Comparison by Demography (2016-2032)
- Figure 120: APAC Physical Therapy Market Revenue (US$ Mn) Comparison by End-Use (2016-2032)
- Figure 121: APAC Physical Therapy Market Y-o-Y Growth Rate Comparison by Country (2016-2032)
- Figure 122: APAC Physical Therapy Market Y-o-Y Growth Rate Comparison by Type (2016-2032)
- Figure 123: APAC Physical Therapy Market Y-o-Y Growth Rate Comparison by Application (2016-2032)
- Figure 124: APAC Physical Therapy Market Y-o-Y Growth Rate Comparison by Demography (2016-2032)
- Figure 125: APAC Physical Therapy Market Y-o-Y Growth Rate Comparison by End-Use (2016-2032)
- Figure 126: APAC Physical Therapy Market Share Comparison by Country (2016-2032)
- Figure 127: APAC Physical Therapy Market Share Comparison by Type (2016-2032)
- Figure 128: APAC Physical Therapy Market Share Comparison by Application (2016-2032)
- Figure 129: APAC Physical Therapy Market Share Comparison by Demography (2016-2032)
- Figure 130: APAC Physical Therapy Market Share Comparison by End-Use (2016-2032)
- Figure 131: Latin America Physical Therapy Market Revenue (US$ Mn) Market Share by Type in 2022
- Figure 132: Latin America Physical Therapy Market Attractiveness Analysis by Type , 2016-2032
- Figure 133: Latin America Physical Therapy Market Revenue (US$ Mn) Market Share by Applicationin 2022
- Figure 134: Latin America Physical Therapy Market Attractiveness Analysis by Application, 2016-2032
- Figure 135: Latin America Physical Therapy Market Revenue (US$ Mn) Market Share by Demographyin 2022
- Figure 136: Latin America Physical Therapy Market Attractiveness Analysis by Demography, 2016-2032
- Figure 137: Latin America Physical Therapy Market Revenue (US$ Mn) Market Share by End-Usein 2022
- Figure 138: Latin America Physical Therapy Market Attractiveness Analysis by End-Use, 2016-2032
- Figure 139: Latin America Physical Therapy Market Revenue (US$ Mn) Market Share by Country in 2022
- Figure 140: Latin America Physical Therapy Market Attractiveness Analysis by Country, 2016-2032
- Figure 141: Latin America Physical Therapy Market Revenue (US$ Mn) (2016-2032)
- Figure 142: Latin America Physical Therapy Market Revenue (US$ Mn) Comparison by Country (2016-2032)
- Figure 143: Latin America Physical Therapy Market Revenue (US$ Mn) Comparison by Type (2016-2032)
- Figure 144: Latin America Physical Therapy Market Revenue (US$ Mn) Comparison by Application (2016-2032)
- Figure 145: Latin America Physical Therapy Market Revenue (US$ Mn) Comparison by Demography (2016-2032)
- Figure 146: Latin America Physical Therapy Market Revenue (US$ Mn) Comparison by End-Use (2016-2032)
- Figure 147: Latin America Physical Therapy Market Y-o-Y Growth Rate Comparison by Country (2016-2032)
- Figure 148: Latin America Physical Therapy Market Y-o-Y Growth Rate Comparison by Type (2016-2032)
- Figure 149: Latin America Physical Therapy Market Y-o-Y Growth Rate Comparison by Application (2016-2032)
- Figure 150: Latin America Physical Therapy Market Y-o-Y Growth Rate Comparison by Demography (2016-2032)
- Figure 151: Latin America Physical Therapy Market Y-o-Y Growth Rate Comparison by End-Use (2016-2032)
- Figure 152: Latin America Physical Therapy Market Share Comparison by Country (2016-2032)
- Figure 153: Latin America Physical Therapy Market Share Comparison by Type (2016-2032)
- Figure 154: Latin America Physical Therapy Market Share Comparison by Application (2016-2032)
- Figure 155: Latin America Physical Therapy Market Share Comparison by Demography (2016-2032)
- Figure 156: Latin America Physical Therapy Market Share Comparison by End-Use (2016-2032)
- Figure 157: Middle East & Africa Physical Therapy Market Revenue (US$ Mn) Market Share by Type in 2022
- Figure 158: Middle East & Africa Physical Therapy Market Attractiveness Analysis by Type , 2016-2032
- Figure 159: Middle East & Africa Physical Therapy Market Revenue (US$ Mn) Market Share by Applicationin 2022
- Figure 160: Middle East & Africa Physical Therapy Market Attractiveness Analysis by Application, 2016-2032
- Figure 161: Middle East & Africa Physical Therapy Market Revenue (US$ Mn) Market Share by Demographyin 2022
- Figure 162: Middle East & Africa Physical Therapy Market Attractiveness Analysis by Demography, 2016-2032
- Figure 163: Middle East & Africa Physical Therapy Market Revenue (US$ Mn) Market Share by End-Usein 2022
- Figure 164: Middle East & Africa Physical Therapy Market Attractiveness Analysis by End-Use, 2016-2032
- Figure 165: Middle East & Africa Physical Therapy Market Revenue (US$ Mn) Market Share by Country in 2022
- Figure 166: Middle East & Africa Physical Therapy Market Attractiveness Analysis by Country, 2016-2032
- Figure 167: Middle East & Africa Physical Therapy Market Revenue (US$ Mn) (2016-2032)
- Figure 168: Middle East & Africa Physical Therapy Market Revenue (US$ Mn) Comparison by Country (2016-2032)
- Figure 169: Middle East & Africa Physical Therapy Market Revenue (US$ Mn) Comparison by Type (2016-2032)
- Figure 170: Middle East & Africa Physical Therapy Market Revenue (US$ Mn) Comparison by Application (2016-2032)
- Figure 171: Middle East & Africa Physical Therapy Market Revenue (US$ Mn) Comparison by Demography (2016-2032)
- Figure 172: Middle East & Africa Physical Therapy Market Revenue (US$ Mn) Comparison by End-Use (2016-2032)
- Figure 173: Middle East & Africa Physical Therapy Market Y-o-Y Growth Rate Comparison by Country (2016-2032)
- Figure 174: Middle East & Africa Physical Therapy Market Y-o-Y Growth Rate Comparison by Type (2016-2032)
- Figure 175: Middle East & Africa Physical Therapy Market Y-o-Y Growth Rate Comparison by Application (2016-2032)
- Figure 176: Middle East & Africa Physical Therapy Market Y-o-Y Growth Rate Comparison by Demography (2016-2032)
- Figure 177: Middle East & Africa Physical Therapy Market Y-o-Y Growth Rate Comparison by End-Use (2016-2032)
- Figure 178: Middle East & Africa Physical Therapy Market Share Comparison by Country (2016-2032)
- Figure 179: Middle East & Africa Physical Therapy Market Share Comparison by Type (2016-2032)
- Figure 180: Middle East & Africa Physical Therapy Market Share Comparison by Application (2016-2032)
- Figure 181: Middle East & Africa Physical Therapy Market Share Comparison by Demography (2016-2032)
- Figure 182: Middle East & Africa Physical Therapy Market Share Comparison by End-Use (2016-2032)
- List of Figures
- List of Tables
- Table 1: Global Physical Therapy Market Comparison by Type (2016-2032)
- Table 2: Global Physical Therapy Market Comparison by Application (2016-2032)
- Table 3: Global Physical Therapy Market Comparison by Demography (2016-2032)
- Table 4: Global Physical Therapy Market Comparison by End-Use (2016-2032)
- Table 5: Global Physical Therapy Market Revenue (US$ Mn) Comparison by Region (2016-2032)
- Table 6: Global Physical Therapy Market Revenue (US$ Mn) (2016-2032)
- Table 7: Global Physical Therapy Market Revenue (US$ Mn) Comparison by Region (2016-2032)
- Table 8: Global Physical Therapy Market Revenue (US$ Mn) Comparison by Type (2016-2032)
- Table 9: Global Physical Therapy Market Revenue (US$ Mn) Comparison by Application (2016-2032)
- Table 10: Global Physical Therapy Market Revenue (US$ Mn) Comparison by Demography (2016-2032)
- Table 11: Global Physical Therapy Market Revenue (US$ Mn) Comparison by End-Use (2016-2032)
- Table 12: Global Physical Therapy Market Y-o-Y Growth Rate Comparison by Region (2016-2032)
- Table 13: Global Physical Therapy Market Y-o-Y Growth Rate Comparison by Type (2016-2032)
- Table 14: Global Physical Therapy Market Y-o-Y Growth Rate Comparison by Application (2016-2032)
- Table 15: Global Physical Therapy Market Y-o-Y Growth Rate Comparison by Demography (2016-2032)
- Table 16: Global Physical Therapy Market Y-o-Y Growth Rate Comparison by End-Use (2016-2032)
- Table 17: Global Physical Therapy Market Share Comparison by Region (2016-2032)
- Table 18: Global Physical Therapy Market Share Comparison by Type (2016-2032)
- Table 19: Global Physical Therapy Market Share Comparison by Application (2016-2032)
- Table 20: Global Physical Therapy Market Share Comparison by Demography (2016-2032)
- Table 21: Global Physical Therapy Market Share Comparison by End-Use (2016-2032)
- Table 22: North America Physical Therapy Market Comparison by Application (2016-2032)
- Table 23: North America Physical Therapy Market Comparison by Demography (2016-2032)
- Table 24: North America Physical Therapy Market Comparison by End-Use (2016-2032)
- Table 25: North America Physical Therapy Market Revenue (US$ Mn) Comparison by Country (2016-2032)
- Table 26: North America Physical Therapy Market Revenue (US$ Mn) (2016-2032)
- Table 27: North America Physical Therapy Market Revenue (US$ Mn) Comparison by Country (2016-2032)
- Table 28: North America Physical Therapy Market Revenue (US$ Mn) Comparison by Type (2016-2032)
- Table 29: North America Physical Therapy Market Revenue (US$ Mn) Comparison by Application (2016-2032)
- Table 30: North America Physical Therapy Market Revenue (US$ Mn) Comparison by Demography (2016-2032)
- Table 31: North America Physical Therapy Market Revenue (US$ Mn) Comparison by End-Use (2016-2032)
- Table 32: North America Physical Therapy Market Y-o-Y Growth Rate Comparison by Country (2016-2032)
- Table 33: North America Physical Therapy Market Y-o-Y Growth Rate Comparison by Type (2016-2032)
- Table 34: North America Physical Therapy Market Y-o-Y Growth Rate Comparison by Application (2016-2032)
- Table 35: North America Physical Therapy Market Y-o-Y Growth Rate Comparison by Demography (2016-2032)
- Table 36: North America Physical Therapy Market Y-o-Y Growth Rate Comparison by End-Use (2016-2032)
- Table 37: North America Physical Therapy Market Share Comparison by Country (2016-2032)
- Table 38: North America Physical Therapy Market Share Comparison by Type (2016-2032)
- Table 39: North America Physical Therapy Market Share Comparison by Application (2016-2032)
- Table 40: North America Physical Therapy Market Share Comparison by Demography (2016-2032)
- Table 41: North America Physical Therapy Market Share Comparison by End-Use (2016-2032)
- Table 42: Western Europe Physical Therapy Market Comparison by Type (2016-2032)
- Table 43: Western Europe Physical Therapy Market Comparison by Application (2016-2032)
- Table 44: Western Europe Physical Therapy Market Comparison by Demography (2016-2032)
- Table 45: Western Europe Physical Therapy Market Comparison by End-Use (2016-2032)
- Table 46: Western Europe Physical Therapy Market Revenue (US$ Mn) Comparison by Country (2016-2032)
- Table 47: Western Europe Physical Therapy Market Revenue (US$ Mn) (2016-2032)
- Table 48: Western Europe Physical Therapy Market Revenue (US$ Mn) Comparison by Country (2016-2032)
- Table 49: Western Europe Physical Therapy Market Revenue (US$ Mn) Comparison by Type (2016-2032)
- Table 50: Western Europe Physical Therapy Market Revenue (US$ Mn) Comparison by Application (2016-2032)
- Table 51: Western Europe Physical Therapy Market Revenue (US$ Mn) Comparison by Demography (2016-2032)
- Table 52: Western Europe Physical Therapy Market Revenue (US$ Mn) Comparison by End-Use (2016-2032)
- Table 53: Western Europe Physical Therapy Market Y-o-Y Growth Rate Comparison by Country (2016-2032)
- Table 54: Western Europe Physical Therapy Market Y-o-Y Growth Rate Comparison by Type (2016-2032)
- Table 55: Western Europe Physical Therapy Market Y-o-Y Growth Rate Comparison by Application (2016-2032)
- Table 56: Western Europe Physical Therapy Market Y-o-Y Growth Rate Comparison by Demography (2016-2032)
- Table 57: Western Europe Physical Therapy Market Y-o-Y Growth Rate Comparison by End-Use (2016-2032)
- Table 58: Western Europe Physical Therapy Market Share Comparison by Country (2016-2032)
- Table 59: Western Europe Physical Therapy Market Share Comparison by Type (2016-2032)
- Table 60: Western Europe Physical Therapy Market Share Comparison by Application (2016-2032)
- Table 61: Western Europe Physical Therapy Market Share Comparison by Demography (2016-2032)
- Table 62: Western Europe Physical Therapy Market Share Comparison by End-Use (2016-2032)
- Table 63: Eastern Europe Physical Therapy Market Comparison by Type (2016-2032)
- Table 64: Eastern Europe Physical Therapy Market Comparison by Application (2016-2032)
- Table 65: Eastern Europe Physical Therapy Market Comparison by Demography (2016-2032)
- Table 66: Eastern Europe Physical Therapy Market Comparison by End-Use (2016-2032)
- Table 67: Eastern Europe Physical Therapy Market Revenue (US$ Mn) Comparison by Country (2016-2032)
- Table 68: Eastern Europe Physical Therapy Market Revenue (US$ Mn) (2016-2032)
- Table 69: Eastern Europe Physical Therapy Market Revenue (US$ Mn) Comparison by Country (2016-2032)
- Table 70: Eastern Europe Physical Therapy Market Revenue (US$ Mn) Comparison by Type (2016-2032)
- Table 71: Eastern Europe Physical Therapy Market Revenue (US$ Mn) Comparison by Application (2016-2032)
- Table 72: Eastern Europe Physical Therapy Market Revenue (US$ Mn) Comparison by Demography (2016-2032)
- Table 73: Eastern Europe Physical Therapy Market Revenue (US$ Mn) Comparison by End-Use (2016-2032)
- Table 74: Eastern Europe Physical Therapy Market Y-o-Y Growth Rate Comparison by Country (2016-2032)
- Table 75: Eastern Europe Physical Therapy Market Y-o-Y Growth Rate Comparison by Type (2016-2032)
- Table 76: Eastern Europe Physical Therapy Market Y-o-Y Growth Rate Comparison by Application (2016-2032)
- Table 77: Eastern Europe Physical Therapy Market Y-o-Y Growth Rate Comparison by Demography (2016-2032)
- Table 78: Eastern Europe Physical Therapy Market Y-o-Y Growth Rate Comparison by End-Use (2016-2032)
- Table 79: Eastern Europe Physical Therapy Market Share Comparison by Country (2016-2032)
- Table 80: Eastern Europe Physical Therapy Market Share Comparison by Type (2016-2032)
- Table 81: Eastern Europe Physical Therapy Market Share Comparison by Application (2016-2032)
- Table 82: Eastern Europe Physical Therapy Market Share Comparison by Demography (2016-2032)
- Table 83: Eastern Europe Physical Therapy Market Share Comparison by End-Use (2016-2032)
- Table 84: APAC Physical Therapy Market Comparison by Type (2016-2032)
- Table 85: APAC Physical Therapy Market Comparison by Application (2016-2032)
- Table 86: APAC Physical Therapy Market Comparison by Demography (2016-2032)
- Table 87: APAC Physical Therapy Market Comparison by End-Use (2016-2032)
- Table 88: APAC Physical Therapy Market Revenue (US$ Mn) Comparison by Country (2016-2032)
- Table 89: APAC Physical Therapy Market Revenue (US$ Mn) (2016-2032)
- Table 90: APAC Physical Therapy Market Revenue (US$ Mn) Comparison by Country (2016-2032)
- Table 91: APAC Physical Therapy Market Revenue (US$ Mn) Comparison by Type (2016-2032)
- Table 92: APAC Physical Therapy Market Revenue (US$ Mn) Comparison by Application (2016-2032)
- Table 93: APAC Physical Therapy Market Revenue (US$ Mn) Comparison by Demography (2016-2032)
- Table 94: APAC Physical Therapy Market Revenue (US$ Mn) Comparison by End-Use (2016-2032)
- Table 95: APAC Physical Therapy Market Y-o-Y Growth Rate Comparison by Country (2016-2032)
- Table 96: APAC Physical Therapy Market Y-o-Y Growth Rate Comparison by Type (2016-2032)
- Table 97: APAC Physical Therapy Market Y-o-Y Growth Rate Comparison by Application (2016-2032)
- Table 98: APAC Physical Therapy Market Y-o-Y Growth Rate Comparison by Demography (2016-2032)
- Table 99: APAC Physical Therapy Market Y-o-Y Growth Rate Comparison by End-Use (2016-2032)
- Table 100: APAC Physical Therapy Market Share Comparison by Country (2016-2032)
- Table 101: APAC Physical Therapy Market Share Comparison by Type (2016-2032)
- Table 102: APAC Physical Therapy Market Share Comparison by Application (2016-2032)
- Table 103: APAC Physical Therapy Market Share Comparison by Demography (2016-2032)
- Table 104: APAC Physical Therapy Market Share Comparison by End-Use (2016-2032)
- Table 105: Latin America Physical Therapy Market Comparison by Type (2016-2032)
- Table 106: Latin America Physical Therapy Market Comparison by Application (2016-2032)
- Table 107: Latin America Physical Therapy Market Comparison by Demography (2016-2032)
- Table 108: Latin America Physical Therapy Market Comparison by End-Use (2016-2032)
- Table 109: Latin America Physical Therapy Market Revenue (US$ Mn) Comparison by Country (2016-2032)
- Table 110: Latin America Physical Therapy Market Revenue (US$ Mn) (2016-2032)
- Table 111: Latin America Physical Therapy Market Revenue (US$ Mn) Comparison by Country (2016-2032)
- Table 112: Latin America Physical Therapy Market Revenue (US$ Mn) Comparison by Type (2016-2032)
- Table 113: Latin America Physical Therapy Market Revenue (US$ Mn) Comparison by Application (2016-2032)
- Table 114: Latin America Physical Therapy Market Revenue (US$ Mn) Comparison by Demography (2016-2032)
- Table 115: Latin America Physical Therapy Market Revenue (US$ Mn) Comparison by End-Use (2016-2032)
- Table 116: Latin America Physical Therapy Market Y-o-Y Growth Rate Comparison by Country (2016-2032)
- Table 117: Latin America Physical Therapy Market Y-o-Y Growth Rate Comparison by Type (2016-2032)
- Table 118: Latin America Physical Therapy Market Y-o-Y Growth Rate Comparison by Application (2016-2032)
- Table 119: Latin America Physical Therapy Market Y-o-Y Growth Rate Comparison by Demography (2016-2032)
- Table 120: Latin America Physical Therapy Market Y-o-Y Growth Rate Comparison by End-Use (2016-2032)
- Table 121: Latin America Physical Therapy Market Share Comparison by Country (2016-2032)
- Table 122: Latin America Physical Therapy Market Share Comparison by Type (2016-2032)
- Table 123: Latin America Physical Therapy Market Share Comparison by Application (2016-2032)
- Table 124: Latin America Physical Therapy Market Share Comparison by Demography (2016-2032)
- Table 125: Latin America Physical Therapy Market Share Comparison by End-Use (2016-2032)
- Table 126: Middle East & Africa Physical Therapy Market Comparison by Type (2016-2032)
- Table 127: Middle East & Africa Physical Therapy Market Comparison by Application (2016-2032)
- Table 128: Middle East & Africa Physical Therapy Market Comparison by Demography (2016-2032)
- Table 129: Middle East & Africa Physical Therapy Market Comparison by End-Use (2016-2032)
- Table 130: Middle East & Africa Physical Therapy Market Revenue (US$ Mn) Comparison by Country (2016-2032)
- Table 131: Middle East & Africa Physical Therapy Market Revenue (US$ Mn) (2016-2032)
- Table 132: Middle East & Africa Physical Therapy Market Revenue (US$ Mn) Comparison by Country (2016-2032)
- Table 133: Middle East & Africa Physical Therapy Market Revenue (US$ Mn) Comparison by Type (2016-2032)
- Table 134: Middle East & Africa Physical Therapy Market Revenue (US$ Mn) Comparison by Application (2016-2032)
- Table 135: Middle East & Africa Physical Therapy Market Revenue (US$ Mn) Comparison by Demography (2016-2032)
- Table 136: Middle East & Africa Physical Therapy Market Revenue (US$ Mn) Comparison by End-Use (2016-2032)
- Table 137: Middle East & Africa Physical Therapy Market Y-o-Y Growth Rate Comparison by Country (2016-2032)
- Table 138: Middle East & Africa Physical Therapy Market Y-o-Y Growth Rate Comparison by Type (2016-2032)
- Table 139: Middle East & Africa Physical Therapy Market Y-o-Y Growth Rate Comparison by Application (2016-2032)
- Table 140: Middle East & Africa Physical Therapy Market Y-o-Y Growth Rate Comparison by Demography (2016-2032)
- Table 141: Middle East & Africa Physical Therapy Market Y-o-Y Growth Rate Comparison by End-Use (2016-2032)
- Table 142: Middle East & Africa Physical Therapy Market Share Comparison by Country (2016-2032)
- Table 143: Middle East & Africa Physical Therapy Market Share Comparison by Type (2016-2032)
- Table 144: Middle East & Africa Physical Therapy Market Share Comparison by Application (2016-2032)
- Table 145: Middle East & Africa Physical Therapy Market Share Comparison by Demography (2016-2032)
- Table 146: Middle East & Africa Physical Therapy Market Share Comparison by End-Use (2016-2032)
- 1. Executive Summary
-
- BTL
- Zimmer MedizinSysteme GmbH
- Whitehall Manufacturing
- Storz Medical AG
- RICHMAR
- Rehab Alternatives PLLC
- PIVOT Physical Therapy
- Performance Health
- ITO Co., Ltd.
- Enraf-Nonius B.V.
- EMS Physio Ltd.
- Dynatronics Corporation
- DJO LLC
- AmeriCare Physical Therapy
- Other Key Players
Our Clients


View Our Licence Options
