Photodynamic Therapy Market By Product (Photosensitizers, Porphyrin Derivative PD, Aminolevulinic Acid ALA), By Application (Cancer, Psoriasis, Acne, Others), By End User (Hospitals, Cosmetics & Dermatology Clinics, Cancer Treatment Centers, Others), By Devices (Disposable Fiber Optic Light Delivery Devices DFOLDD, Diode Lasers), By Region And Companies - Industry Segment Outlook, Market Assessment, Competition Scenario, Trends, And Forecast 2023-2032
-
22759
-
May 2023
-
183
-


-
This report was compiled by Correspondence Linkedin | Detailed Market research Methodology Our methodology involves a mix of primary research, including interviews with leading mental health experts, and secondary research from reputable medical journals and databases. View Detailed Methodology Page
-
Quick Navigation
Report Overview
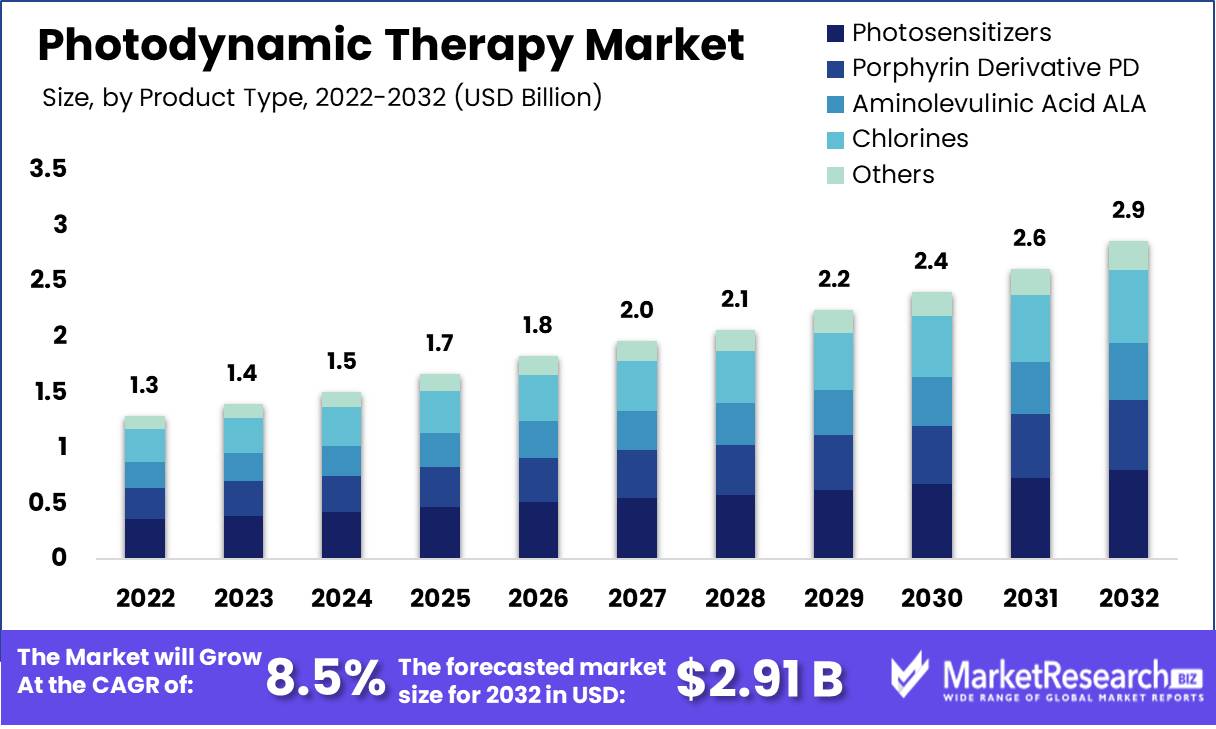
Photodynamic Therapy Market size is expected to be worth around USD 2.91 Bn by 2032 from USD 1.29 Bn in 2022, growing at a CAGR of 8.5% during the forecast period from 2023 to 2032.
The Photodynamic Therapy (PDT) market is experiencing robust growth, driven by the rising prevalence of skin cancer and a growing demand for effective treatment options for skin diseases. PDT, originally developed for cancer treatment, has gained momentum as an attractive option, especially for skin-related conditions. The prevalence of skin cancer, alongside the increasing need for breast cancer drugs and management of infectious diseases, has led to a surge in PDT adoption.
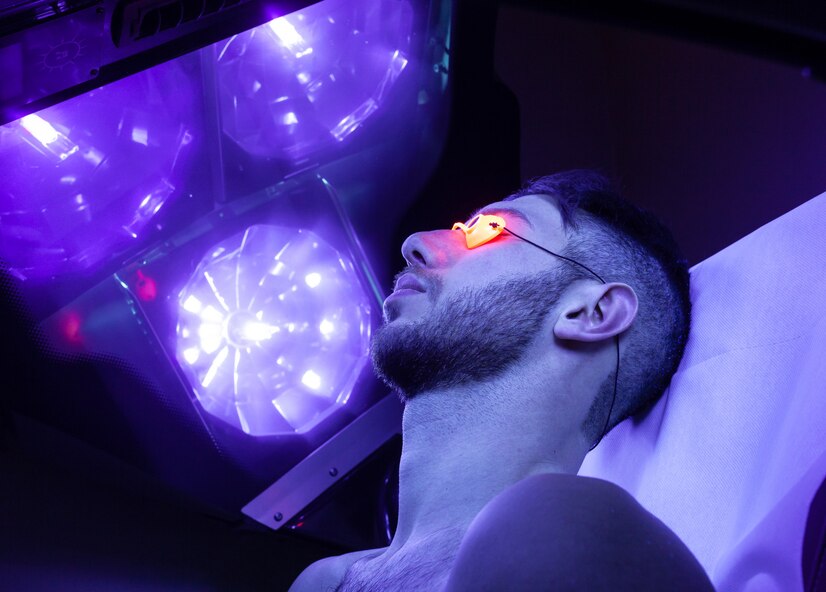
PDT involves administration of a photosensitizing drug which accumulates in the target cells. When the cells are exposed to light of a specific wavelength, the photosensitizer absorbs the light energy and produces reactive oxygen species which induce localized cell death and tissue destruction. Compared to traditional therapies, PDT offers greater selectivity and fewer side effects as the cytotoxic effect occurs only in illuminated areas.
PDT is approved for use in several indications including actinic keratosis, esophageal cancer, non-small cell lung cancer and certain skin conditions. Researchers are also evaluating PDT for applications in COVID-19, antimicrobial resistance, ophthalmic disorders, and more. Key players in the PDT market include Thermo Fisher Scientific, Bausch Health Companies Inc., and STEBA Biotech.
Recent developments that are expanding PDT applications and adoption include new photosensitizers with improved target cell selectivity and efficacy, novel delivery systems for better photosensitizer targeting, and clinical research into new indications. For example, in August 2022, Asieris Pharmaceuticals completed enrollment in a Phase III trial of its novel PDT agent Cevira for treating cervical precancerous lesions.
The future outlook for the PDT market is positive, driven by rising cancer prevalence, new product approvals, expanded applications, and technological improvements. Key trends that will further catalyze market growth are combination therapies, nanoparticle delivery systems, and increasing R&D into new photosensitizers and light sources. With its versatility, safety advantages, and continued innovation, PDT is positioned to become an increasingly valuable therapeutic option.
Driving factors
Increasing malignancy and chronic disease prevalence
One of the factors fueling the growth of the Photodynamic Therapy Market is the escalating incidence of cancer and chronic diseases. Photodynamic therapy has emerged as a viable option for patients as a result of their need for effective and non-invasive treatment methods. This therapy, which targets cancer cells and other diseased tissues with light, is increasing popularity due to its efficacy.
Increasing understanding of PDT
Increasing recognition of photodynamic therapy as a noninvasive treatment option contributes to market expansion. As more people become aware of this therapy, demand is likely to increase, leading to a rise in the number of providers offering photodynamic therapy (PDT). This will further stimulate the expansion of the market.
Innovations in technology
Innovations in PDT technology, such as improved light sources and photosensitizers, are propelling market expansion. These developments are enhancing the efficacy and efficiency of photodynamic therapy, thereby promoting its increased use. This enhanced adoption is anticipated to contribute to market expansion.
Regulatory updates and the emergence of new technologies
Regulatory updates and emerging technologies, such as artificial intelligence and robotics, may have a substantial effect on the Photodynamic Therapy Market. It is essential to monitor regulatory changes, as they may have an effect on the market. The potential for emerging technologies to make photodynamic therapy (PDT) more effective and efficient could increase demand for the treatment, propelling market expansion.
Potential disruptors
Potential market disruptors such as new entrants, changes in reimbursement policies, and unanticipated shifts in consumer behaviour could have an effect on the Photodynamic Therapy Market's competitive landscape. These factors may have an impact on market growth and must be monitored to assure a sustainable PDT market.
Restraining Factors
Expensiveness Linked to Photodynamic Therapy
Cost is one of the main drawbacks of PDT. PDT is relatively costly in comparison to other medical interventions. Several factors contribute to the high cost of photodynamic therapy (PDT), including the cost of apparatus, the cost of the photosensitizer, and the cost of the light source. In addition, PDT frequently necessitates multiple sessions, which can increase the total cost of treatment.
Patients may be dissuaded from pursuing PDT due to its high cost, particularly in regions where healthcare is already expensive. In addition, the costly cost of PDT can hinder its adoption in low-income countries. To solve this issue, industry participants must reduce the cost of PDT through research and development and the adoption of advanced manufacturing techniques.
Limited Access to Qualified Personnel for Photodynamic Therapy
The lack of qualified professionals, particularly in developing nations, is another factor preventing the widespread adoption of PDT. To perform PDT accurately and safely, a team of competent professionals, including physicians, nurses, and technicians, is required.
The limited availability of qualified professionals can result in treatment delays, increased costs, and substandard care. Industry participants and policymakers must resolve this problem by investing in PDT-training programmes for healthcare professionals. Educational institutions can play an important role in preparing the next generation of PDT-trained healthcare professionals.
Certain nations have stringent regulations governing the use of photodynamic therapy.
In many nations around the world, the use of PDT is subject to regulations. These regulations seek to ensure the safety and effectiveness of PDT and prevent its misuse and abuse. However, these regulations may be viewed as restrictive by some industry participants, thereby impeding market expansion.
By harmonising the regulatory frameworks regulating PDT globally, the adoption of PDT technology can be expedited. In addition, industry participants can collaborate closely with regulatory bodies to update the regulations and ensure that they reflect the most recent scientific developments in the field. This strategy will not only increase the adoption of PDT, but also guarantee its safety and effectiveness.
Adverse Repercussions of Photodynamic Therapy
As with all medical interventions, PDT has side effects. Pain, swelling, and redness are the most prevalent negative effects of PDT. In certain instances, PDT can result in scarring, burning, and other complications. These adverse effects may deter patients from undergoing PDT therapy.
The industry must develop photosensitizers that are both safe and efficacious in order to enhance the safety profile of photodynamic therapy (PDT). In addition, healthcare professionals must educate patients on the potential side effects of photodynamic therapy (PDT), the benefits of the treatment, and how to manage potential side effects.
By Product Analysis
The market for Photodynamic Therapy (PDT) has been divided into numerous product categories, including photosensitizers, light sources, and others. Among these, photosensitizers hold a significant share of the market. Photosensitizers are molecules that become active when exposed to a specific wavelength of light, thereby initiating a chemical reaction that can kill malignant cells.
This has resulted in an increase in demand for the photosensitizer market segment as consumers become increasingly aware of PDT's advantages. Patients are avoiding conventional chemotherapy in favour of less invasive and effective remedies such as photodynamic therapy (PDT). This change in consumer behaviour is fueling the increase in popularity of photosensitizers.
Due to its efficacy, convenience, and minimal adverse effects, the photosensitizer segment of the PDT market is anticipated to record the highest growth rate over the coming years. Also contributing to the prevalence of photosensitizers are their simplified administration and shorter treatment duration.
By Application Analysis
According to the applications, the PDT market has been segmented, with cancer treatment constituting the largest segment. Cancer segment was leading the photodynamic therapy market. PDT is a clinically proved and effective treatment for a variety of cancers, including those of the skin, lung, brain, prostate, and bladder.
Consumers are becoming increasingly aware of the efficacy of PDT as a treatment option for cancer. This has resulted in PDT becoming the favoured cancer treatment method. Patients value the minimally invasive nature of PDT as well as its minimal adverse effects.
Due to the rising incidence of cancer and the high efficacy of PDT as a treatment option, the cancer treatment segment is anticipated to record the highest growth rate. Additionally, the increasing demand for minimally invasive techniques is fueling the growth of the cancer treatment market.
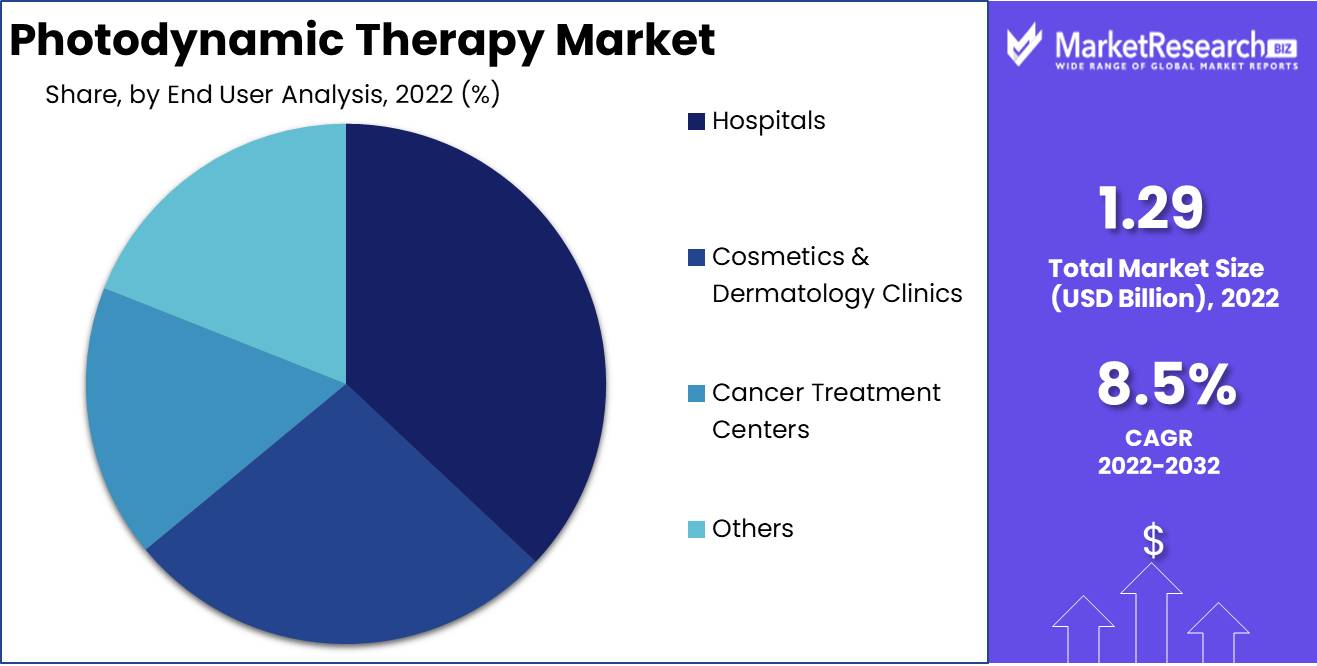
By End User Analysis
Hospitals dominate the market for photodynamic therapy (PDT) because they are the primary healthcare facilities that offer PDT treatments. Because PDT requires specialised apparatus and trained medical personnel, hospitals are the primary users of this technology.
Due to the availability of specialised equipment and trained personnel, hospitals are preferred by patients over clinics. Additionally, hospitals are investing more in PDT technology to provide patients with a variety of treatment options.
Due to the rising demand for advanced treatment options and the rising incidence of malignancies, it is anticipated that the hospitals segment will record the highest growth rate.
Key Market Segments
By Product
- Photosensitizers
- Porphyrin Derivative PD
- Hematoporphyrin Derivative HpD
- Benzoporphyrin Derivative BPD
- Texaphyrins
- Others
- Aminolevulinic Acid ALA
- Chlorines
- Others
By Application
- Cancer
-
- Basal Cell Carcinoma
- Non-small Cell Lung Cancer
- Head & Neck Cancer
- Others
- Actinic Keratosis AK
- Psoriasis
- Acne
- Others
By End User
- Hospitals
- Cosmetics & Dermatology Clinics
- Cancer Treatment Centers
- Others
By Devices
- Disposable Fiber Optic Light Delivery Devices DFOLDD
- Diode Lasers
Growth Opportunity
Escalating Demand for Combination Treatments Involving Photodynamic Therapy
Combination therapy entails the concurrent use of PDT and conventional therapies including chemotherapy, radiation therapy, and immunotherapy. In the treatment of various malignancies, including lung, prostate, and breast cancer, the combination of PDT with these therapies has demonstrated increased efficacy. The synergistic effect of PDT with these cancer treatments can lead to lower doses of chemotherapy medications and the avoidance of radiation exposure while maintaining high levels of cancer treatment efficacy. This has resulted in a growing demand for combination therapy utilising PDT, which is anticipated to fuel the PDT market's expansion.
Expanding use of photodynamic therapy in the treatment of non-malignant diseases.
PDT has shown promise in the treatment of non-oncological maladies such as acne, psoriasis, and age-related macular degeneration, in addition to cancer. It has been demonstrated that PDT is effective at reducing the inflammation associated with these diseases, resulting in improved outcomes. As more research is conducted on the efficacy of PDT for non-oncological diseases, it is anticipated that the use of PDT will continue to increase, thereby contributing to the expansion of the PDT market.
Creation of innovative photosensitizers and light sources
Development of novel photosensitizers and light sources is crucial to the success of PDT. The development of new photosensitizers with greater specificity and selectivity for cancer cells, as well as the creation of light sources that can penetrate deeper into tissue to activate the photosensitizer, are anticipated to propel the market for photodynamic therapy (PDT). Several photosensitizers for the treatment of various types of cancer are presently in development, and the market is expected to experience a rapid influx of new photosensitizers in the near future.
Increasing photodynamic therapy adoption in emerging economies
With the increasing prevalence of cancer cases and other maladies in emerging economies, there has been a rise in the use of photodynamic therapy (PDT) in these areas. In emerging economies, the availability of low-cost PDT technologies and the increase in the number of healthcare facilities offering PDT treatments are anticipated to drive the growth of the PDT market. In the future years, China, India, and Brazil are anticipated to experience significant market expansion.
Latest Trends
Creation of innovative new photosensitizers and light sources
Photosensitizers and light sources play a crucial role in photodynamic therapy's efficacy and safety. In the market for photodynamic therapy, the development of novel photosensitizers and light sources has been a primary focus of research. Researchers are investigating safer, more effective photosensitizers and light sources with fewer adverse effects.
Consequently, the market has witnessed an increase in the availability of new photosensitizers and light sources, leading to the development of novel photodynamic therapy treatments for various diseases and disorders.
Increasing use of photodynamic therapy in combination therapy
Combination therapy employing photodynamic therapy has grown in prominence in recent years due to its efficacy in treating a variety of diseases and disorders. Researchers have discovered that combining photodynamic therapy with other treatment modalities, such as chemotherapy, radiotherapy, and immunotherapy, can improve clinical outcomes.
It has been discovered that combination therapy increases the efficacy of photodynamic therapy, reduces the dosages of other treatments, and minimises adverse effects. For the treatment of malignancies, psoriasis, and acne, the market has witnessed an increase in the adoption of combination therapies employing photodynamic therapy.
Growing emphasis on research and development to explore novel photodynamic therapy applications
Researchers are continually investigating novel photodynamic therapy applications. Researchers are investigating the treatment's efficacy in treating additional diseases and disorders, as it has demonstrated efficacy in treating a variety of diseases and disorders. The market has witnessed a greater emphasis on research and development to investigate new applications of photodynamic therapy, resulting in the creation of new treatment options for a variety of diseases and disorders. The increasing emphasis on research and development in the market for photodynamic therapy has led to a surge in investments that are anticipated to drive market growth.
Increase in the number of partnerships and collaborations
There has been a rise in the number of partnerships and collaborations among the market's major participants. The increase in market partnerships and collaborations has resulted in the exchange of knowledge, resources, and technology, which has led to the development of more effective treatments for a variety of diseases and disorders. Partnerships and collaborations have enabled key actors to increase their market presence, develop new products, and improve patient care. In the coming years, market expansion is anticipated to be driven by an increase in partnerships and collaborations among key market participants.
Regional Analysis
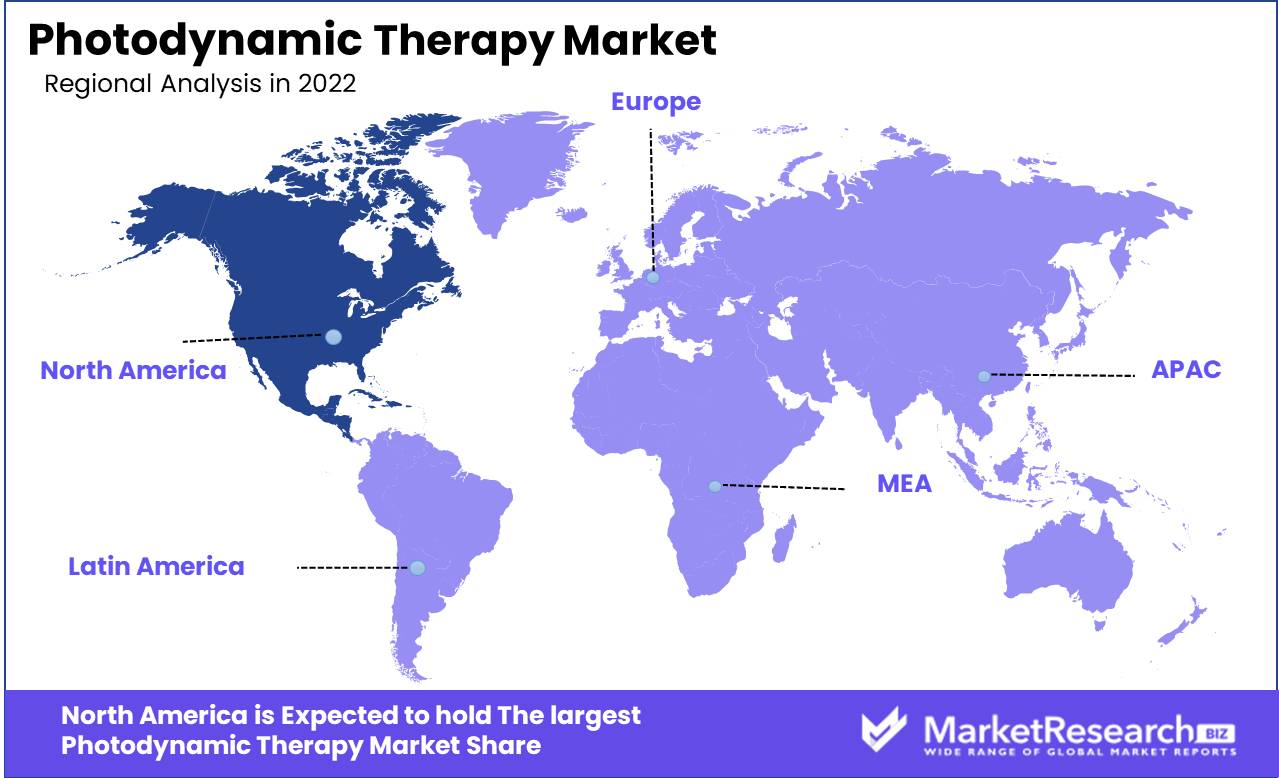
North America currently leads the global photodynamic therapy (PDT) market, dominating it with an unparalleled presence. PDT is an advanced medical treatment using light-sensitive drugs to attack cancer cells and treat various medical conditions, and its market is flourishing thanks to various factors: an advanced healthcare infrastructure, extensive research and development activities and higher adoption of innovative medical technologies which makes North America an ideal location for this innovative therapy; all these elements combined have propelled North America to the top spot of this global PDT market.
North America dominates the PDT market due to its robust financial investments in healthcare research and technology. Furthermore, its numerous world-renowned medical research institutions and academic centers help advance PDT. An aging population also creates demand for effective cancer treatments such as PDT. Its favorable reimbursement policies and regulatory framework also play a pivotal role in its expansion.
Key Regions and Countries
North America
- US
- Canada
- Mexico
Western Europe
- Germany
- France
- The UK
- Spain
- Italy
- Portugal
- Ireland
- Austria
- Switzerland
- Benelux
- Nordic
- Rest of Western Europe
Eastern Europe
- Russia
- Poland
- The Czech Republic
- Greece
- Rest of Eastern Europe
APAC
- China
- Japan
- South Korea
- India
- Australia & New Zealand
- Indonesia
- Malaysia
- Philippines
- Singapore
- Thailand
- Vietnam
- Rest of Asia Pacific
Latin America
- Brazil
- Colombia
- Chile
- Argentina
- Costa Rica
- Rest of Latin America
Middle East & Africa
- Algeria
- Egypt
- Israel
- Kuwait
- Nigeria
- Saudi Arabia
- South Africa
- Turkey
- United Arab Emirates
- Rest of MEA
Key Players Analysis
The market for PDT is highly competitive, with several key companies vying for a significant share of the market. Allergan, Plc is one of the major players, with its diverse range of products, including Photofrin and Visudyne, which have been approved by the US FDA for treating certain types of cancer and age-related macular degeneration, respectively.
Galderma, S.A. is another significant player in the PDT market, offering Ameluz gel, a revolutionary treatment for actinic keratosis, a type of skin cancer. The Ameluz gel has received regulatory approvals from renowned agencies like the FDA and the European Medicines Agency, attesting to its effectiveness and reliability in the field of PDT.
Biofrontera AG is another noteworthy player in the market, offering a range of products like Belixos and Ameluz, which have garnered attention for their innovative and promising approach to PDT. Quest PharmaTech, Inc. has also established its presence in the market with its unique Photodynamic Therapy for Cancer Treatment (PCRT) technology, providing an alternative and promising treatment modality for cancer patients.
The emergence of new players like Photocure ASA (Hexvix and Cysview) and Hologic, Inc. holds tremendous promise for the development of PDT, providing new products and techniques to further advance the field. With a few dominant players holding significant market share, and new entrants constantly entering the market, the PDT market is highly competitive, making it an exciting and dynamic field to watch.
Top Key Players in Photodynamic Therapy Market
- Biofrontera AG
- Theralase Technologies Inc.
- Lumibird
- Quest PharmaTech Inc.
- Modulight Inc.
- Galderma S.A.
- Sun Pharmaceutical Industries Ltd.
- SUS Advancing Technology Co. Ltd.
- Bausch Health Co. Inc.
- Biolase Inc.
- Pinnacle Biologics Inc.
Recent Development
- New photosensitizers with improved properties, such as increased selectivity and efficacy, are being developed in 2023. Additionally, new delivery systems are being explored to improve the targeting and biodistribution of photosensitizers.
- PDT is being investigated for a growing range of applications, including cancer, infectious diseases, and dermatological conditions in 2023. For example, PDT is being studied as a potential treatment for COVID-19 and other viral infections.
- In August 2022, Asieris Pharmaceuticals announced the completion of enrollment in its multinational Phase III clinical trial of Cevira (APRICITY), a novel non-surgical treatment for cervical high-grade squamous intraepithelial lesions (HSIL). Cevira is a breakthrough photodynamic drug-device combination product that works by accumulating a photosensitizer in the target cells.
- In 2021, a research study demonstrated the potential use of photodynamic therapy (PDT) in the treatment of pancreatic cancer, offering new treatment options for this difficult disease.
Report Scope:
Report Features Description Market Value (2022) USD 1.29 Bn Forecast Revenue (2032) USD 2.91 Bn CAGR (2023-2032) 8.5% Base Year for Estimation 2022 Historic Period 2016-2022 Forecast Period 2023-2032 Report Coverage Revenue Forecast, Market Dynamics, COVID-19 Impact, Competitive Landscape, Recent Developments Segments Covered By Product: Photosensitizers, Porphyrin Derivative PD, Aminolevulinic Acid ALA
By Application:Cancer, Actinic Keratosis AK, Psoriasis, Acne, Others
By End User:Hospitals, Cosmetics & Dermatology Clinics, Cancer Treatment Centers, Others
By Devices:Disposable Fiber Optic Light Delivery Devices DFOLDD, Diode LasersRegional Analysis North America – The US, Canada, & Mexico; Western Europe – Germany, France, The UK, Spain, Italy, Portugal, Ireland, Austria, Switzerland, Benelux, Nordic, & Rest of Western Europe; Eastern Europe – Russia, Poland, The Czech Republic, Greece, & Rest of Eastern Europe; APAC – China, Japan, South Korea, India, Australia & New Zealand, Indonesia, Malaysia, Philippines, Singapore, Thailand, Vietnam, & Rest of Asia Pacific; Latin America – Brazil, Colombia, Chile, Argentina, Costa Rica, & Rest of Latin America; Middle East & Africa – Algeria, Egypt, Israel, Kuwait, Nigeria, Saudi Arabia, South Africa, Turkey, United Arab Emirates, & Rest of MEA Competitive Landscape Biofrontera AG, Theralase Technologies Inc., Lumibird, Quest PharmaTech Inc., Modulight, Inc., Galderma Laboratories L.P. (Nestl?), Sun Pharmaceutical Industries Ltd., SUS Advancing Technology Co.ltd., Biolase Inc. Customization Scope Customization for segments, region/country-level will be provided. Moreover, additional customization can be done based on the requirements. Purchase Options We have three licenses to opt for: Single User License, Multi-User License (Up to 5 Users), Corporate Use License (Unlimited User and Printable PDF) -
- 1. Executive Summary
- 1.1. Definition
- 1.2. Taxonomy
- 1.3. Research Scope
- 1.4. Key Analysis
- 1.5. Key Findings by Major Segments
- 1.6. Top strategies by Major Players
- 2. Global Photodynamic Therapy Market Overview
- 2.1. Photodynamic Therapy Market Dynamics
- 2.1.1. Drivers
- 2.1.2. Opportunities
- 2.1.3. Restraints
- 2.1.4. Challenges
- 2.2. Macro-economic Factors
- 2.3. Regulatory Framework
- 2.4. Market Investment Feasibility Index
- 2.5. PEST Analysis
- 2.6. PORTER’S Five Force Analysis
- 2.7. Drivers & Restraints Impact Analysis
- 2.8. Industry Chain Analysis
- 2.9. Cost Structure Analysis
- 2.10. Marketing Strategy
- 2.11. Russia-Ukraine War Impact Analysis
- 2.12. Opportunity Map Analysis
- 2.13. Market Competition Scenario Analysis
- 2.14. Product Life Cycle Analysis
- 2.15. Opportunity Orbits
- 2.16. Manufacturer Intensity Map
- 2.17. Major Companies sales by Value & Volume
- 2.1. Photodynamic Therapy Market Dynamics
- 3. Global Photodynamic Therapy Market Analysis, Opportunity and Forecast, 2016-2032
- 3.1. Global Photodynamic Therapy Market Analysis, 2016-2021
- 3.2. Global Photodynamic Therapy Market Opportunity and Forecast, 2023-2032
- 3.3. Global Photodynamic Therapy Market Analysis, Opportunity and Forecast, By By Product, 2016-2032
- 3.3.1. Global Photodynamic Therapy Market Analysis by By Product: Introduction
- 3.3.2. Market Size Absolute $ Opportunity Analysis and Forecast, By By Product, 2016-2032
- 3.3.3. Photosensitizers
- 3.3.4. Porphyrin Derivative PD
- 3.3.5. Aminolevulinic Acid ALA
- 3.4. Global Photodynamic Therapy Market Analysis, Opportunity and Forecast, By By Application, 2016-2032
- 3.4.1. Global Photodynamic Therapy Market Analysis by By Application: Introduction
- 3.4.2. Market Size Absolute $ Opportunity Analysis and Forecast, By By Application, 2016-2032
- 3.4.3. Cancer
- 3.4.4. Actinic Keratosis AK
- 3.4.5. Psoriasis
- 3.4.6. Acne
- 3.4.7. Others
- 3.5. Global Photodynamic Therapy Market Analysis, Opportunity and Forecast, By By End User, 2016-2032
- 3.5.1. Global Photodynamic Therapy Market Analysis by By End User: Introduction
- 3.5.2. Market Size Absolute $ Opportunity Analysis and Forecast, By By End User, 2016-2032
- 3.5.3. Hospitals
- 3.5.4. Cosmetics & Dermatology Clinics
- 3.5.5. Cancer Treatment Centers
- 3.5.6. Others
- 3.6. Global Photodynamic Therapy Market Analysis, Opportunity and Forecast, By By Devices, 2016-2032
- 3.6.1. Global Photodynamic Therapy Market Analysis by By Devices: Introduction
- 3.6.2. Market Size Absolute $ Opportunity Analysis and Forecast, By By Devices, 2016-2032
- 3.6.3. Disposable Fiber Optic Light Delivery Devices DFOLDD
- 3.6.4. Diode Lasers
- 4. North America Photodynamic Therapy Market Analysis, Opportunity and Forecast, 2016-2032
- 4.1. North America Photodynamic Therapy Market Analysis, 2016-2021
- 4.2. North America Photodynamic Therapy Market Opportunity and Forecast, 2023-2032
- 4.3. North America Photodynamic Therapy Market Analysis, Opportunity and Forecast, By By Product, 2016-2032
- 4.3.1. North America Photodynamic Therapy Market Analysis by By Product: Introduction
- 4.3.2. Market Size Absolute $ Opportunity Analysis and Forecast, By By Product, 2016-2032
- 4.3.3. Photosensitizers
- 4.3.4. Porphyrin Derivative PD
- 4.3.5. Aminolevulinic Acid ALA
- 4.4. North America Photodynamic Therapy Market Analysis, Opportunity and Forecast, By By Application, 2016-2032
- 4.4.1. North America Photodynamic Therapy Market Analysis by By Application: Introduction
- 4.4.2. Market Size Absolute $ Opportunity Analysis and Forecast, By By Application, 2016-2032
- 4.4.3. Cancer
- 4.4.4. Actinic Keratosis AK
- 4.4.5. Psoriasis
- 4.4.6. Acne
- 4.4.7. Others
- 4.5. North America Photodynamic Therapy Market Analysis, Opportunity and Forecast, By By End User, 2016-2032
- 4.5.1. North America Photodynamic Therapy Market Analysis by By End User: Introduction
- 4.5.2. Market Size Absolute $ Opportunity Analysis and Forecast, By By End User, 2016-2032
- 4.5.3. Hospitals
- 4.5.4. Cosmetics & Dermatology Clinics
- 4.5.5. Cancer Treatment Centers
- 4.5.6. Others
- 4.6. North America Photodynamic Therapy Market Analysis, Opportunity and Forecast, By By Devices, 2016-2032
- 4.6.1. North America Photodynamic Therapy Market Analysis by By Devices: Introduction
- 4.6.2. Market Size Absolute $ Opportunity Analysis and Forecast, By By Devices, 2016-2032
- 4.6.3. Disposable Fiber Optic Light Delivery Devices DFOLDD
- 4.6.4. Diode Lasers
- 4.7. North America Photodynamic Therapy Market Analysis, Opportunity and Forecast, By Country , 2016-2032
- 4.7.1. North America Photodynamic Therapy Market Analysis by Country : Introduction
- 4.7.2. Market Size Absolute $ Opportunity Analysis and Forecast, Country , 2016-2032
- 4.7.2.1. The US
- 4.7.2.2. Canada
- 4.7.2.3. Mexico
- 5. Western Europe Photodynamic Therapy Market Analysis, Opportunity and Forecast, 2016-2032
- 5.1. Western Europe Photodynamic Therapy Market Analysis, 2016-2021
- 5.2. Western Europe Photodynamic Therapy Market Opportunity and Forecast, 2023-2032
- 5.3. Western Europe Photodynamic Therapy Market Analysis, Opportunity and Forecast, By By Product, 2016-2032
- 5.3.1. Western Europe Photodynamic Therapy Market Analysis by By Product: Introduction
- 5.3.2. Market Size Absolute $ Opportunity Analysis and Forecast, By By Product, 2016-2032
- 5.3.3. Photosensitizers
- 5.3.4. Porphyrin Derivative PD
- 5.3.5. Aminolevulinic Acid ALA
- 5.4. Western Europe Photodynamic Therapy Market Analysis, Opportunity and Forecast, By By Application, 2016-2032
- 5.4.1. Western Europe Photodynamic Therapy Market Analysis by By Application: Introduction
- 5.4.2. Market Size Absolute $ Opportunity Analysis and Forecast, By By Application, 2016-2032
- 5.4.3. Cancer
- 5.4.4. Actinic Keratosis AK
- 5.4.5. Psoriasis
- 5.4.6. Acne
- 5.4.7. Others
- 5.5. Western Europe Photodynamic Therapy Market Analysis, Opportunity and Forecast, By By End User, 2016-2032
- 5.5.1. Western Europe Photodynamic Therapy Market Analysis by By End User: Introduction
- 5.5.2. Market Size Absolute $ Opportunity Analysis and Forecast, By By End User, 2016-2032
- 5.5.3. Hospitals
- 5.5.4. Cosmetics & Dermatology Clinics
- 5.5.5. Cancer Treatment Centers
- 5.5.6. Others
- 5.6. Western Europe Photodynamic Therapy Market Analysis, Opportunity and Forecast, By By Devices, 2016-2032
- 5.6.1. Western Europe Photodynamic Therapy Market Analysis by By Devices: Introduction
- 5.6.2. Market Size Absolute $ Opportunity Analysis and Forecast, By By Devices, 2016-2032
- 5.6.3. Disposable Fiber Optic Light Delivery Devices DFOLDD
- 5.6.4. Diode Lasers
- 5.7. Western Europe Photodynamic Therapy Market Analysis, Opportunity and Forecast, By Country , 2016-2032
- 5.7.1. Western Europe Photodynamic Therapy Market Analysis by Country : Introduction
- 5.7.2. Market Size Absolute $ Opportunity Analysis and Forecast, Country , 2016-2032
- 5.7.2.1. Germany
- 5.7.2.2. France
- 5.7.2.3. The UK
- 5.7.2.4. Spain
- 5.7.2.5. Italy
- 5.7.2.6. Portugal
- 5.7.2.7. Ireland
- 5.7.2.8. Austria
- 5.7.2.9. Switzerland
- 5.7.2.10. Benelux
- 5.7.2.11. Nordic
- 5.7.2.12. Rest of Western Europe
- 6. Eastern Europe Photodynamic Therapy Market Analysis, Opportunity and Forecast, 2016-2032
- 6.1. Eastern Europe Photodynamic Therapy Market Analysis, 2016-2021
- 6.2. Eastern Europe Photodynamic Therapy Market Opportunity and Forecast, 2023-2032
- 6.3. Eastern Europe Photodynamic Therapy Market Analysis, Opportunity and Forecast, By By Product, 2016-2032
- 6.3.1. Eastern Europe Photodynamic Therapy Market Analysis by By Product: Introduction
- 6.3.2. Market Size Absolute $ Opportunity Analysis and Forecast, By By Product, 2016-2032
- 6.3.3. Photosensitizers
- 6.3.4. Porphyrin Derivative PD
- 6.3.5. Aminolevulinic Acid ALA
- 6.4. Eastern Europe Photodynamic Therapy Market Analysis, Opportunity and Forecast, By By Application, 2016-2032
- 6.4.1. Eastern Europe Photodynamic Therapy Market Analysis by By Application: Introduction
- 6.4.2. Market Size Absolute $ Opportunity Analysis and Forecast, By By Application, 2016-2032
- 6.4.3. Cancer
- 6.4.4. Actinic Keratosis AK
- 6.4.5. Psoriasis
- 6.4.6. Acne
- 6.4.7. Others
- 6.5. Eastern Europe Photodynamic Therapy Market Analysis, Opportunity and Forecast, By By End User, 2016-2032
- 6.5.1. Eastern Europe Photodynamic Therapy Market Analysis by By End User: Introduction
- 6.5.2. Market Size Absolute $ Opportunity Analysis and Forecast, By By End User, 2016-2032
- 6.5.3. Hospitals
- 6.5.4. Cosmetics & Dermatology Clinics
- 6.5.5. Cancer Treatment Centers
- 6.5.6. Others
- 6.6. Eastern Europe Photodynamic Therapy Market Analysis, Opportunity and Forecast, By By Devices, 2016-2032
- 6.6.1. Eastern Europe Photodynamic Therapy Market Analysis by By Devices: Introduction
- 6.6.2. Market Size Absolute $ Opportunity Analysis and Forecast, By By Devices, 2016-2032
- 6.6.3. Disposable Fiber Optic Light Delivery Devices DFOLDD
- 6.6.4. Diode Lasers
- 6.7. Eastern Europe Photodynamic Therapy Market Analysis, Opportunity and Forecast, By Country , 2016-2032
- 6.7.1. Eastern Europe Photodynamic Therapy Market Analysis by Country : Introduction
- 6.7.2. Market Size Absolute $ Opportunity Analysis and Forecast, Country , 2016-2032
- 6.7.2.1. Russia
- 6.7.2.2. Poland
- 6.7.2.3. The Czech Republic
- 6.7.2.4. Greece
- 6.7.2.5. Rest of Eastern Europe
- 7. APAC Photodynamic Therapy Market Analysis, Opportunity and Forecast, 2016-2032
- 7.1. APAC Photodynamic Therapy Market Analysis, 2016-2021
- 7.2. APAC Photodynamic Therapy Market Opportunity and Forecast, 2023-2032
- 7.3. APAC Photodynamic Therapy Market Analysis, Opportunity and Forecast, By By Product, 2016-2032
- 7.3.1. APAC Photodynamic Therapy Market Analysis by By Product: Introduction
- 7.3.2. Market Size Absolute $ Opportunity Analysis and Forecast, By By Product, 2016-2032
- 7.3.3. Photosensitizers
- 7.3.4. Porphyrin Derivative PD
- 7.3.5. Aminolevulinic Acid ALA
- 7.4. APAC Photodynamic Therapy Market Analysis, Opportunity and Forecast, By By Application, 2016-2032
- 7.4.1. APAC Photodynamic Therapy Market Analysis by By Application: Introduction
- 7.4.2. Market Size Absolute $ Opportunity Analysis and Forecast, By By Application, 2016-2032
- 7.4.3. Cancer
- 7.4.4. Actinic Keratosis AK
- 7.4.5. Psoriasis
- 7.4.6. Acne
- 7.4.7. Others
- 7.5. APAC Photodynamic Therapy Market Analysis, Opportunity and Forecast, By By End User, 2016-2032
- 7.5.1. APAC Photodynamic Therapy Market Analysis by By End User: Introduction
- 7.5.2. Market Size Absolute $ Opportunity Analysis and Forecast, By By End User, 2016-2032
- 7.5.3. Hospitals
- 7.5.4. Cosmetics & Dermatology Clinics
- 7.5.5. Cancer Treatment Centers
- 7.5.6. Others
- 7.6. APAC Photodynamic Therapy Market Analysis, Opportunity and Forecast, By By Devices, 2016-2032
- 7.6.1. APAC Photodynamic Therapy Market Analysis by By Devices: Introduction
- 7.6.2. Market Size Absolute $ Opportunity Analysis and Forecast, By By Devices, 2016-2032
- 7.6.3. Disposable Fiber Optic Light Delivery Devices DFOLDD
- 7.6.4. Diode Lasers
- 7.7. APAC Photodynamic Therapy Market Analysis, Opportunity and Forecast, By Country , 2016-2032
- 7.7.1. APAC Photodynamic Therapy Market Analysis by Country : Introduction
- 7.7.2. Market Size Absolute $ Opportunity Analysis and Forecast, Country , 2016-2032
- 7.7.2.1. China
- 7.7.2.2. Japan
- 7.7.2.3. South Korea
- 7.7.2.4. India
- 7.7.2.5. Australia & New Zeland
- 7.7.2.6. Indonesia
- 7.7.2.7. Malaysia
- 7.7.2.8. Philippines
- 7.7.2.9. Singapore
- 7.7.2.10. Thailand
- 7.7.2.11. Vietnam
- 7.7.2.12. Rest of APAC
- 8. Latin America Photodynamic Therapy Market Analysis, Opportunity and Forecast, 2016-2032
- 8.1. Latin America Photodynamic Therapy Market Analysis, 2016-2021
- 8.2. Latin America Photodynamic Therapy Market Opportunity and Forecast, 2023-2032
- 8.3. Latin America Photodynamic Therapy Market Analysis, Opportunity and Forecast, By By Product, 2016-2032
- 8.3.1. Latin America Photodynamic Therapy Market Analysis by By Product: Introduction
- 8.3.2. Market Size Absolute $ Opportunity Analysis and Forecast, By By Product, 2016-2032
- 8.3.3. Photosensitizers
- 8.3.4. Porphyrin Derivative PD
- 8.3.5. Aminolevulinic Acid ALA
- 8.4. Latin America Photodynamic Therapy Market Analysis, Opportunity and Forecast, By By Application, 2016-2032
- 8.4.1. Latin America Photodynamic Therapy Market Analysis by By Application: Introduction
- 8.4.2. Market Size Absolute $ Opportunity Analysis and Forecast, By By Application, 2016-2032
- 8.4.3. Cancer
- 8.4.4. Actinic Keratosis AK
- 8.4.5. Psoriasis
- 8.4.6. Acne
- 8.4.7. Others
- 8.5. Latin America Photodynamic Therapy Market Analysis, Opportunity and Forecast, By By End User, 2016-2032
- 8.5.1. Latin America Photodynamic Therapy Market Analysis by By End User: Introduction
- 8.5.2. Market Size Absolute $ Opportunity Analysis and Forecast, By By End User, 2016-2032
- 8.5.3. Hospitals
- 8.5.4. Cosmetics & Dermatology Clinics
- 8.5.5. Cancer Treatment Centers
- 8.5.6. Others
- 8.6. Latin America Photodynamic Therapy Market Analysis, Opportunity and Forecast, By By Devices, 2016-2032
- 8.6.1. Latin America Photodynamic Therapy Market Analysis by By Devices: Introduction
- 8.6.2. Market Size Absolute $ Opportunity Analysis and Forecast, By By Devices, 2016-2032
- 8.6.3. Disposable Fiber Optic Light Delivery Devices DFOLDD
- 8.6.4. Diode Lasers
- 8.7. Latin America Photodynamic Therapy Market Analysis, Opportunity and Forecast, By Country , 2016-2032
- 8.7.1. Latin America Photodynamic Therapy Market Analysis by Country : Introduction
- 8.7.2. Market Size Absolute $ Opportunity Analysis and Forecast, Country , 2016-2032
- 8.7.2.1. Brazil
- 8.7.2.2. Colombia
- 8.7.2.3. Chile
- 8.7.2.4. Argentina
- 8.7.2.5. Costa Rica
- 8.7.2.6. Rest of Latin America
- 9. Middle East & Africa Photodynamic Therapy Market Analysis, Opportunity and Forecast, 2016-2032
- 9.1. Middle East & Africa Photodynamic Therapy Market Analysis, 2016-2021
- 9.2. Middle East & Africa Photodynamic Therapy Market Opportunity and Forecast, 2023-2032
- 9.3. Middle East & Africa Photodynamic Therapy Market Analysis, Opportunity and Forecast, By By Product, 2016-2032
- 9.3.1. Middle East & Africa Photodynamic Therapy Market Analysis by By Product: Introduction
- 9.3.2. Market Size Absolute $ Opportunity Analysis and Forecast, By By Product, 2016-2032
- 9.3.3. Photosensitizers
- 9.3.4. Porphyrin Derivative PD
- 9.3.5. Aminolevulinic Acid ALA
- 9.4. Middle East & Africa Photodynamic Therapy Market Analysis, Opportunity and Forecast, By By Application, 2016-2032
- 9.4.1. Middle East & Africa Photodynamic Therapy Market Analysis by By Application: Introduction
- 9.4.2. Market Size Absolute $ Opportunity Analysis and Forecast, By By Application, 2016-2032
- 9.4.3. Cancer
- 9.4.4. Actinic Keratosis AK
- 9.4.5. Psoriasis
- 9.4.6. Acne
- 9.4.7. Others
- 9.5. Middle East & Africa Photodynamic Therapy Market Analysis, Opportunity and Forecast, By By End User, 2016-2032
- 9.5.1. Middle East & Africa Photodynamic Therapy Market Analysis by By End User: Introduction
- 9.5.2. Market Size Absolute $ Opportunity Analysis and Forecast, By By End User, 2016-2032
- 9.5.3. Hospitals
- 9.5.4. Cosmetics & Dermatology Clinics
- 9.5.5. Cancer Treatment Centers
- 9.5.6. Others
- 9.6. Middle East & Africa Photodynamic Therapy Market Analysis, Opportunity and Forecast, By By Devices, 2016-2032
- 9.6.1. Middle East & Africa Photodynamic Therapy Market Analysis by By Devices: Introduction
- 9.6.2. Market Size Absolute $ Opportunity Analysis and Forecast, By By Devices, 2016-2032
- 9.6.3. Disposable Fiber Optic Light Delivery Devices DFOLDD
- 9.6.4. Diode Lasers
- 9.7. Middle East & Africa Photodynamic Therapy Market Analysis, Opportunity and Forecast, By Country , 2016-2032
- 9.7.1. Middle East & Africa Photodynamic Therapy Market Analysis by Country : Introduction
- 9.7.2. Market Size Absolute $ Opportunity Analysis and Forecast, Country , 2016-2032
- 9.7.2.1. Algeria
- 9.7.2.2. Egypt
- 9.7.2.3. Israel
- 9.7.2.4. Kuwait
- 9.7.2.5. Nigeria
- 9.7.2.6. Saudi Arabia
- 9.7.2.7. South Africa
- 9.7.2.8. Turkey
- 9.7.2.9. The UAE
- 9.7.2.10. Rest of MEA
- 10. Global Photodynamic Therapy Market Analysis, Opportunity and Forecast, By Region , 2016-2032
- 10.1. Global Photodynamic Therapy Market Analysis by Region : Introduction
- 10.2. Market Size Absolute $ Opportunity Analysis and Forecast, By Region , 2016-2032
- 10.2.1. North America
- 10.2.2. Western Europe
- 10.2.3. Eastern Europe
- 10.2.4. APAC
- 10.2.5. Latin America
- 10.2.6. Middle East & Africa
- 11. Global Photodynamic Therapy Market Competitive Landscape, Market Share Analysis, and Company Profiles
- 11.1. Market Share Analysis
- 11.2. Company Profiles
- 11.3. Biofrontera AG
- 11.3.1. Company Overview
- 11.3.2. Financial Highlights
- 11.3.3. Product Portfolio
- 11.3.4. SWOT Analysis
- 11.3.5. Key Strategies and Developments
- 11.4. Theralase Technologies Inc.
- 11.4.1. Company Overview
- 11.4.2. Financial Highlights
- 11.4.3. Product Portfolio
- 11.4.4. SWOT Analysis
- 11.4.5. Key Strategies and Developments
- 11.5. Lumibird
- 11.5.1. Company Overview
- 11.5.2. Financial Highlights
- 11.5.3. Product Portfolio
- 11.5.4. SWOT Analysis
- 11.5.5. Key Strategies and Developments
- 11.6. Quest PharmaTech Inc.
- 11.6.1. Company Overview
- 11.6.2. Financial Highlights
- 11.6.3. Product Portfolio
- 11.6.4. SWOT Analysis
- 11.6.5. Key Strategies and Developments
- 11.7. Modulight, Inc.
- 11.7.1. Company Overview
- 11.7.2. Financial Highlights
- 11.7.3. Product Portfolio
- 11.7.4. SWOT Analysis
- 11.7.5. Key Strategies and Developments
- 11.8. Galderma Laboratories L.P. (Nestl?)
- 11.8.1. Company Overview
- 11.8.2. Financial Highlights
- 11.8.3. Product Portfolio
- 11.8.4. SWOT Analysis
- 11.8.5. Key Strategies and Developments
- 11.9. Sun Pharmaceutical Industries Ltd.
- 11.9.1. Company Overview
- 11.9.2. Financial Highlights
- 11.9.3. Product Portfolio
- 11.9.4. SWOT Analysis
- 11.9.5. Key Strategies and Developments
- 11.10. SUS Advancing Technology Co.ltd.
- 11.10.1. Company Overview
- 11.10.2. Financial Highlights
- 11.10.3. Product Portfolio
- 11.10.4. SWOT Analysis
- 11.10.5. Key Strategies and Developments
- 12. Assumptions and Acronyms
- 13. Research Methodology
- 14. Contact
- List of Figures
- Figure 1: Global Photodynamic Therapy Market Revenue (US$ Mn) Market Share by By Product in 2022
- Figure 2: Global Photodynamic Therapy Market Attractiveness Analysis by By Product, 2016-2032
- Figure 3: Global Photodynamic Therapy Market Revenue (US$ Mn) Market Share by By Applicationin 2022
- Figure 4: Global Photodynamic Therapy Market Attractiveness Analysis by By Application, 2016-2032
- Figure 5: Global Photodynamic Therapy Market Revenue (US$ Mn) Market Share by By End Userin 2022
- Figure 6: Global Photodynamic Therapy Market Attractiveness Analysis by By End User, 2016-2032
- Figure 7: Global Photodynamic Therapy Market Revenue (US$ Mn) Market Share by By Devicesin 2022
- Figure 8: Global Photodynamic Therapy Market Attractiveness Analysis by By Devices, 2016-2032
- Figure 9: Global Photodynamic Therapy Market Revenue (US$ Mn) Market Share by Region in 2022
- Figure 10: Global Photodynamic Therapy Market Attractiveness Analysis by Region, 2016-2032
- Figure 11: Global Photodynamic Therapy Market Revenue (US$ Mn) (2016-2032)
- Figure 12: Global Photodynamic Therapy Market Revenue (US$ Mn) Comparison by Region (2016-2032)
- Figure 13: Global Photodynamic Therapy Market Revenue (US$ Mn) Comparison by By Product (2016-2032)
- Figure 14: Global Photodynamic Therapy Market Revenue (US$ Mn) Comparison by By Application (2016-2032)
- Figure 15: Global Photodynamic Therapy Market Revenue (US$ Mn) Comparison by By End User (2016-2032)
- Figure 16: Global Photodynamic Therapy Market Revenue (US$ Mn) Comparison by By Devices (2016-2032)
- Figure 17: Global Photodynamic Therapy Market Y-o-Y Growth Rate Comparison by Region (2016-2032)
- Figure 18: Global Photodynamic Therapy Market Y-o-Y Growth Rate Comparison by By Product (2016-2032)
- Figure 19: Global Photodynamic Therapy Market Y-o-Y Growth Rate Comparison by By Application (2016-2032)
- Figure 20: Global Photodynamic Therapy Market Y-o-Y Growth Rate Comparison by By End User (2016-2032)
- Figure 21: Global Photodynamic Therapy Market Y-o-Y Growth Rate Comparison by By Devices (2016-2032)
- Figure 22: Global Photodynamic Therapy Market Share Comparison by Region (2016-2032)
- Figure 23: Global Photodynamic Therapy Market Share Comparison by By Product (2016-2032)
- Figure 24: Global Photodynamic Therapy Market Share Comparison by By Application (2016-2032)
- Figure 25: Global Photodynamic Therapy Market Share Comparison by By End User (2016-2032)
- Figure 26: Global Photodynamic Therapy Market Share Comparison by By Devices (2016-2032)
- Figure 27: North America Photodynamic Therapy Market Revenue (US$ Mn) Market Share by By Productin 2022
- Figure 28: North America Photodynamic Therapy Market Attractiveness Analysis by By Product, 2016-2032
- Figure 29: North America Photodynamic Therapy Market Revenue (US$ Mn) Market Share by By Applicationin 2022
- Figure 30: North America Photodynamic Therapy Market Attractiveness Analysis by By Application, 2016-2032
- Figure 31: North America Photodynamic Therapy Market Revenue (US$ Mn) Market Share by By End Userin 2022
- Figure 32: North America Photodynamic Therapy Market Attractiveness Analysis by By End User, 2016-2032
- Figure 33: North America Photodynamic Therapy Market Revenue (US$ Mn) Market Share by By Devicesin 2022
- Figure 34: North America Photodynamic Therapy Market Attractiveness Analysis by By Devices, 2016-2032
- Figure 35: North America Photodynamic Therapy Market Revenue (US$ Mn) Market Share by Country in 2022
- Figure 36: North America Photodynamic Therapy Market Attractiveness Analysis by Country, 2016-2032
- Figure 37: North America Photodynamic Therapy Market Revenue (US$ Mn) (2016-2032)
- Figure 38: North America Photodynamic Therapy Market Revenue (US$ Mn) Comparison by Country (2016-2032)
- Figure 39: North America Photodynamic Therapy Market Revenue (US$ Mn) Comparison by By Product (2016-2032)
- Figure 40: North America Photodynamic Therapy Market Revenue (US$ Mn) Comparison by By Application (2016-2032)
- Figure 41: North America Photodynamic Therapy Market Revenue (US$ Mn) Comparison by By End User (2016-2032)
- Figure 42: North America Photodynamic Therapy Market Revenue (US$ Mn) Comparison by By Devices (2016-2032)
- Figure 43: North America Photodynamic Therapy Market Y-o-Y Growth Rate Comparison by Country (2016-2032)
- Figure 44: North America Photodynamic Therapy Market Y-o-Y Growth Rate Comparison by By Product (2016-2032)
- Figure 45: North America Photodynamic Therapy Market Y-o-Y Growth Rate Comparison by By Application (2016-2032)
- Figure 46: North America Photodynamic Therapy Market Y-o-Y Growth Rate Comparison by By End User (2016-2032)
- Figure 47: North America Photodynamic Therapy Market Y-o-Y Growth Rate Comparison by By Devices (2016-2032)
- Figure 48: North America Photodynamic Therapy Market Share Comparison by Country (2016-2032)
- Figure 49: North America Photodynamic Therapy Market Share Comparison by By Product (2016-2032)
- Figure 50: North America Photodynamic Therapy Market Share Comparison by By Application (2016-2032)
- Figure 51: North America Photodynamic Therapy Market Share Comparison by By End User (2016-2032)
- Figure 52: North America Photodynamic Therapy Market Share Comparison by By Devices (2016-2032)
- Figure 53: Western Europe Photodynamic Therapy Market Revenue (US$ Mn) Market Share by By Productin 2022
- Figure 54: Western Europe Photodynamic Therapy Market Attractiveness Analysis by By Product, 2016-2032
- Figure 55: Western Europe Photodynamic Therapy Market Revenue (US$ Mn) Market Share by By Applicationin 2022
- Figure 56: Western Europe Photodynamic Therapy Market Attractiveness Analysis by By Application, 2016-2032
- Figure 57: Western Europe Photodynamic Therapy Market Revenue (US$ Mn) Market Share by By End Userin 2022
- Figure 58: Western Europe Photodynamic Therapy Market Attractiveness Analysis by By End User, 2016-2032
- Figure 59: Western Europe Photodynamic Therapy Market Revenue (US$ Mn) Market Share by By Devicesin 2022
- Figure 60: Western Europe Photodynamic Therapy Market Attractiveness Analysis by By Devices, 2016-2032
- Figure 61: Western Europe Photodynamic Therapy Market Revenue (US$ Mn) Market Share by Country in 2022
- Figure 62: Western Europe Photodynamic Therapy Market Attractiveness Analysis by Country, 2016-2032
- Figure 63: Western Europe Photodynamic Therapy Market Revenue (US$ Mn) (2016-2032)
- Figure 64: Western Europe Photodynamic Therapy Market Revenue (US$ Mn) Comparison by Country (2016-2032)
- Figure 65: Western Europe Photodynamic Therapy Market Revenue (US$ Mn) Comparison by By Product (2016-2032)
- Figure 66: Western Europe Photodynamic Therapy Market Revenue (US$ Mn) Comparison by By Application (2016-2032)
- Figure 67: Western Europe Photodynamic Therapy Market Revenue (US$ Mn) Comparison by By End User (2016-2032)
- Figure 68: Western Europe Photodynamic Therapy Market Revenue (US$ Mn) Comparison by By Devices (2016-2032)
- Figure 69: Western Europe Photodynamic Therapy Market Y-o-Y Growth Rate Comparison by Country (2016-2032)
- Figure 70: Western Europe Photodynamic Therapy Market Y-o-Y Growth Rate Comparison by By Product (2016-2032)
- Figure 71: Western Europe Photodynamic Therapy Market Y-o-Y Growth Rate Comparison by By Application (2016-2032)
- Figure 72: Western Europe Photodynamic Therapy Market Y-o-Y Growth Rate Comparison by By End User (2016-2032)
- Figure 73: Western Europe Photodynamic Therapy Market Y-o-Y Growth Rate Comparison by By Devices (2016-2032)
- Figure 74: Western Europe Photodynamic Therapy Market Share Comparison by Country (2016-2032)
- Figure 75: Western Europe Photodynamic Therapy Market Share Comparison by By Product (2016-2032)
- Figure 76: Western Europe Photodynamic Therapy Market Share Comparison by By Application (2016-2032)
- Figure 77: Western Europe Photodynamic Therapy Market Share Comparison by By End User (2016-2032)
- Figure 78: Western Europe Photodynamic Therapy Market Share Comparison by By Devices (2016-2032)
- Figure 79: Eastern Europe Photodynamic Therapy Market Revenue (US$ Mn) Market Share by By Productin 2022
- Figure 80: Eastern Europe Photodynamic Therapy Market Attractiveness Analysis by By Product, 2016-2032
- Figure 81: Eastern Europe Photodynamic Therapy Market Revenue (US$ Mn) Market Share by By Applicationin 2022
- Figure 82: Eastern Europe Photodynamic Therapy Market Attractiveness Analysis by By Application, 2016-2032
- Figure 83: Eastern Europe Photodynamic Therapy Market Revenue (US$ Mn) Market Share by By End Userin 2022
- Figure 84: Eastern Europe Photodynamic Therapy Market Attractiveness Analysis by By End User, 2016-2032
- Figure 85: Eastern Europe Photodynamic Therapy Market Revenue (US$ Mn) Market Share by By Devicesin 2022
- Figure 86: Eastern Europe Photodynamic Therapy Market Attractiveness Analysis by By Devices, 2016-2032
- Figure 87: Eastern Europe Photodynamic Therapy Market Revenue (US$ Mn) Market Share by Country in 2022
- Figure 88: Eastern Europe Photodynamic Therapy Market Attractiveness Analysis by Country, 2016-2032
- Figure 89: Eastern Europe Photodynamic Therapy Market Revenue (US$ Mn) (2016-2032)
- Figure 90: Eastern Europe Photodynamic Therapy Market Revenue (US$ Mn) Comparison by Country (2016-2032)
- Figure 91: Eastern Europe Photodynamic Therapy Market Revenue (US$ Mn) Comparison by By Product (2016-2032)
- Figure 92: Eastern Europe Photodynamic Therapy Market Revenue (US$ Mn) Comparison by By Application (2016-2032)
- Figure 93: Eastern Europe Photodynamic Therapy Market Revenue (US$ Mn) Comparison by By End User (2016-2032)
- Figure 94: Eastern Europe Photodynamic Therapy Market Revenue (US$ Mn) Comparison by By Devices (2016-2032)
- Figure 95: Eastern Europe Photodynamic Therapy Market Y-o-Y Growth Rate Comparison by Country (2016-2032)
- Figure 96: Eastern Europe Photodynamic Therapy Market Y-o-Y Growth Rate Comparison by By Product (2016-2032)
- Figure 97: Eastern Europe Photodynamic Therapy Market Y-o-Y Growth Rate Comparison by By Application (2016-2032)
- Figure 98: Eastern Europe Photodynamic Therapy Market Y-o-Y Growth Rate Comparison by By End User (2016-2032)
- Figure 99: Eastern Europe Photodynamic Therapy Market Y-o-Y Growth Rate Comparison by By Devices (2016-2032)
- Figure 100: Eastern Europe Photodynamic Therapy Market Share Comparison by Country (2016-2032)
- Figure 101: Eastern Europe Photodynamic Therapy Market Share Comparison by By Product (2016-2032)
- Figure 102: Eastern Europe Photodynamic Therapy Market Share Comparison by By Application (2016-2032)
- Figure 103: Eastern Europe Photodynamic Therapy Market Share Comparison by By End User (2016-2032)
- Figure 104: Eastern Europe Photodynamic Therapy Market Share Comparison by By Devices (2016-2032)
- Figure 105: APAC Photodynamic Therapy Market Revenue (US$ Mn) Market Share by By Productin 2022
- Figure 106: APAC Photodynamic Therapy Market Attractiveness Analysis by By Product, 2016-2032
- Figure 107: APAC Photodynamic Therapy Market Revenue (US$ Mn) Market Share by By Applicationin 2022
- Figure 108: APAC Photodynamic Therapy Market Attractiveness Analysis by By Application, 2016-2032
- Figure 109: APAC Photodynamic Therapy Market Revenue (US$ Mn) Market Share by By End Userin 2022
- Figure 110: APAC Photodynamic Therapy Market Attractiveness Analysis by By End User, 2016-2032
- Figure 111: APAC Photodynamic Therapy Market Revenue (US$ Mn) Market Share by By Devicesin 2022
- Figure 112: APAC Photodynamic Therapy Market Attractiveness Analysis by By Devices, 2016-2032
- Figure 113: APAC Photodynamic Therapy Market Revenue (US$ Mn) Market Share by Country in 2022
- Figure 114: APAC Photodynamic Therapy Market Attractiveness Analysis by Country, 2016-2032
- Figure 115: APAC Photodynamic Therapy Market Revenue (US$ Mn) (2016-2032)
- Figure 116: APAC Photodynamic Therapy Market Revenue (US$ Mn) Comparison by Country (2016-2032)
- Figure 117: APAC Photodynamic Therapy Market Revenue (US$ Mn) Comparison by By Product (2016-2032)
- Figure 118: APAC Photodynamic Therapy Market Revenue (US$ Mn) Comparison by By Application (2016-2032)
- Figure 119: APAC Photodynamic Therapy Market Revenue (US$ Mn) Comparison by By End User (2016-2032)
- Figure 120: APAC Photodynamic Therapy Market Revenue (US$ Mn) Comparison by By Devices (2016-2032)
- Figure 121: APAC Photodynamic Therapy Market Y-o-Y Growth Rate Comparison by Country (2016-2032)
- Figure 122: APAC Photodynamic Therapy Market Y-o-Y Growth Rate Comparison by By Product (2016-2032)
- Figure 123: APAC Photodynamic Therapy Market Y-o-Y Growth Rate Comparison by By Application (2016-2032)
- Figure 124: APAC Photodynamic Therapy Market Y-o-Y Growth Rate Comparison by By End User (2016-2032)
- Figure 125: APAC Photodynamic Therapy Market Y-o-Y Growth Rate Comparison by By Devices (2016-2032)
- Figure 126: APAC Photodynamic Therapy Market Share Comparison by Country (2016-2032)
- Figure 127: APAC Photodynamic Therapy Market Share Comparison by By Product (2016-2032)
- Figure 128: APAC Photodynamic Therapy Market Share Comparison by By Application (2016-2032)
- Figure 129: APAC Photodynamic Therapy Market Share Comparison by By End User (2016-2032)
- Figure 130: APAC Photodynamic Therapy Market Share Comparison by By Devices (2016-2032)
- Figure 131: Latin America Photodynamic Therapy Market Revenue (US$ Mn) Market Share by By Productin 2022
- Figure 132: Latin America Photodynamic Therapy Market Attractiveness Analysis by By Product, 2016-2032
- Figure 133: Latin America Photodynamic Therapy Market Revenue (US$ Mn) Market Share by By Applicationin 2022
- Figure 134: Latin America Photodynamic Therapy Market Attractiveness Analysis by By Application, 2016-2032
- Figure 135: Latin America Photodynamic Therapy Market Revenue (US$ Mn) Market Share by By End Userin 2022
- Figure 136: Latin America Photodynamic Therapy Market Attractiveness Analysis by By End User, 2016-2032
- Figure 137: Latin America Photodynamic Therapy Market Revenue (US$ Mn) Market Share by By Devicesin 2022
- Figure 138: Latin America Photodynamic Therapy Market Attractiveness Analysis by By Devices, 2016-2032
- Figure 139: Latin America Photodynamic Therapy Market Revenue (US$ Mn) Market Share by Country in 2022
- Figure 140: Latin America Photodynamic Therapy Market Attractiveness Analysis by Country, 2016-2032
- Figure 141: Latin America Photodynamic Therapy Market Revenue (US$ Mn) (2016-2032)
- Figure 142: Latin America Photodynamic Therapy Market Revenue (US$ Mn) Comparison by Country (2016-2032)
- Figure 143: Latin America Photodynamic Therapy Market Revenue (US$ Mn) Comparison by By Product (2016-2032)
- Figure 144: Latin America Photodynamic Therapy Market Revenue (US$ Mn) Comparison by By Application (2016-2032)
- Figure 145: Latin America Photodynamic Therapy Market Revenue (US$ Mn) Comparison by By End User (2016-2032)
- Figure 146: Latin America Photodynamic Therapy Market Revenue (US$ Mn) Comparison by By Devices (2016-2032)
- Figure 147: Latin America Photodynamic Therapy Market Y-o-Y Growth Rate Comparison by Country (2016-2032)
- Figure 148: Latin America Photodynamic Therapy Market Y-o-Y Growth Rate Comparison by By Product (2016-2032)
- Figure 149: Latin America Photodynamic Therapy Market Y-o-Y Growth Rate Comparison by By Application (2016-2032)
- Figure 150: Latin America Photodynamic Therapy Market Y-o-Y Growth Rate Comparison by By End User (2016-2032)
- Figure 151: Latin America Photodynamic Therapy Market Y-o-Y Growth Rate Comparison by By Devices (2016-2032)
- Figure 152: Latin America Photodynamic Therapy Market Share Comparison by Country (2016-2032)
- Figure 153: Latin America Photodynamic Therapy Market Share Comparison by By Product (2016-2032)
- Figure 154: Latin America Photodynamic Therapy Market Share Comparison by By Application (2016-2032)
- Figure 155: Latin America Photodynamic Therapy Market Share Comparison by By End User (2016-2032)
- Figure 156: Latin America Photodynamic Therapy Market Share Comparison by By Devices (2016-2032)
- Figure 157: Middle East & Africa Photodynamic Therapy Market Revenue (US$ Mn) Market Share by By Productin 2022
- Figure 158: Middle East & Africa Photodynamic Therapy Market Attractiveness Analysis by By Product, 2016-2032
- Figure 159: Middle East & Africa Photodynamic Therapy Market Revenue (US$ Mn) Market Share by By Applicationin 2022
- Figure 160: Middle East & Africa Photodynamic Therapy Market Attractiveness Analysis by By Application, 2016-2032
- Figure 161: Middle East & Africa Photodynamic Therapy Market Revenue (US$ Mn) Market Share by By End Userin 2022
- Figure 162: Middle East & Africa Photodynamic Therapy Market Attractiveness Analysis by By End User, 2016-2032
- Figure 163: Middle East & Africa Photodynamic Therapy Market Revenue (US$ Mn) Market Share by By Devicesin 2022
- Figure 164: Middle East & Africa Photodynamic Therapy Market Attractiveness Analysis by By Devices, 2016-2032
- Figure 165: Middle East & Africa Photodynamic Therapy Market Revenue (US$ Mn) Market Share by Country in 2022
- Figure 166: Middle East & Africa Photodynamic Therapy Market Attractiveness Analysis by Country, 2016-2032
- Figure 167: Middle East & Africa Photodynamic Therapy Market Revenue (US$ Mn) (2016-2032)
- Figure 168: Middle East & Africa Photodynamic Therapy Market Revenue (US$ Mn) Comparison by Country (2016-2032)
- Figure 169: Middle East & Africa Photodynamic Therapy Market Revenue (US$ Mn) Comparison by By Product (2016-2032)
- Figure 170: Middle East & Africa Photodynamic Therapy Market Revenue (US$ Mn) Comparison by By Application (2016-2032)
- Figure 171: Middle East & Africa Photodynamic Therapy Market Revenue (US$ Mn) Comparison by By End User (2016-2032)
- Figure 172: Middle East & Africa Photodynamic Therapy Market Revenue (US$ Mn) Comparison by By Devices (2016-2032)
- Figure 173: Middle East & Africa Photodynamic Therapy Market Y-o-Y Growth Rate Comparison by Country (2016-2032)
- Figure 174: Middle East & Africa Photodynamic Therapy Market Y-o-Y Growth Rate Comparison by By Product (2016-2032)
- Figure 175: Middle East & Africa Photodynamic Therapy Market Y-o-Y Growth Rate Comparison by By Application (2016-2032)
- Figure 176: Middle East & Africa Photodynamic Therapy Market Y-o-Y Growth Rate Comparison by By End User (2016-2032)
- Figure 177: Middle East & Africa Photodynamic Therapy Market Y-o-Y Growth Rate Comparison by By Devices (2016-2032)
- Figure 178: Middle East & Africa Photodynamic Therapy Market Share Comparison by Country (2016-2032)
- Figure 179: Middle East & Africa Photodynamic Therapy Market Share Comparison by By Product (2016-2032)
- Figure 180: Middle East & Africa Photodynamic Therapy Market Share Comparison by By Application (2016-2032)
- Figure 181: Middle East & Africa Photodynamic Therapy Market Share Comparison by By End User (2016-2032)
- Figure 182: Middle East & Africa Photodynamic Therapy Market Share Comparison by By Devices (2016-2032)
- List of Tables
- Table 1: Global Photodynamic Therapy Market Comparison by By Product (2016-2032)
- Table 2: Global Photodynamic Therapy Market Comparison by By Application (2016-2032)
- Table 3: Global Photodynamic Therapy Market Comparison by By End User (2016-2032)
- Table 4: Global Photodynamic Therapy Market Comparison by By Devices (2016-2032)
- Table 5: Global Photodynamic Therapy Market Revenue (US$ Mn) Comparison by Region (2016-2032)
- Table 6: Global Photodynamic Therapy Market Revenue (US$ Mn) (2016-2032)
- Table 7: Global Photodynamic Therapy Market Revenue (US$ Mn) Comparison by Region (2016-2032)
- Table 8: Global Photodynamic Therapy Market Revenue (US$ Mn) Comparison by By Product (2016-2032)
- Table 9: Global Photodynamic Therapy Market Revenue (US$ Mn) Comparison by By Application (2016-2032)
- Table 10: Global Photodynamic Therapy Market Revenue (US$ Mn) Comparison by By End User (2016-2032)
- Table 11: Global Photodynamic Therapy Market Revenue (US$ Mn) Comparison by By Devices (2016-2032)
- Table 12: Global Photodynamic Therapy Market Y-o-Y Growth Rate Comparison by Region (2016-2032)
- Table 13: Global Photodynamic Therapy Market Y-o-Y Growth Rate Comparison by By Product (2016-2032)
- Table 14: Global Photodynamic Therapy Market Y-o-Y Growth Rate Comparison by By Application (2016-2032)
- Table 15: Global Photodynamic Therapy Market Y-o-Y Growth Rate Comparison by By End User (2016-2032)
- Table 16: Global Photodynamic Therapy Market Y-o-Y Growth Rate Comparison by By Devices (2016-2032)
- Table 17: Global Photodynamic Therapy Market Share Comparison by Region (2016-2032)
- Table 18: Global Photodynamic Therapy Market Share Comparison by By Product (2016-2032)
- Table 19: Global Photodynamic Therapy Market Share Comparison by By Application (2016-2032)
- Table 20: Global Photodynamic Therapy Market Share Comparison by By End User (2016-2032)
- Table 21: Global Photodynamic Therapy Market Share Comparison by By Devices (2016-2032)
- Table 22: North America Photodynamic Therapy Market Comparison by By Application (2016-2032)
- Table 23: North America Photodynamic Therapy Market Comparison by By End User (2016-2032)
- Table 24: North America Photodynamic Therapy Market Comparison by By Devices (2016-2032)
- Table 25: North America Photodynamic Therapy Market Revenue (US$ Mn) Comparison by Country (2016-2032)
- Table 26: North America Photodynamic Therapy Market Revenue (US$ Mn) (2016-2032)
- Table 27: North America Photodynamic Therapy Market Revenue (US$ Mn) Comparison by Country (2016-2032)
- Table 28: North America Photodynamic Therapy Market Revenue (US$ Mn) Comparison by By Product (2016-2032)
- Table 29: North America Photodynamic Therapy Market Revenue (US$ Mn) Comparison by By Application (2016-2032)
- Table 30: North America Photodynamic Therapy Market Revenue (US$ Mn) Comparison by By End User (2016-2032)
- Table 31: North America Photodynamic Therapy Market Revenue (US$ Mn) Comparison by By Devices (2016-2032)
- Table 32: North America Photodynamic Therapy Market Y-o-Y Growth Rate Comparison by Country (2016-2032)
- Table 33: North America Photodynamic Therapy Market Y-o-Y Growth Rate Comparison by By Product (2016-2032)
- Table 34: North America Photodynamic Therapy Market Y-o-Y Growth Rate Comparison by By Application (2016-2032)
- Table 35: North America Photodynamic Therapy Market Y-o-Y Growth Rate Comparison by By End User (2016-2032)
- Table 36: North America Photodynamic Therapy Market Y-o-Y Growth Rate Comparison by By Devices (2016-2032)
- Table 37: North America Photodynamic Therapy Market Share Comparison by Country (2016-2032)
- Table 38: North America Photodynamic Therapy Market Share Comparison by By Product (2016-2032)
- Table 39: North America Photodynamic Therapy Market Share Comparison by By Application (2016-2032)
- Table 40: North America Photodynamic Therapy Market Share Comparison by By End User (2016-2032)
- Table 41: North America Photodynamic Therapy Market Share Comparison by By Devices (2016-2032)
- Table 42: Western Europe Photodynamic Therapy Market Comparison by By Product (2016-2032)
- Table 43: Western Europe Photodynamic Therapy Market Comparison by By Application (2016-2032)
- Table 44: Western Europe Photodynamic Therapy Market Comparison by By End User (2016-2032)
- Table 45: Western Europe Photodynamic Therapy Market Comparison by By Devices (2016-2032)
- Table 46: Western Europe Photodynamic Therapy Market Revenue (US$ Mn) Comparison by Country (2016-2032)
- Table 47: Western Europe Photodynamic Therapy Market Revenue (US$ Mn) (2016-2032)
- Table 48: Western Europe Photodynamic Therapy Market Revenue (US$ Mn) Comparison by Country (2016-2032)
- Table 49: Western Europe Photodynamic Therapy Market Revenue (US$ Mn) Comparison by By Product (2016-2032)
- Table 50: Western Europe Photodynamic Therapy Market Revenue (US$ Mn) Comparison by By Application (2016-2032)
- Table 51: Western Europe Photodynamic Therapy Market Revenue (US$ Mn) Comparison by By End User (2016-2032)
- Table 52: Western Europe Photodynamic Therapy Market Revenue (US$ Mn) Comparison by By Devices (2016-2032)
- Table 53: Western Europe Photodynamic Therapy Market Y-o-Y Growth Rate Comparison by Country (2016-2032)
- Table 54: Western Europe Photodynamic Therapy Market Y-o-Y Growth Rate Comparison by By Product (2016-2032)
- Table 55: Western Europe Photodynamic Therapy Market Y-o-Y Growth Rate Comparison by By Application (2016-2032)
- Table 56: Western Europe Photodynamic Therapy Market Y-o-Y Growth Rate Comparison by By End User (2016-2032)
- Table 57: Western Europe Photodynamic Therapy Market Y-o-Y Growth Rate Comparison by By Devices (2016-2032)
- Table 58: Western Europe Photodynamic Therapy Market Share Comparison by Country (2016-2032)
- Table 59: Western Europe Photodynamic Therapy Market Share Comparison by By Product (2016-2032)
- Table 60: Western Europe Photodynamic Therapy Market Share Comparison by By Application (2016-2032)
- Table 61: Western Europe Photodynamic Therapy Market Share Comparison by By End User (2016-2032)
- Table 62: Western Europe Photodynamic Therapy Market Share Comparison by By Devices (2016-2032)
- Table 63: Eastern Europe Photodynamic Therapy Market Comparison by By Product (2016-2032)
- Table 64: Eastern Europe Photodynamic Therapy Market Comparison by By Application (2016-2032)
- Table 65: Eastern Europe Photodynamic Therapy Market Comparison by By End User (2016-2032)
- Table 66: Eastern Europe Photodynamic Therapy Market Comparison by By Devices (2016-2032)
- Table 67: Eastern Europe Photodynamic Therapy Market Revenue (US$ Mn) Comparison by Country (2016-2032)
- Table 68: Eastern Europe Photodynamic Therapy Market Revenue (US$ Mn) (2016-2032)
- Table 69: Eastern Europe Photodynamic Therapy Market Revenue (US$ Mn) Comparison by Country (2016-2032)
- Table 70: Eastern Europe Photodynamic Therapy Market Revenue (US$ Mn) Comparison by By Product (2016-2032)
- Table 71: Eastern Europe Photodynamic Therapy Market Revenue (US$ Mn) Comparison by By Application (2016-2032)
- Table 72: Eastern Europe Photodynamic Therapy Market Revenue (US$ Mn) Comparison by By End User (2016-2032)
- Table 73: Eastern Europe Photodynamic Therapy Market Revenue (US$ Mn) Comparison by By Devices (2016-2032)
- Table 74: Eastern Europe Photodynamic Therapy Market Y-o-Y Growth Rate Comparison by Country (2016-2032)
- Table 75: Eastern Europe Photodynamic Therapy Market Y-o-Y Growth Rate Comparison by By Product (2016-2032)
- Table 76: Eastern Europe Photodynamic Therapy Market Y-o-Y Growth Rate Comparison by By Application (2016-2032)
- Table 77: Eastern Europe Photodynamic Therapy Market Y-o-Y Growth Rate Comparison by By End User (2016-2032)
- Table 78: Eastern Europe Photodynamic Therapy Market Y-o-Y Growth Rate Comparison by By Devices (2016-2032)
- Table 79: Eastern Europe Photodynamic Therapy Market Share Comparison by Country (2016-2032)
- Table 80: Eastern Europe Photodynamic Therapy Market Share Comparison by By Product (2016-2032)
- Table 81: Eastern Europe Photodynamic Therapy Market Share Comparison by By Application (2016-2032)
- Table 82: Eastern Europe Photodynamic Therapy Market Share Comparison by By End User (2016-2032)
- Table 83: Eastern Europe Photodynamic Therapy Market Share Comparison by By Devices (2016-2032)
- Table 84: APAC Photodynamic Therapy Market Comparison by By Product (2016-2032)
- Table 85: APAC Photodynamic Therapy Market Comparison by By Application (2016-2032)
- Table 86: APAC Photodynamic Therapy Market Comparison by By End User (2016-2032)
- Table 87: APAC Photodynamic Therapy Market Comparison by By Devices (2016-2032)
- Table 88: APAC Photodynamic Therapy Market Revenue (US$ Mn) Comparison by Country (2016-2032)
- Table 89: APAC Photodynamic Therapy Market Revenue (US$ Mn) (2016-2032)
- Table 90: APAC Photodynamic Therapy Market Revenue (US$ Mn) Comparison by Country (2016-2032)
- Table 91: APAC Photodynamic Therapy Market Revenue (US$ Mn) Comparison by By Product (2016-2032)
- Table 92: APAC Photodynamic Therapy Market Revenue (US$ Mn) Comparison by By Application (2016-2032)
- Table 93: APAC Photodynamic Therapy Market Revenue (US$ Mn) Comparison by By End User (2016-2032)
- Table 94: APAC Photodynamic Therapy Market Revenue (US$ Mn) Comparison by By Devices (2016-2032)
- Table 95: APAC Photodynamic Therapy Market Y-o-Y Growth Rate Comparison by Country (2016-2032)
- Table 96: APAC Photodynamic Therapy Market Y-o-Y Growth Rate Comparison by By Product (2016-2032)
- Table 97: APAC Photodynamic Therapy Market Y-o-Y Growth Rate Comparison by By Application (2016-2032)
- Table 98: APAC Photodynamic Therapy Market Y-o-Y Growth Rate Comparison by By End User (2016-2032)
- Table 99: APAC Photodynamic Therapy Market Y-o-Y Growth Rate Comparison by By Devices (2016-2032)
- Table 100: APAC Photodynamic Therapy Market Share Comparison by Country (2016-2032)
- Table 101: APAC Photodynamic Therapy Market Share Comparison by By Product (2016-2032)
- Table 102: APAC Photodynamic Therapy Market Share Comparison by By Application (2016-2032)
- Table 103: APAC Photodynamic Therapy Market Share Comparison by By End User (2016-2032)
- Table 104: APAC Photodynamic Therapy Market Share Comparison by By Devices (2016-2032)
- Table 105: Latin America Photodynamic Therapy Market Comparison by By Product (2016-2032)
- Table 106: Latin America Photodynamic Therapy Market Comparison by By Application (2016-2032)
- Table 107: Latin America Photodynamic Therapy Market Comparison by By End User (2016-2032)
- Table 108: Latin America Photodynamic Therapy Market Comparison by By Devices (2016-2032)
- Table 109: Latin America Photodynamic Therapy Market Revenue (US$ Mn) Comparison by Country (2016-2032)
- Table 110: Latin America Photodynamic Therapy Market Revenue (US$ Mn) (2016-2032)
- Table 111: Latin America Photodynamic Therapy Market Revenue (US$ Mn) Comparison by Country (2016-2032)
- Table 112: Latin America Photodynamic Therapy Market Revenue (US$ Mn) Comparison by By Product (2016-2032)
- Table 113: Latin America Photodynamic Therapy Market Revenue (US$ Mn) Comparison by By Application (2016-2032)
- Table 114: Latin America Photodynamic Therapy Market Revenue (US$ Mn) Comparison by By End User (2016-2032)
- Table 115: Latin America Photodynamic Therapy Market Revenue (US$ Mn) Comparison by By Devices (2016-2032)
- Table 116: Latin America Photodynamic Therapy Market Y-o-Y Growth Rate Comparison by Country (2016-2032)
- Table 117: Latin America Photodynamic Therapy Market Y-o-Y Growth Rate Comparison by By Product (2016-2032)
- Table 118: Latin America Photodynamic Therapy Market Y-o-Y Growth Rate Comparison by By Application (2016-2032)
- Table 119: Latin America Photodynamic Therapy Market Y-o-Y Growth Rate Comparison by By End User (2016-2032)
- Table 120: Latin America Photodynamic Therapy Market Y-o-Y Growth Rate Comparison by By Devices (2016-2032)
- Table 121: Latin America Photodynamic Therapy Market Share Comparison by Country (2016-2032)
- Table 122: Latin America Photodynamic Therapy Market Share Comparison by By Product (2016-2032)
- Table 123: Latin America Photodynamic Therapy Market Share Comparison by By Application (2016-2032)
- Table 124: Latin America Photodynamic Therapy Market Share Comparison by By End User (2016-2032)
- Table 125: Latin America Photodynamic Therapy Market Share Comparison by By Devices (2016-2032)
- Table 126: Middle East & Africa Photodynamic Therapy Market Comparison by By Product (2016-2032)
- Table 127: Middle East & Africa Photodynamic Therapy Market Comparison by By Application (2016-2032)
- Table 128: Middle East & Africa Photodynamic Therapy Market Comparison by By End User (2016-2032)
- Table 129: Middle East & Africa Photodynamic Therapy Market Comparison by By Devices (2016-2032)
- Table 130: Middle East & Africa Photodynamic Therapy Market Revenue (US$ Mn) Comparison by Country (2016-2032)
- Table 131: Middle East & Africa Photodynamic Therapy Market Revenue (US$ Mn) (2016-2032)
- Table 132: Middle East & Africa Photodynamic Therapy Market Revenue (US$ Mn) Comparison by Country (2016-2032)
- Table 133: Middle East & Africa Photodynamic Therapy Market Revenue (US$ Mn) Comparison by By Product (2016-2032)
- Table 134: Middle East & Africa Photodynamic Therapy Market Revenue (US$ Mn) Comparison by By Application (2016-2032)
- Table 135: Middle East & Africa Photodynamic Therapy Market Revenue (US$ Mn) Comparison by By End User (2016-2032)
- Table 136: Middle East & Africa Photodynamic Therapy Market Revenue (US$ Mn) Comparison by By Devices (2016-2032)
- Table 137: Middle East & Africa Photodynamic Therapy Market Y-o-Y Growth Rate Comparison by Country (2016-2032)
- Table 138: Middle East & Africa Photodynamic Therapy Market Y-o-Y Growth Rate Comparison by By Product (2016-2032)
- Table 139: Middle East & Africa Photodynamic Therapy Market Y-o-Y Growth Rate Comparison by By Application (2016-2032)
- Table 140: Middle East & Africa Photodynamic Therapy Market Y-o-Y Growth Rate Comparison by By End User (2016-2032)
- Table 141: Middle East & Africa Photodynamic Therapy Market Y-o-Y Growth Rate Comparison by By Devices (2016-2032)
- Table 142: Middle East & Africa Photodynamic Therapy Market Share Comparison by Country (2016-2032)
- Table 143: Middle East & Africa Photodynamic Therapy Market Share Comparison by By Product (2016-2032)
- Table 144: Middle East & Africa Photodynamic Therapy Market Share Comparison by By Application (2016-2032)
- Table 145: Middle East & Africa Photodynamic Therapy Market Share Comparison by By End User (2016-2032)
- Table 146: Middle East & Africa Photodynamic Therapy Market Share Comparison by By Devices (2016-2032)
- 1. Executive Summary
-
- Biofrontera AG
- Theralase Technologies Inc.
- Lumibird
- Quest PharmaTech Inc.
- Modulight Inc.
- Galderma S.A.
- Sun Pharmaceutical Industries Ltd.
- SUS Advancing Technology Co. Ltd.
- Bausch Health Co. Inc.
- Biolase Inc.
- Pinnacle Biologics Inc.
Our Clients


View Our Licence Options
