
Pawn Shops Market By Type (Jewelry & Accessories, Electronic Tools, Collectibles, Musical Instruments, and Other product types), By Services (Loan, Selling and Buying), By End-User (Generation X, Generation Y, and Baby Boomers), By Region and Companies - Industry Segment Outlook, Market Assessment, Competition Scenario, Trends, and Forecast 2023-2032
-
36198
-
June 2023
-
73
-


-
This report was compiled by Research Team Research team of over 50 passionate professionals leverages advanced research methodologies and analytical expertise to deliver insightful, data-driven market intelligence that empowers businesses across diverse industries to make strategic, well-informed Correspondence Research Team Linkedin | Detailed Market research Methodology Our methodology involves a mix of primary research, including interviews with leading mental health experts, and secondary research from reputable medical journals and databases. View Detailed Methodology Page
-
Quick Navigation
Report Overview
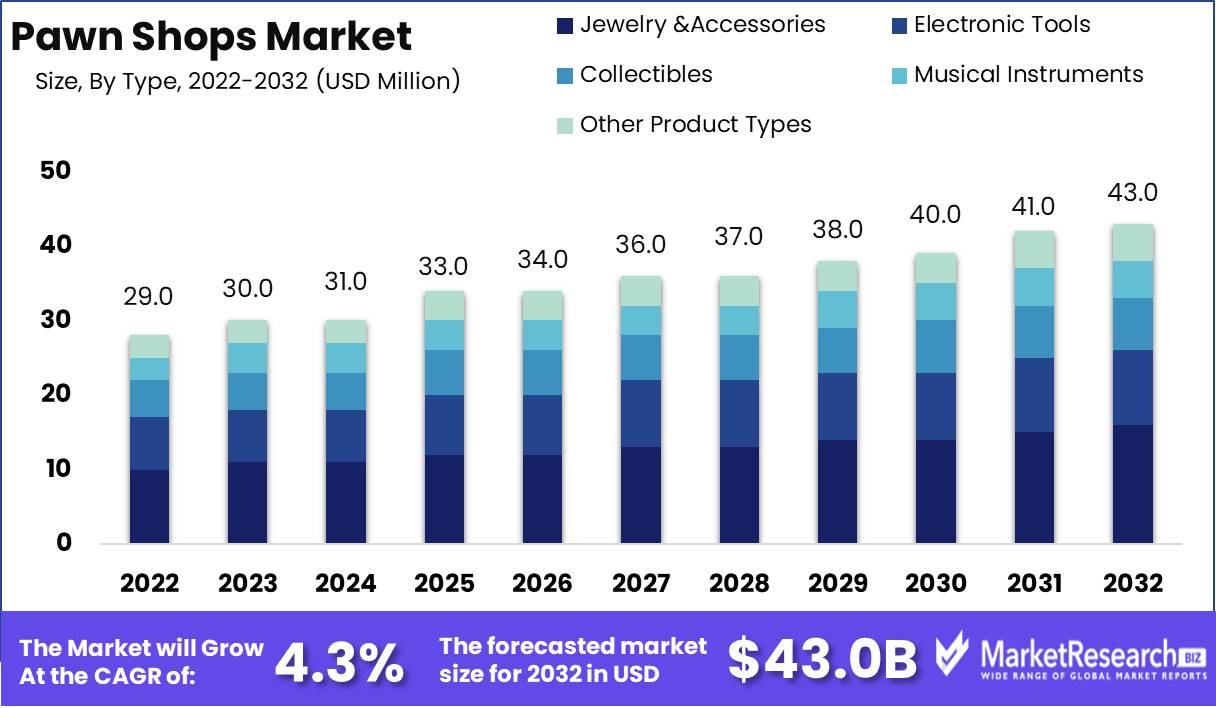
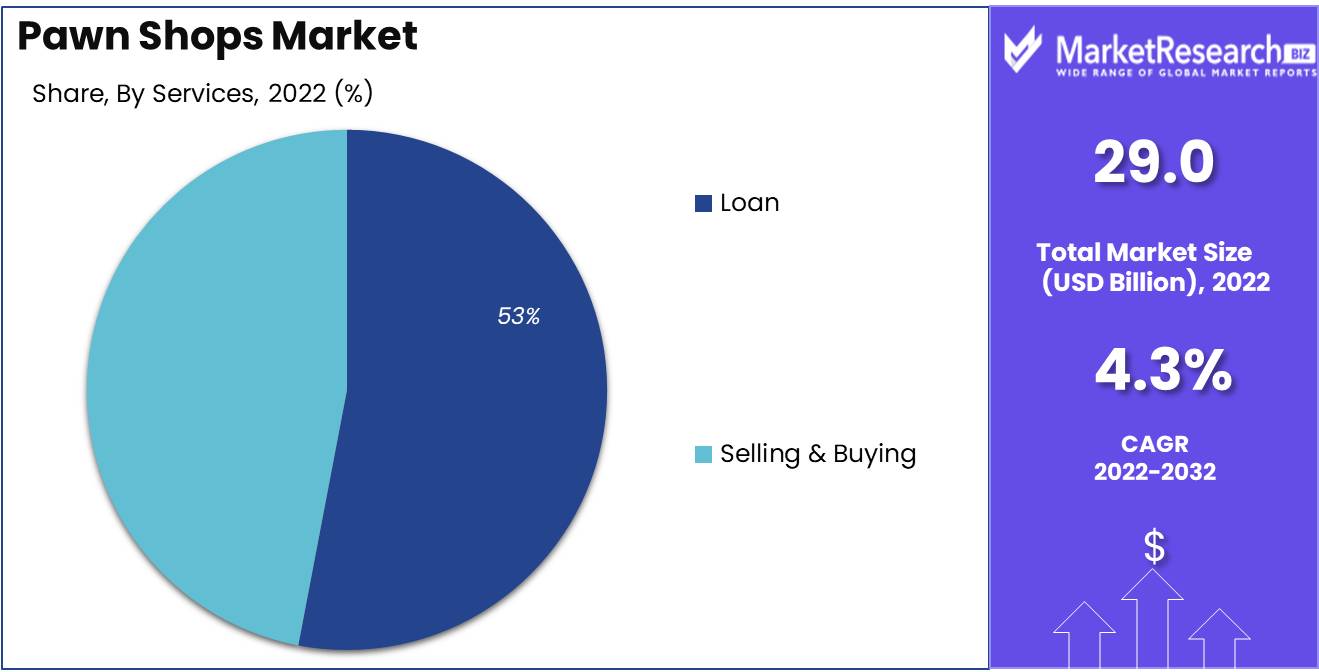
Pawn Shops Market size is expected to be worth around USD 43.0 Bn by 2032 from USD 29.0 Bn in 2022, growing at a CAGR of 4.3% during the forecast period from 2023 to 2032.
The growing demand for good retailing, consumer lending, and appraising items to pawn or purchase from different age groups peoples such as Generation Y, Generation X, and Baby Boomers. Also, the rising trend of online purchases shops contributed to the growth of the pawn shops market. The increasing demand for loans such as short terms by different age groups peoples all around the world. The pawn shops involve a money lending procedure in exchange for a valuable asset that can be sold.
When the loan or money is not returned in the decided period. Products such as jewelry, devices, electronics, guns, and other items can be exchanged for a loan in the payment cost which is agreed upon by both parties. Also, the person engaged in the process of lending money for resale from traders and dealers is referred to as a Pawnbroker.
Market Scope
Product Type Analysis
Jewelry and Accessories is the Most Dominating segment in the Pawn Shop Market
Based on product, the market is segmented into Jewelry & Accessories, Collectibles, Electronic Tools, Musical Instruments, and Other types. Jewelry and accessories is the leading segment in the market, due to a large number of loans to exchange. Musical instruments segment is anticipated to witness considerable growth during the forecast period.
Services Analysis
The Loan Services is the Leading Segment in the Pawnshops Market
Based on services the market is segmented into Loans, Selling, and Buying. The loan segment is the most dominating segment in the market. Due to its efficient and easy method of acquiring a loan against important items, it is estimated to drive market growth during the projection period. Buying services is expected to witness significant growth over the forecast period.
End-User Analysis
Based on end-users, the market is segmented into Generation X, Generation Y, and Baby Boomers. Generation X also known as Gen Xers is the first generation to grow up with personal computers to the extent of becoming tech-savvy. Generation X does not have a more glamorous reputation compared to baby boomers but they don’t care. Baby boomers are the demographic unit that follows the silent generation and preceding generation X.
Generation X is tech-savvy but it is not tech-dependent. Generation Xers are more likely to object the excessive mobile use in social settings. Also, Generation Xers are expert DIYers. Generation Y is the oldest member of this generation which became adults at the turn of the millennium. The members of this generation grow with the surrounding by the technology and prefer to communicate through social media and text instead of email or face-to-face contact. This segment also shows significant growth in the pawn shop market.
Key Market Segments
By Type
- Jewelry &Accessories
- Electronic Tools
- Collectibles
- Musical Instruments
- Other product types
By Services
- Loan
- Selling and Buying
By End-User
- Generation X
- Generation Y
- Baby Boomers
Market Dynamics
Drivers
The Growth in Convenient and Quick Methods of Loan Provision in a Short Time Period
The increasing demand for pawn services is due to the economic recession and the rising cost of living. Also growing popularity of TV shows about pawn shops increases the awareness about them in the general public. The pawn shops do not have any credit checks, no judgment, and personal questions while on the loan. There is no impact on our credit rating and there is no limit to taking methods for a loan. Such factors drive the growth of the pawn shop market. Also, the significant growth of the market is due to receiving a loan at a fast processing speed, and easily exchanging the item to the pawn shop at the required amount.
Receiving instant cash, and requiring no time to approve the item support for the growth of the market, and is responsible for the expansion of pawn shops. On our request or demands pawnshop easily gives access to money at pawn shops as many times as we want while other shops owner are not this flexible. Pawn shops become more mainstream with big-name retailers such as Walmart getting into the business. Pawn shops just expect to pay the first loan and then apply for another such strategy also helps to boost the growth of the pawn shop market.
Restraints
The Lack of Limited Number of Pawn Shops in Developing Nations
Every store is vulnerable to fraud and theft. Banks take less interest to work with this business due to the large chances of fraud. As repayments via credit card companies, which do not come from the merchant initially. The pawn shops have an extra concern about the legitimacy of the merchandise they purchase. The various instances of individuals selling stolen products to a pawn shop. The pawn shoppers are lying even though they are aware of the items that it is a third party.
The goods become more challenging as manufacturing gets better at producing realistic knock-offs. Such factors restrict the growth of the market. Also, pawn shop customers don’t have any protections instead of that financial institutions have regulations in place to give protection to the customers. The lack of limited numbers and awareness of pawn shops in developing regions. The pawn shops can sell jewelry and goods at high rates. The high value of merchandise includes a fraud case which leads to a greater loss of industry growth. which hamper the growth of the pawn shop market.
Opportunity
Growing Adoption of Pawn Shops in Several Regions
Various companies are providing online services through the online platform. The customers visit the pawn shops for the money loan from the pawnbrokers by keeping collaterals. The growing adoption of e-commerce in the pawn shop market generates several opportunities for the key players in the expansion of the market, through the online platform by expanding their customer base. For example, the pawnbroker is an antique that caters to bargain hunters looking to increase the short term through the selling, buying, or pawning of luxury jewelry, artwork collections, and other items through the online platform.
Trends
Growing Adoption of Online Pawnbrokers and Social Media as an Advertising Option
The global pawn shop market is expected to increase at a significant rate during the projection period in 2022. The pawn shop market is increasing at a considerable rate by the increasing adoption of advanced strategies by market key players. Pawn shops generally pay the most for jewelry such as gold and diamond, timepieces, designer purses, vintage sneakers, and handbags. However, every pawn shop can buy high-ticket items, and real estate, including vehicles and jewelry. The increasing adoption of the Brick & Mortar Retail Model and the rising adoption of social media as an advertising option.
Regional Analysis
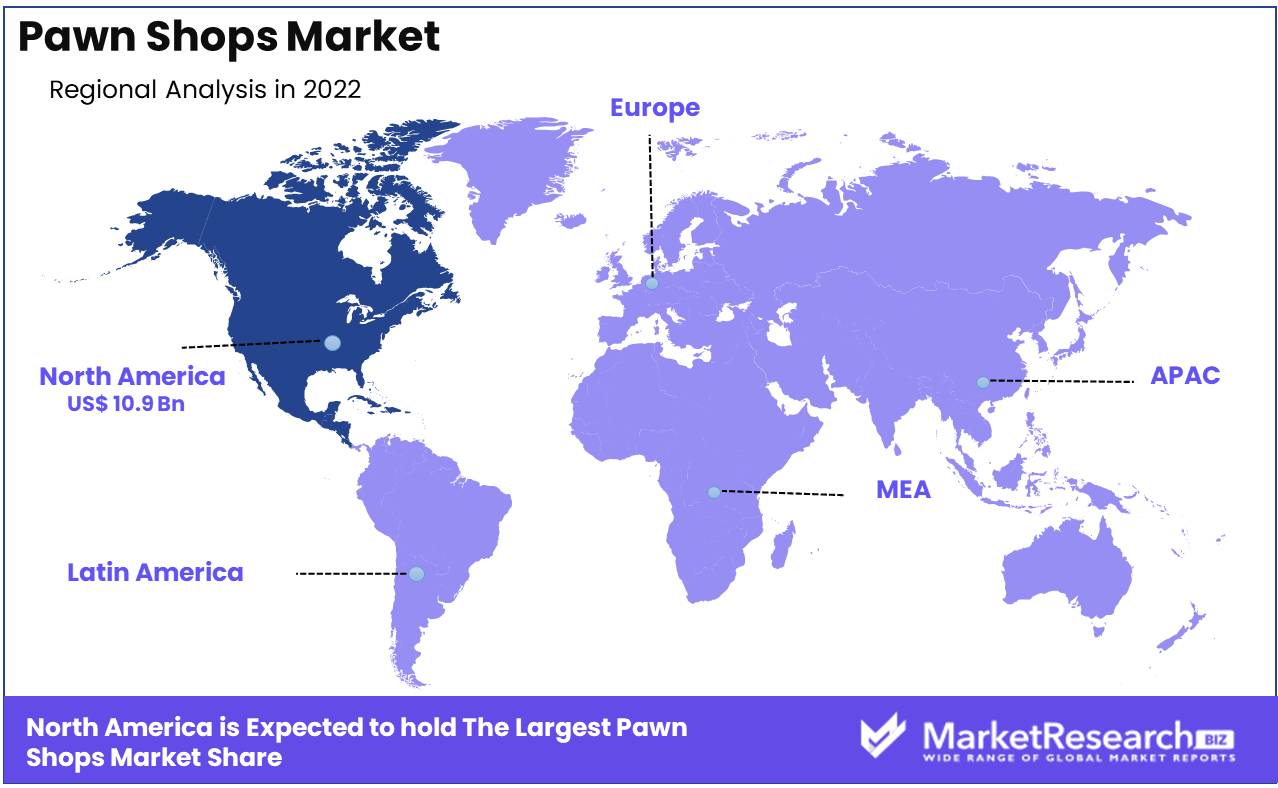
North America is the Most Dominating Region in the Pawn Shops Market
North America is the most dominating region in the pawn shop markets. The rising trend of online trading and online earning is booming in the region which helps the growth of the pawn shops market in this region. However, the trend in this region about the convenient and quick loan methods given for a limited period is also gaining trend and now it is widely preferred by the people. The availability of several products along with a huge variety of pawn shops drives the growth of the pawn shop market in North America. It involves goods at a very cheap price. There is also increased demand for pawn shops in the Asia Pacific and Europe is growing at a considerable rate.
Key Regions
- North America
- The US
- Canada
- Mexico
- Western Europe
- Germany
- France
- The UK
- Spain
- Italy
- Portugal
- Ireland
- Austria
- Switzerland
- Benelux
- Nordic
- Rest of Western Europe
- Eastern Europe
- Russia
- Poland
- The Czech Republic
- Greece
- Rest of Eastern Europe
- APAC
- China
- Japan
- South Korea
- India
- Australia & New Zealand
- Indonesia
- Malaysia
- Philippines
- Singapore
- Thailand
- Vietnam
- Rest of APAC
- Latin America
- Brazil
- Colombia
- Chile
- Argentina
- Costa Rica
- Rest of Latin America
- Middle East & Africa
- Algeria
- Egypt
- Israel
- Kuwait
- Nigeria
- Saudi Arabia
- South Africa
- Turkey
- United Arab Emirates
- Rest of MEA
Key Players Analysis
Emerging key players are focused on a variety of strategic policies to develop their respective businesses in foreign markets. Several bio-based surface disinfectant market companies are concentrating on expanding their existing operations and R&D facilities. Furthermore, businesses in the bio-based disinfectants market are developing new products and portfolio expansion strategies through investments and mergers, and acquisitions. In addition, several key players are now focusing on different marketing strategies such as spreading awareness about natural ingredients, which is boosting the target products' growth.
Market Key Players
- First Cash Financial Services Inc.
- EZCorp Inc
- Cash America International Inc.
- Pawngo
- UltraPawn, LLC
- Gold & Silver Pawn Shop
- American Jewelry and Loan
- Dollar Financial Group Global Corporation
- Browns Pawnbrokers
- New Bond Street Pawnbrokers
- Other key Players
Recent Developments
- In September 2016: Bravo Pawn Systems, a business leader in software advancement for pawnbroking, launched the first mobile app, Which offers Pawn services to the clientele at a single snap on their smartphones.
Report Scope
Report Features Description Market Value (2022) USD 29.0 Bn Forecast Revenue (2032) USD 43.0 Bn CAGR (2023-2032) 4.3% Base Year for Estimation 2022 Historic Period 2016-2022 Forecast Period 2023-2032 Report Coverage Revenue Forecast, Market Dynamics, COVID-19 Impact, Competitive Landscape, Recent Developments Segments Covered By Type (Jewelry &Accessories, Electronic Tools, Collectibles, Musical Instruments, and Other product types); By Services (Loan, Selling, and Buying); By End-User (Generation X, Generation Y, and Baby Boomers) Regional Analysis North America – The US, Canada, & Mexico; Western Europe – Germany, France, The UK, Spain, Italy, Portugal, Ireland, Austria, Switzerland, Benelux, Nordic, & Rest of Western Europe; Eastern Europe – Russia, Poland, The Czech Republic, Greece, & Rest of Eastern Europe; APAC – China, Japan, South Korea, India, Australia & New Zealand, Indonesia, Malaysia, Philippines, Singapore, Thailand, Vietnam, & Rest of APAC; Latin America – Brazil, Colombia, Chile, Argentina, Costa Rica, & Rest of Latin America; Middle East & Africa – Algeria, Egypt, Israel, Kuwait, Nigeria, Saudi Arabia, South Africa, Turkey, United Arab Emirates, & Rest of MEA Competitive Landscape First Cash Financial Services Inc., EZCorp Inc, Cash America International Inc., Pawngo, UltraPawn, LLC, Gold & Silver Pawn Shop, American Jewelry and Loan, Dollar Financial Group Global Corporation, Browns Pawnbrokers, New Bond Street Pawnbrokers, Other Key Players Customization Scope Customization for segments, region/country-level will be provided. Moreover, additional customization can be done based on the requirements. Purchase Options We have three licenses to opt for: Single User License, Multi-User License (Up to 5 Users), Corporate Use License (Unlimited User and Printable PDF) -
- 1. Executive Summary
- 1.1. Definition
- 1.2. Taxonomy
- 1.3. Research Scope
- 1.4. Key Analysis
- 1.5. Key Findings by Major Segments
- 1.6. Top strategies by Major Players
- 2. Global Pawn Shops Overview
- 2.1. Pawn Shops Dynamics
- 2.1.1. Drivers
- 2.1.2. Opportunities
- 2.1.3. Restraints
- 2.1.4. Challenges
- 2.2. Macro-economic Factors
- 2.3. Regulatory Framework
- 2.4. Market Investment Feasibility Index
- 2.5. PEST Analysis
- 2.6. PORTER’S Five Force Analysis
- 2.7. Drivers & Restraints Impact Analysis
- 2.8. Industry Chain Analysis
- 2.9. Cost Structure Analysis
- 2.10. Marketing Strategy
- 2.11. Russia-Ukraine War Impact Analysis
- 2.12. Opportunity Map Analysis
- 2.13. Market Competition Scenario Analysis
- 2.14. Product Life Cycle Analysis
- 2.15. Opportunity Orbits
- 2.16. Manufacturer Intensity Map
- 2.17. Major Companies sales by Value & Volume
- 2.1. Pawn Shops Dynamics
- 3. Global Pawn Shops Analysis, Opportunity and Forecast, 2016-2032
- 3.1. Global Pawn Shops Analysis, 2016-2021
- 3.2. Global Pawn Shops Opportunity and Forecast, 2023-2032
- 3.3. Global Pawn Shops Analysis, Opportunity and Forecast, By Type, 2016-2032
- 3.3.1. Global Pawn Shops Analysis by Type: Introduction
- 3.3.2. Market Size Absolute $ Opportunity Analysis and Forecast, By Type, 2016-2032
- 3.3.3. Jewelry &Accessories
- 3.3.4. Electronic Tools
- 3.3.5. Collectibles
- 3.3.6. Musical Instruments
- 3.3.7. Other Types
- 3.4. Global Pawn Shops Analysis, Opportunity and Forecast, By Services, 2016-2032
- 3.4.1. Global Pawn Shops Analysis by Services: Introduction
- 3.4.2. Market Size Absolute $ Opportunity Analysis and Forecast, By Services, 2016-2032
- 3.4.3. Loan
- 3.4.4. Selling
- 3.4.5. Buying
- 3.5. Global Pawn Shops Analysis, Opportunity and Forecast, By End-User, 2016-2032
- 3.5.1. Global Pawn Shops Analysis by End-User: Introduction
- 3.5.2. Market Size Absolute $ Opportunity Analysis and Forecast, By End-User, 2016-2032
- 3.5.3. Generation X
- 3.5.4. Generation Y
- 3.5.5. Baby Boomers
- 4. North America Pawn Shops Analysis, Opportunity and Forecast, 2016-2032
- 4.1. North America Pawn Shops Analysis, 2016-2021
- 4.2. North America Pawn Shops Opportunity and Forecast, 2023-2032
- 4.3. North America Pawn Shops Analysis, Opportunity and Forecast, By Type, 2016-2032
- 4.3.1. North America Pawn Shops Analysis by Type: Introduction
- 4.3.2. Market Size Absolute $ Opportunity Analysis and Forecast, By Type, 2016-2032
- 4.3.3. Jewelry &Accessories
- 4.3.4. Electronic Tools
- 4.3.5. Collectibles
- 4.3.6. Musical Instruments
- 4.3.7. Other Types
- 4.4. North America Pawn Shops Analysis, Opportunity and Forecast, By Services, 2016-2032
- 4.4.1. North America Pawn Shops Analysis by Services: Introduction
- 4.4.2. Market Size Absolute $ Opportunity Analysis and Forecast, By Services, 2016-2032
- 4.4.3. Loan
- 4.4.4. Selling
- 4.4.5. Buying
- 4.5. North America Pawn Shops Analysis, Opportunity and Forecast, By End-User, 2016-2032
- 4.5.1. North America Pawn Shops Analysis by End-User: Introduction
- 4.5.2. Market Size Absolute $ Opportunity Analysis and Forecast, By End-User, 2016-2032
- 4.5.3. Generation X
- 4.5.4. Generation Y
- 4.5.5. Baby Boomers
- 4.6. North America Pawn Shops Analysis, Opportunity and Forecast, By Country , 2016-2032
- 4.6.1. North America Pawn Shops Analysis by Country : Introduction
- 4.6.2. Market Size Absolute $ Opportunity Analysis and Forecast, Country , 2016-2032
- 4.6.2.1. The US
- 4.6.2.2. Canada
- 4.6.2.3. Mexico
- 5. Western Europe Pawn Shops Analysis, Opportunity and Forecast, 2016-2032
- 5.1. Western Europe Pawn Shops Analysis, 2016-2021
- 5.2. Western Europe Pawn Shops Opportunity and Forecast, 2023-2032
- 5.3. Western Europe Pawn Shops Analysis, Opportunity and Forecast, By Type, 2016-2032
- 5.3.1. Western Europe Pawn Shops Analysis by Type: Introduction
- 5.3.2. Market Size Absolute $ Opportunity Analysis and Forecast, By Type, 2016-2032
- 5.3.3. Jewelry &Accessories
- 5.3.4. Electronic Tools
- 5.3.5. Collectibles
- 5.3.6. Musical Instruments
- 5.3.7. Other Types
- 5.4. Western Europe Pawn Shops Analysis, Opportunity and Forecast, By Services, 2016-2032
- 5.4.1. Western Europe Pawn Shops Analysis by Services: Introduction
- 5.4.2. Market Size Absolute $ Opportunity Analysis and Forecast, By Services, 2016-2032
- 5.4.3. Loan
- 5.4.4. Selling
- 5.4.5. Buying
- 5.5. Western Europe Pawn Shops Analysis, Opportunity and Forecast, By End-User, 2016-2032
- 5.5.1. Western Europe Pawn Shops Analysis by End-User: Introduction
- 5.5.2. Market Size Absolute $ Opportunity Analysis and Forecast, By End-User, 2016-2032
- 5.5.3. Generation X
- 5.5.4. Generation Y
- 5.5.5. Baby Boomers
- 5.6. Western Europe Pawn Shops Analysis, Opportunity and Forecast, By Country , 2016-2032
- 5.6.1. Western Europe Pawn Shops Analysis by Country : Introduction
- 5.6.2. Market Size Absolute $ Opportunity Analysis and Forecast, Country , 2016-2032
- 5.6.2.1. Germany
- 5.6.2.2. France
- 5.6.2.3. The UK
- 5.6.2.4. Spain
- 5.6.2.5. Italy
- 5.6.2.6. Portugal
- 5.6.2.7. Ireland
- 5.6.2.8. Austria
- 5.6.2.9. Switzerland
- 5.6.2.10. Benelux
- 5.6.2.11. Nordic
- 5.6.2.12. Rest of Western Europe
- 6. Eastern Europe Pawn Shops Analysis, Opportunity and Forecast, 2016-2032
- 6.1. Eastern Europe Pawn Shops Analysis, 2016-2021
- 6.2. Eastern Europe Pawn Shops Opportunity and Forecast, 2023-2032
- 6.3. Eastern Europe Pawn Shops Analysis, Opportunity and Forecast, By Type, 2016-2032
- 6.3.1. Eastern Europe Pawn Shops Analysis by Type: Introduction
- 6.3.2. Market Size Absolute $ Opportunity Analysis and Forecast, By Type, 2016-2032
- 6.3.3. Jewelry &Accessories
- 6.3.4. Electronic Tools
- 6.3.5. Collectibles
- 6.3.6. Musical Instruments
- 6.3.7. Other Types
- 6.4. Eastern Europe Pawn Shops Analysis, Opportunity and Forecast, By Services, 2016-2032
- 6.4.1. Eastern Europe Pawn Shops Analysis by Services: Introduction
- 6.4.2. Market Size Absolute $ Opportunity Analysis and Forecast, By Services, 2016-2032
- 6.4.3. Loan
- 6.4.4. Selling
- 6.4.5. Buying
- 6.5. Eastern Europe Pawn Shops Analysis, Opportunity and Forecast, By End-User, 2016-2032
- 6.5.1. Eastern Europe Pawn Shops Analysis by End-User: Introduction
- 6.5.2. Market Size Absolute $ Opportunity Analysis and Forecast, By End-User, 2016-2032
- 6.5.3. Generation X
- 6.5.4. Generation Y
- 6.5.5. Baby Boomers
- 6.6. Eastern Europe Pawn Shops Analysis, Opportunity and Forecast, By Country , 2016-2032
- 6.6.1. Eastern Europe Pawn Shops Analysis by Country : Introduction
- 6.6.2. Market Size Absolute $ Opportunity Analysis and Forecast, Country , 2016-2032
- 6.6.2.1. Russia
- 6.6.2.2. Poland
- 6.6.2.3. The Czech Republic
- 6.6.2.4. Greece
- 6.6.2.5. Rest of Eastern Europe
- 7. APAC Pawn Shops Analysis, Opportunity and Forecast, 2016-2032
- 7.1. APAC Pawn Shops Analysis, 2016-2021
- 7.2. APAC Pawn Shops Opportunity and Forecast, 2023-2032
- 7.3. APAC Pawn Shops Analysis, Opportunity and Forecast, By Type, 2016-2032
- 7.3.1. APAC Pawn Shops Analysis by Type: Introduction
- 7.3.2. Market Size Absolute $ Opportunity Analysis and Forecast, By Type, 2016-2032
- 7.3.3. Jewelry &Accessories
- 7.3.4. Electronic Tools
- 7.3.5. Collectibles
- 7.3.6. Musical Instruments
- 7.3.7. Other Types
- 7.4. APAC Pawn Shops Analysis, Opportunity and Forecast, By Services, 2016-2032
- 7.4.1. APAC Pawn Shops Analysis by Services: Introduction
- 7.4.2. Market Size Absolute $ Opportunity Analysis and Forecast, By Services, 2016-2032
- 7.4.3. Loan
- 7.4.4. Selling
- 7.4.5. Buying
- 7.5. APAC Pawn Shops Analysis, Opportunity and Forecast, By End-User, 2016-2032
- 7.5.1. APAC Pawn Shops Analysis by End-User: Introduction
- 7.5.2. Market Size Absolute $ Opportunity Analysis and Forecast, By End-User, 2016-2032
- 7.5.3. Generation X
- 7.5.4. Generation Y
- 7.5.5. Baby Boomers
- 7.6. APAC Pawn Shops Analysis, Opportunity and Forecast, By Country , 2016-2032
- 7.6.1. APAC Pawn Shops Analysis by Country : Introduction
- 7.6.2. Market Size Absolute $ Opportunity Analysis and Forecast, Country , 2016-2032
- 7.6.2.1. China
- 7.6.2.2. Japan
- 7.6.2.3. South Korea
- 7.6.2.4. India
- 7.6.2.5. Australia & New Zeland
- 7.6.2.6. Indonesia
- 7.6.2.7. Malaysia
- 7.6.2.8. Philippines
- 7.6.2.9. Singapore
- 7.6.2.10. Thailand
- 7.6.2.11. Vietnam
- 7.6.2.12. Rest of APAC
- 8. Latin America Pawn Shops Analysis, Opportunity and Forecast, 2016-2032
- 8.1. Latin America Pawn Shops Analysis, 2016-2021
- 8.2. Latin America Pawn Shops Opportunity and Forecast, 2023-2032
- 8.3. Latin America Pawn Shops Analysis, Opportunity and Forecast, By Type, 2016-2032
- 8.3.1. Latin America Pawn Shops Analysis by Type: Introduction
- 8.3.2. Market Size Absolute $ Opportunity Analysis and Forecast, By Type, 2016-2032
- 8.3.3. Jewelry &Accessories
- 8.3.4. Electronic Tools
- 8.3.5. Collectibles
- 8.3.6. Musical Instruments
- 8.3.7. Other Types
- 8.4. Latin America Pawn Shops Analysis, Opportunity and Forecast, By Services, 2016-2032
- 8.4.1. Latin America Pawn Shops Analysis by Services: Introduction
- 8.4.2. Market Size Absolute $ Opportunity Analysis and Forecast, By Services, 2016-2032
- 8.4.3. Loan
- 8.4.4. Selling
- 8.4.5. Buying
- 8.5. Latin America Pawn Shops Analysis, Opportunity and Forecast, By End-User, 2016-2032
- 8.5.1. Latin America Pawn Shops Analysis by End-User: Introduction
- 8.5.2. Market Size Absolute $ Opportunity Analysis and Forecast, By End-User, 2016-2032
- 8.5.3. Generation X
- 8.5.4. Generation Y
- 8.5.5. Baby Boomers
- 8.6. Latin America Pawn Shops Analysis, Opportunity and Forecast, By Country , 2016-2032
- 8.6.1. Latin America Pawn Shops Analysis by Country : Introduction
- 8.6.2. Market Size Absolute $ Opportunity Analysis and Forecast, Country , 2016-2032
- 8.6.2.1. Brazil
- 8.6.2.2. Colombia
- 8.6.2.3. Chile
- 8.6.2.4. Argentina
- 8.6.2.5. Costa Rica
- 8.6.2.6. Rest of Latin America
- 9. Middle East & Africa Pawn Shops Analysis, Opportunity and Forecast, 2016-2032
- 9.1. Middle East & Africa Pawn Shops Analysis, 2016-2021
- 9.2. Middle East & Africa Pawn Shops Opportunity and Forecast, 2023-2032
- 9.3. Middle East & Africa Pawn Shops Analysis, Opportunity and Forecast, By Type, 2016-2032
- 9.3.1. Middle East & Africa Pawn Shops Analysis by Type: Introduction
- 9.3.2. Market Size Absolute $ Opportunity Analysis and Forecast, By Type, 2016-2032
- 9.3.3. Jewelry &Accessories
- 9.3.4. Electronic Tools
- 9.3.5. Collectibles
- 9.3.6. Musical Instruments
- 9.3.7. Other Types
- 9.4. Middle East & Africa Pawn Shops Analysis, Opportunity and Forecast, By Services, 2016-2032
- 9.4.1. Middle East & Africa Pawn Shops Analysis by Services: Introduction
- 9.4.2. Market Size Absolute $ Opportunity Analysis and Forecast, By Services, 2016-2032
- 9.4.3. Loan
- 9.4.4. Selling
- 9.4.5. Buying
- 9.5. Middle East & Africa Pawn Shops Analysis, Opportunity and Forecast, By End-User, 2016-2032
- 9.5.1. Middle East & Africa Pawn Shops Analysis by End-User: Introduction
- 9.5.2. Market Size Absolute $ Opportunity Analysis and Forecast, By End-User, 2016-2032
- 9.5.3. Generation X
- 9.5.4. Generation Y
- 9.5.5. Baby Boomers
- 9.6. Middle East & Africa Pawn Shops Analysis, Opportunity and Forecast, By Country , 2016-2032
- 9.6.1. Middle East & Africa Pawn Shops Analysis by Country : Introduction
- 9.6.2. Market Size Absolute $ Opportunity Analysis and Forecast, Country , 2016-2032
- 9.6.2.1. Algeria
- 9.6.2.2. Egypt
- 9.6.2.3. Israel
- 9.6.2.4. Kuwait
- 9.6.2.5. Nigeria
- 9.6.2.6. Saudi Arabia
- 9.6.2.7. South Africa
- 9.6.2.8. Turkey
- 9.6.2.9. The UAE
- 9.6.2.10. Rest of MEA
- 10. Global Pawn Shops Analysis, Opportunity and Forecast, By Region , 2016-2032
- 10.1. Global Pawn Shops Analysis by Region : Introduction
- 10.2. Market Size Absolute $ Opportunity Analysis and Forecast, By Region , 2016-2032
- 10.2.1. North America
- 10.2.2. Western Europe
- 10.2.3. Eastern Europe
- 10.2.4. APAC
- 10.2.5. Latin America
- 10.2.6. Middle East & Africa
- 11. Global Pawn Shops Competitive Landscape, Market Share Analysis, and Company Profiles
- 11.1. Market Share Analysis
- 11.2. Company Profiles
- 11.3. First Cash Financial Services Inc.
- 11.3.1. Company Overview
- 11.3.2. Financial Highlights
- 11.3.3. Product Portfolio
- 11.3.4. SWOT Analysis
- 11.3.5. Key Strategies and Developments
- 11.4. EZCorp Inc
- 11.4.1. Company Overview
- 11.4.2. Financial Highlights
- 11.4.3. Product Portfolio
- 11.4.4. SWOT Analysis
- 11.4.5. Key Strategies and Developments
- 11.5. Cash America International Inc.
- 11.5.1. Company Overview
- 11.5.2. Financial Highlights
- 11.5.3. Product Portfolio
- 11.5.4. SWOT Analysis
- 11.5.5. Key Strategies and Developments
- 11.6. Pawngo
- 11.6.1. Company Overview
- 11.6.2. Financial Highlights
- 11.6.3. Product Portfolio
- 11.6.4. SWOT Analysis
- 11.6.5. Key Strategies and Developments
- 11.7. UltraPawn, LLC
- 11.7.1. Company Overview
- 11.7.2. Financial Highlights
- 11.7.3. Product Portfolio
- 11.7.4. SWOT Analysis
- 11.7.5. Key Strategies and Developments
- 11.8. Gold & Silver Pawn Shop
- 11.8.1. Company Overview
- 11.8.2. Financial Highlights
- 11.8.3. Product Portfolio
- 11.8.4. SWOT Analysis
- 11.8.5. Key Strategies and Developments
- 11.9. American Jewelry and Loan,
- 11.9.1. Company Overview
- 11.9.2. Financial Highlights
- 11.9.3. Product Portfolio
- 11.9.4. SWOT Analysis
- 11.9.5. Key Strategies and Developments
- 11.10. Dollar Financial Group Global Corporation
- 11.10.1. Company Overview
- 11.10.2. Financial Highlights
- 11.10.3. Product Portfolio
- 11.10.4. SWOT Analysis
- 11.10.5. Key Strategies and Developments
- 11.11. Browns Pawnbrokers,
- 11.11.1. Company Overview
- 11.11.2. Financial Highlights
- 11.11.3. Product Portfolio
- 11.11.4. SWOT Analysis
- 11.11.5. Key Strategies and Developments
- 11.12. New Bond Street Pawnbrokers.
- 11.12.1. Company Overview
- 11.12.2. Financial Highlights
- 11.12.3. Product Portfolio
- 11.12.4. SWOT Analysis
- 11.12.5. Key Strategies and Developments
- 11.13. Other key Players
- 11.13.1. Company Overview
- 11.13.2. Financial Highlights
- 11.13.3. Product Portfolio
- 11.13.4. SWOT Analysis
- 11.13.5. Key Strategies and Developments
- 12. Assumptions and Acronyms
- 13. Research Methodology
- 14. Contact
- List of Figures
- Figure 1: Global Pawn Shops Revenue (US$ Mn) Market Share by Type in 2022
- Figure 2: Global Pawn Shops Market Attractiveness Analysis by Type, 2016-2032
- Figure 3: Global Pawn Shops Revenue (US$ Mn) Market Share by Servicesin 2022
- Figure 4: Global Pawn Shops Market Attractiveness Analysis by Services, 2016-2032
- Figure 5: Global Pawn Shops Revenue (US$ Mn) Market Share by End-Userin 2022
- Figure 6: Global Pawn Shops Market Attractiveness Analysis by End-User, 2016-2032
- Figure 7: Global Pawn Shops Revenue (US$ Mn) Market Share by Region in 2022
- Figure 8: Global Pawn Shops Market Attractiveness Analysis by Region, 2016-2032
- Figure 9: Global Pawn Shops Market Revenue (US$ Mn) (2016-2032)
- Figure 10: Global Pawn Shops Market Revenue (US$ Mn) Comparison by Region (2016-2032)
- Figure 11: Global Pawn Shops Market Revenue (US$ Mn) Comparison by Type (2016-2032)
- Figure 12: Global Pawn Shops Market Revenue (US$ Mn) Comparison by Services (2016-2032)
- Figure 13: Global Pawn Shops Market Revenue (US$ Mn) Comparison by End-User (2016-2032)
- Figure 14: Global Pawn Shops Market Y-o-Y Growth Rate Comparison by Region (2016-2032)
- Figure 15: Global Pawn Shops Market Y-o-Y Growth Rate Comparison by Type (2016-2032)
- Figure 16: Global Pawn Shops Market Y-o-Y Growth Rate Comparison by Services (2016-2032)
- Figure 17: Global Pawn Shops Market Y-o-Y Growth Rate Comparison by End-User (2016-2032)
- Figure 18: Global Pawn Shops Market Share Comparison by Region (2016-2032)
- Figure 19: Global Pawn Shops Market Share Comparison by Type (2016-2032)
- Figure 20: Global Pawn Shops Market Share Comparison by Services (2016-2032)
- Figure 21: Global Pawn Shops Market Share Comparison by End-User (2016-2032)
- Figure 22: North America Pawn Shops Revenue (US$ Mn) Market Share by Typein 2022
- Figure 23: North America Pawn Shops Market Attractiveness Analysis by Type, 2016-2032
- Figure 24: North America Pawn Shops Revenue (US$ Mn) Market Share by Servicesin 2022
- Figure 25: North America Pawn Shops Market Attractiveness Analysis by Services, 2016-2032
- Figure 26: North America Pawn Shops Revenue (US$ Mn) Market Share by End-Userin 2022
- Figure 27: North America Pawn Shops Market Attractiveness Analysis by End-User, 2016-2032
- Figure 28: North America Pawn Shops Revenue (US$ Mn) Market Share by Country in 2022
- Figure 29: North America Pawn Shops Market Attractiveness Analysis by Country, 2016-2032
- Figure 30: North America Pawn Shops Market Revenue (US$ Mn) (2016-2032)
- Figure 31: North America Pawn Shops Market Revenue (US$ Mn) Comparison by Country (2016-2032)
- Figure 32: North America Pawn Shops Market Revenue (US$ Mn) Comparison by Type (2016-2032)
- Figure 33: North America Pawn Shops Market Revenue (US$ Mn) Comparison by Services (2016-2032)
- Figure 34: North America Pawn Shops Market Revenue (US$ Mn) Comparison by End-User (2016-2032)
- Figure 35: North America Pawn Shops Market Y-o-Y Growth Rate Comparison by Country (2016-2032)
- Figure 36: North America Pawn Shops Market Y-o-Y Growth Rate Comparison by Type (2016-2032)
- Figure 37: North America Pawn Shops Market Y-o-Y Growth Rate Comparison by Services (2016-2032)
- Figure 38: North America Pawn Shops Market Y-o-Y Growth Rate Comparison by End-User (2016-2032)
- Figure 39: North America Pawn Shops Market Share Comparison by Country (2016-2032)
- Figure 40: North America Pawn Shops Market Share Comparison by Type (2016-2032)
- Figure 41: North America Pawn Shops Market Share Comparison by Services (2016-2032)
- Figure 42: North America Pawn Shops Market Share Comparison by End-User (2016-2032)
- Figure 43: Western Europe Pawn Shops Revenue (US$ Mn) Market Share by Typein 2022
- Figure 44: Western Europe Pawn Shops Market Attractiveness Analysis by Type, 2016-2032
- Figure 45: Western Europe Pawn Shops Revenue (US$ Mn) Market Share by Servicesin 2022
- Figure 46: Western Europe Pawn Shops Market Attractiveness Analysis by Services, 2016-2032
- Figure 47: Western Europe Pawn Shops Revenue (US$ Mn) Market Share by End-Userin 2022
- Figure 48: Western Europe Pawn Shops Market Attractiveness Analysis by End-User, 2016-2032
- Figure 49: Western Europe Pawn Shops Revenue (US$ Mn) Market Share by Country in 2022
- Figure 50: Western Europe Pawn Shops Market Attractiveness Analysis by Country, 2016-2032
- Figure 51: Western Europe Pawn Shops Market Revenue (US$ Mn) (2016-2032)
- Figure 52: Western Europe Pawn Shops Market Revenue (US$ Mn) Comparison by Country (2016-2032)
- Figure 53: Western Europe Pawn Shops Market Revenue (US$ Mn) Comparison by Type (2016-2032)
- Figure 54: Western Europe Pawn Shops Market Revenue (US$ Mn) Comparison by Services (2016-2032)
- Figure 55: Western Europe Pawn Shops Market Revenue (US$ Mn) Comparison by End-User (2016-2032)
- Figure 56: Western Europe Pawn Shops Market Y-o-Y Growth Rate Comparison by Country (2016-2032)
- Figure 57: Western Europe Pawn Shops Market Y-o-Y Growth Rate Comparison by Type (2016-2032)
- Figure 58: Western Europe Pawn Shops Market Y-o-Y Growth Rate Comparison by Services (2016-2032)
- Figure 59: Western Europe Pawn Shops Market Y-o-Y Growth Rate Comparison by End-User (2016-2032)
- Figure 60: Western Europe Pawn Shops Market Share Comparison by Country (2016-2032)
- Figure 61: Western Europe Pawn Shops Market Share Comparison by Type (2016-2032)
- Figure 62: Western Europe Pawn Shops Market Share Comparison by Services (2016-2032)
- Figure 63: Western Europe Pawn Shops Market Share Comparison by End-User (2016-2032)
- Figure 64: Eastern Europe Pawn Shops Revenue (US$ Mn) Market Share by Typein 2022
- Figure 65: Eastern Europe Pawn Shops Market Attractiveness Analysis by Type, 2016-2032
- Figure 66: Eastern Europe Pawn Shops Revenue (US$ Mn) Market Share by Servicesin 2022
- Figure 67: Eastern Europe Pawn Shops Market Attractiveness Analysis by Services, 2016-2032
- Figure 68: Eastern Europe Pawn Shops Revenue (US$ Mn) Market Share by End-Userin 2022
- Figure 69: Eastern Europe Pawn Shops Market Attractiveness Analysis by End-User, 2016-2032
- Figure 70: Eastern Europe Pawn Shops Revenue (US$ Mn) Market Share by Country in 2022
- Figure 71: Eastern Europe Pawn Shops Market Attractiveness Analysis by Country, 2016-2032
- Figure 72: Eastern Europe Pawn Shops Market Revenue (US$ Mn) (2016-2032)
- Figure 73: Eastern Europe Pawn Shops Market Revenue (US$ Mn) Comparison by Country (2016-2032)
- Figure 74: Eastern Europe Pawn Shops Market Revenue (US$ Mn) Comparison by Type (2016-2032)
- Figure 75: Eastern Europe Pawn Shops Market Revenue (US$ Mn) Comparison by Services (2016-2032)
- Figure 76: Eastern Europe Pawn Shops Market Revenue (US$ Mn) Comparison by End-User (2016-2032)
- Figure 77: Eastern Europe Pawn Shops Market Y-o-Y Growth Rate Comparison by Country (2016-2032)
- Figure 78: Eastern Europe Pawn Shops Market Y-o-Y Growth Rate Comparison by Type (2016-2032)
- Figure 79: Eastern Europe Pawn Shops Market Y-o-Y Growth Rate Comparison by Services (2016-2032)
- Figure 80: Eastern Europe Pawn Shops Market Y-o-Y Growth Rate Comparison by End-User (2016-2032)
- Figure 81: Eastern Europe Pawn Shops Market Share Comparison by Country (2016-2032)
- Figure 82: Eastern Europe Pawn Shops Market Share Comparison by Type (2016-2032)
- Figure 83: Eastern Europe Pawn Shops Market Share Comparison by Services (2016-2032)
- Figure 84: Eastern Europe Pawn Shops Market Share Comparison by End-User (2016-2032)
- Figure 85: APAC Pawn Shops Revenue (US$ Mn) Market Share by Typein 2022
- Figure 86: APAC Pawn Shops Market Attractiveness Analysis by Type, 2016-2032
- Figure 87: APAC Pawn Shops Revenue (US$ Mn) Market Share by Servicesin 2022
- Figure 88: APAC Pawn Shops Market Attractiveness Analysis by Services, 2016-2032
- Figure 89: APAC Pawn Shops Revenue (US$ Mn) Market Share by End-Userin 2022
- Figure 90: APAC Pawn Shops Market Attractiveness Analysis by End-User, 2016-2032
- Figure 91: APAC Pawn Shops Revenue (US$ Mn) Market Share by Country in 2022
- Figure 92: APAC Pawn Shops Market Attractiveness Analysis by Country, 2016-2032
- Figure 93: APAC Pawn Shops Market Revenue (US$ Mn) (2016-2032)
- Figure 94: APAC Pawn Shops Market Revenue (US$ Mn) Comparison by Country (2016-2032)
- Figure 95: APAC Pawn Shops Market Revenue (US$ Mn) Comparison by Type (2016-2032)
- Figure 96: APAC Pawn Shops Market Revenue (US$ Mn) Comparison by Services (2016-2032)
- Figure 97: APAC Pawn Shops Market Revenue (US$ Mn) Comparison by End-User (2016-2032)
- Figure 98: APAC Pawn Shops Market Y-o-Y Growth Rate Comparison by Country (2016-2032)
- Figure 99: APAC Pawn Shops Market Y-o-Y Growth Rate Comparison by Type (2016-2032)
- Figure 100: APAC Pawn Shops Market Y-o-Y Growth Rate Comparison by Services (2016-2032)
- Figure 101: APAC Pawn Shops Market Y-o-Y Growth Rate Comparison by End-User (2016-2032)
- Figure 102: APAC Pawn Shops Market Share Comparison by Country (2016-2032)
- Figure 103: APAC Pawn Shops Market Share Comparison by Type (2016-2032)
- Figure 104: APAC Pawn Shops Market Share Comparison by Services (2016-2032)
- Figure 105: APAC Pawn Shops Market Share Comparison by End-User (2016-2032)
- Figure 106: Latin America Pawn Shops Revenue (US$ Mn) Market Share by Typein 2022
- Figure 107: Latin America Pawn Shops Market Attractiveness Analysis by Type, 2016-2032
- Figure 108: Latin America Pawn Shops Revenue (US$ Mn) Market Share by Servicesin 2022
- Figure 109: Latin America Pawn Shops Market Attractiveness Analysis by Services, 2016-2032
- Figure 110: Latin America Pawn Shops Revenue (US$ Mn) Market Share by End-Userin 2022
- Figure 111: Latin America Pawn Shops Market Attractiveness Analysis by End-User, 2016-2032
- Figure 112: Latin America Pawn Shops Revenue (US$ Mn) Market Share by Country in 2022
- Figure 113: Latin America Pawn Shops Market Attractiveness Analysis by Country, 2016-2032
- Figure 114: Latin America Pawn Shops Market Revenue (US$ Mn) (2016-2032)
- Figure 115: Latin America Pawn Shops Market Revenue (US$ Mn) Comparison by Country (2016-2032)
- Figure 116: Latin America Pawn Shops Market Revenue (US$ Mn) Comparison by Type (2016-2032)
- Figure 117: Latin America Pawn Shops Market Revenue (US$ Mn) Comparison by Services (2016-2032)
- Figure 118: Latin America Pawn Shops Market Revenue (US$ Mn) Comparison by End-User (2016-2032)
- Figure 119: Latin America Pawn Shops Market Y-o-Y Growth Rate Comparison by Country (2016-2032)
- Figure 120: Latin America Pawn Shops Market Y-o-Y Growth Rate Comparison by Type (2016-2032)
- Figure 121: Latin America Pawn Shops Market Y-o-Y Growth Rate Comparison by Services (2016-2032)
- Figure 122: Latin America Pawn Shops Market Y-o-Y Growth Rate Comparison by End-User (2016-2032)
- Figure 123: Latin America Pawn Shops Market Share Comparison by Country (2016-2032)
- Figure 124: Latin America Pawn Shops Market Share Comparison by Type (2016-2032)
- Figure 125: Latin America Pawn Shops Market Share Comparison by Services (2016-2032)
- Figure 126: Latin America Pawn Shops Market Share Comparison by End-User (2016-2032)
- Figure 127: Middle East & Africa Pawn Shops Revenue (US$ Mn) Market Share by Typein 2022
- Figure 128: Middle East & Africa Pawn Shops Market Attractiveness Analysis by Type, 2016-2032
- Figure 129: Middle East & Africa Pawn Shops Revenue (US$ Mn) Market Share by Servicesin 2022
- Figure 130: Middle East & Africa Pawn Shops Market Attractiveness Analysis by Services, 2016-2032
- Figure 131: Middle East & Africa Pawn Shops Revenue (US$ Mn) Market Share by End-Userin 2022
- Figure 132: Middle East & Africa Pawn Shops Market Attractiveness Analysis by End-User, 2016-2032
- Figure 133: Middle East & Africa Pawn Shops Revenue (US$ Mn) Market Share by Country in 2022
- Figure 134: Middle East & Africa Pawn Shops Market Attractiveness Analysis by Country, 2016-2032
- Figure 135: Middle East & Africa Pawn Shops Market Revenue (US$ Mn) (2016-2032)
- Figure 136: Middle East & Africa Pawn Shops Market Revenue (US$ Mn) Comparison by Country (2016-2032)
- Figure 137: Middle East & Africa Pawn Shops Market Revenue (US$ Mn) Comparison by Type (2016-2032)
- Figure 138: Middle East & Africa Pawn Shops Market Revenue (US$ Mn) Comparison by Services (2016-2032)
- Figure 139: Middle East & Africa Pawn Shops Market Revenue (US$ Mn) Comparison by End-User (2016-2032)
- Figure 140: Middle East & Africa Pawn Shops Market Y-o-Y Growth Rate Comparison by Country (2016-2032)
- Figure 141: Middle East & Africa Pawn Shops Market Y-o-Y Growth Rate Comparison by Type (2016-2032)
- Figure 142: Middle East & Africa Pawn Shops Market Y-o-Y Growth Rate Comparison by Services (2016-2032)
- Figure 143: Middle East & Africa Pawn Shops Market Y-o-Y Growth Rate Comparison by End-User (2016-2032)
- Figure 144: Middle East & Africa Pawn Shops Market Share Comparison by Country (2016-2032)
- Figure 145: Middle East & Africa Pawn Shops Market Share Comparison by Type (2016-2032)
- Figure 146: Middle East & Africa Pawn Shops Market Share Comparison by Services (2016-2032)
- Figure 147: Middle East & Africa Pawn Shops Market Share Comparison by End-User (2016-2032)
List of Tables
- Table 1: Global Pawn Shops Market Comparison by Type (2016-2032)
- Table 2: Global Pawn Shops Market Comparison by Services (2016-2032)
- Table 3: Global Pawn Shops Market Comparison by End-User (2016-2032)
- Table 4: Global Pawn Shops Revenue (US$ Mn) Comparison by Region (2016-2032)
- Table 5: Global Pawn Shops Market Revenue (US$ Mn) (2016-2032)
- Table 6: Global Pawn Shops Market Revenue (US$ Mn) Comparison by Region (2016-2032)
- Table 7: Global Pawn Shops Market Revenue (US$ Mn) Comparison by Type (2016-2032)
- Table 8: Global Pawn Shops Market Revenue (US$ Mn) Comparison by Services (2016-2032)
- Table 9: Global Pawn Shops Market Revenue (US$ Mn) Comparison by End-User (2016-2032)
- Table 10: Global Pawn Shops Market Y-o-Y Growth Rate Comparison by Region (2016-2032)
- Table 11: Global Pawn Shops Market Y-o-Y Growth Rate Comparison by Type (2016-2032)
- Table 12: Global Pawn Shops Market Y-o-Y Growth Rate Comparison by Services (2016-2032)
- Table 13: Global Pawn Shops Market Y-o-Y Growth Rate Comparison by End-User (2016-2032)
- Table 14: Global Pawn Shops Market Share Comparison by Region (2016-2032)
- Table 15: Global Pawn Shops Market Share Comparison by Type (2016-2032)
- Table 16: Global Pawn Shops Market Share Comparison by Services (2016-2032)
- Table 17: Global Pawn Shops Market Share Comparison by End-User (2016-2032)
- Table 18: North America Pawn Shops Market Comparison by Services (2016-2032)
- Table 19: North America Pawn Shops Market Comparison by End-User (2016-2032)
- Table 20: North America Pawn Shops Revenue (US$ Mn) Comparison by Country (2016-2032)
- Table 21: North America Pawn Shops Market Revenue (US$ Mn) (2016-2032)
- Table 22: North America Pawn Shops Market Revenue (US$ Mn) Comparison by Country (2016-2032)
- Table 23: North America Pawn Shops Market Revenue (US$ Mn) Comparison by Type (2016-2032)
- Table 24: North America Pawn Shops Market Revenue (US$ Mn) Comparison by Services (2016-2032)
- Table 25: North America Pawn Shops Market Revenue (US$ Mn) Comparison by End-User (2016-2032)
- Table 26: North America Pawn Shops Market Y-o-Y Growth Rate Comparison by Country (2016-2032)
- Table 27: North America Pawn Shops Market Y-o-Y Growth Rate Comparison by Type (2016-2032)
- Table 28: North America Pawn Shops Market Y-o-Y Growth Rate Comparison by Services (2016-2032)
- Table 29: North America Pawn Shops Market Y-o-Y Growth Rate Comparison by End-User (2016-2032)
- Table 30: North America Pawn Shops Market Share Comparison by Country (2016-2032)
- Table 31: North America Pawn Shops Market Share Comparison by Type (2016-2032)
- Table 32: North America Pawn Shops Market Share Comparison by Services (2016-2032)
- Table 33: North America Pawn Shops Market Share Comparison by End-User (2016-2032)
- Table 34: Western Europe Pawn Shops Market Comparison by Type (2016-2032)
- Table 35: Western Europe Pawn Shops Market Comparison by Services (2016-2032)
- Table 36: Western Europe Pawn Shops Market Comparison by End-User (2016-2032)
- Table 37: Western Europe Pawn Shops Revenue (US$ Mn) Comparison by Country (2016-2032)
- Table 38: Western Europe Pawn Shops Market Revenue (US$ Mn) (2016-2032)
- Table 39: Western Europe Pawn Shops Market Revenue (US$ Mn) Comparison by Country (2016-2032)
- Table 40: Western Europe Pawn Shops Market Revenue (US$ Mn) Comparison by Type (2016-2032)
- Table 41: Western Europe Pawn Shops Market Revenue (US$ Mn) Comparison by Services (2016-2032)
- Table 42: Western Europe Pawn Shops Market Revenue (US$ Mn) Comparison by End-User (2016-2032)
- Table 43: Western Europe Pawn Shops Market Y-o-Y Growth Rate Comparison by Country (2016-2032)
- Table 44: Western Europe Pawn Shops Market Y-o-Y Growth Rate Comparison by Type (2016-2032)
- Table 45: Western Europe Pawn Shops Market Y-o-Y Growth Rate Comparison by Services (2016-2032)
- Table 46: Western Europe Pawn Shops Market Y-o-Y Growth Rate Comparison by End-User (2016-2032)
- Table 47: Western Europe Pawn Shops Market Share Comparison by Country (2016-2032)
- Table 48: Western Europe Pawn Shops Market Share Comparison by Type (2016-2032)
- Table 49: Western Europe Pawn Shops Market Share Comparison by Services (2016-2032)
- Table 50: Western Europe Pawn Shops Market Share Comparison by End-User (2016-2032)
- Table 51: Eastern Europe Pawn Shops Market Comparison by Type (2016-2032)
- Table 52: Eastern Europe Pawn Shops Market Comparison by Services (2016-2032)
- Table 53: Eastern Europe Pawn Shops Market Comparison by End-User (2016-2032)
- Table 54: Eastern Europe Pawn Shops Revenue (US$ Mn) Comparison by Country (2016-2032)
- Table 55: Eastern Europe Pawn Shops Market Revenue (US$ Mn) (2016-2032)
- Table 56: Eastern Europe Pawn Shops Market Revenue (US$ Mn) Comparison by Country (2016-2032)
- Table 57: Eastern Europe Pawn Shops Market Revenue (US$ Mn) Comparison by Type (2016-2032)
- Table 58: Eastern Europe Pawn Shops Market Revenue (US$ Mn) Comparison by Services (2016-2032)
- Table 59: Eastern Europe Pawn Shops Market Revenue (US$ Mn) Comparison by End-User (2016-2032)
- Table 60: Eastern Europe Pawn Shops Market Y-o-Y Growth Rate Comparison by Country (2016-2032)
- Table 61: Eastern Europe Pawn Shops Market Y-o-Y Growth Rate Comparison by Type (2016-2032)
- Table 62: Eastern Europe Pawn Shops Market Y-o-Y Growth Rate Comparison by Services (2016-2032)
- Table 63: Eastern Europe Pawn Shops Market Y-o-Y Growth Rate Comparison by End-User (2016-2032)
- Table 64: Eastern Europe Pawn Shops Market Share Comparison by Country (2016-2032)
- Table 65: Eastern Europe Pawn Shops Market Share Comparison by Type (2016-2032)
- Table 66: Eastern Europe Pawn Shops Market Share Comparison by Services (2016-2032)
- Table 67: Eastern Europe Pawn Shops Market Share Comparison by End-User (2016-2032)
- Table 68: APAC Pawn Shops Market Comparison by Type (2016-2032)
- Table 69: APAC Pawn Shops Market Comparison by Services (2016-2032)
- Table 70: APAC Pawn Shops Market Comparison by End-User (2016-2032)
- Table 71: APAC Pawn Shops Revenue (US$ Mn) Comparison by Country (2016-2032)
- Table 72: APAC Pawn Shops Market Revenue (US$ Mn) (2016-2032)
- Table 73: APAC Pawn Shops Market Revenue (US$ Mn) Comparison by Country (2016-2032)
- Table 74: APAC Pawn Shops Market Revenue (US$ Mn) Comparison by Type (2016-2032)
- Table 75: APAC Pawn Shops Market Revenue (US$ Mn) Comparison by Services (2016-2032)
- Table 76: APAC Pawn Shops Market Revenue (US$ Mn) Comparison by End-User (2016-2032)
- Table 77: APAC Pawn Shops Market Y-o-Y Growth Rate Comparison by Country (2016-2032)
- Table 78: APAC Pawn Shops Market Y-o-Y Growth Rate Comparison by Type (2016-2032)
- Table 79: APAC Pawn Shops Market Y-o-Y Growth Rate Comparison by Services (2016-2032)
- Table 80: APAC Pawn Shops Market Y-o-Y Growth Rate Comparison by End-User (2016-2032)
- Table 81: APAC Pawn Shops Market Share Comparison by Country (2016-2032)
- Table 82: APAC Pawn Shops Market Share Comparison by Type (2016-2032)
- Table 83: APAC Pawn Shops Market Share Comparison by Services (2016-2032)
- Table 84: APAC Pawn Shops Market Share Comparison by End-User (2016-2032)
- Table 85: Latin America Pawn Shops Market Comparison by Type (2016-2032)
- Table 86: Latin America Pawn Shops Market Comparison by Services (2016-2032)
- Table 87: Latin America Pawn Shops Market Comparison by End-User (2016-2032)
- Table 88: Latin America Pawn Shops Revenue (US$ Mn) Comparison by Country (2016-2032)
- Table 89: Latin America Pawn Shops Market Revenue (US$ Mn) (2016-2032)
- Table 90: Latin America Pawn Shops Market Revenue (US$ Mn) Comparison by Country (2016-2032)
- Table 91: Latin America Pawn Shops Market Revenue (US$ Mn) Comparison by Type (2016-2032)
- Table 92: Latin America Pawn Shops Market Revenue (US$ Mn) Comparison by Services (2016-2032)
- Table 93: Latin America Pawn Shops Market Revenue (US$ Mn) Comparison by End-User (2016-2032)
- Table 94: Latin America Pawn Shops Market Y-o-Y Growth Rate Comparison by Country (2016-2032)
- Table 95: Latin America Pawn Shops Market Y-o-Y Growth Rate Comparison by Type (2016-2032)
- Table 96: Latin America Pawn Shops Market Y-o-Y Growth Rate Comparison by Services (2016-2032)
- Table 97: Latin America Pawn Shops Market Y-o-Y Growth Rate Comparison by End-User (2016-2032)
- Table 98: Latin America Pawn Shops Market Share Comparison by Country (2016-2032)
- Table 99: Latin America Pawn Shops Market Share Comparison by Type (2016-2032)
- Table 100: Latin America Pawn Shops Market Share Comparison by Services (2016-2032)
- Table 101: Latin America Pawn Shops Market Share Comparison by End-User (2016-2032)
- Table 102: Middle East & Africa Pawn Shops Market Comparison by Type (2016-2032)
- Table 103: Middle East & Africa Pawn Shops Market Comparison by Services (2016-2032)
- Table 104: Middle East & Africa Pawn Shops Market Comparison by End-User (2016-2032)
- Table 105: Middle East & Africa Pawn Shops Revenue (US$ Mn) Comparison by Country (2016-2032)
- Table 106: Middle East & Africa Pawn Shops Market Revenue (US$ Mn) (2016-2032)
- Table 107: Middle East & Africa Pawn Shops Market Revenue (US$ Mn) Comparison by Country (2016-2032)
- Table 108: Middle East & Africa Pawn Shops Market Revenue (US$ Mn) Comparison by Type (2016-2032)
- Table 109: Middle East & Africa Pawn Shops Market Revenue (US$ Mn) Comparison by Services (2016-2032)
- Table 110: Middle East & Africa Pawn Shops Market Revenue (US$ Mn) Comparison by End-User (2016-2032)
- Table 111: Middle East & Africa Pawn Shops Market Y-o-Y Growth Rate Comparison by Country (2016-2032)
- Table 112: Middle East & Africa Pawn Shops Market Y-o-Y Growth Rate Comparison by Type (2016-2032)
- Table 113: Middle East & Africa Pawn Shops Market Y-o-Y Growth Rate Comparison by Services (2016-2032)
- Table 114: Middle East & Africa Pawn Shops Market Y-o-Y Growth Rate Comparison by End-User (2016-2032)
- Table 115: Middle East & Africa Pawn Shops Market Share Comparison by Country (2016-2032)
- Table 116: Middle East & Africa Pawn Shops Market Share Comparison by Type (2016-2032)
- Table 117: Middle East & Africa Pawn Shops Market Share Comparison by Services (2016-2032)
- Table 118: Middle East & Africa Pawn Shops Market Share Comparison by End-User (2016-2032)
- 1. Executive Summary
-
Our Clients


View Our Licence Options
