
PAP and Paracetamol Market Forecast, Trend Analysis and Competition Tracking - Global Industry Insights 2015 to 2031
-
27860
-
May 2023
-
180
-


-
This report was compiled by Trishita Deb Trishita Deb is an experienced market research and consulting professional with over 7 years of expertise across healthcare, consumer goods, and materials, contributing to over 400 healthcare-related reports. Correspondence Team Lead- Healthcare Linkedin | Detailed Market research Methodology Our methodology involves a mix of primary research, including interviews with leading mental health experts, and secondary research from reputable medical journals and databases. View Detailed Methodology Page
-
Quick Navigation
- Global PAP and Paracetamol Market Revenue Outlook:
- Paracetamol Brand Names In Countries
- Leading Paracetamol Manufacturers Production Capacity (MT), 2020
- Factors Having Positive Effect On The Market
- Restraints for Growth of the Global PAP and Paracetamol Market
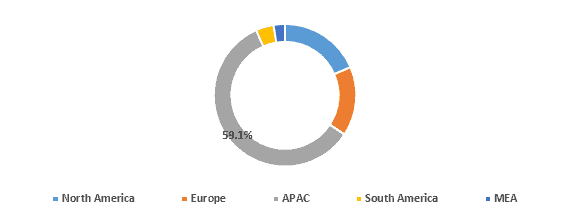
- Regional Analysis for PAP and Paracetamol Market
- Leading Paracetamol Players Market Share (%), 2021
- Competitive Landscape
- Report Scope
- Key Regions Covered
- Key Segments Covered for Global PAP and Paracetamol Market
Global PAP and Paracetamol Market Revenue Outlook:
The global PAP and Paracetamol Market is valued at US$ 1,617.6 Mn in 2021 and is projected to register а САGR of 2.5% by 2031.
Nonetheless, various industry players in the global PAP and Paracetamol Market are now increasing their focus on establishing successful collaborations, acquisitions, and joint venture activities to enhance their respective customer bases.
These players are also growing their supply capabilities to meet customer requirements on a local and global scale. This factor, paired with promising industrialization prospects in developing economies of the Asia-Pacific region, such as China, India, Taiwan, Indonesia, etc., are expected to create massive business opportunities for key players over the forecast period.
Paracetamol & p-Aminophenol (PAP) is widely used as an analgesics drug that acts as a pain reliever and a fever reducer. Additionally, it is used to treat many conditions such as headache, muscle aches, arthritis, colds, toothaches, backache, and fevers.
It relieves pain in mild arthritis but does not affect the underlying inflammation and swelling of the joint. Paracetamol & p-Aminophenol (PAP) are widely used Active Pharmaceutical Ingredients (API), which are commonly referred to as "Drug substance" or "Bulk pharmaceutical chemical". The active ingredient is the substance that is biologically active in a pharmaceutical drug.
Active pharmaceutical ingredients of good quality are core to manufacturing effective and safe essential drugs. Initially, only a few large manufacturers of finished pharmaceutical products had their active pharmaceutical ingredients manufacturing plants. Many manufacturers used to buy the active pharmaceutical ingredients from the exposed market.
Some drugs may contain more than one active pharmaceutical ingredient. All medicine includes two main components, active pharmaceutical ingredient (API), which is the main component that shows the therapeutic effect, and excipients which helps in the delivery of medication.
Excipients are chemically inactive substances such as mineral oil and act as vehicles for conveying active ingredients to the target site. Active pharmaceutical ingredients (API) play an important role in diseases prevention and treatment. For any disease, treatment is chosen based on the active ingredient used in it.
Paracetamol Brand Names In Countries
Brand name Countries Acamol Israel Ace + Bangladesh Acet United States Acetalgin Switzerland Apiretal Flas Spain, Portugal Atamel Venezuela, Haiti Benuron Austria, Germany, Portugal, Switzerland Biogesic Myanmar, Philippines, Indonesia Biogesic-Kiddielets Philippines, Myanmar Cemol Thailand Cetamol Nepal Coldex Israel Coldrex Romania, Croatia, Slovenia Co-Tipol Ireland (with Codeine Phosphate Hemihydrate) Cotibin Chile Crocin India Dolo India Dolyc Algeria Duiyixian anjifen pian China Endopain Hong Kong Enelfa Germany Europain Hong Kong Milidon Malaysia Minoset Turkey Momentum Austria Napa Bangladesh NapaDol Bangladesh (Paracetamol + Tramadol) Rubophen Hungary Sara Thailand Scanol Taiwan Sinpro N Germany Tachipirin Venezuela Tachipirina Italy Tafirol Argentina, Mexico Tapsin Chile Uphamol Malaysia Vermidon Turkey Vitamol Thailand Xumadol Spain (Italfarmaco) Zolben Switzerland, Uruguay, Chile. Termalgin Spain (Novartis) Tempra Mexico, Philippines, Indonesia, Venezuela Tipol Ireland Perfalgan Germany, Norway, Spain, South Africa (Bristol-Myers Squibb), Switzerland Pinex Denmark, Iceland, Norway, Finland Piretanyl Chile, Israel, Netherlands, Turkey Reliv Sweden Revanin Jordan To learn more about this report, request for Sample Report
Leading Paracetamol Manufacturers Production Capacity (MT), 2020
Sr. No Company Capacity (MT) 1 Granules India Ltd 22000 2 Sri Krishna Pharmaceuticals 12000 3 Gujarat Farmson Pharmaceuticals 25000 4 Meghmani LLP 7500 5 Bharat Chemicals 4000 6 Para Products Pvt Ltd XXXX 7 Farmson Pharmaceutical Gujarat Pvt. Ltd. XXXX 8 Anqiu Lu'an Pharmaceutical Co., Ltd. XXXX 9 Hebei Jiheng Pharmaceutical Co., Ltd. XXXX 10 ABHILASH CHEMICALS & PHARMACEUTICALS PVT. LTD. XXXX To learn more about this report, request for Sample Report
Factors Having Positive Effect On The Market
The rising prevalence of headaches, flu, and the increasing demand for pain management drugs fuel the demand. PAP and Paracetamol are widely used to treat mild to moderate pains, including headaches, menstrual periods, toothaches, backaches, osteoarthritis, or cold/flu aches and pains. Furthermore, it is an effective antipyretic used to reduce fever. The growing burden of the indicative conditions and OTC use of the products drive the market's growth.
With an increase in the number of FDA approvals for new molecular entities, large-scale manufacturers are now focusing on active pharmaceutical ingredient production; most of the major generic drug manufacturing companies have their API manufacturing facility, a trend witnessed in the global PAP and Paracetamol market.
Restraints for Growth of the Global PAP and Paracetamol Market
Strict rules and regulations set by various drug administrative bodies, inappropriate drug cost control policies across multiple nations are the restraints that hampers the growth of the PAP and Paracetamol market
Regional Analysis for PAP and Paracetamol Market
Currently, the market in Asia Pacific regions dominates the active pharmaceutical ingredient markets in terms of revenue. The region is also projected to have the fastest-growing market, and the increasing acceptance and penetration are enhancing the biopharmaceuticals drug market in both developed and developing economies.
India produces approximately 5,600 metric tons of Paracetamol every month. The domestic requirement is around 200 metric tons, and the rest of Paracetamol is exported to countries such as Italy, Germany, the UK, the US, Spain, and Canada. This is expected to fuel the revenue growth of the Asia-Pacific PAP and Paracetamol Market.
Leading Paracetamol Players Market Share (%), 2021
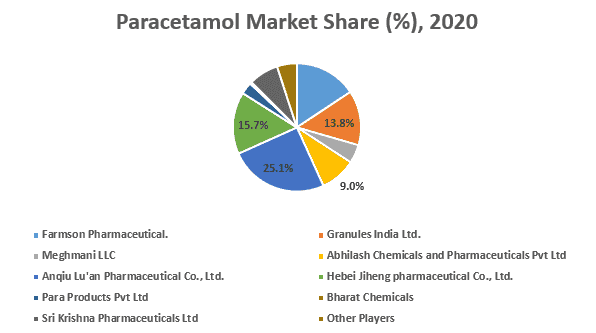
Competitive Landscape
The PAP and Paracetamol Market landscape appears highly consolidated, with a significant chunk dominated by the players.
- Granules India Ltd
- Sri Krishna Pharmaceuticals
- Gujarat Farmson Pharmaceuticals
- Meghmani LLP
- Bharat Chemicals
- Para Products Pvt Ltd
- Farmson Pharmaceutical Gujarat Pvt. Ltd.
- Anqiu Lu'an Pharmaceutical Co., Ltd.
- Hebei Jiheng Pharmaceutical Co., Ltd.
- ABHILASH CHEMICALS & PHARMACEUTICALS PVT. LTD.
- Other Key Players
Report Scope
- Forecast Period: 2022-2031
- Actual Year: 2021
- Historical Data Available for: 2015-2020
Key Regions Covered
- North America
- Europe
- Asia Pacific
- Latin America
- Middle East & Africa
Key Segments Covered for Global PAP and Paracetamol Market
Global PAP and Paracetamol Market Segmented by Form
- Powder
- Granules
Global PAP and Paracetamol Market Segmented by Application
- Tablet Drug
- Granules Drug
- Oral Solution
Attribute Report Details Market Size Ask For Market Size Growth Rate Ask For Growth Rate Key Companies Ask For Companies Report Coverage Revenue analysis, Competitive landscape, Key company analysis, Market Trends, Key segments, Distribution Channel, Market Dynamics, COVID-19 Impact Analysis and more… Historical Data Period 2015-2020 Base Year 2022 Forecast Period 2022-2031 Region Scope North America, Europe, Asia-Pacific, South America, Middle East & Africa Country Scope United States, Canada and Mexico, Germany, France, UK, Russia and Italy, China, Japan, Korea, India and Southeast Asia, Brazil, Argentina, Colombia etc.Saudi Arabia, UAE, Egypt, Nigeria and South Africa Revenue in US$ Mn To learn more about this report, request for Sample Report
-
- Chapter 1 Global PAP and Paracetamol Market Outlook
- 1.1 Introduction
- 1.2 Segmentation of PAP and Paracetamol Market Based On Form & Application, and Region
- 1.3 Drivers
- 1.4 Restraints
- 1.5 Opportunities
- 1.6 Trends
- 1.7 Macro-economic Factors
- 1.8 Regulatory Framework
- 1.9 Global PAP and Paracetamol Market Pricing Analysis by Region, 2021
- 1.10 Opportunity Map Analysis
- 1.10.1 Optimistic Scenario
- 1.10.2 Likely Scenario
- 1.10.3 Conservative Scenario
- 1.11 Opportunity Orbits
- 1.12 Market Investment Feasibility Index
- 1.13 PEST Analysis
- 1.14 PORTER’S Five Force Analysis
- 1.15 Drivers & Restraints Impact Analysis
- 1.16 Marketing Strategy
- 1.17 Product Life Cycle Analysis
- 1.18 Value Chain Analysis
- 1.19 Cost Structure Analysis
- 1.20 Regional Market Share and BPS Analysis in PAP and Paracetamol Market
- 1.21 COVID-19 Impact Analysis
- Chapter 2 Global PAP and Paracetamol Market Overview
- 2.1 Global Market Value & Volume Comparison by Form (2015-2031)
- 2.1.1 Global Market Value & Volume Market Share by Form in 2021
- 2.1.2 Global Attractiveness Analysis by Form, 2015–2022
- 2.2 Global Market Value & Volume Comparison by Application(2015-2031)
- 2.2.1 Global Market Value & Volume Market Share by Applicationin 2021
- 2.2.2 Global Attractiveness Analysis by Application, 2015–2022
- 2.3 Global Outlook by Region
- 2.3.1 Global Market Value & Volume Comparison by Region (2015-2031)
- 2.3.2 Global Market Value & Volume Market Share by Region in 2021
- 2.3.3 Global Attractiveness Analysis by Region, 2015–2022
- 2.4 Global Outlook (2015-2031)
- 2.4.1 Global Market Value & Volume (2015–2022)
- 2.4.2 Global Market Value & Volume (2023-2031)
- 2.5 Global Market Value & Volume by Regions
- 2.5.1 Global Market Value & Volume Comparison by Region (2015–2022)
- 2.5.2 Global Market Value & Volume Comparison by Region (2023-2031)
- 2.6 Global Market Value & Volume by Form
- 2.6.1 Global Market Value & Volume Comparison by Form(2015–2022)
- 2.6.2 Global Market Value & Volume Comparison by Form(2023-2031)
- 2.7 Global Market Value & Volume by Application
- 2.7.1 Global Market Value & Volume Comparison by Application(2015–2022)
- 2.7.2 Global Market Value & Volume Comparison by Application(2023-2031)
- 2.8 Global Market Y-o-Y Growth Rate Comparison 2016–2031
- 2.8.1 Global Market Y-o-Y Growth Rate by Region
- 2.8.2 Global Market Y-o-Y Growth Rate by Form
- 2.8.3 Global Market Y-o-Y Growth Rate by Application
- 2.9 Global Market Share Comparison 2015–2031
- 2.9.1 Global Market Share by Region
- 2.9.2 Global Market Share by Form
- 2.9.3 Global Market Share by Application
- 2.1 Global Market Value & Volume Comparison by Form (2015-2031)
- Chapter 3 North America PAP and Paracetamol Market Overview
- 3.1 North America by Form
- 3.1.1 North America Market Value & Volume Comparison by Form (2015-2031)
- 3.1.2 North America Market Value & Volume Market Share by Form in 2021
- 3.2 North America Market Value & Volume Comparison by Application(2015-2031)
- 3.2.1 North America Market Value & Volume Market Share by Applicationin 2021
- 3.2.2 North America Attractiveness Analysis by Application, 2015–2022
- 3.3 North America Outlook by Region
- 3.3.1 North America Market Value & Volume Comparison by Region (2015-2031)
- 3.3.2 North America Market Value & Volume Market Share by Region in 2021
- 3.3.3 North America Attractiveness Analysis by Region, 2015–2022
- 3.4 North America Outlook (2015-2031)
- 3.4.1 North America Market Value & Volume (2015–2022)
- 3.4.2 North America Market Value & Volume (2023-2031)
- 3.5 North America Market Value & Volume by Regions
- 3.5.1 North America Market Value & Volume Comparison by Region (2015–2022)
- 3.5.2 North America Market Value & Volume Comparison by Region (2023-2031)
- 3.6 North America Market Value & Volume by Form
- 3.6.1 North America Market Value & Volume Comparison by Form(2015–2022)
- 3.6.2 North America Market Value & Volume Comparison by Form(2023-2031)
- 3.7 North America Market Value & Volume by Application
- 3.7.1 North America Market Value & Volume Comparison by Application(2015–2022)
- 3.7.2 North America Market Value & Volume Comparison by Application(2023-2031)
- 3.8 North America Market Y-o-Y Growth Rate Comparison 2016–2031
- 3.8.1 North America Market Y-o-Y Growth Rate by Region
- 3.8.2 North America Market Y-o-Y Growth Rate by Form
- 3.8.3 North America Market Y-o-Y Growth Rate by Application
- 3.9 North America Market Share Comparison 2015–2031
- 3.9.1 North America Market Share by Region
- 3.9.2 North America Market Share by Form
- 3.9.3 North America Market Share by Application
- 3.1 North America by Form
- Chapter 4 Europe PAP and Paracetamol Market Overview
- 4.1 Europe by Form
- 4.1.1 Europe Market Value & Volume Comparison by Form (2015-2031)
- 4.1.2 Europe Market Value & Volume Market Share by Form in 2021
- 4.2 Europe Market Value & Volume Comparison by Application(2015-2031)
- 4.2.1 Europe Market Value & Volume Market Share by Applicationin 2021
- 4.2.2 Europe Attractiveness Analysis by Application, 2015–2022
- 4.3 Europe Outlook by Region
- 4.3.1 Europe Market Value & Volume Comparison by Region (2015-2031)
- 4.3.2 Europe Market Value & Volume Market Share by Region in 2021
- 4.3.3 Europe Attractiveness Analysis by Region, 2015–2022
- 4.4 Europe Outlook (2015-2031)
- 4.4.1 Europe Market Value & Volume (2015–2022)
- 4.4.2 Europe Market Value & Volume (2023-2031)
- 4.5 Europe Market Value & Volume by Regions
- 4.5.1 Europe Market Value & Volume Comparison by Region (2015–2022)
- 4.5.2 Europe Market Value & Volume Comparison by Region (2023-2031)
- 4.6 Europe Market Value & Volume by Form
- 4.6.1 Europe Market Value & Volume Comparison by Form(2015–2022)
- 4.6.2 Europe Market Value & Volume Comparison by Form(2023-2031)
- 4.7 Europe Market Value & Volume by Application
- 4.7.1 Europe Market Value & Volume Comparison by Application(2015–2022)
- 4.7.2 Europe Market Value & Volume Comparison by Application(2023-2031)
- 4.8 Europe Market Y-o-Y Growth Rate Comparison 2016–2031
- 4.8.1 Europe Market Y-o-Y Growth Rate by Region
- 4.8.2 Europe Market Y-o-Y Growth Rate by Form
- 4.8.3 Europe Market Y-o-Y Growth Rate by Application
- 4.9 Europe Market Share Comparison 2015–2031
- 4.9.1 Europe Market Share by Region
- 4.9.2 Europe Market Share by Form
- 4.9.3 Europe Market Share by Application
- 4.1 Europe by Form
- Chapter 5 Asia-Pacific PAP and Paracetamol Market Overview
- 5.1 Asia-Pacific by Form
- 5.1.1 Asia-Pacific Market Value & Volume Comparison by Form (2015-2031)
- 5.1.2 Asia-Pacific Market Value & Volume Market Share by Form in 2021
- 5.2 Asia-Pacific Market Value & Volume Comparison by Application(2015-2031)
- 5.2.1 Asia-Pacific Market Value & Volume Market Share by Applicationin 2021
- 5.2.2 Asia-Pacific Attractiveness Analysis by Application, 2015–2022
- 5.3 Asia-Pacific Outlook by Region
- 5.3.1 Asia-Pacific Market Value & Volume Comparison by Region (2015-2031)
- 5.3.2 Asia-Pacific Market Value & Volume Market Share by Region in 2021
- 5.3.3 Asia-Pacific Attractiveness Analysis by Region, 2015–2022
- 5.4 Asia-Pacific Outlook (2015-2031)
- 5.4.1 Asia-Pacific Market Value & Volume (2015–2022)
- 5.4.2 Asia-Pacific Market Value & Volume (2023-2031)
- 5.5 Asia-Pacific Market Value & Volume by Regions
- 5.5.1 Asia-Pacific Market Value & Volume Comparison by Region (2015–2022)
- 5.5.2 Asia-Pacific Market Value & Volume Comparison by Region (2023-2031)
- 5.6 Asia-Pacific Market Value & Volume by Form
- 5.6.1 Asia-Pacific Market Value & Volume Comparison by Form(2015–2022)
- 5.6.2 Asia-Pacific Market Value & Volume Comparison by Form(2023-2031)
- 5.7 Asia-Pacific Market Value & Volume by Application
- 5.7.1 Asia-Pacific Market Value & Volume Comparison by Application(2015–2022)
- 5.7.2 Asia-Pacific Market Value & Volume Comparison by Application(2023-2031)
- 5.8 Asia-Pacific Market Y-o-Y Growth Rate Comparison 2016–2031
- 5.8.1 Asia-Pacific Market Y-o-Y Growth Rate by Region
- 5.8.2 Asia-Pacific Market Y-o-Y Growth Rate by Form
- 5.8.3 Asia-Pacific Market Y-o-Y Growth Rate by Application
- 5.9 Asia-Pacific Market Share Comparison 2015–2031
- 5.9.1 Asia-Pacific Market Share by Region
- 5.9.2 Asia-Pacific Market Share by Form
- 5.9.3 Asia-Pacific Market Share by Application
- 5.1 Asia-Pacific by Form
- Chapter 6 Latin America PAP and Paracetamol Market Overview
- 6.1 Latin America by Form
- 6.1.1 Latin America Market Value & Volume Comparison by Form (2015-2031)
- 6.1.2 Latin America Market Value & Volume Market Share by Form in 2021
- 6.2 Latin America Market Value & Volume Comparison by Application(2015-2031)
- 6.2.1 Latin America Market Value & Volume Market Share by Applicationin 2021
- 6.2.2 Latin America Attractiveness Analysis by Application, 2015–2022
- 6.3 Latin America Outlook by Region
- 6.3.1 Latin America Market Value & Volume Comparison by Region (2015-2031)
- 6.3.2 Latin America Market Value & Volume Market Share by Region in 2021
- 6.3.3 Latin America Attractiveness Analysis by Region, 2015–2022
- 6.4 Latin America Outlook (2015-2031)
- 6.4.1 Latin America Market Value & Volume (2015–2022)
- 6.4.2 Latin America Market Value & Volume (2023-2031)
- 6.5 Latin America Market Value & Volume by Regions
- 6.5.1 Latin America Market Value & Volume Comparison by Region (2015–2022)
- 6.5.2 Latin America Market Value & Volume Comparison by Region (2023-2031)
- 6.6 Latin America Market Value & Volume by Form
- 6.6.1 Latin America Market Value & Volume Comparison by Form(2015–2022)
- 6.6.2 Latin America Market Value & Volume Comparison by Form(2023-2031)
- 6.7 Latin America Market Value & Volume by Application
- 6.7.1 Latin America Market Value & Volume Comparison by Application(2015–2022)
- 6.7.2 Latin America Market Value & Volume Comparison by Application(2023-2031)
- 6.8 Latin America Market Y-o-Y Growth Rate Comparison 2016–2031
- 6.8.1 Latin America Market Y-o-Y Growth Rate by Region
- 6.8.2 Latin America Market Y-o-Y Growth Rate by Form
- 6.8.3 Latin America Market Y-o-Y Growth Rate by Application
- 6.9 Latin America Market Share Comparison 2015–2031
- 6.9.1 Latin America Market Share by Region
- 6.9.2 Latin America Market Share by Form
- 6.9.3 Latin America Market Share by Application
- 6.1 Latin America by Form
- Chapter 7 MEA PAP and Paracetamol Market Overview
- 7.1 MEA by Form
- 7.1.1 MEA Market Value & Volume Comparison by Form (2015-2031)
- 7.1.2 MEA Market Value & Volume Market Share by Form in 2021
- 7.2 MEA Market Value & Volume Comparison by Application(2015-2031)
- 7.2.1 MEA Market Value & Volume Market Share by Applicationin 2021
- 7.2.2 MEA Attractiveness Analysis by Application, 2015–2022
- 7.3 MEA Outlook by Region
- 7.3.1 MEA Market Value & Volume Comparison by Region (2015-2031)
- 7.3.2 MEA Market Value & Volume Market Share by Region in 2021
- 7.3.3 MEA Attractiveness Analysis by Region, 2015–2022
- 7.4 MEA Outlook (2015-2031)
- 7.4.1 MEA Market Value & Volume (2015–2022)
- 7.4.2 MEA Market Value & Volume (2023-2031)
- 7.5 MEA Market Value & Volume by Regions
- 7.5.1 MEA Market Value & Volume Comparison by Region (2015–2022)
- 7.5.2 MEA Market Value & Volume Comparison by Region (2023-2031)
- 7.6 MEA Market Value & Volume by Form
- 7.6.1 MEA Market Value & Volume Comparison by Form(2015–2022)
- 7.6.2 MEA Market Value & Volume Comparison by Form(2023-2031)
- 7.7 MEA Market Value & Volume by Application
- 7.7.1 MEA Market Value & Volume Comparison by Application(2015–2022)
- 7.7.2 MEA Market Value & Volume Comparison by Application(2023-2031)
- 7.8 MEA Market Y-o-Y Growth Rate Comparison 2016–2031
- 7.8.1 MEA Market Y-o-Y Growth Rate by Region
- 7.8.2 MEA Market Y-o-Y Growth Rate by Form
- 7.8.3 MEA Market Y-o-Y Growth Rate by Application
- 7.9 MEA Market Share Comparison 2015–2031
- 7.9.1 MEA Market Share by Region
- 7.9.2 MEA Market Share by Form
- 7.9.3 MEA Market Share by Application
- 7.1 MEA by Form
- Chapter 8 Global PAP and Paracetamol Market Company Profiles
- 8.1 Market Competition Scenario Analysis, By Company
- 8.2 Competitor Landscape
- 8.3 Company Share Analysis
- 8.4 Company Profiles
- 8.4.1 Granules India Ltd
- 8.4.1.1 Company Overview
- 8.4.1.2 Business Description
- 8.4.1.3 Product Portfolio
- 8.4.1.4 Key Financials
- 8.4.1.5 Key Developments
- 8.4.1.6 SWOT Analysis
- 8.4.2 Sri Krishna Pharmaceuticals
- 8.4.2.1 Company Overview
- 8.4.2.2 Business Description
- 8.4.2.3 Product Portfolio
- 8.4.2.4 Key Financials
- 8.4.2.5 Key Developments
- 8.4.2.6 SWOT Analysis
- 8.4.3 Gujarat Farmson Pharmaceuticals
- 8.4.3.1 Company Overview
- 8.4.3.2 Business Description
- 8.4.3.3 Product Portfolio
- 8.4.3.4 Key Financials
- 8.4.3.5 Key Developments
- 8.4.3.6 SWOT Analysis
- 8.4.4 Meghmani LLP
- 8.4.4.1 Company Overview
- 8.4.4.2 Business Description
- 8.4.4.3 Product Portfolio
- 8.4.4.4 Key Financials
- 8.4.4.5 Key Developments
- 8.4.4.6 SWOT Analysis
- 8.4.5 Bharat Chemicals
- 8.4.5.1 Company Overview
- 8.4.5.2 Business Description
- 8.4.5.3 Product Portfolio
- 8.4.5.4 Key Financials
- 8.4.5.5 Key Developments
- 8.4.5.6 SWOT Analysis
- 8.4.6 Para Products Pvt Ltd
- 8.4.6.1 Company Overview
- 8.4.6.2 Business Description
- 8.4.6.3 Product Portfolio
- 8.4.6.4 Key Financials
- 8.4.6.5 Key Developments
- 8.4.6.6 SWOT Analysis
- 8.4.7 Farmson Pharmaceutical Gujarat Pvt. Ltd.
- 8.4.7.1 Company Overview
- 8.4.7.2 Business Description
- 8.4.7.3 Product Portfolio
- 8.4.7.4 Key Financials
- 8.4.7.5 Key Developments
- 8.4.7.6 SWOT Analysis
- 8.4.8 Anqiu Lu’an Pharmaceutical Co., Ltd.
- 8.4.8.1 Company Overview
- 8.4.8.2 Business Description
- 8.4.8.3 Product Portfolio
- 8.4.8.4 Key Financials
- 8.4.8.5 Key Developments
- 8.4.8.6 SWOT Analysis
- 8.4.9 Hebei Jiheng Pharmaceutical Co., Ltd.
- 8.4.9.1 Company Overview
- 8.4.9.2 Business Description
- 8.4.9.3 Product Portfolio
- 8.4.9.4 Key Financials
- 8.4.9.5 Key Developments
- 8.4.9.6 SWOT Analysis
- 8.4.10 ABHILASH CHEMICALS & PHARMACEUTICALS PVT. LTD.
- 8.4.10.1 Company Overview
- 8.4.10.2 Business Description
- 8.4.10.3 Product Portfolio
- 8.4.10.4 Key Financials
- 8.4.10.5 Key Developments
- 8.4.10.6 SWOT Analysis
- 8.4.11 Other Key Players
- 8.4.1 Granules India Ltd
- Chapter 9 Research Methodology
- 9.1 Research Methodology
- 9.2 Primary Research
- 9.3 Secondary Research
- 9.4 Report Scope
- Chapter 10 About Us
- 10.1 Who we are:
- Chapter 11 Disclaimer
- Chapter 1 Global PAP and Paracetamol Market Outlook
-
- Granules India Ltd
- Sri Krishna Pharmaceuticals
- Gujarat Farmson Pharmaceuticals
- Meghmani LLP
- Bharat Chemicals
- Para Products Pvt Ltd
- Farmson Pharmaceutical Gujarat Pvt. Ltd.
- Anqiu Lu'an Pharmaceutical Co., Ltd.
- Hebei Jiheng Pharmaceutical Co., Ltd.
- ABHILASH CHEMICALS & PHARMACEUTICALS PVT. LTD.
- Other Key Players


Our Clients


View Our Licence Options
