Packaged Coconut Water Market By Type (Pure Coconut Water, Mix Coconut Water), By Pacakaging (Plastic Bottles, Tetra Packs), By Distribution Channel (Hypermarkets/Supermarkets, Retail Stores), By Region And Companies - Industry Segment Outlook, Market Assessment, Competition Scenario, Trends, And Forecast 2023-2032
-
11261
-
Jul 2023
-
151
-


-
This report was compiled by Shreyas Rokade Shreyas Rokade is a seasoned Research Analyst with CMFE, bringing extensive expertise in market research and consulting, with a strong background in Chemical Engineering. Correspondence Team Lead-CMFE Linkedin | Detailed Market research Methodology Our methodology involves a mix of primary research, including interviews with leading mental health experts, and secondary research from reputable medical journals and databases. View Detailed Methodology Page
-
Quick Navigation
Report Overview
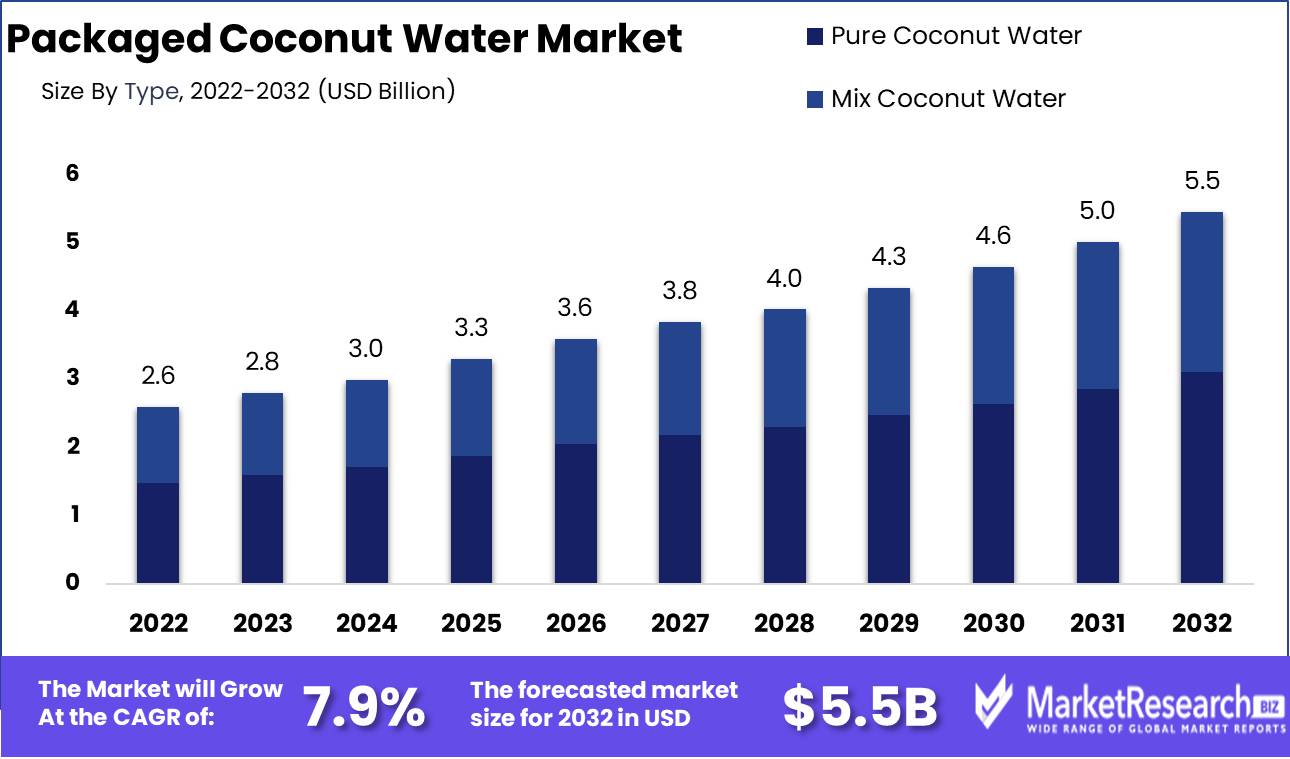
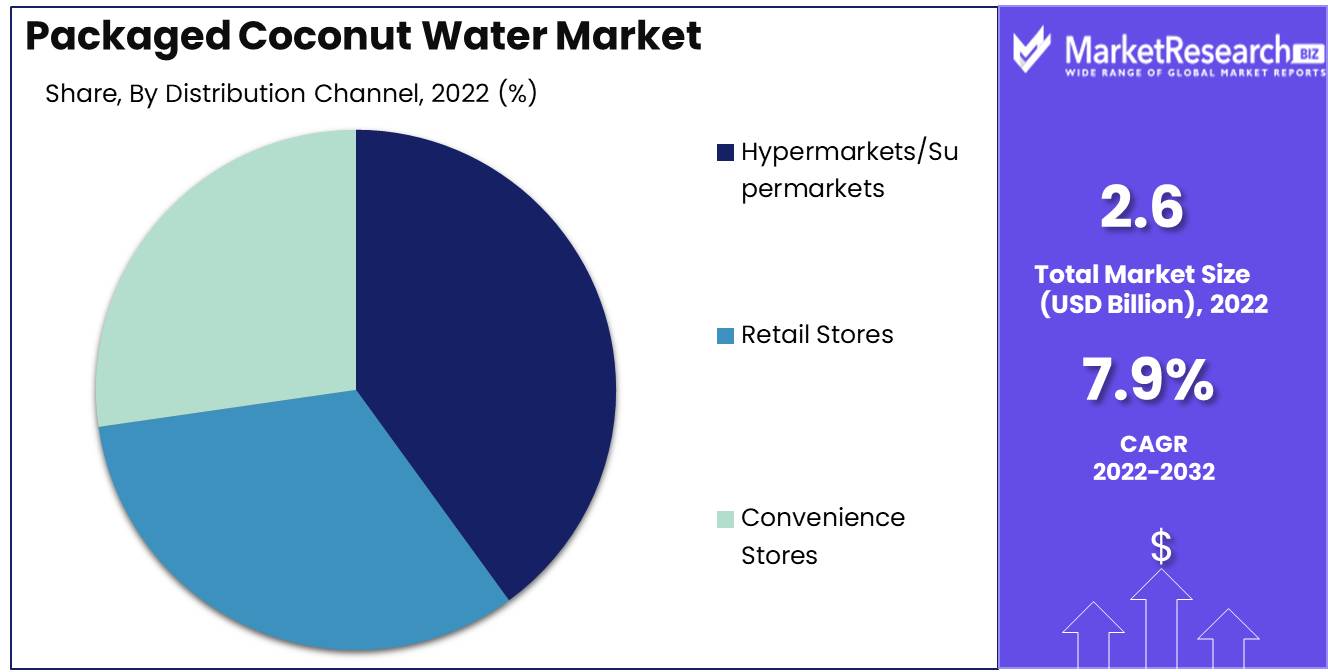
Packaged Coconut Water Market size is expected to be worth around USD 5.5 Bn by 2032 from USD 2.6 Bn in 2022, growing at a CAGR of 7.9% during the forecast period from 2023 to 2032.
Packaged coconut water, also known as bottled coconut water, refers to the extraction of the liquid from coconuts and its subsequent packaging in bottles or tetra packs for retail sale. In contrast to coconut milk, which is extracted from the coconut's flesh and contains a higher fat content, packaged coconut water is derived from the clear liquid found within immature, green coconuts. The primary objective of packaging coconut water is to preserve its freshness and natural qualities while making it more accessible to consumers.
Several factors have led to the growth of the packaged coconut water market. It is a healthier alternative to traditional sugary beverages. Electrolytes, vitamins, and minerals are naturally present in coconut water, making it a popular beverage among health-conscious individuals. In addition, it contains no artificial additives or sweeteners and is low in calories and cholesterol.
On the packaged coconut water market, notable innovations have emerged, including flavored variants and various packaging formats. Flavored coconut water provides consumers with a wider variety of options, accommodating a variety of flavor preferences. As a result of advancements in packaging, coconut water is now available in cans, containers, and even powdered form.
The rising popularity of packaged coconut water has attracted significant investments from both established beverage industry leaders and newcomers. Recognizing the potential for growth and consumer demand, a number of beverage companies have added coconut water to their product lines. Additionally, the incorporation of coconut water into other products and services, including sports beverages, smoothies, and beauty products, has increased its market penetration.
The packaged coconut water market's growth and applications extend beyond the beverage industry. Coconut water has found its way into a variety of industries, including the food and cosmetics industries, due to its inherent hydrating and health benefits. Coconut water has been incorporated into recipes by restaurants and culinary establishments, enhancing flavor and providing a healthier alternative to conventional ingredients. Due to its hydrating and nourishing properties, coconut water is utilized in hygiene and haircare products in the cosmetics industry.
Driving factors
The Development of the Health and Wellness Industry
In recent years, the health and wellness industry has witnessed remarkable expansion. People are now actively searching for products that promote their health, creating an ideal opportunity for the packaged coconut water market. Due to their hydrating qualities, electrolyte content, and naturally refreshing taste, natural and healthy beverages such as coconut water have acquired immense popularity. As consumers become more knowledgeable about the health advantages of these beverages, their interest continues to increase, fostering the growth of a thriving market.
Innovative Packaging Solutions
The packaging of any beverage product, including coconut water, is crucial to its success. The industry has been revolutionized by advancements in packaging technologies, which provide better preservation, shelf life, and convenience. Manufacturers have introduced inventive packaging solutions, such as Tetra Pak and aseptic packaging, to preserve the freshness and nutritional value of coconut water for an extended period of time. This not only improves the quality of the product but also inspires consumers to choose packaged coconut water over other beverages.
Preserving Flavor and Nutritional Value
Increased consumer interest in packaged coconut water has been substantially influenced by preservation technologies. High-pressure processing (HPP) is one procedure that preserves the beverage's flavor, texture, and nutrient content without the use of heat or preservatives. This technology enables manufacturers to preserve the natural qualities of coconut water while maintaining product safety. As consumers search for healthier alternatives, the availability of coconut water that tastes great and retains its nutritional value is of utmost importance.
The Development of Functional Drinks
In recent years, functional beverages have acquired significant popularity among consumers seeking hydration and additional health benefits. This demand has been capitalized on by the packaged coconut water market, which now offers functional options enriched with vitamins, minerals, antioxidants, and natural supplements. These functional beverages are intended to provide specific health benefits, such as increased vitality, enhanced digestion, and immune system support. Functional Food and beverages, such as packaged coconut water, continue to gain popularity as more people search for convenient ways to incorporate wellness into their daily lives.
Restraining Factors
Potential Rivalry from Alternative Plant-Based Beverages
Even though the packaged coconut water market is growing, it confronts intense competition from other plant-based beverages. There are numerous options available to consumers today, including almond milk, soy milk, and various fruit beverages. These alternatives offer comparable health benefits and satisfy a variety of dietary preferences. In addition, the aggressive marketing strategies employed by other producers of plant-based beverages increase market competition. As a result, pure coconut water consumers may be inclined to choose other options, affecting the packaged coconut water market share and growth potential.
Potential Limitations to Product Shelf Life and Quality
Coconut water is a perishable beverage that must be carefully preserved to retain its quality and freshness. Packaging and production techniques play a vital role in extending the retail life of a product without altering its flavor or nutritional value. However, maintaining quality consistency in large-scale production can be difficult. Inadequate processing facilities, improper storage, and transportation conditions can lead to alterations in flavor, texture, and overall quality. Consumers expect a consistently high-quality product, and any compromise in this regard could lead to a loss of consumer confidence and sales.
Type Analysis
The Pure Coconut Water Segment dominates the packaged coconut water market.
In the packaged coconut water market, pure coconut water extracted directly from young coconuts has acquired immense popularity. In recent years, the demand for unadulterated coconut water has increased substantially, as health-conscious consumers seek natural and refreshing beverages. Due to its many health benefits and natural flavor, this segment dominates the market.
Coconut water is renowned for its high nutrient content, which includes electrolytes such as potassium, magnesium, and sodium. It is also abundant in vitamins and antioxidants, making it an ideal alternative to sugary drinks for those seeking a healthy beverage. Pure coconut water is devoid of artificial additives, preservatives, and added carbohydrates, making it a natural and pure beverage alternative.
Global demand for pure coconut water has increased due to the increasing popularity of healthful living. Consumers are becoming increasingly aware of the negative health effects of saccharine and carbonated beverages. As a consequence, they are adopting healthier alternatives such as pure coconut water. This change in consumer behavior has caused the Pure Coconut Water Segment to dominate the packaged coconut water market.
Packaging Analysis
Segment Tetra Packs dominates the packaged coconut water market.
There are numerous packaging options for packaged coconut water, including bottles, cans, and tetra packs. The Tetra Packs Segment represents a significant portion of the market. Tetra packs are made from laminated paperboard, aluminum, and plastic, giving coconut water an extended shelf life while maintaining its freshness and nutritional value.
Multiple factors have contributed to the dominance of the Tetra Packs Segment. First, tetra packets are portable and convenient, making them a popular option among consumers who are constantly on the move. These cases are lightweight and easily transportable in handbags or backpacks, making them a convenient option for individuals with hectic schedules.
Secondly, tetra packets provide enhanced protection against external factors such as light, air, and moisture, thereby ensuring the longevity and quality of the product. Modern packaging techniques and materials help preserve the coconut water's flavor, nutritional value, and overall quality.
Distribution Channel Analysis
The segment of hypermarkets and supermarkets dominates the packaged coconut water market.
The distribution of packaged coconut water is crucial to its dominance in the market. Among the numerous channels of distribution, the Hypermarkets/Supermarkets Segment holds the largest market share. This segment provides consumers with an extensive selection of packaged coconut water brands and formats, making the product readily available.
Hypermarkets and supermarkets provide consumers with the convenience of one-stop shopping, allowing them to find all of their grocery requirements in a single location. In addition to coconut water, these stores provide an extensive selection of food and beverages, making them the consumers' first choice. Multiple brands and varieties of packaged coconut water are available at these retail locations, which contributes to the segment's dominance.
In addition, the economic growth of emerging economies has played a significant role in fostering the growth of the Hypermarkets/Supermarkets Segment. These societies have experienced an increase in disposable income and urbanization. As a result, consumers are moving away from traditional marketplaces and towards modern retail formats such as hypermarkets and supermarkets. This change in consumer behavior has increased the demand for packaged coconut water in these stores, thereby bolstering the Hypermarkets/Supermarkets Segment's dominance.
Key Market Segments
By Type
- Pure Coconut Water
- Mix Coconut Water
By Packaging
- Plastic Bottles
- Tetra Packs
- Cans
By Distribution Channel
- Hypermarkets/Supermarkets
- Retail Stores
- Convenience Stores
Growth Opportunity
Enhanced Marketing Strategies
In the fast-paced digital world, it is essential for businesses to have effective marketing strategies. Creating targeted and engaging campaigns for packaged coconut water can significantly increase brand visibility and consumer engagement. Highlight the health benefits of coconut water, its natural and hydrating properties, and its adaptability in a variety of recipes and concoctions. Utilize social media, influencers, and health-conscious communities to promote the benefits of packaged coconut water.
Product Expansion and Innovation
To remain competitive, businesses in the packaged coconut water market must continually focus on product development and expansion. Introduce new flavors and variations to accommodate the preferences of a diverse consumer base. Consider constructing blends with additional natural ingredients to improve flavor and provide unique functionality. Packaging innovations, such as eco-friendly materials or single-serve measures, can also attract environmentally conscious consumers and those seeking options for on-the-go consumption.
Enrichment of Nutrients and Functional Provisions
Coconut water is well-known for its natural hydrating and electrolyte-containing properties. However, by adding additional nutrients and supplements, businesses can capitalize on the expanding market for functional beverages. Explore the possibility of forming partnerships with nutritionists, wellness experts, and fitness influencers in order to create formulations that are unique and beneficial. Incorporate ingredients like vitamins, minerals, and plant-based antioxidants to address specific consumer requirements, such as post-workout recovery, immune system support, and gut health.
Latest Trends
Growth of Ready-to-Drink Packaged Coconut Water
For consumers who are health-conscious worldwide, ready-to-drink packaged coconut water has become a popular beverage option. Coconut water has gained widespread recognition as a healthier alternative to conventional sugary beverages due to its naturally refreshing flavor and numerous health benefits, including hydration, essential minerals, and electrolytes. As a result, demand for packaged coconut water has skyrocketed, propelling the industry's substantial growth.
Demand for Flavored and Medicinal Coconut Water Merchandise
As the packaged coconut water market expands, manufacturers are introducing a plethora of flavored and functional coconut water products to accommodate consumers' changing tastes and preferences. Options include pineapple, mango, and passionfruit flavors, as well as combinations like coconut water with a dash of chocolate or coffee. Moreover, manufacturers are incorporating functional ingredients such as antioxidants, probiotics, and vitamins into their coconut water products, thereby enhancing the health benefits and attracting a greater number of consumers.
Coconut Water Utilization in Smoothies and Functional Beverages
Beyond being ingested on its own, coconut water has become a popular ingredient in the production of functional beverages and smoothies. Its natural sweetness and subtle tropical flavor make it an ideal addition to smoothie recipes, enhancing flavor while increasing hydration. In addition, food and beverage companies are utilizing the nutritional profile of coconut water to create functional beverages tailored to specific health requirements, including post-workout recovery, immune support, and weight management.
Increasing Popularity of Coconut Water-Based Sports and Recovery Drinks
The rise in health consciousness among athletes and fitness enthusiasts has contributed to the emergence of sports and recovery drinks made with coconut water. Coconut water functions as a natural alternative to commercially produced sports drinks because of its electrolyte content, which includes potassium and magnesium. These beverages provide the essential hydration and nutrients required to replenish the body after strenuous physical activity, facilitating muscle recovery and reducing fatigue.
Regional Analysis
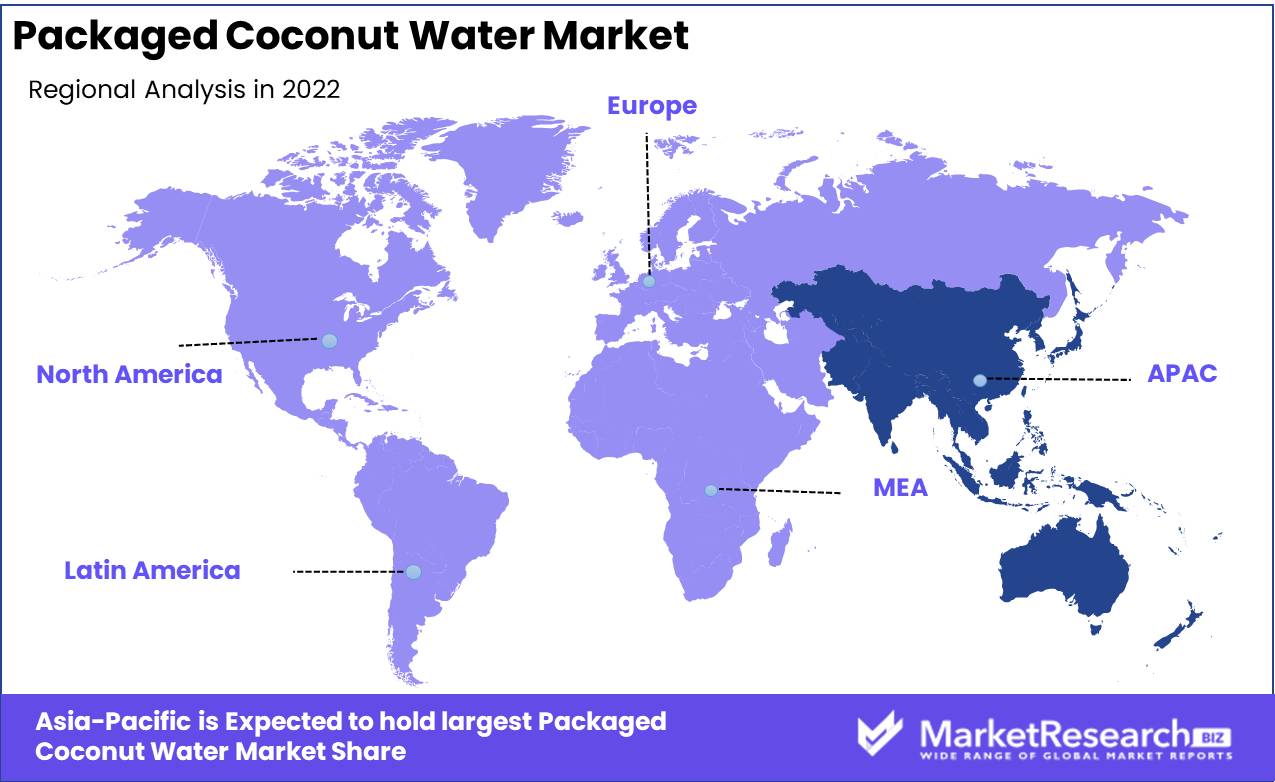
Asia-Pacific Region Dominates the Packaged Coconut Water Market
Since ancient times, the Asia-Pacific region has been revered for its abundance of coconut trees, the primary source of packaged coconut water. Countries with a rich history of coconut cultivation, such as Thailand, Indonesia, and the Philippines, have adopted the potential of this natural resource. This has led to the establishment of numerous coconut water processing facilities throughout the region, ensuring a steady supply of packaged coconut water of the highest quality.
Growing awareness of the health advantages of packaged coconut water is one of the primary contributors to the region's dominance in the packaged coconut water market in Asia-Pacific. Coconut water is naturally rich in electrolytes, vitamins, and minerals, making it an excellent option for rehydration and recovery after exercise. Additionally, it is low in calories and contains no fat or cholesterol, making it an attractive alternative to sugary sodas and sports beverages.
In addition, the Asia-Pacific region has witnessed an increase in the demand for natural and organic products, as a result of the transition toward a more eco-friendly and sustainable way of life. As a naturally sourced beverage without the addition of artificial preservatives or sweeteners, packaged coconut water corresponds flawlessly with these preferences. Consumers in the region are embracing the concept of clean labeling and selecting environmentally and health-friendly products.
The Asia-Pacific region's dominance in the packaged coconut water market is also attributable to its robust distribution networks and expanding export capabilities. With the rise of e-commerce and globalization, it is now simpler for regional manufacturers to reach consumers worldwide. Asian nations have capitalized on this opportunity by forming trade alliances and exporting packaged coconut water to various regions, including North America and Europe.
Key Regions and Countries
North America
- US
- Canada
- Mexico
Western Europe
- Germany
- France
- The UK
- Spain
- Italy
- Portugal
- Ireland
- Austria
- Switzerland
- Benelux
- Nordic
- Rest of Western Europe
Eastern Europe
- Russia
- Poland
- The Czech Republic
- Greece
- Rest of Eastern Europe
APAC
- China
- Japan
- South Korea
- India
- Australia & New Zealand
- Indonesia
- Malaysia
- Philippines
- Singapore
- Thailand
- Vietnam
- Rest of APAC
Latin America
- Brazil
- Colombia
- Chile
- Argentina
- Costa Rica
- Rest of Latin America
Middle East & Africa
- Algeria
- Egypt
- Israel
- Kuwait
- Nigeria
- Saudi Arabia
- South Africa
- Turkey
- United Arab Emirates
- Rest of MEA
Key Players Analysis
The Taste Nirvana brand concentrates on preserving the natural flavor and nutritional benefits of fresh coconuts, ensuring that every sip provides the consumer with pure bliss. Taste Nirvana offers a revitalizing and genuine experience by preserving the coconut's essence through a special extraction method. Taste Nirvana's coconuts are sourced from Thailand's world-famous coconut plantations due to their commitment to quality. This enables them to maintain the highest flavor and purity standards.
Bai is yet another market leader in packaged coconut water that has distinguished itself through innovation. Bai introduces distinct flavor combinations and functional enhancements to their coconut water products in order to provide healthier beverages. By infusing their beverages with antioxidants and natural sweeteners such as stevia, Bai gives traditional coconut water a healthier twist.
GraceKennedy Group, a Jamaica-based corporation with a global reputation, has also made an impact in the packaged coconut water industry. They convey a taste of the tropics to consumers worldwide with their popular brand, Grace Coconut Water. Grace Coconut Water is renowned for its authentic flavor and use of fresh, immature coconuts, which are selected and packaged with care to preserve their natural goodness. GraceKennedy Group, a company with profound roots in the Caribbean, supports local farmers and communities by promoting sustainable agricultural practices.
As a pioneer of organic coconut water, green coco europe GmbH has developed a niche for itself. This brand provides a genuinely pure and natural product with a strong emphasis on sustainability and organic farming techniques. By collaborating directly with producers and utilizing only certified organic coconuts, green coco europe GmbH ensures that their coconut water is not only delicious but also free of harmful additives and chemicals.
Top Key Players in Packaged Coconut Water Market
- Taste Nirvana
- Bai
- GraceKennedy Group.
- green coco europe GmbH
- COCOJAL
- All Market Inc.
- Amy & Brian Naturals.
- The Coca-Cola Company.
- PepsiCo
- Dabur
- Harmless Harvest
- Exotic Superfoods.
- C2O Pure Coconut Water
- LLC
- National Beverage Corp.
- Purity Organic
- Phalada Pure & Sure
- Rakyan Beverages
- Natures Basket Limited.
- Nature’s Coconut
Recent Development
- In 2023, Vita Coco made ripples by announcing an upcoming line of packaged coconut water that is specifically designed to be portable. Vita Coco is planning to introduce innovative packaging solutions that prioritize convenience without sacrificing the refreshing taste and inherent health benefits of coconut water, in recognition of the changing lifestyles of their consumers.
- In 2022, Zico entered with the thrilling announcement that they would be expanding their packaged coconut water portfolio to include a variety of enticing flavors. Zico aims to provide consumers with a delightful and diverse hydration experience by introducing a wider variety of flavor variants.
- In 2021, Naked Juice captured the public's attention by announcing the launch of a new line of packaged coconut water that was specifically designed to be more affordable.
Report Scope
Report Features Description Market Value (2022) USD 2.6 Bn Forecast Revenue (2032) USD 5.5 Bn CAGR (2023-2032) 7.9% Base Year for Estimation 2022 Historic Period 2016-2022 Forecast Period 2023-2032 Report Coverage Revenue Forecast, Market Dynamics, COVID-19 Impact, Competitive Landscape, Recent Developments Segments Covered By Type(Pure Coconut Water, Mix Coconut Water), By Pacakaging(Plastic Bottles, Tetra Packs), By Distribution Channel(Hypermarkets/Supermarkets, Retail Stores) Regional Analysis North America – The US, Canada, & Mexico; Western Europe – Germany, France, The UK, Spain, Italy, Portugal, Ireland, Austria, Switzerland, Benelux, Nordic, & Rest of Western Europe; Eastern Europe – Russia, Poland, The Czech Republic, Greece, & Rest of Eastern Europe; APAC – China, Japan, South Korea, India, Australia & New Zealand, Indonesia, Malaysia, Philippines, Singapore, Thailand, Vietnam, & Rest of APAC; Latin America – Brazil, Colombia, Chile, Argentina, Costa Rica, & Rest of Latin America; Middle East & Africa – Algeria, Egypt, Israel, Kuwait, Nigeria, Saudi Arabia, South Africa, Turkey, United Arab Emirates, & Rest of MEA Competitive Landscape Taste Nirvana, Bai, GraceKennedy Group., green coco europe GmbH, COCOJAL, All Market Inc., Amy & Brian Naturals., The Coca-Cola Company., PepsiCo, Dabur, Harmless Harvest, Exotic Superfoods., C2O Pure Coconut Water, LLC, National Beverage Corp., Purity Organic, Phalada Pure & Sure, Rakyan Beverages, Natures Basket Limited., Nature’s Coconut Customization Scope Customization for segments, region/country-level will be provided. Moreover, additional customization can be done based on the requirements. Purchase Options We have three licenses to opt for: Single User License, Multi-User License (Up to 5 Users), Corporate Use License (Unlimited User and Printable PDF) -
- 1. Executive Summary
- 1.1. Definition
- 1.2. Taxonomy
- 1.3. Research Scope
- 1.4. Key Analysis
- 1.5. Key Findings by Major Segments
- 1.6. Top strategies by Major Players
- 2. Global Packaged Coconut Water Market Overview
- 2.1. Packaged Coconut Water Market Dynamics
- 2.1.1. Drivers
- 2.1.2. Opportunities
- 2.1.3. Restraints
- 2.1.4. Challenges
- 2.2. Macro-economic Factors
- 2.3. Regulatory Framework
- 2.4. Market Investment Feasibility Index
- 2.5. PEST Analysis
- 2.6. PORTER’S Five Force Analysis
- 2.7. Drivers & Restraints Impact Analysis
- 2.8. Industry Chain Analysis
- 2.9. Cost Structure Analysis
- 2.10. Marketing Strategy
- 2.11. Russia-Ukraine War Impact Analysis
- 2.12. Opportunity Map Analysis
- 2.13. Market Competition Scenario Analysis
- 2.14. Product Life Cycle Analysis
- 2.15. Opportunity Orbits
- 2.16. Manufacturer Intensity Map
- 2.17. Major Companies sales by Value & Volume
- 2.1. Packaged Coconut Water Market Dynamics
- 3. Global Packaged Coconut Water Market Analysis, Opportunity and Forecast, 2016-2032
- 3.1. Global Packaged Coconut Water Market Analysis, 2016-2021
- 3.2. Global Packaged Coconut Water Market Opportunity and Forecast, 2023-2032
- 3.3. Global Packaged Coconut Water Market Analysis, Opportunity and Forecast, By By Type, 2016-2032
- 3.3.1. Global Packaged Coconut Water Market Analysis by By Type: Introduction
- 3.3.2. Market Size Absolute $ Opportunity Analysis and Forecast, By By Type, 2016-2032
- 3.3.3. Pure Coconut Water
- 3.3.4. Mix Coconut Water
- 3.4. Global Packaged Coconut Water Market Analysis, Opportunity and Forecast, By By Packaging, 2016-2032
- 3.4.1. Global Packaged Coconut Water Market Analysis by By Packaging: Introduction
- 3.4.2. Market Size Absolute $ Opportunity Analysis and Forecast, By By Packaging, 2016-2032
- 3.4.3. Plastic Bottles
- 3.4.4. Tetra Packs
- 3.4.5. Cans
- 3.5. Global Packaged Coconut Water Market Analysis, Opportunity and Forecast, By By Distribution Channel, 2016-2032
- 3.5.1. Global Packaged Coconut Water Market Analysis by By Distribution Channel: Introduction
- 3.5.2. Market Size Absolute $ Opportunity Analysis and Forecast, By By Distribution Channel, 2016-2032
- 3.5.3. Hypermarkets/Supermarkets
- 3.5.4. Retail Stores
- 3.5.5. Convenience Stores
- 4. North America Packaged Coconut Water Market Analysis, Opportunity and Forecast, 2016-2032
- 4.1. North America Packaged Coconut Water Market Analysis, 2016-2021
- 4.2. North America Packaged Coconut Water Market Opportunity and Forecast, 2023-2032
- 4.3. North America Packaged Coconut Water Market Analysis, Opportunity and Forecast, By By Type, 2016-2032
- 4.3.1. North America Packaged Coconut Water Market Analysis by By Type: Introduction
- 4.3.2. Market Size Absolute $ Opportunity Analysis and Forecast, By By Type, 2016-2032
- 4.3.3. Pure Coconut Water
- 4.3.4. Mix Coconut Water
- 4.4. North America Packaged Coconut Water Market Analysis, Opportunity and Forecast, By By Packaging, 2016-2032
- 4.4.1. North America Packaged Coconut Water Market Analysis by By Packaging: Introduction
- 4.4.2. Market Size Absolute $ Opportunity Analysis and Forecast, By By Packaging, 2016-2032
- 4.4.3. Plastic Bottles
- 4.4.4. Tetra Packs
- 4.4.5. Cans
- 4.5. North America Packaged Coconut Water Market Analysis, Opportunity and Forecast, By By Distribution Channel, 2016-2032
- 4.5.1. North America Packaged Coconut Water Market Analysis by By Distribution Channel: Introduction
- 4.5.2. Market Size Absolute $ Opportunity Analysis and Forecast, By By Distribution Channel, 2016-2032
- 4.5.3. Hypermarkets/Supermarkets
- 4.5.4. Retail Stores
- 4.5.5. Convenience Stores
- 4.6. North America Packaged Coconut Water Market Analysis, Opportunity and Forecast, By Country , 2016-2032
- 4.6.1. North America Packaged Coconut Water Market Analysis by Country : Introduction
- 4.6.2. Market Size Absolute $ Opportunity Analysis and Forecast, Country , 2016-2032
- 4.6.2.1. The US
- 4.6.2.2. Canada
- 4.6.2.3. Mexico
- 5. Western Europe Packaged Coconut Water Market Analysis, Opportunity and Forecast, 2016-2032
- 5.1. Western Europe Packaged Coconut Water Market Analysis, 2016-2021
- 5.2. Western Europe Packaged Coconut Water Market Opportunity and Forecast, 2023-2032
- 5.3. Western Europe Packaged Coconut Water Market Analysis, Opportunity and Forecast, By By Type, 2016-2032
- 5.3.1. Western Europe Packaged Coconut Water Market Analysis by By Type: Introduction
- 5.3.2. Market Size Absolute $ Opportunity Analysis and Forecast, By By Type, 2016-2032
- 5.3.3. Pure Coconut Water
- 5.3.4. Mix Coconut Water
- 5.4. Western Europe Packaged Coconut Water Market Analysis, Opportunity and Forecast, By By Packaging, 2016-2032
- 5.4.1. Western Europe Packaged Coconut Water Market Analysis by By Packaging: Introduction
- 5.4.2. Market Size Absolute $ Opportunity Analysis and Forecast, By By Packaging, 2016-2032
- 5.4.3. Plastic Bottles
- 5.4.4. Tetra Packs
- 5.4.5. Cans
- 5.5. Western Europe Packaged Coconut Water Market Analysis, Opportunity and Forecast, By By Distribution Channel, 2016-2032
- 5.5.1. Western Europe Packaged Coconut Water Market Analysis by By Distribution Channel: Introduction
- 5.5.2. Market Size Absolute $ Opportunity Analysis and Forecast, By By Distribution Channel, 2016-2032
- 5.5.3. Hypermarkets/Supermarkets
- 5.5.4. Retail Stores
- 5.5.5. Convenience Stores
- 5.6. Western Europe Packaged Coconut Water Market Analysis, Opportunity and Forecast, By Country , 2016-2032
- 5.6.1. Western Europe Packaged Coconut Water Market Analysis by Country : Introduction
- 5.6.2. Market Size Absolute $ Opportunity Analysis and Forecast, Country , 2016-2032
- 5.6.2.1. Germany
- 5.6.2.2. France
- 5.6.2.3. The UK
- 5.6.2.4. Spain
- 5.6.2.5. Italy
- 5.6.2.6. Portugal
- 5.6.2.7. Ireland
- 5.6.2.8. Austria
- 5.6.2.9. Switzerland
- 5.6.2.10. Benelux
- 5.6.2.11. Nordic
- 5.6.2.12. Rest of Western Europe
- 6. Eastern Europe Packaged Coconut Water Market Analysis, Opportunity and Forecast, 2016-2032
- 6.1. Eastern Europe Packaged Coconut Water Market Analysis, 2016-2021
- 6.2. Eastern Europe Packaged Coconut Water Market Opportunity and Forecast, 2023-2032
- 6.3. Eastern Europe Packaged Coconut Water Market Analysis, Opportunity and Forecast, By By Type, 2016-2032
- 6.3.1. Eastern Europe Packaged Coconut Water Market Analysis by By Type: Introduction
- 6.3.2. Market Size Absolute $ Opportunity Analysis and Forecast, By By Type, 2016-2032
- 6.3.3. Pure Coconut Water
- 6.3.4. Mix Coconut Water
- 6.4. Eastern Europe Packaged Coconut Water Market Analysis, Opportunity and Forecast, By By Packaging, 2016-2032
- 6.4.1. Eastern Europe Packaged Coconut Water Market Analysis by By Packaging: Introduction
- 6.4.2. Market Size Absolute $ Opportunity Analysis and Forecast, By By Packaging, 2016-2032
- 6.4.3. Plastic Bottles
- 6.4.4. Tetra Packs
- 6.4.5. Cans
- 6.5. Eastern Europe Packaged Coconut Water Market Analysis, Opportunity and Forecast, By By Distribution Channel, 2016-2032
- 6.5.1. Eastern Europe Packaged Coconut Water Market Analysis by By Distribution Channel: Introduction
- 6.5.2. Market Size Absolute $ Opportunity Analysis and Forecast, By By Distribution Channel, 2016-2032
- 6.5.3. Hypermarkets/Supermarkets
- 6.5.4. Retail Stores
- 6.5.5. Convenience Stores
- 6.6. Eastern Europe Packaged Coconut Water Market Analysis, Opportunity and Forecast, By Country , 2016-2032
- 6.6.1. Eastern Europe Packaged Coconut Water Market Analysis by Country : Introduction
- 6.6.2. Market Size Absolute $ Opportunity Analysis and Forecast, Country , 2016-2032
- 6.6.2.1. Russia
- 6.6.2.2. Poland
- 6.6.2.3. The Czech Republic
- 6.6.2.4. Greece
- 6.6.2.5. Rest of Eastern Europe
- 7. APAC Packaged Coconut Water Market Analysis, Opportunity and Forecast, 2016-2032
- 7.1. APAC Packaged Coconut Water Market Analysis, 2016-2021
- 7.2. APAC Packaged Coconut Water Market Opportunity and Forecast, 2023-2032
- 7.3. APAC Packaged Coconut Water Market Analysis, Opportunity and Forecast, By By Type, 2016-2032
- 7.3.1. APAC Packaged Coconut Water Market Analysis by By Type: Introduction
- 7.3.2. Market Size Absolute $ Opportunity Analysis and Forecast, By By Type, 2016-2032
- 7.3.3. Pure Coconut Water
- 7.3.4. Mix Coconut Water
- 7.4. APAC Packaged Coconut Water Market Analysis, Opportunity and Forecast, By By Packaging, 2016-2032
- 7.4.1. APAC Packaged Coconut Water Market Analysis by By Packaging: Introduction
- 7.4.2. Market Size Absolute $ Opportunity Analysis and Forecast, By By Packaging, 2016-2032
- 7.4.3. Plastic Bottles
- 7.4.4. Tetra Packs
- 7.4.5. Cans
- 7.5. APAC Packaged Coconut Water Market Analysis, Opportunity and Forecast, By By Distribution Channel, 2016-2032
- 7.5.1. APAC Packaged Coconut Water Market Analysis by By Distribution Channel: Introduction
- 7.5.2. Market Size Absolute $ Opportunity Analysis and Forecast, By By Distribution Channel, 2016-2032
- 7.5.3. Hypermarkets/Supermarkets
- 7.5.4. Retail Stores
- 7.5.5. Convenience Stores
- 7.6. APAC Packaged Coconut Water Market Analysis, Opportunity and Forecast, By Country , 2016-2032
- 7.6.1. APAC Packaged Coconut Water Market Analysis by Country : Introduction
- 7.6.2. Market Size Absolute $ Opportunity Analysis and Forecast, Country , 2016-2032
- 7.6.2.1. China
- 7.6.2.2. Japan
- 7.6.2.3. South Korea
- 7.6.2.4. India
- 7.6.2.5. Australia & New Zeland
- 7.6.2.6. Indonesia
- 7.6.2.7. Malaysia
- 7.6.2.8. Philippines
- 7.6.2.9. Singapore
- 7.6.2.10. Thailand
- 7.6.2.11. Vietnam
- 7.6.2.12. Rest of APAC
- 8. Latin America Packaged Coconut Water Market Analysis, Opportunity and Forecast, 2016-2032
- 8.1. Latin America Packaged Coconut Water Market Analysis, 2016-2021
- 8.2. Latin America Packaged Coconut Water Market Opportunity and Forecast, 2023-2032
- 8.3. Latin America Packaged Coconut Water Market Analysis, Opportunity and Forecast, By By Type, 2016-2032
- 8.3.1. Latin America Packaged Coconut Water Market Analysis by By Type: Introduction
- 8.3.2. Market Size Absolute $ Opportunity Analysis and Forecast, By By Type, 2016-2032
- 8.3.3. Pure Coconut Water
- 8.3.4. Mix Coconut Water
- 8.4. Latin America Packaged Coconut Water Market Analysis, Opportunity and Forecast, By By Packaging, 2016-2032
- 8.4.1. Latin America Packaged Coconut Water Market Analysis by By Packaging: Introduction
- 8.4.2. Market Size Absolute $ Opportunity Analysis and Forecast, By By Packaging, 2016-2032
- 8.4.3. Plastic Bottles
- 8.4.4. Tetra Packs
- 8.4.5. Cans
- 8.5. Latin America Packaged Coconut Water Market Analysis, Opportunity and Forecast, By By Distribution Channel, 2016-2032
- 8.5.1. Latin America Packaged Coconut Water Market Analysis by By Distribution Channel: Introduction
- 8.5.2. Market Size Absolute $ Opportunity Analysis and Forecast, By By Distribution Channel, 2016-2032
- 8.5.3. Hypermarkets/Supermarkets
- 8.5.4. Retail Stores
- 8.5.5. Convenience Stores
- 8.6. Latin America Packaged Coconut Water Market Analysis, Opportunity and Forecast, By Country , 2016-2032
- 8.6.1. Latin America Packaged Coconut Water Market Analysis by Country : Introduction
- 8.6.2. Market Size Absolute $ Opportunity Analysis and Forecast, Country , 2016-2032
- 8.6.2.1. Brazil
- 8.6.2.2. Colombia
- 8.6.2.3. Chile
- 8.6.2.4. Argentina
- 8.6.2.5. Costa Rica
- 8.6.2.6. Rest of Latin America
- 9. Middle East & Africa Packaged Coconut Water Market Analysis, Opportunity and Forecast, 2016-2032
- 9.1. Middle East & Africa Packaged Coconut Water Market Analysis, 2016-2021
- 9.2. Middle East & Africa Packaged Coconut Water Market Opportunity and Forecast, 2023-2032
- 9.3. Middle East & Africa Packaged Coconut Water Market Analysis, Opportunity and Forecast, By By Type, 2016-2032
- 9.3.1. Middle East & Africa Packaged Coconut Water Market Analysis by By Type: Introduction
- 9.3.2. Market Size Absolute $ Opportunity Analysis and Forecast, By By Type, 2016-2032
- 9.3.3. Pure Coconut Water
- 9.3.4. Mix Coconut Water
- 9.4. Middle East & Africa Packaged Coconut Water Market Analysis, Opportunity and Forecast, By By Packaging, 2016-2032
- 9.4.1. Middle East & Africa Packaged Coconut Water Market Analysis by By Packaging: Introduction
- 9.4.2. Market Size Absolute $ Opportunity Analysis and Forecast, By By Packaging, 2016-2032
- 9.4.3. Plastic Bottles
- 9.4.4. Tetra Packs
- 9.4.5. Cans
- 9.5. Middle East & Africa Packaged Coconut Water Market Analysis, Opportunity and Forecast, By By Distribution Channel, 2016-2032
- 9.5.1. Middle East & Africa Packaged Coconut Water Market Analysis by By Distribution Channel: Introduction
- 9.5.2. Market Size Absolute $ Opportunity Analysis and Forecast, By By Distribution Channel, 2016-2032
- 9.5.3. Hypermarkets/Supermarkets
- 9.5.4. Retail Stores
- 9.5.5. Convenience Stores
- 9.6. Middle East & Africa Packaged Coconut Water Market Analysis, Opportunity and Forecast, By Country , 2016-2032
- 9.6.1. Middle East & Africa Packaged Coconut Water Market Analysis by Country : Introduction
- 9.6.2. Market Size Absolute $ Opportunity Analysis and Forecast, Country , 2016-2032
- 9.6.2.1. Algeria
- 9.6.2.2. Egypt
- 9.6.2.3. Israel
- 9.6.2.4. Kuwait
- 9.6.2.5. Nigeria
- 9.6.2.6. Saudi Arabia
- 9.6.2.7. South Africa
- 9.6.2.8. Turkey
- 9.6.2.9. The UAE
- 9.6.2.10. Rest of MEA
- 10. Global Packaged Coconut Water Market Analysis, Opportunity and Forecast, By Region , 2016-2032
- 10.1. Global Packaged Coconut Water Market Analysis by Region : Introduction
- 10.2. Market Size Absolute $ Opportunity Analysis and Forecast, By Region , 2016-2032
- 10.2.1. North America
- 10.2.2. Western Europe
- 10.2.3. Eastern Europe
- 10.2.4. APAC
- 10.2.5. Latin America
- 10.2.6. Middle East & Africa
- 11. Global Packaged Coconut Water Market Competitive Landscape, Market Share Analysis, and Company Profiles
- 11.1. Market Share Analysis
- 11.2. Company Profiles
- 11.3. Taste Nirvana
- 11.3.1. Company Overview
- 11.3.2. Financial Highlights
- 11.3.3. Product Portfolio
- 11.3.4. SWOT Analysis
- 11.3.5. Key Strategies and Developments
- 11.4. Bai
- 11.4.1. Company Overview
- 11.4.2. Financial Highlights
- 11.4.3. Product Portfolio
- 11.4.4. SWOT Analysis
- 11.4.5. Key Strategies and Developments
- 11.5. GraceKennedy Group.
- 11.5.1. Company Overview
- 11.5.2. Financial Highlights
- 11.5.3. Product Portfolio
- 11.5.4. SWOT Analysis
- 11.5.5. Key Strategies and Developments
- 11.6. green coco europe GmbH
- 11.6.1. Company Overview
- 11.6.2. Financial Highlights
- 11.6.3. Product Portfolio
- 11.6.4. SWOT Analysis
- 11.6.5. Key Strategies and Developments
- 11.7. COCOJAL
- 11.7.1. Company Overview
- 11.7.2. Financial Highlights
- 11.7.3. Product Portfolio
- 11.7.4. SWOT Analysis
- 11.7.5. Key Strategies and Developments
- 11.8. All Market Inc.
- 11.8.1. Company Overview
- 11.8.2. Financial Highlights
- 11.8.3. Product Portfolio
- 11.8.4. SWOT Analysis
- 11.8.5. Key Strategies and Developments
- 11.9. Amy & Brian Naturals.
- 11.9.1. Company Overview
- 11.9.2. Financial Highlights
- 11.9.3. Product Portfolio
- 11.9.4. SWOT Analysis
- 11.9.5. Key Strategies and Developments
- 11.10. The Coca-Cola Company.
- 11.10.1. Company Overview
- 11.10.2. Financial Highlights
- 11.10.3. Product Portfolio
- 11.10.4. SWOT Analysis
- 11.10.5. Key Strategies and Developments
- 11.11. PepsiCo
- 11.11.1. Company Overview
- 11.11.2. Financial Highlights
- 11.11.3. Product Portfolio
- 11.11.4. SWOT Analysis
- 11.11.5. Key Strategies and Developments
- 11.12. Dabur
- 11.12.1. Company Overview
- 11.12.2. Financial Highlights
- 11.12.3. Product Portfolio
- 11.12.4. SWOT Analysis
- 11.12.5. Key Strategies and Developments
- 11.13. Harmless Harvest
- 11.13.1. Company Overview
- 11.13.2. Financial Highlights
- 11.13.3. Product Portfolio
- 11.13.4. SWOT Analysis
- 11.13.5. Key Strategies and Developments
- 11.14. Exotic Superfoods.
- 11.14.1. Company Overview
- 11.14.2. Financial Highlights
- 11.14.3. Product Portfolio
- 11.14.4. SWOT Analysis
- 11.14.5. Key Strategies and Developments
- 11.15. C2O Pure Coconut Water
- 11.15.1. Company Overview
- 11.15.2. Financial Highlights
- 11.15.3. Product Portfolio
- 11.15.4. SWOT Analysis
- 11.15.5. Key Strategies and Developments
- 11.16. LLC
- 11.16.1. Company Overview
- 11.16.2. Financial Highlights
- 11.16.3. Product Portfolio
- 11.16.4. SWOT Analysis
- 11.16.5. Key Strategies and Developments
- 11.17. National Beverage Corp.
- 11.17.1. Company Overview
- 11.17.2. Financial Highlights
- 11.17.3. Product Portfolio
- 11.17.4. SWOT Analysis
- 11.17.5. Key Strategies and Developments
- 11.18. Purity Organic
- 11.18.1. Company Overview
- 11.18.2. Financial Highlights
- 11.18.3. Product Portfolio
- 11.18.4. SWOT Analysis
- 11.18.5. Key Strategies and Developments
- 11.19. Phalada Pure & Sure
- 11.19.1. Company Overview
- 11.19.2. Financial Highlights
- 11.19.3. Product Portfolio
- 11.19.4. SWOT Analysis
- 11.19.5. Key Strategies and Developments
- 11.20. Rakyan Beverages
- 11.20.1. Company Overview
- 11.20.2. Financial Highlights
- 11.20.3. Product Portfolio
- 11.20.4. SWOT Analysis
- 11.20.5. Key Strategies and Developments
- 11.21. Natures Basket Limited.
- 11.21.1. Company Overview
- 11.21.2. Financial Highlights
- 11.21.3. Product Portfolio
- 11.21.4. SWOT Analysis
- 11.21.5. Key Strategies and Developments
- 11.22. Nature’s Coconut
- 11.22.1. Company Overview
- 11.22.2. Financial Highlights
- 11.22.3. Product Portfolio
- 11.22.4. SWOT Analysis
- 11.22.5. Key Strategies and Developments
- 12. Assumptions and Acronyms
- 13. Research Methodology
- 14. Contact
- List of Figures
- Figure 1: Global Packaged Coconut Water Market Revenue (US$ Mn) Market Share by By Type in 2022
- Figure 2: Global Packaged Coconut Water Market Attractiveness Analysis by By Type, 2016-2032
- Figure 3: Global Packaged Coconut Water Market Revenue (US$ Mn) Market Share by By Packagingin 2022
- Figure 4: Global Packaged Coconut Water Market Attractiveness Analysis by By Packaging, 2016-2032
- Figure 5: Global Packaged Coconut Water Market Revenue (US$ Mn) Market Share by By Distribution Channelin 2022
- Figure 6: Global Packaged Coconut Water Market Attractiveness Analysis by By Distribution Channel, 2016-2032
- Figure 7: Global Packaged Coconut Water Market Revenue (US$ Mn) Market Share by Region in 2022
- Figure 8: Global Packaged Coconut Water Market Attractiveness Analysis by Region, 2016-2032
- Figure 9: Global Packaged Coconut Water Market Revenue (US$ Mn) (2016-2032)
- Figure 10: Global Packaged Coconut Water Market Revenue (US$ Mn) Comparison by Region (2016-2032)
- Figure 11: Global Packaged Coconut Water Market Revenue (US$ Mn) Comparison by By Type (2016-2032)
- Figure 12: Global Packaged Coconut Water Market Revenue (US$ Mn) Comparison by By Packaging (2016-2032)
- Figure 13: Global Packaged Coconut Water Market Revenue (US$ Mn) Comparison by By Distribution Channel (2016-2032)
- Figure 14: Global Packaged Coconut Water Market Y-o-Y Growth Rate Comparison by Region (2016-2032)
- Figure 15: Global Packaged Coconut Water Market Y-o-Y Growth Rate Comparison by By Type (2016-2032)
- Figure 16: Global Packaged Coconut Water Market Y-o-Y Growth Rate Comparison by By Packaging (2016-2032)
- Figure 17: Global Packaged Coconut Water Market Y-o-Y Growth Rate Comparison by By Distribution Channel (2016-2032)
- Figure 18: Global Packaged Coconut Water Market Share Comparison by Region (2016-2032)
- Figure 19: Global Packaged Coconut Water Market Share Comparison by By Type (2016-2032)
- Figure 20: Global Packaged Coconut Water Market Share Comparison by By Packaging (2016-2032)
- Figure 21: Global Packaged Coconut Water Market Share Comparison by By Distribution Channel (2016-2032)
- Figure 22: North America Packaged Coconut Water Market Revenue (US$ Mn) Market Share by By Typein 2022
- Figure 23: North America Packaged Coconut Water Market Attractiveness Analysis by By Type, 2016-2032
- Figure 24: North America Packaged Coconut Water Market Revenue (US$ Mn) Market Share by By Packagingin 2022
- Figure 25: North America Packaged Coconut Water Market Attractiveness Analysis by By Packaging, 2016-2032
- Figure 26: North America Packaged Coconut Water Market Revenue (US$ Mn) Market Share by By Distribution Channelin 2022
- Figure 27: North America Packaged Coconut Water Market Attractiveness Analysis by By Distribution Channel, 2016-2032
- Figure 28: North America Packaged Coconut Water Market Revenue (US$ Mn) Market Share by Country in 2022
- Figure 29: North America Packaged Coconut Water Market Attractiveness Analysis by Country, 2016-2032
- Figure 30: North America Packaged Coconut Water Market Revenue (US$ Mn) (2016-2032)
- Figure 31: North America Packaged Coconut Water Market Revenue (US$ Mn) Comparison by Country (2016-2032)
- Figure 32: North America Packaged Coconut Water Market Revenue (US$ Mn) Comparison by By Type (2016-2032)
- Figure 33: North America Packaged Coconut Water Market Revenue (US$ Mn) Comparison by By Packaging (2016-2032)
- Figure 34: North America Packaged Coconut Water Market Revenue (US$ Mn) Comparison by By Distribution Channel (2016-2032)
- Figure 35: North America Packaged Coconut Water Market Y-o-Y Growth Rate Comparison by Country (2016-2032)
- Figure 36: North America Packaged Coconut Water Market Y-o-Y Growth Rate Comparison by By Type (2016-2032)
- Figure 37: North America Packaged Coconut Water Market Y-o-Y Growth Rate Comparison by By Packaging (2016-2032)
- Figure 38: North America Packaged Coconut Water Market Y-o-Y Growth Rate Comparison by By Distribution Channel (2016-2032)
- Figure 39: North America Packaged Coconut Water Market Share Comparison by Country (2016-2032)
- Figure 40: North America Packaged Coconut Water Market Share Comparison by By Type (2016-2032)
- Figure 41: North America Packaged Coconut Water Market Share Comparison by By Packaging (2016-2032)
- Figure 42: North America Packaged Coconut Water Market Share Comparison by By Distribution Channel (2016-2032)
- Figure 43: Western Europe Packaged Coconut Water Market Revenue (US$ Mn) Market Share by By Typein 2022
- Figure 44: Western Europe Packaged Coconut Water Market Attractiveness Analysis by By Type, 2016-2032
- Figure 45: Western Europe Packaged Coconut Water Market Revenue (US$ Mn) Market Share by By Packagingin 2022
- Figure 46: Western Europe Packaged Coconut Water Market Attractiveness Analysis by By Packaging, 2016-2032
- Figure 47: Western Europe Packaged Coconut Water Market Revenue (US$ Mn) Market Share by By Distribution Channelin 2022
- Figure 48: Western Europe Packaged Coconut Water Market Attractiveness Analysis by By Distribution Channel, 2016-2032
- Figure 49: Western Europe Packaged Coconut Water Market Revenue (US$ Mn) Market Share by Country in 2022
- Figure 50: Western Europe Packaged Coconut Water Market Attractiveness Analysis by Country, 2016-2032
- Figure 51: Western Europe Packaged Coconut Water Market Revenue (US$ Mn) (2016-2032)
- Figure 52: Western Europe Packaged Coconut Water Market Revenue (US$ Mn) Comparison by Country (2016-2032)
- Figure 53: Western Europe Packaged Coconut Water Market Revenue (US$ Mn) Comparison by By Type (2016-2032)
- Figure 54: Western Europe Packaged Coconut Water Market Revenue (US$ Mn) Comparison by By Packaging (2016-2032)
- Figure 55: Western Europe Packaged Coconut Water Market Revenue (US$ Mn) Comparison by By Distribution Channel (2016-2032)
- Figure 56: Western Europe Packaged Coconut Water Market Y-o-Y Growth Rate Comparison by Country (2016-2032)
- Figure 57: Western Europe Packaged Coconut Water Market Y-o-Y Growth Rate Comparison by By Type (2016-2032)
- Figure 58: Western Europe Packaged Coconut Water Market Y-o-Y Growth Rate Comparison by By Packaging (2016-2032)
- Figure 59: Western Europe Packaged Coconut Water Market Y-o-Y Growth Rate Comparison by By Distribution Channel (2016-2032)
- Figure 60: Western Europe Packaged Coconut Water Market Share Comparison by Country (2016-2032)
- Figure 61: Western Europe Packaged Coconut Water Market Share Comparison by By Type (2016-2032)
- Figure 62: Western Europe Packaged Coconut Water Market Share Comparison by By Packaging (2016-2032)
- Figure 63: Western Europe Packaged Coconut Water Market Share Comparison by By Distribution Channel (2016-2032)
- Figure 64: Eastern Europe Packaged Coconut Water Market Revenue (US$ Mn) Market Share by By Typein 2022
- Figure 65: Eastern Europe Packaged Coconut Water Market Attractiveness Analysis by By Type, 2016-2032
- Figure 66: Eastern Europe Packaged Coconut Water Market Revenue (US$ Mn) Market Share by By Packagingin 2022
- Figure 67: Eastern Europe Packaged Coconut Water Market Attractiveness Analysis by By Packaging, 2016-2032
- Figure 68: Eastern Europe Packaged Coconut Water Market Revenue (US$ Mn) Market Share by By Distribution Channelin 2022
- Figure 69: Eastern Europe Packaged Coconut Water Market Attractiveness Analysis by By Distribution Channel, 2016-2032
- Figure 70: Eastern Europe Packaged Coconut Water Market Revenue (US$ Mn) Market Share by Country in 2022
- Figure 71: Eastern Europe Packaged Coconut Water Market Attractiveness Analysis by Country, 2016-2032
- Figure 72: Eastern Europe Packaged Coconut Water Market Revenue (US$ Mn) (2016-2032)
- Figure 73: Eastern Europe Packaged Coconut Water Market Revenue (US$ Mn) Comparison by Country (2016-2032)
- Figure 74: Eastern Europe Packaged Coconut Water Market Revenue (US$ Mn) Comparison by By Type (2016-2032)
- Figure 75: Eastern Europe Packaged Coconut Water Market Revenue (US$ Mn) Comparison by By Packaging (2016-2032)
- Figure 76: Eastern Europe Packaged Coconut Water Market Revenue (US$ Mn) Comparison by By Distribution Channel (2016-2032)
- Figure 77: Eastern Europe Packaged Coconut Water Market Y-o-Y Growth Rate Comparison by Country (2016-2032)
- Figure 78: Eastern Europe Packaged Coconut Water Market Y-o-Y Growth Rate Comparison by By Type (2016-2032)
- Figure 79: Eastern Europe Packaged Coconut Water Market Y-o-Y Growth Rate Comparison by By Packaging (2016-2032)
- Figure 80: Eastern Europe Packaged Coconut Water Market Y-o-Y Growth Rate Comparison by By Distribution Channel (2016-2032)
- Figure 81: Eastern Europe Packaged Coconut Water Market Share Comparison by Country (2016-2032)
- Figure 82: Eastern Europe Packaged Coconut Water Market Share Comparison by By Type (2016-2032)
- Figure 83: Eastern Europe Packaged Coconut Water Market Share Comparison by By Packaging (2016-2032)
- Figure 84: Eastern Europe Packaged Coconut Water Market Share Comparison by By Distribution Channel (2016-2032)
- Figure 85: APAC Packaged Coconut Water Market Revenue (US$ Mn) Market Share by By Typein 2022
- Figure 86: APAC Packaged Coconut Water Market Attractiveness Analysis by By Type, 2016-2032
- Figure 87: APAC Packaged Coconut Water Market Revenue (US$ Mn) Market Share by By Packagingin 2022
- Figure 88: APAC Packaged Coconut Water Market Attractiveness Analysis by By Packaging, 2016-2032
- Figure 89: APAC Packaged Coconut Water Market Revenue (US$ Mn) Market Share by By Distribution Channelin 2022
- Figure 90: APAC Packaged Coconut Water Market Attractiveness Analysis by By Distribution Channel, 2016-2032
- Figure 91: APAC Packaged Coconut Water Market Revenue (US$ Mn) Market Share by Country in 2022
- Figure 92: APAC Packaged Coconut Water Market Attractiveness Analysis by Country, 2016-2032
- Figure 93: APAC Packaged Coconut Water Market Revenue (US$ Mn) (2016-2032)
- Figure 94: APAC Packaged Coconut Water Market Revenue (US$ Mn) Comparison by Country (2016-2032)
- Figure 95: APAC Packaged Coconut Water Market Revenue (US$ Mn) Comparison by By Type (2016-2032)
- Figure 96: APAC Packaged Coconut Water Market Revenue (US$ Mn) Comparison by By Packaging (2016-2032)
- Figure 97: APAC Packaged Coconut Water Market Revenue (US$ Mn) Comparison by By Distribution Channel (2016-2032)
- Figure 98: APAC Packaged Coconut Water Market Y-o-Y Growth Rate Comparison by Country (2016-2032)
- Figure 99: APAC Packaged Coconut Water Market Y-o-Y Growth Rate Comparison by By Type (2016-2032)
- Figure 100: APAC Packaged Coconut Water Market Y-o-Y Growth Rate Comparison by By Packaging (2016-2032)
- Figure 101: APAC Packaged Coconut Water Market Y-o-Y Growth Rate Comparison by By Distribution Channel (2016-2032)
- Figure 102: APAC Packaged Coconut Water Market Share Comparison by Country (2016-2032)
- Figure 103: APAC Packaged Coconut Water Market Share Comparison by By Type (2016-2032)
- Figure 104: APAC Packaged Coconut Water Market Share Comparison by By Packaging (2016-2032)
- Figure 105: APAC Packaged Coconut Water Market Share Comparison by By Distribution Channel (2016-2032)
- Figure 106: Latin America Packaged Coconut Water Market Revenue (US$ Mn) Market Share by By Typein 2022
- Figure 107: Latin America Packaged Coconut Water Market Attractiveness Analysis by By Type, 2016-2032
- Figure 108: Latin America Packaged Coconut Water Market Revenue (US$ Mn) Market Share by By Packagingin 2022
- Figure 109: Latin America Packaged Coconut Water Market Attractiveness Analysis by By Packaging, 2016-2032
- Figure 110: Latin America Packaged Coconut Water Market Revenue (US$ Mn) Market Share by By Distribution Channelin 2022
- Figure 111: Latin America Packaged Coconut Water Market Attractiveness Analysis by By Distribution Channel, 2016-2032
- Figure 112: Latin America Packaged Coconut Water Market Revenue (US$ Mn) Market Share by Country in 2022
- Figure 113: Latin America Packaged Coconut Water Market Attractiveness Analysis by Country, 2016-2032
- Figure 114: Latin America Packaged Coconut Water Market Revenue (US$ Mn) (2016-2032)
- Figure 115: Latin America Packaged Coconut Water Market Revenue (US$ Mn) Comparison by Country (2016-2032)
- Figure 116: Latin America Packaged Coconut Water Market Revenue (US$ Mn) Comparison by By Type (2016-2032)
- Figure 117: Latin America Packaged Coconut Water Market Revenue (US$ Mn) Comparison by By Packaging (2016-2032)
- Figure 118: Latin America Packaged Coconut Water Market Revenue (US$ Mn) Comparison by By Distribution Channel (2016-2032)
- Figure 119: Latin America Packaged Coconut Water Market Y-o-Y Growth Rate Comparison by Country (2016-2032)
- Figure 120: Latin America Packaged Coconut Water Market Y-o-Y Growth Rate Comparison by By Type (2016-2032)
- Figure 121: Latin America Packaged Coconut Water Market Y-o-Y Growth Rate Comparison by By Packaging (2016-2032)
- Figure 122: Latin America Packaged Coconut Water Market Y-o-Y Growth Rate Comparison by By Distribution Channel (2016-2032)
- Figure 123: Latin America Packaged Coconut Water Market Share Comparison by Country (2016-2032)
- Figure 124: Latin America Packaged Coconut Water Market Share Comparison by By Type (2016-2032)
- Figure 125: Latin America Packaged Coconut Water Market Share Comparison by By Packaging (2016-2032)
- Figure 126: Latin America Packaged Coconut Water Market Share Comparison by By Distribution Channel (2016-2032)
- Figure 127: Middle East & Africa Packaged Coconut Water Market Revenue (US$ Mn) Market Share by By Typein 2022
- Figure 128: Middle East & Africa Packaged Coconut Water Market Attractiveness Analysis by By Type, 2016-2032
- Figure 129: Middle East & Africa Packaged Coconut Water Market Revenue (US$ Mn) Market Share by By Packagingin 2022
- Figure 130: Middle East & Africa Packaged Coconut Water Market Attractiveness Analysis by By Packaging, 2016-2032
- Figure 131: Middle East & Africa Packaged Coconut Water Market Revenue (US$ Mn) Market Share by By Distribution Channelin 2022
- Figure 132: Middle East & Africa Packaged Coconut Water Market Attractiveness Analysis by By Distribution Channel, 2016-2032
- Figure 133: Middle East & Africa Packaged Coconut Water Market Revenue (US$ Mn) Market Share by Country in 2022
- Figure 134: Middle East & Africa Packaged Coconut Water Market Attractiveness Analysis by Country, 2016-2032
- Figure 135: Middle East & Africa Packaged Coconut Water Market Revenue (US$ Mn) (2016-2032)
- Figure 136: Middle East & Africa Packaged Coconut Water Market Revenue (US$ Mn) Comparison by Country (2016-2032)
- Figure 137: Middle East & Africa Packaged Coconut Water Market Revenue (US$ Mn) Comparison by By Type (2016-2032)
- Figure 138: Middle East & Africa Packaged Coconut Water Market Revenue (US$ Mn) Comparison by By Packaging (2016-2032)
- Figure 139: Middle East & Africa Packaged Coconut Water Market Revenue (US$ Mn) Comparison by By Distribution Channel (2016-2032)
- Figure 140: Middle East & Africa Packaged Coconut Water Market Y-o-Y Growth Rate Comparison by Country (2016-2032)
- Figure 141: Middle East & Africa Packaged Coconut Water Market Y-o-Y Growth Rate Comparison by By Type (2016-2032)
- Figure 142: Middle East & Africa Packaged Coconut Water Market Y-o-Y Growth Rate Comparison by By Packaging (2016-2032)
- Figure 143: Middle East & Africa Packaged Coconut Water Market Y-o-Y Growth Rate Comparison by By Distribution Channel (2016-2032)
- Figure 144: Middle East & Africa Packaged Coconut Water Market Share Comparison by Country (2016-2032)
- Figure 145: Middle East & Africa Packaged Coconut Water Market Share Comparison by By Type (2016-2032)
- Figure 146: Middle East & Africa Packaged Coconut Water Market Share Comparison by By Packaging (2016-2032)
- Figure 147: Middle East & Africa Packaged Coconut Water Market Share Comparison by By Distribution Channel (2016-2032)
List of Tables
- Table 1: Global Packaged Coconut Water Market Comparison by By Type (2016-2032)
- Table 2: Global Packaged Coconut Water Market Comparison by By Packaging (2016-2032)
- Table 3: Global Packaged Coconut Water Market Comparison by By Distribution Channel (2016-2032)
- Table 4: Global Packaged Coconut Water Market Revenue (US$ Mn) Comparison by Region (2016-2032)
- Table 5: Global Packaged Coconut Water Market Revenue (US$ Mn) (2016-2032)
- Table 6: Global Packaged Coconut Water Market Revenue (US$ Mn) Comparison by Region (2016-2032)
- Table 7: Global Packaged Coconut Water Market Revenue (US$ Mn) Comparison by By Type (2016-2032)
- Table 8: Global Packaged Coconut Water Market Revenue (US$ Mn) Comparison by By Packaging (2016-2032)
- Table 9: Global Packaged Coconut Water Market Revenue (US$ Mn) Comparison by By Distribution Channel (2016-2032)
- Table 10: Global Packaged Coconut Water Market Y-o-Y Growth Rate Comparison by Region (2016-2032)
- Table 11: Global Packaged Coconut Water Market Y-o-Y Growth Rate Comparison by By Type (2016-2032)
- Table 12: Global Packaged Coconut Water Market Y-o-Y Growth Rate Comparison by By Packaging (2016-2032)
- Table 13: Global Packaged Coconut Water Market Y-o-Y Growth Rate Comparison by By Distribution Channel (2016-2032)
- Table 14: Global Packaged Coconut Water Market Share Comparison by Region (2016-2032)
- Table 15: Global Packaged Coconut Water Market Share Comparison by By Type (2016-2032)
- Table 16: Global Packaged Coconut Water Market Share Comparison by By Packaging (2016-2032)
- Table 17: Global Packaged Coconut Water Market Share Comparison by By Distribution Channel (2016-2032)
- Table 18: North America Packaged Coconut Water Market Comparison by By Packaging (2016-2032)
- Table 19: North America Packaged Coconut Water Market Comparison by By Distribution Channel (2016-2032)
- Table 20: North America Packaged Coconut Water Market Revenue (US$ Mn) Comparison by Country (2016-2032)
- Table 21: North America Packaged Coconut Water Market Revenue (US$ Mn) (2016-2032)
- Table 22: North America Packaged Coconut Water Market Revenue (US$ Mn) Comparison by Country (2016-2032)
- Table 23: North America Packaged Coconut Water Market Revenue (US$ Mn) Comparison by By Type (2016-2032)
- Table 24: North America Packaged Coconut Water Market Revenue (US$ Mn) Comparison by By Packaging (2016-2032)
- Table 25: North America Packaged Coconut Water Market Revenue (US$ Mn) Comparison by By Distribution Channel (2016-2032)
- Table 26: North America Packaged Coconut Water Market Y-o-Y Growth Rate Comparison by Country (2016-2032)
- Table 27: North America Packaged Coconut Water Market Y-o-Y Growth Rate Comparison by By Type (2016-2032)
- Table 28: North America Packaged Coconut Water Market Y-o-Y Growth Rate Comparison by By Packaging (2016-2032)
- Table 29: North America Packaged Coconut Water Market Y-o-Y Growth Rate Comparison by By Distribution Channel (2016-2032)
- Table 30: North America Packaged Coconut Water Market Share Comparison by Country (2016-2032)
- Table 31: North America Packaged Coconut Water Market Share Comparison by By Type (2016-2032)
- Table 32: North America Packaged Coconut Water Market Share Comparison by By Packaging (2016-2032)
- Table 33: North America Packaged Coconut Water Market Share Comparison by By Distribution Channel (2016-2032)
- Table 34: Western Europe Packaged Coconut Water Market Comparison by By Type (2016-2032)
- Table 35: Western Europe Packaged Coconut Water Market Comparison by By Packaging (2016-2032)
- Table 36: Western Europe Packaged Coconut Water Market Comparison by By Distribution Channel (2016-2032)
- Table 37: Western Europe Packaged Coconut Water Market Revenue (US$ Mn) Comparison by Country (2016-2032)
- Table 38: Western Europe Packaged Coconut Water Market Revenue (US$ Mn) (2016-2032)
- Table 39: Western Europe Packaged Coconut Water Market Revenue (US$ Mn) Comparison by Country (2016-2032)
- Table 40: Western Europe Packaged Coconut Water Market Revenue (US$ Mn) Comparison by By Type (2016-2032)
- Table 41: Western Europe Packaged Coconut Water Market Revenue (US$ Mn) Comparison by By Packaging (2016-2032)
- Table 42: Western Europe Packaged Coconut Water Market Revenue (US$ Mn) Comparison by By Distribution Channel (2016-2032)
- Table 43: Western Europe Packaged Coconut Water Market Y-o-Y Growth Rate Comparison by Country (2016-2032)
- Table 44: Western Europe Packaged Coconut Water Market Y-o-Y Growth Rate Comparison by By Type (2016-2032)
- Table 45: Western Europe Packaged Coconut Water Market Y-o-Y Growth Rate Comparison by By Packaging (2016-2032)
- Table 46: Western Europe Packaged Coconut Water Market Y-o-Y Growth Rate Comparison by By Distribution Channel (2016-2032)
- Table 47: Western Europe Packaged Coconut Water Market Share Comparison by Country (2016-2032)
- Table 48: Western Europe Packaged Coconut Water Market Share Comparison by By Type (2016-2032)
- Table 49: Western Europe Packaged Coconut Water Market Share Comparison by By Packaging (2016-2032)
- Table 50: Western Europe Packaged Coconut Water Market Share Comparison by By Distribution Channel (2016-2032)
- Table 51: Eastern Europe Packaged Coconut Water Market Comparison by By Type (2016-2032)
- Table 52: Eastern Europe Packaged Coconut Water Market Comparison by By Packaging (2016-2032)
- Table 53: Eastern Europe Packaged Coconut Water Market Comparison by By Distribution Channel (2016-2032)
- Table 54: Eastern Europe Packaged Coconut Water Market Revenue (US$ Mn) Comparison by Country (2016-2032)
- Table 55: Eastern Europe Packaged Coconut Water Market Revenue (US$ Mn) (2016-2032)
- Table 56: Eastern Europe Packaged Coconut Water Market Revenue (US$ Mn) Comparison by Country (2016-2032)
- Table 57: Eastern Europe Packaged Coconut Water Market Revenue (US$ Mn) Comparison by By Type (2016-2032)
- Table 58: Eastern Europe Packaged Coconut Water Market Revenue (US$ Mn) Comparison by By Packaging (2016-2032)
- Table 59: Eastern Europe Packaged Coconut Water Market Revenue (US$ Mn) Comparison by By Distribution Channel (2016-2032)
- Table 60: Eastern Europe Packaged Coconut Water Market Y-o-Y Growth Rate Comparison by Country (2016-2032)
- Table 61: Eastern Europe Packaged Coconut Water Market Y-o-Y Growth Rate Comparison by By Type (2016-2032)
- Table 62: Eastern Europe Packaged Coconut Water Market Y-o-Y Growth Rate Comparison by By Packaging (2016-2032)
- Table 63: Eastern Europe Packaged Coconut Water Market Y-o-Y Growth Rate Comparison by By Distribution Channel (2016-2032)
- Table 64: Eastern Europe Packaged Coconut Water Market Share Comparison by Country (2016-2032)
- Table 65: Eastern Europe Packaged Coconut Water Market Share Comparison by By Type (2016-2032)
- Table 66: Eastern Europe Packaged Coconut Water Market Share Comparison by By Packaging (2016-2032)
- Table 67: Eastern Europe Packaged Coconut Water Market Share Comparison by By Distribution Channel (2016-2032)
- Table 68: APAC Packaged Coconut Water Market Comparison by By Type (2016-2032)
- Table 69: APAC Packaged Coconut Water Market Comparison by By Packaging (2016-2032)
- Table 70: APAC Packaged Coconut Water Market Comparison by By Distribution Channel (2016-2032)
- Table 71: APAC Packaged Coconut Water Market Revenue (US$ Mn) Comparison by Country (2016-2032)
- Table 72: APAC Packaged Coconut Water Market Revenue (US$ Mn) (2016-2032)
- Table 73: APAC Packaged Coconut Water Market Revenue (US$ Mn) Comparison by Country (2016-2032)
- Table 74: APAC Packaged Coconut Water Market Revenue (US$ Mn) Comparison by By Type (2016-2032)
- Table 75: APAC Packaged Coconut Water Market Revenue (US$ Mn) Comparison by By Packaging (2016-2032)
- Table 76: APAC Packaged Coconut Water Market Revenue (US$ Mn) Comparison by By Distribution Channel (2016-2032)
- Table 77: APAC Packaged Coconut Water Market Y-o-Y Growth Rate Comparison by Country (2016-2032)
- Table 78: APAC Packaged Coconut Water Market Y-o-Y Growth Rate Comparison by By Type (2016-2032)
- Table 79: APAC Packaged Coconut Water Market Y-o-Y Growth Rate Comparison by By Packaging (2016-2032)
- Table 80: APAC Packaged Coconut Water Market Y-o-Y Growth Rate Comparison by By Distribution Channel (2016-2032)
- Table 81: APAC Packaged Coconut Water Market Share Comparison by Country (2016-2032)
- Table 82: APAC Packaged Coconut Water Market Share Comparison by By Type (2016-2032)
- Table 83: APAC Packaged Coconut Water Market Share Comparison by By Packaging (2016-2032)
- Table 84: APAC Packaged Coconut Water Market Share Comparison by By Distribution Channel (2016-2032)
- Table 85: Latin America Packaged Coconut Water Market Comparison by By Type (2016-2032)
- Table 86: Latin America Packaged Coconut Water Market Comparison by By Packaging (2016-2032)
- Table 87: Latin America Packaged Coconut Water Market Comparison by By Distribution Channel (2016-2032)
- Table 88: Latin America Packaged Coconut Water Market Revenue (US$ Mn) Comparison by Country (2016-2032)
- Table 89: Latin America Packaged Coconut Water Market Revenue (US$ Mn) (2016-2032)
- Table 90: Latin America Packaged Coconut Water Market Revenue (US$ Mn) Comparison by Country (2016-2032)
- Table 91: Latin America Packaged Coconut Water Market Revenue (US$ Mn) Comparison by By Type (2016-2032)
- Table 92: Latin America Packaged Coconut Water Market Revenue (US$ Mn) Comparison by By Packaging (2016-2032)
- Table 93: Latin America Packaged Coconut Water Market Revenue (US$ Mn) Comparison by By Distribution Channel (2016-2032)
- Table 94: Latin America Packaged Coconut Water Market Y-o-Y Growth Rate Comparison by Country (2016-2032)
- Table 95: Latin America Packaged Coconut Water Market Y-o-Y Growth Rate Comparison by By Type (2016-2032)
- Table 96: Latin America Packaged Coconut Water Market Y-o-Y Growth Rate Comparison by By Packaging (2016-2032)
- Table 97: Latin America Packaged Coconut Water Market Y-o-Y Growth Rate Comparison by By Distribution Channel (2016-2032)
- Table 98: Latin America Packaged Coconut Water Market Share Comparison by Country (2016-2032)
- Table 99: Latin America Packaged Coconut Water Market Share Comparison by By Type (2016-2032)
- Table 100: Latin America Packaged Coconut Water Market Share Comparison by By Packaging (2016-2032)
- Table 101: Latin America Packaged Coconut Water Market Share Comparison by By Distribution Channel (2016-2032)
- Table 102: Middle East & Africa Packaged Coconut Water Market Comparison by By Type (2016-2032)
- Table 103: Middle East & Africa Packaged Coconut Water Market Comparison by By Packaging (2016-2032)
- Table 104: Middle East & Africa Packaged Coconut Water Market Comparison by By Distribution Channel (2016-2032)
- Table 105: Middle East & Africa Packaged Coconut Water Market Revenue (US$ Mn) Comparison by Country (2016-2032)
- Table 106: Middle East & Africa Packaged Coconut Water Market Revenue (US$ Mn) (2016-2032)
- Table 107: Middle East & Africa Packaged Coconut Water Market Revenue (US$ Mn) Comparison by Country (2016-2032)
- Table 108: Middle East & Africa Packaged Coconut Water Market Revenue (US$ Mn) Comparison by By Type (2016-2032)
- Table 109: Middle East & Africa Packaged Coconut Water Market Revenue (US$ Mn) Comparison by By Packaging (2016-2032)
- Table 110: Middle East & Africa Packaged Coconut Water Market Revenue (US$ Mn) Comparison by By Distribution Channel (2016-2032)
- Table 111: Middle East & Africa Packaged Coconut Water Market Y-o-Y Growth Rate Comparison by Country (2016-2032)
- Table 112: Middle East & Africa Packaged Coconut Water Market Y-o-Y Growth Rate Comparison by By Type (2016-2032)
- Table 113: Middle East & Africa Packaged Coconut Water Market Y-o-Y Growth Rate Comparison by By Packaging (2016-2032)
- Table 114: Middle East & Africa Packaged Coconut Water Market Y-o-Y Growth Rate Comparison by By Distribution Channel (2016-2032)
- Table 115: Middle East & Africa Packaged Coconut Water Market Share Comparison by Country (2016-2032)
- Table 116: Middle East & Africa Packaged Coconut Water Market Share Comparison by By Type (2016-2032)
- Table 117: Middle East & Africa Packaged Coconut Water Market Share Comparison by By Packaging (2016-2032)
- Table 118: Middle East & Africa Packaged Coconut Water Market Share Comparison by By Distribution Channel (2016-2032)
- 1. Executive Summary
-
- Taste Nirvana
- Bai
- GraceKennedy Group.
- green coco europe GmbH
- COCOJAL
- All Market Inc.
- Amy & Brian Naturals.
- The Coca-Cola Company.
- PepsiCo
- Dabur
- Harmless Harvest
- Exotic Superfoods.
- C2O Pure Coconut Water
- LLC
- National Beverage Corp.
- Purity Organic
- Phalada Pure & Sure
- Rakyan Beverages
- Natures Basket Limited.
- Nature’s Coconut
Our Clients


View Our Licence Options
