
Global Ophthalmic Drugs Market By Disease(Eye Allergy, Eye Infection, Glaucoma, Retinal Disorders, Dry Eye, Others), By Drug Class(Anti-Allergy, Anti-Inflammatory, Antiglaucoma, Anti-VEGF Agents), By Dosage(Eye Solutions, Gels, Capsules, Eye Drops, Ointments), By Administration(Systematic, Topical, Local Ocular), By Product(Prescription Drugs, Over-the-Counter-Drugs), By Region And Companies - Industry Segment Outlook, Market Assessment, Competition Scenario, Trends, And Forecast 2024-2033
-
8170
-
June 2024
-
300
-


-
This report was compiled by Trishita Deb Trishita Deb is an experienced market research and consulting professional with over 7 years of expertise across healthcare, consumer goods, and materials, contributing to over 400 healthcare-related reports. Correspondence Team Lead- Healthcare Linkedin | Detailed Market research Methodology Our methodology involves a mix of primary research, including interviews with leading mental health experts, and secondary research from reputable medical journals and databases. View Detailed Methodology Page
-
Quick Navigation
Report Overview
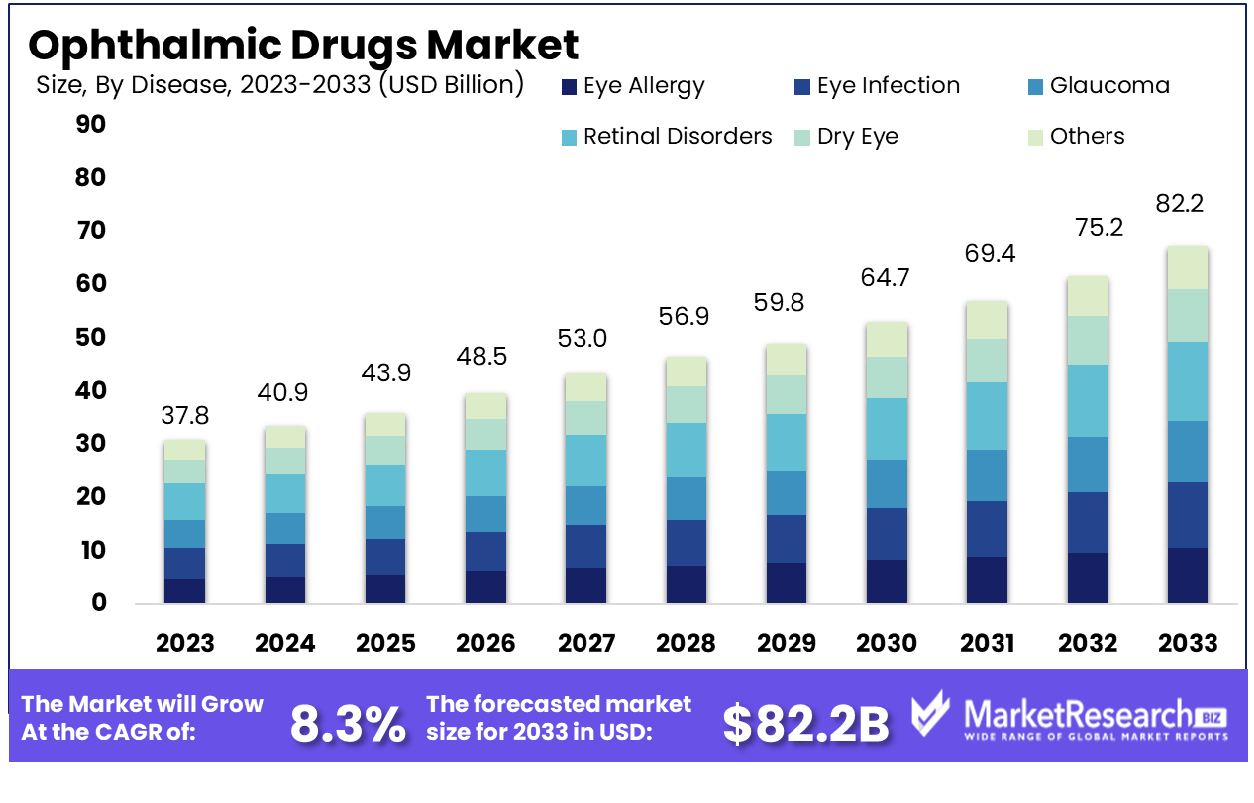
The Global Ophthalmic Drugs Market was valued at USD 37.8 billion in 2023. It is expected to reach USD 82.2 billion by 2033, with a CAGR of 8.3% during the forecast period from 2024 to 2033.
The Ophthalmic Drugs Market refers to the segment of the pharmaceutical industry dedicated to medications specifically formulated for treating eye conditions and diseases. These drugs encompass a wide range of therapeutic agents, including antibiotics, anti-inflammatory drugs, antiviral medications, and various formulations to treat glaucoma, dry eye syndrome, and other ophthalmic disorders.
As the demand for effective eye care solutions grows with an aging population and the increasing prevalence of chronic eye diseases globally, pharmaceutical companies focus on developing innovative formulations and delivery systems. Market growth is driven by advancements in drug efficacy, patient compliance, and expanding healthcare access, particularly in emerging economies.
The global market for ophthalmic drugs continues to evolve dynamically, driven by a significant burden of age-related macular degeneration (AMD) worldwide. Age-related macular degeneration, affecting nearly 20 million adults in the U.S. alone, has seen a notable increase in diagnosed cases, underscoring the escalating prevalence of this condition.
Recent estimates indicate approximately 18 million individuals aged 40 and above were living with early-stage AMD in 2019, with an additional 1.49 million experiencing late-stage manifestations. Globally, around 200 million people are currently afflicted with AMD, a figure anticipated to surge to 288 million by 2040.
In the United States, which represented approximately 15% of the total prevalent cases of AMD across key markets in 2021, the demand for effective therapeutic interventions remains robust. Market dynamics are notably influenced by the dominance of Bayer/Regeneron's Eylea, which commanded over 76% of sales within the U.S. market last year. Roche/Genentech's Lucentis and Roche's Avastin followed closely, occupying significant market shares as well.
These statistics underscore a pivotal period of growth and innovation within the ophthalmic drugs sector, characterized by intensifying research efforts and strategic market expansions. The evolving demographic landscape and advancing healthcare infrastructures worldwide further propel opportunities for pharmaceutical advancements targeting AMD and other prevalent ocular conditions.
As stakeholders navigate this competitive landscape, strategic partnerships, regulatory advancements, and innovative drug development initiatives will be pivotal in shaping the market's trajectory moving forward.
Key Takeaways
- Market Growth: The Global Ophthalmic Drugs Market was valued at USD 37.8 billion in 2023. It is expected to reach USD 82.2 billion by 2033, with a CAGR of 8.3% during the forecast period from 2024 to 2033.
- By Disease: Retinal disorders account for 34% of disease-related concerns in ophthalmology.
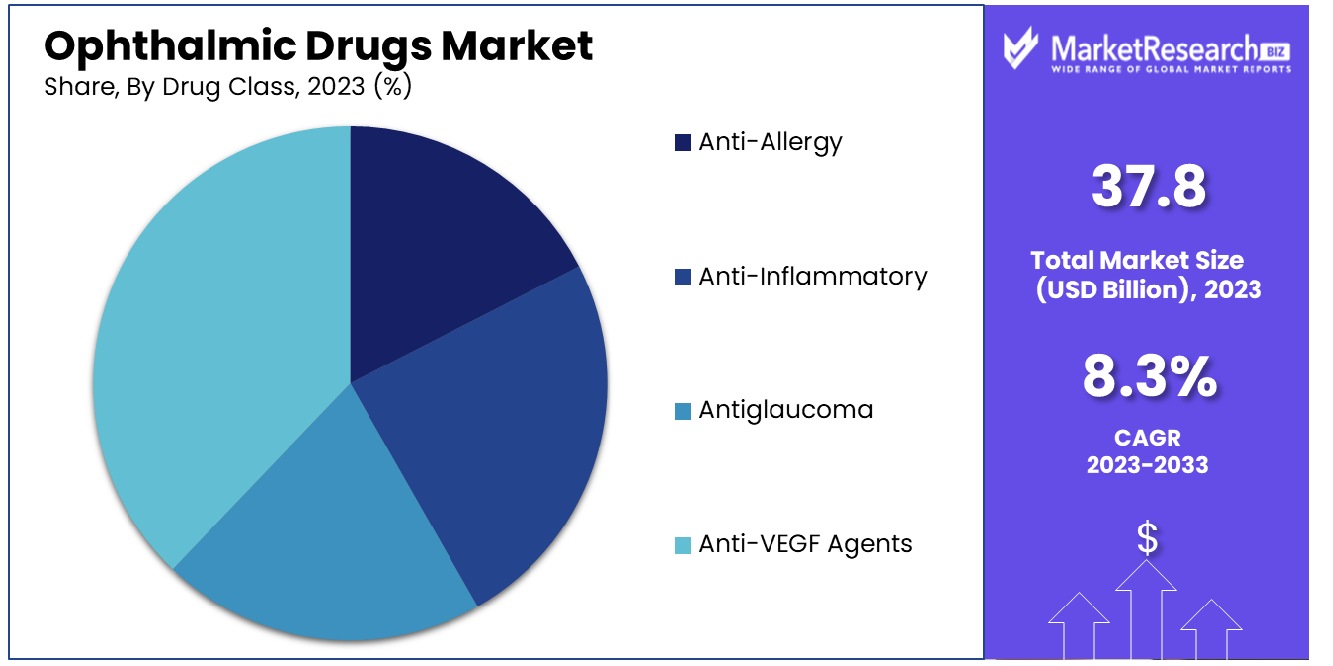
- By Drug Class: Anti-VEGF agents hold a dominant share of 32% in pharmaceutical treatments.
- By Dosage: Eye drops constitute the preferred dosage form, leading with a 35% share.
- By Administration: Topical administration leads significantly with a dominant share of 65%.
- By Product: Prescription drugs top the product category, commanding a substantial 61% share.
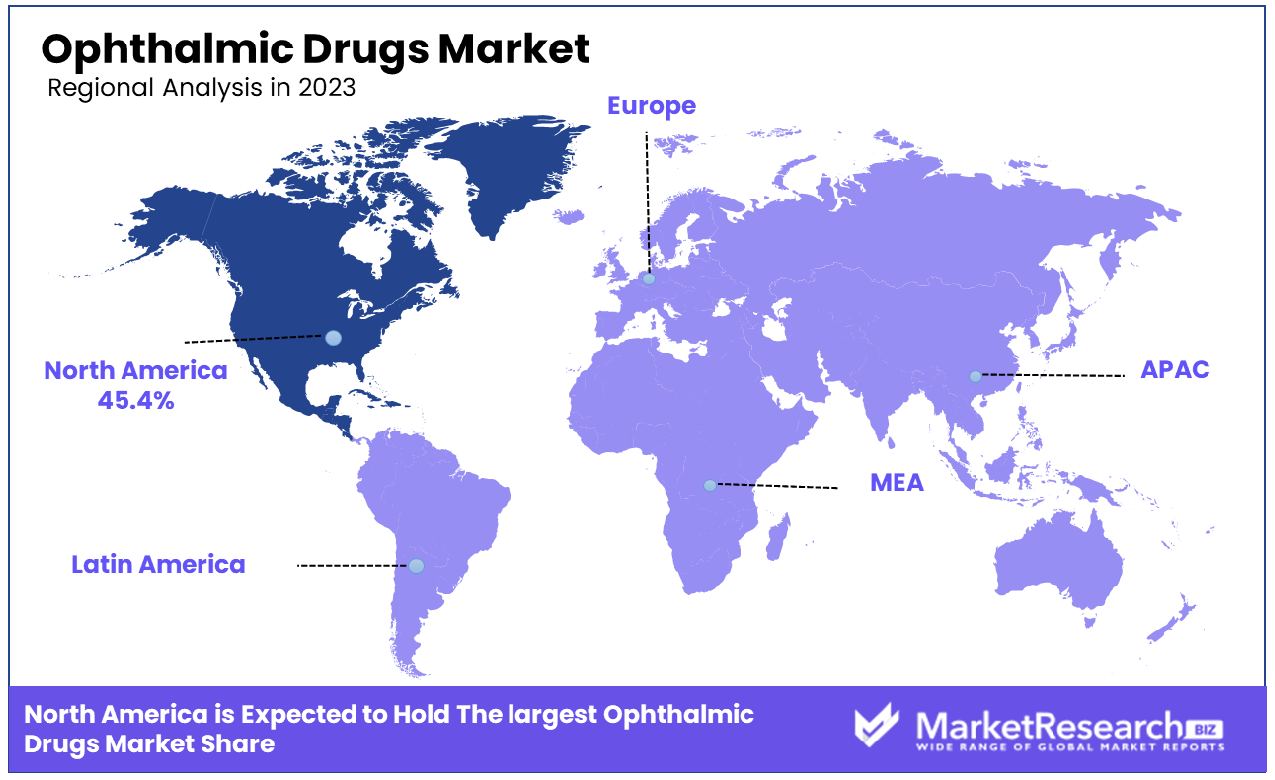
- Regional Dominance: In North America, the ophthalmic drugs market holds a dominant 45.4% share.
- Growth Opportunity: The 2023 global ophthalmic drugs market shows promising growth prospects with a robust pipeline of innovative drug candidates in clinical trials and advancements in drug delivery technologies enhancing treatment effectiveness.
Driving factors
Rising Burden of Eye-related Disorders
The escalating burden of eye-related disorders worldwide significantly propels the growth of the Ophthalmic Drugs Market. According to recent statistics, the prevalence of conditions such as glaucoma, age-related macular degeneration (AMD), and diabetic retinopathy is on the rise globally.
This demographic trend underscores a pressing need for effective therapeutic interventions, thereby expanding the market for ophthalmic drugs. Pharmaceutical advancements targeting specific eye ailments are pivotal in meeting this demand surge.
Increasing Prevalence of Eye Disorders
The increasing prevalence of eye disorders, influenced by aging populations and changing lifestyles, serves as a primary driver for the Ophthalmic Drugs Market. With a growing number of individuals affected by conditions like dry eye syndrome and cataracts, there is a heightened demand for pharmaceutical solutions that alleviate symptoms and improve quality of life. Market growth is further bolstered by ongoing research into novel drug formulations and delivery methods tailored to address diverse patient needs.
Growing Demand for Advanced Treatment Options
The Ophthalmic Drugs Market experiences robust growth due to a burgeoning demand for advanced treatment options. Patients and healthcare providers increasingly seek therapies that offer enhanced efficacy, reduced side effects, and convenient administration.
This shift towards more sophisticated treatments, including biologics and sustained-release formulations, drives innovation and market expansion. Pharmaceutical companies are responding with investments in research and development to capitalize on this evolving landscape of patient care preferences.
Restraining Factors
High Cost of Ophthalmic Drugs
The high cost of ophthalmic drugs poses a significant barrier to market growth, particularly impacting accessibility in developing regions. Statistics indicate that the expense of specialized eye medications can limit affordability for patients and strain healthcare budgets.
This financial constraint inhibits market penetration and adoption rates, particularly for novel therapies targeting complex eye conditions. Addressing cost-effectiveness through pricing strategies and regional partnerships becomes crucial to mitigate these challenges and expand market reach.
Stringent Regulatory Requirements and Lengthy Approval Process
Stringent regulatory requirements and lengthy drug approval processes critically influence the growth trajectory of the Ophthalmic Drugs Market. Regulatory bodies impose rigorous standards to ensure the safety, efficacy, and quality of ophthalmic medications, contributing to extended timelines from research to market entry.
These stringent regulations increase development costs and delay commercialization, thereby impacting profitability and market competitiveness. Collaborative efforts between pharmaceutical companies and regulatory agencies are essential to streamline approval pathways and accelerate market access for innovative treatments.
By Disease Analysis
Retinal disorders account for 34% of disease-related issues in ophthalmology and optometry practices worldwide.
In 2023, Retinal Disorders held a dominant market position in the By Disease segment of the Ophthalmic Drugs Market, capturing more than a 34% share. The significant market share of Retinal Disorders can be attributed to the rising prevalence of diseases such as age-related macular degeneration (AMD) and diabetic retinopathy globally. These conditions have spurred the demand for specialized ophthalmic drugs designed to treat and manage retinal disorders effectively.
Eye Allergy treatments followed closely, constituting a substantial portion of the market with a notable focus on antihistamines and mast cell stabilizers to alleviate symptoms like itching and redness. The segment benefited from increasing environmental allergens and pollution levels contributing to higher incidence rates.
Glaucoma treatments maintained a robust presence, driven by the aging population and the chronic nature of the disease, necessitating long-term pharmaceutical interventions to manage intraocular pressure. Innovations in sustained-release formulations and combination therapies further supported market growth.
Dry Eye treatments saw advancements in formulations targeting both aqueous-deficient and evaporative types, catering to a growing patient pool affected by lifestyle factors and environmental conditions. The segment witnessed investments in novel lubricants and anti-inflammatory agents to address varying severity levels.
Other segments encompassed a diverse range of ocular conditions, including infections and inflammatory diseases, each requiring specialized drug formulations tailored to their unique pathophysiology and clinical presentation. The market's expansion was underpinned by ongoing research and development efforts aimed at enhancing treatment efficacy and patient compliance across all disease categories.
By Drug Class Analysis
Anti-VEGF agents lead among drug classes with a dominant market share of 32% globally.
In 2023, Anti-VEGF Agents held a dominant market position in the By Drug Class segment of the Ophthalmic Drugs Market, capturing more than a 32% share. The significant market share of Anti-VEGF Agents reflects their crucial role in treating neovascular age-related macular degeneration (AMD) and diabetic retinopathy, leveraging their efficacy in inhibiting vascular endothelial growth factor (VEGF) to manage retinal vascular diseases effectively.
Anti-Allergy medications followed closely, encompassing a diverse range of antihistamines and mast cell stabilizers designed to alleviate allergic conjunctivitis symptoms. This segment benefited from increasing environmental allergens and seasonal variations contributing to higher demand for effective ocular allergy treatments.
Anti-Inflammatory drugs maintained a robust presence in the market, driven by their essential role in managing uveitis, scleritis, and other inflammatory conditions affecting the eye. The segment saw advancements in corticosteroids and non-steroidal anti-inflammatory drugs (NSAIDs), catering to the diverse needs of patients requiring targeted anti-inflammatory therapies.
Antiglaucoma medications continued to be pivotal in managing intraocular pressure and preventing optic nerve damage. The segment witnessed innovations in prostaglandin analogs, beta-blockers, and alpha agonists, emphasizing sustained efficacy and minimal side effects for long-term glaucoma management.
Overall, the By Drug Class segment of the Ophthalmic Drugs Market in 2023 demonstrated robust growth driven by technological advancements, increasing prevalence of ocular diseases, and growing awareness about the importance of early intervention and treatment adherence in maintaining eye health.
By Dosage Analysis
Eye drops stand out as the preferred dosage form, capturing a significant 35% market share.
In 2023, Eye Drops held a dominant market position in the by-dosage segment of the Ophthalmic Drugs Market, capturing more than a 35% share. The significant market share of Eye Drops can be attributed to their widespread usage and convenience in delivering medications directly to the eye for conditions such as dry eye syndrome, glaucoma, and infections. The segment benefited from innovations in formulation technologies, including preservative-free options and multidose containers, enhancing patient compliance and treatment efficacy.
Eye Solutions followed closely, comprising a versatile category of liquid formulations designed to address various ocular conditions. This segment saw advancements in pH-balanced solutions and isotonic formulations, catering to sensitive eyes and diverse patient needs across different age groups.
Gels maintained a robust presence in the market, offering sustained release and prolonged contact time on the ocular surface for conditions requiring thicker formulations. Innovations in gel viscosity and biocompatibility supported their efficacy in treating severe dry eye and promoting tissue healing post-surgery.
Capsules represented a niche segment, focusing on sustained-release formulations for chronic conditions such as glaucoma and postoperative care. The segment witnessed advancements in biodegradable polymers and implantable devices, enhancing convenience and reducing treatment frequency for patients.
Ointments concluded the segment, providing long-lasting lubrication and protection for conditions requiring thicker, semisolid formulations. This segment saw innovations in antimicrobial ointments and corticosteroid-based formulations, catering to inflammatory and infectious eye diseases.
Overall, the By Dosage segment of the Ophthalmic Drugs Market in 2023 demonstrated robust growth driven by technological advancements, patient-centric innovations, and the increasing prevalence of ocular diseases worldwide.
By Administration Analysis
Topical administration methods hold a commanding 65% share of the overall ophthalmic market.
In 2023, Topical administration held a dominant market position in the By Administration segment of the Ophthalmic Drugs Market, capturing more than a 65% share. The significant market share of Topical administration can be attributed to its direct application to the affected area, ensuring targeted delivery and efficacy in treating various ocular conditions. This method is preferred for its convenience, minimal systemic side effects, and ability to achieve therapeutic concentrations directly at the site of action.
Systemic administration, while representing a smaller segment, continued to play a crucial role in managing ocular diseases requiring systemic treatments. This approach involved oral medications or intravenous injections designed to treat conditions such as intraocular inflammation and systemic infections affecting the eye. The segment benefited from advancements in biologics and immunosuppressants tailored for ocular indications, supporting comprehensive treatment strategies.
Local Ocular administration encompassed a diverse range of methods, including intraocular injections and implants designed for sustained release of medications. This segment saw advancements in biodegradable implants and sustained-release platforms, offering prolonged therapeutic effects with reduced treatment frequency and improved patient compliance.
Overall, the By Administration segment of the Ophthalmic Drugs Market in 2023 demonstrated robust growth driven by advancements in drug delivery technologies, expanding therapeutic options, and increasing demand for targeted treatments to address a wide spectrum of ocular diseases effectively.
By Product Analysis
Prescription drugs, as a product category, dominate with a substantial 61% market presence in ophthalmology.
In 2023, Prescription Drugs held a dominant market position in the By Product segment of the Ophthalmic Drugs Market, capturing more than a 61% share. The significant market share of Prescription Drugs reflects their critical role in treating complex and chronic ocular conditions under medical supervision. These drugs are typically formulated with potent active ingredients to address diseases such as glaucoma, macular degeneration, and severe dry eye syndrome, requiring precise dosing and monitoring.
Over-the-Counter (OTC) Drugs constituted a smaller yet essential segment, catering to self-managed conditions like minor eye irritations, allergies, and dryness. This segment saw growth in consumer awareness and availability of OTC products offering symptomatic relief without prescription requirements, promoting convenience and accessibility for milder eye health concerns.
Prescription Drugs benefited from ongoing research and development efforts focusing on novel drug delivery systems, biologics, and personalized medicine approaches tailored to individual patient needs. These advancements aimed to enhance treatment efficacy, minimize side effects, and improve patient compliance in managing chronic eye diseases effectively.
The Ophthalmic Drugs Market's Prescription Drugs segment in 2023 showcased robust growth driven by technological innovations, regulatory approvals for new therapeutic entities, and increasing healthcare expenditures supporting advanced treatment options across global markets.
Key Market Segments
By Disease
- Eye Allergy
- Eye Infection
- Glaucoma
- Retinal Disorders
- Dry Eye
- Others
By Drug Class
- Anti-Allergy
- Anti-Inflammatory
- Antiglaucoma
- Anti-VEGF Agents
By Dosage
- Eye Solutions
- Gels
- Capsules
- Eye Drops
- Ointments
By Administration
- Systematic
- Topical
- Local Ocular
By Product
- Prescription Drugs
- Over-the-Counter-Drugs
Growth Opportunity
Robust Pipeline of Promising Drug Candidates in Clinical Trials
The global ophthalmic drugs market is poised for significant growth in 2023, driven by a robust pipeline of promising drug candidates undergoing clinical trials. Pharmaceutical companies are focusing on developing novel therapies to address unmet medical needs in eye care, particularly for conditions like glaucoma, macular degeneration, and diabetic retinopathy.
These advancements underscore a shift towards targeted treatments that offer improved efficacy and safety profiles compared to traditional therapies. Investors and stakeholders are keenly watching key developments in late-stage trials, anticipating accelerated regulatory approvals and market entries that could reshape treatment paradigms in ophthalmology.
Adoption of Innovative Technologies for Drug Delivery
In 2023, the ophthalmic drugs market is witnessing a surge in the adoption of innovative technologies for drug delivery and patient monitoring. Nanotechnology-enabled formulations, sustained-release implants, and smart contact lenses equipped with drug reservoirs are revolutionizing how medications are administered and monitored in eye care.
These advancements not only enhance patient compliance but also optimize therapeutic outcomes by ensuring precise dosing and prolonged drug exposure at the target site. Furthermore, integrated monitoring technologies are enabling real-time assessment of treatment efficacy, facilitating personalized care approaches and early intervention strategies.
Latest Trends
Combination Therapies Growth
In 2023, the global ophthalmic drugs market is witnessing a notable trend towards the development and adoption of combination therapies. Pharmaceutical companies are increasingly exploring synergistic drug combinations to enhance treatment efficacy and address multifactorial aspects of chronic eye diseases such as glaucoma and age-related macular degeneration (AMD).
This approach aims to improve patient outcomes by targeting multiple pathways involved in disease progression simultaneously. Combination therapies not only offer potential therapeutic benefits but also present commercial opportunities for manufacturers to differentiate their products in a competitive landscape. Regulatory agencies are also adapting to accommodate these innovative treatment modalities, facilitating faster approvals and market access for promising combinations.
Focus on Chronic Eye Disease Treatments
2023 marks a strategic shift towards addressing chronic eye diseases more comprehensively within the ophthalmic drugs market. There is heightened research and development activity aimed at introducing novel therapies specifically tailored for conditions that require long-term management.
With an aging global population and rising prevalence of conditions like diabetic retinopathy and dry eye syndrome, there is a growing demand for effective treatments that can delay disease progression and preserve vision quality over extended periods. This trend is driving investments in retinal biologics, sustained-release formulations, and gene therapies that target underlying disease mechanisms with greater precision and durability.
Regional Analysis
In North America, the ophthalmic drugs market holds a significant share of 45.4%, reflecting robust growth and demand.
The ophthalmic drugs market exhibits distinct regional dynamics across North America, Europe, Asia Pacific, the Middle East & Africa, and Latin America. North America emerges as the dominant region, commanding a substantial 45.4% share of the global market.
This dominance can be attributed to advanced healthcare infrastructure, a high prevalence of eye disorders such as glaucoma and age-related macular degeneration (AMD), and robust investments in research and development. The market value in North America is bolstered by key players' strategic initiatives in product innovation and regulatory advancements, ensuring a competitive landscape.
In Europe, stringent regulatory frameworks and a growing elderly population drive market growth. The region benefits from extensive government initiatives aimed at enhancing eye care services, alongside increasing healthcare expenditures. Asia Pacific showcases rapid market expansion attributed to rising healthcare awareness, improving access to treatment, and a large patient pool. Countries like China and India contribute significantly to market growth due to improving healthcare infrastructure and increasing disposable incomes.
The Middle East & Africa and Latin America regions are witnessing gradual market growth, supported by expanding healthcare facilities and rising adoption of advanced ophthalmic treatments. These regions are poised for future growth with increasing healthcare investments and improving healthcare access.
Key Regions and Countries
North America
- The US
- Canada
- Rest of North America
Europe
- Germany
- France
- The UK
- Spain
- Netherlands
- Russia
- Italy
- Rest of Europe
Asia-Pacific
- China
- Japan
- Singapore
- Thailand
- South Korea
- Vietnam
- India
- New Zealand
- Rest of Asia Pacific
Latin America
- Mexico
- Brazil
- Rest of Latin America
Middle East & Africa
- Saudi Arabia
- South Africa
- UAE
- Rest of Middle East & Africa
Key Players Analysis
In 2023, the global Ophthalmic Drugs Market was significantly influenced by key players such as Pfizer Inc., Alcon, Novartis AG, Bausch Health Companies Inc., Merck & Co., Inc., Regeneron Pharmaceuticals Inc., Allergan (now part of AbbVie Inc.), Bayer AG, Genentech, Inc. (a member of F. Hoffmann-La Roche Ltd), Nicox, and Coherus Biosciences, Inc. These companies played pivotal roles in shaping market dynamics through their innovative therapies and strategic initiatives.
Pfizer Inc. maintained its strong market presence with a diverse portfolio of ophthalmic drugs, focusing on expanding treatment options and enhancing patient outcomes. Alcon, a leader in eye care, continued to innovate with advanced surgical and pharmaceutical solutions, catering to both surgical and vision care needs. Novartis AG stood out with its robust pipeline and emphasis on addressing unmet medical needs in eye diseases.
Bausch Health Companies Inc. and Merck & Co., Inc. contributed significantly through their specialized treatments, consolidating their positions in the market. Regeneron Pharmaceuticals Inc., known for its biologics, continued to advance therapies for serious eye conditions, contributing to improved treatment efficacy. Allergan, now under AbbVie Inc., maintained its focus on expanding indications for existing products while exploring new therapeutic avenues.
Bayer AG and Genentech, Inc. (F. Hoffmann-La Roche Ltd) leveraged their research capabilities to introduce innovative therapies, aiming to set new benchmarks in ophthalmology. Nicox and Coherus Biosciences, Inc. also made strides with their novel approaches, reinforcing competition and fostering innovation within the market.
Market Key Players
- Pfizer Inc.
- Alcon
- Novartis AG
- Bausch Health Companies Inc.
- Merck & Co., Inc
- Regeneron Pharmaceuticals Inc
- Allergan (AbbVie Inc)
- Bayer AG
- Genentech, Inc. (F. Hoffmann-La Roche Ltd)
- Nicox
- Coherus Biosciences, Inc.
Recent Development
- In February 2024, Recent developments in glaucoma drugs and drug delivery were discussed at the Glaucoma 360 meeting, featuring representatives from PolyActiva, Ripple Therapeutics, Skye Bioscience, Thea, and Visus Therapeutics. Intracameral drug delivery, preservative-free medicines, and novel formulations were highlighted, promising more effective treatment options in the future.
- In December 2023, JB Chemicals & Pharmaceuticals acquired 15 ophthalmology drugs from Novartis for Rs 964 crore, with a licensing agreement till January 2027. JB Chemicals aims to bolster its position in the Rs 4,300 crore ophthalmology market.
- In September 2023, Johnson & Johnson continues to pioneer precision medicine, leveraging cutting-edge technologies and expert insight to develop super-personalized solutions. Their focus spans Oncology, Immunology, Neuroscience, Cardiovascular, Pulmonary Hypertension, and Retina, aiming to lead where medicine is heading.
Report Scope
Report Features Description Market Value (2023) USD 37.8 Billion Forecast Revenue (2033) USD 82.2 Billion CAGR (2024-2032) 8.3% Base Year for Estimation 2023 Historic Period 2016-2023 Forecast Period 2024-2033 Report Coverage Revenue Forecast, Market Dynamics, COVID-19 Impact, Competitive Landscape, Recent Developments Segments Covered By Disease(Eye Allergy, Eye Infection, Glaucoma, Retinal Disorders, Dry Eye, Others), By Drug Class(Anti-Allergy, Anti-Inflammatory, Antiglaucoma, Anti-VEGF Agents), By Dosage(Eye Solutions, Gels, Capsules, Eye Drops, Ointments), By Administration(Systematic, Topical, Local Ocular), By Product(Prescription Drugs, Over-the-Counter-Drugs) Regional Analysis North America - The US, Canada, Rest of North America, Europe - Germany, France, The UK, Spain, Italy, Russia, Netherlands, Rest of Europe, Asia-Pacific - China, Japan, South Korea, India, New Zealand, Singapore, Thailand, Vietnam, Rest of Asia Pacific, Latin America - Brazil, Mexico, Rest of Latin America, Middle East & Africa - South Africa, Saudi Arabia, UAE, Rest of Middle East & Africa Competitive Landscape Pfizer Inc., Alcon, Novartis AG, Bausch Health Companies Inc., Merck & Co., Inc, Regeneron Pharmaceuticals Inc, Allergan (AbbVie Inc), Bayer AG, Genentech, Inc. (F. Hoffmann-La Roche Ltd), Nicox, Coherus Biosciences, Inc. Customization Scope Customization for segments, region/country-level will be provided. Moreover, additional customization can be done based on the requirements. Purchase Options We have three licenses to opt for Single User License, Multi-User License (Up to 5 Users), Corporate Use License (Unlimited User and Printable PDF) -
- 1. Executive Summary
- 1.1. Definition
- 1.2. Taxonomy
- 1.3. Research Scope
- 1.4. Key Analysis
- 1.5. Key Findings by Major Segments
- 1.6. Top strategies by Major Players
- 2. Global Ophthalmic Drugs Market Overview
- 2.1. Ophthalmic Drugs Market Dynamics
- 2.1.1. Drivers
- 2.1.2. Opportunities
- 2.1.3. Restraints
- 2.1.4. Challenges
- 2.2. Macro-economic Factors
- 2.3. Regulatory Framework
- 2.4. Market Investment Feasibility Index
- 2.5. PEST Analysis
- 2.6. PORTER’S Five Force Analysis
- 2.7. Drivers & Restraints Impact Analysis
- 2.8. Industry Chain Analysis
- 2.9. Cost Structure Analysis
- 2.10. Marketing Strategy
- 2.11. Russia-Ukraine War Impact Analysis
- 2.12. Opportunity Map Analysis
- 2.13. Market Competition Scenario Analysis
- 2.14. Product Life Cycle Analysis
- 2.15. Opportunity Orbits
- 2.16. Manufacturer Intensity Map
- 2.17. Major Companies sales by Value & Volume
- 2.1. Ophthalmic Drugs Market Dynamics
- 3. Global Ophthalmic Drugs Market Analysis, Opportunity and Forecast, 2016-2032
- 3.1. Global Ophthalmic Drugs Market Analysis, 2016-2021
- 3.2. Global Ophthalmic Drugs Market Opportunity and Forecast, 2023-2032
- 3.3. Global Ophthalmic Drugs Market Analysis, Opportunity and Forecast, By By Disease, 2016-2032
- 3.3.1. Global Ophthalmic Drugs Market Analysis by By Disease: Introduction
- 3.3.2. Market Size Absolute $ Opportunity Analysis and Forecast, By By Disease, 2016-2032
- 3.3.3. Eye Allergy
- 3.3.4. Eye Infection
- 3.3.5. Glaucoma
- 3.3.6. Retinal Disorders
- 3.3.7. Dry Eye
- 3.3.8. Others
- 3.4. Global Ophthalmic Drugs Market Analysis, Opportunity and Forecast, By By Drug Class, 2016-2032
- 3.4.1. Global Ophthalmic Drugs Market Analysis by By Drug Class: Introduction
- 3.4.2. Market Size Absolute $ Opportunity Analysis and Forecast, By By Drug Class, 2016-2032
- 3.4.3. Anti-Allergy
- 3.4.4. Anti-Inflammatory
- 3.4.5. Antiglaucoma
- 3.4.6. Anti-VEGF Agents
- 3.5. Global Ophthalmic Drugs Market Analysis, Opportunity and Forecast, By By Dosage, 2016-2032
- 3.5.1. Global Ophthalmic Drugs Market Analysis by By Dosage: Introduction
- 3.5.2. Market Size Absolute $ Opportunity Analysis and Forecast, By By Dosage, 2016-2032
- 3.5.3. Eye Solutions
- 3.5.4. Gels
- 3.5.5. Capsules
- 3.5.6. Eye Drops
- 3.5.7. Ointments
- 3.6. Global Ophthalmic Drugs Market Analysis, Opportunity and Forecast, By By Administration, 2016-2032
- 3.6.1. Global Ophthalmic Drugs Market Analysis by By Administration: Introduction
- 3.6.2. Market Size Absolute $ Opportunity Analysis and Forecast, By By Administration, 2016-2032
- 3.6.3. Systematic
- 3.6.4. Topical
- 3.6.5. Local Ocular
- 3.7. Global Ophthalmic Drugs Market Analysis, Opportunity and Forecast, By By Product, 2016-2032
- 3.7.1. Global Ophthalmic Drugs Market Analysis by By Product: Introduction
- 3.7.2. Market Size Absolute $ Opportunity Analysis and Forecast, By By Product, 2016-2032
- 3.7.3. Prescription Drugs
- 3.7.4. Over-the-Counter-Drugs
- 4. North America Ophthalmic Drugs Market Analysis, Opportunity and Forecast, 2016-2032
- 4.1. North America Ophthalmic Drugs Market Analysis, 2016-2021
- 4.2. North America Ophthalmic Drugs Market Opportunity and Forecast, 2023-2032
- 4.3. North America Ophthalmic Drugs Market Analysis, Opportunity and Forecast, By By Disease, 2016-2032
- 4.3.1. North America Ophthalmic Drugs Market Analysis by By Disease: Introduction
- 4.3.2. Market Size Absolute $ Opportunity Analysis and Forecast, By By Disease, 2016-2032
- 4.3.3. Eye Allergy
- 4.3.4. Eye Infection
- 4.3.5. Glaucoma
- 4.3.6. Retinal Disorders
- 4.3.7. Dry Eye
- 4.3.8. Others
- 4.4. North America Ophthalmic Drugs Market Analysis, Opportunity and Forecast, By By Drug Class, 2016-2032
- 4.4.1. North America Ophthalmic Drugs Market Analysis by By Drug Class: Introduction
- 4.4.2. Market Size Absolute $ Opportunity Analysis and Forecast, By By Drug Class, 2016-2032
- 4.4.3. Anti-Allergy
- 4.4.4. Anti-Inflammatory
- 4.4.5. Antiglaucoma
- 4.4.6. Anti-VEGF Agents
- 4.5. North America Ophthalmic Drugs Market Analysis, Opportunity and Forecast, By By Dosage, 2016-2032
- 4.5.1. North America Ophthalmic Drugs Market Analysis by By Dosage: Introduction
- 4.5.2. Market Size Absolute $ Opportunity Analysis and Forecast, By By Dosage, 2016-2032
- 4.5.3. Eye Solutions
- 4.5.4. Gels
- 4.5.5. Capsules
- 4.5.6. Eye Drops
- 4.5.7. Ointments
- 4.6. North America Ophthalmic Drugs Market Analysis, Opportunity and Forecast, By By Administration, 2016-2032
- 4.6.1. North America Ophthalmic Drugs Market Analysis by By Administration: Introduction
- 4.6.2. Market Size Absolute $ Opportunity Analysis and Forecast, By By Administration, 2016-2032
- 4.6.3. Systematic
- 4.6.4. Topical
- 4.6.5. Local Ocular
- 4.7. North America Ophthalmic Drugs Market Analysis, Opportunity and Forecast, By By Product, 2016-2032
- 4.7.1. North America Ophthalmic Drugs Market Analysis by By Product: Introduction
- 4.7.2. Market Size Absolute $ Opportunity Analysis and Forecast, By By Product, 2016-2032
- 4.7.3. Prescription Drugs
- 4.7.4. Over-the-Counter-Drugs
- 4.8. North America Ophthalmic Drugs Market Analysis, Opportunity and Forecast, By Country , 2016-2032
- 4.8.1. North America Ophthalmic Drugs Market Analysis by Country : Introduction
- 4.8.2. Market Size Absolute $ Opportunity Analysis and Forecast, Country , 2016-2032
- 4.8.2.1. The US
- 4.8.2.2. Canada
- 4.8.2.3. Mexico
- 5. Western Europe Ophthalmic Drugs Market Analysis, Opportunity and Forecast, 2016-2032
- 5.1. Western Europe Ophthalmic Drugs Market Analysis, 2016-2021
- 5.2. Western Europe Ophthalmic Drugs Market Opportunity and Forecast, 2023-2032
- 5.3. Western Europe Ophthalmic Drugs Market Analysis, Opportunity and Forecast, By By Disease, 2016-2032
- 5.3.1. Western Europe Ophthalmic Drugs Market Analysis by By Disease: Introduction
- 5.3.2. Market Size Absolute $ Opportunity Analysis and Forecast, By By Disease, 2016-2032
- 5.3.3. Eye Allergy
- 5.3.4. Eye Infection
- 5.3.5. Glaucoma
- 5.3.6. Retinal Disorders
- 5.3.7. Dry Eye
- 5.3.8. Others
- 5.4. Western Europe Ophthalmic Drugs Market Analysis, Opportunity and Forecast, By By Drug Class, 2016-2032
- 5.4.1. Western Europe Ophthalmic Drugs Market Analysis by By Drug Class: Introduction
- 5.4.2. Market Size Absolute $ Opportunity Analysis and Forecast, By By Drug Class, 2016-2032
- 5.4.3. Anti-Allergy
- 5.4.4. Anti-Inflammatory
- 5.4.5. Antiglaucoma
- 5.4.6. Anti-VEGF Agents
- 5.5. Western Europe Ophthalmic Drugs Market Analysis, Opportunity and Forecast, By By Dosage, 2016-2032
- 5.5.1. Western Europe Ophthalmic Drugs Market Analysis by By Dosage: Introduction
- 5.5.2. Market Size Absolute $ Opportunity Analysis and Forecast, By By Dosage, 2016-2032
- 5.5.3. Eye Solutions
- 5.5.4. Gels
- 5.5.5. Capsules
- 5.5.6. Eye Drops
- 5.5.7. Ointments
- 5.6. Western Europe Ophthalmic Drugs Market Analysis, Opportunity and Forecast, By By Administration, 2016-2032
- 5.6.1. Western Europe Ophthalmic Drugs Market Analysis by By Administration: Introduction
- 5.6.2. Market Size Absolute $ Opportunity Analysis and Forecast, By By Administration, 2016-2032
- 5.6.3. Systematic
- 5.6.4. Topical
- 5.6.5. Local Ocular
- 5.7. Western Europe Ophthalmic Drugs Market Analysis, Opportunity and Forecast, By By Product, 2016-2032
- 5.7.1. Western Europe Ophthalmic Drugs Market Analysis by By Product: Introduction
- 5.7.2. Market Size Absolute $ Opportunity Analysis and Forecast, By By Product, 2016-2032
- 5.7.3. Prescription Drugs
- 5.7.4. Over-the-Counter-Drugs
- 5.8. Western Europe Ophthalmic Drugs Market Analysis, Opportunity and Forecast, By Country , 2016-2032
- 5.8.1. Western Europe Ophthalmic Drugs Market Analysis by Country : Introduction
- 5.8.2. Market Size Absolute $ Opportunity Analysis and Forecast, Country , 2016-2032
- 5.8.2.1. Germany
- 5.8.2.2. France
- 5.8.2.3. The UK
- 5.8.2.4. Spain
- 5.8.2.5. Italy
- 5.8.2.6. Portugal
- 5.8.2.7. Ireland
- 5.8.2.8. Austria
- 5.8.2.9. Switzerland
- 5.8.2.10. Benelux
- 5.8.2.11. Nordic
- 5.8.2.12. Rest of Western Europe
- 6. Eastern Europe Ophthalmic Drugs Market Analysis, Opportunity and Forecast, 2016-2032
- 6.1. Eastern Europe Ophthalmic Drugs Market Analysis, 2016-2021
- 6.2. Eastern Europe Ophthalmic Drugs Market Opportunity and Forecast, 2023-2032
- 6.3. Eastern Europe Ophthalmic Drugs Market Analysis, Opportunity and Forecast, By By Disease, 2016-2032
- 6.3.1. Eastern Europe Ophthalmic Drugs Market Analysis by By Disease: Introduction
- 6.3.2. Market Size Absolute $ Opportunity Analysis and Forecast, By By Disease, 2016-2032
- 6.3.3. Eye Allergy
- 6.3.4. Eye Infection
- 6.3.5. Glaucoma
- 6.3.6. Retinal Disorders
- 6.3.7. Dry Eye
- 6.3.8. Others
- 6.4. Eastern Europe Ophthalmic Drugs Market Analysis, Opportunity and Forecast, By By Drug Class, 2016-2032
- 6.4.1. Eastern Europe Ophthalmic Drugs Market Analysis by By Drug Class: Introduction
- 6.4.2. Market Size Absolute $ Opportunity Analysis and Forecast, By By Drug Class, 2016-2032
- 6.4.3. Anti-Allergy
- 6.4.4. Anti-Inflammatory
- 6.4.5. Antiglaucoma
- 6.4.6. Anti-VEGF Agents
- 6.5. Eastern Europe Ophthalmic Drugs Market Analysis, Opportunity and Forecast, By By Dosage, 2016-2032
- 6.5.1. Eastern Europe Ophthalmic Drugs Market Analysis by By Dosage: Introduction
- 6.5.2. Market Size Absolute $ Opportunity Analysis and Forecast, By By Dosage, 2016-2032
- 6.5.3. Eye Solutions
- 6.5.4. Gels
- 6.5.5. Capsules
- 6.5.6. Eye Drops
- 6.5.7. Ointments
- 6.6. Eastern Europe Ophthalmic Drugs Market Analysis, Opportunity and Forecast, By By Administration, 2016-2032
- 6.6.1. Eastern Europe Ophthalmic Drugs Market Analysis by By Administration: Introduction
- 6.6.2. Market Size Absolute $ Opportunity Analysis and Forecast, By By Administration, 2016-2032
- 6.6.3. Systematic
- 6.6.4. Topical
- 6.6.5. Local Ocular
- 6.7. Eastern Europe Ophthalmic Drugs Market Analysis, Opportunity and Forecast, By By Product, 2016-2032
- 6.7.1. Eastern Europe Ophthalmic Drugs Market Analysis by By Product: Introduction
- 6.7.2. Market Size Absolute $ Opportunity Analysis and Forecast, By By Product, 2016-2032
- 6.7.3. Prescription Drugs
- 6.7.4. Over-the-Counter-Drugs
- 6.8. Eastern Europe Ophthalmic Drugs Market Analysis, Opportunity and Forecast, By Country , 2016-2032
- 6.8.1. Eastern Europe Ophthalmic Drugs Market Analysis by Country : Introduction
- 6.8.2. Market Size Absolute $ Opportunity Analysis and Forecast, Country , 2016-2032
- 6.8.2.1. Russia
- 6.8.2.2. Poland
- 6.8.2.3. The Czech Republic
- 6.8.2.4. Greece
- 6.8.2.5. Rest of Eastern Europe
- 7. APAC Ophthalmic Drugs Market Analysis, Opportunity and Forecast, 2016-2032
- 7.1. APAC Ophthalmic Drugs Market Analysis, 2016-2021
- 7.2. APAC Ophthalmic Drugs Market Opportunity and Forecast, 2023-2032
- 7.3. APAC Ophthalmic Drugs Market Analysis, Opportunity and Forecast, By By Disease, 2016-2032
- 7.3.1. APAC Ophthalmic Drugs Market Analysis by By Disease: Introduction
- 7.3.2. Market Size Absolute $ Opportunity Analysis and Forecast, By By Disease, 2016-2032
- 7.3.3. Eye Allergy
- 7.3.4. Eye Infection
- 7.3.5. Glaucoma
- 7.3.6. Retinal Disorders
- 7.3.7. Dry Eye
- 7.3.8. Others
- 7.4. APAC Ophthalmic Drugs Market Analysis, Opportunity and Forecast, By By Drug Class, 2016-2032
- 7.4.1. APAC Ophthalmic Drugs Market Analysis by By Drug Class: Introduction
- 7.4.2. Market Size Absolute $ Opportunity Analysis and Forecast, By By Drug Class, 2016-2032
- 7.4.3. Anti-Allergy
- 7.4.4. Anti-Inflammatory
- 7.4.5. Antiglaucoma
- 7.4.6. Anti-VEGF Agents
- 7.5. APAC Ophthalmic Drugs Market Analysis, Opportunity and Forecast, By By Dosage, 2016-2032
- 7.5.1. APAC Ophthalmic Drugs Market Analysis by By Dosage: Introduction
- 7.5.2. Market Size Absolute $ Opportunity Analysis and Forecast, By By Dosage, 2016-2032
- 7.5.3. Eye Solutions
- 7.5.4. Gels
- 7.5.5. Capsules
- 7.5.6. Eye Drops
- 7.5.7. Ointments
- 7.6. APAC Ophthalmic Drugs Market Analysis, Opportunity and Forecast, By By Administration, 2016-2032
- 7.6.1. APAC Ophthalmic Drugs Market Analysis by By Administration: Introduction
- 7.6.2. Market Size Absolute $ Opportunity Analysis and Forecast, By By Administration, 2016-2032
- 7.6.3. Systematic
- 7.6.4. Topical
- 7.6.5. Local Ocular
- 7.7. APAC Ophthalmic Drugs Market Analysis, Opportunity and Forecast, By By Product, 2016-2032
- 7.7.1. APAC Ophthalmic Drugs Market Analysis by By Product: Introduction
- 7.7.2. Market Size Absolute $ Opportunity Analysis and Forecast, By By Product, 2016-2032
- 7.7.3. Prescription Drugs
- 7.7.4. Over-the-Counter-Drugs
- 7.8. APAC Ophthalmic Drugs Market Analysis, Opportunity and Forecast, By Country , 2016-2032
- 7.8.1. APAC Ophthalmic Drugs Market Analysis by Country : Introduction
- 7.8.2. Market Size Absolute $ Opportunity Analysis and Forecast, Country , 2016-2032
- 7.8.2.1. China
- 7.8.2.2. Japan
- 7.8.2.3. South Korea
- 7.8.2.4. India
- 7.8.2.5. Australia & New Zeland
- 7.8.2.6. Indonesia
- 7.8.2.7. Malaysia
- 7.8.2.8. Philippines
- 7.8.2.9. Singapore
- 7.8.2.10. Thailand
- 7.8.2.11. Vietnam
- 7.8.2.12. Rest of APAC
- 8. Latin America Ophthalmic Drugs Market Analysis, Opportunity and Forecast, 2016-2032
- 8.1. Latin America Ophthalmic Drugs Market Analysis, 2016-2021
- 8.2. Latin America Ophthalmic Drugs Market Opportunity and Forecast, 2023-2032
- 8.3. Latin America Ophthalmic Drugs Market Analysis, Opportunity and Forecast, By By Disease, 2016-2032
- 8.3.1. Latin America Ophthalmic Drugs Market Analysis by By Disease: Introduction
- 8.3.2. Market Size Absolute $ Opportunity Analysis and Forecast, By By Disease, 2016-2032
- 8.3.3. Eye Allergy
- 8.3.4. Eye Infection
- 8.3.5. Glaucoma
- 8.3.6. Retinal Disorders
- 8.3.7. Dry Eye
- 8.3.8. Others
- 8.4. Latin America Ophthalmic Drugs Market Analysis, Opportunity and Forecast, By By Drug Class, 2016-2032
- 8.4.1. Latin America Ophthalmic Drugs Market Analysis by By Drug Class: Introduction
- 8.4.2. Market Size Absolute $ Opportunity Analysis and Forecast, By By Drug Class, 2016-2032
- 8.4.3. Anti-Allergy
- 8.4.4. Anti-Inflammatory
- 8.4.5. Antiglaucoma
- 8.4.6. Anti-VEGF Agents
- 8.5. Latin America Ophthalmic Drugs Market Analysis, Opportunity and Forecast, By By Dosage, 2016-2032
- 8.5.1. Latin America Ophthalmic Drugs Market Analysis by By Dosage: Introduction
- 8.5.2. Market Size Absolute $ Opportunity Analysis and Forecast, By By Dosage, 2016-2032
- 8.5.3. Eye Solutions
- 8.5.4. Gels
- 8.5.5. Capsules
- 8.5.6. Eye Drops
- 8.5.7. Ointments
- 8.6. Latin America Ophthalmic Drugs Market Analysis, Opportunity and Forecast, By By Administration, 2016-2032
- 8.6.1. Latin America Ophthalmic Drugs Market Analysis by By Administration: Introduction
- 8.6.2. Market Size Absolute $ Opportunity Analysis and Forecast, By By Administration, 2016-2032
- 8.6.3. Systematic
- 8.6.4. Topical
- 8.6.5. Local Ocular
- 8.7. Latin America Ophthalmic Drugs Market Analysis, Opportunity and Forecast, By By Product, 2016-2032
- 8.7.1. Latin America Ophthalmic Drugs Market Analysis by By Product: Introduction
- 8.7.2. Market Size Absolute $ Opportunity Analysis and Forecast, By By Product, 2016-2032
- 8.7.3. Prescription Drugs
- 8.7.4. Over-the-Counter-Drugs
- 8.8. Latin America Ophthalmic Drugs Market Analysis, Opportunity and Forecast, By Country , 2016-2032
- 8.8.1. Latin America Ophthalmic Drugs Market Analysis by Country : Introduction
- 8.8.2. Market Size Absolute $ Opportunity Analysis and Forecast, Country , 2016-2032
- 8.8.2.1. Brazil
- 8.8.2.2. Colombia
- 8.8.2.3. Chile
- 8.8.2.4. Argentina
- 8.8.2.5. Costa Rica
- 8.8.2.6. Rest of Latin America
- 9. Middle East & Africa Ophthalmic Drugs Market Analysis, Opportunity and Forecast, 2016-2032
- 9.1. Middle East & Africa Ophthalmic Drugs Market Analysis, 2016-2021
- 9.2. Middle East & Africa Ophthalmic Drugs Market Opportunity and Forecast, 2023-2032
- 9.3. Middle East & Africa Ophthalmic Drugs Market Analysis, Opportunity and Forecast, By By Disease, 2016-2032
- 9.3.1. Middle East & Africa Ophthalmic Drugs Market Analysis by By Disease: Introduction
- 9.3.2. Market Size Absolute $ Opportunity Analysis and Forecast, By By Disease, 2016-2032
- 9.3.3. Eye Allergy
- 9.3.4. Eye Infection
- 9.3.5. Glaucoma
- 9.3.6. Retinal Disorders
- 9.3.7. Dry Eye
- 9.3.8. Others
- 9.4. Middle East & Africa Ophthalmic Drugs Market Analysis, Opportunity and Forecast, By By Drug Class, 2016-2032
- 9.4.1. Middle East & Africa Ophthalmic Drugs Market Analysis by By Drug Class: Introduction
- 9.4.2. Market Size Absolute $ Opportunity Analysis and Forecast, By By Drug Class, 2016-2032
- 9.4.3. Anti-Allergy
- 9.4.4. Anti-Inflammatory
- 9.4.5. Antiglaucoma
- 9.4.6. Anti-VEGF Agents
- 9.5. Middle East & Africa Ophthalmic Drugs Market Analysis, Opportunity and Forecast, By By Dosage, 2016-2032
- 9.5.1. Middle East & Africa Ophthalmic Drugs Market Analysis by By Dosage: Introduction
- 9.5.2. Market Size Absolute $ Opportunity Analysis and Forecast, By By Dosage, 2016-2032
- 9.5.3. Eye Solutions
- 9.5.4. Gels
- 9.5.5. Capsules
- 9.5.6. Eye Drops
- 9.5.7. Ointments
- 9.6. Middle East & Africa Ophthalmic Drugs Market Analysis, Opportunity and Forecast, By By Administration, 2016-2032
- 9.6.1. Middle East & Africa Ophthalmic Drugs Market Analysis by By Administration: Introduction
- 9.6.2. Market Size Absolute $ Opportunity Analysis and Forecast, By By Administration, 2016-2032
- 9.6.3. Systematic
- 9.6.4. Topical
- 9.6.5. Local Ocular
- 9.7. Middle East & Africa Ophthalmic Drugs Market Analysis, Opportunity and Forecast, By By Product, 2016-2032
- 9.7.1. Middle East & Africa Ophthalmic Drugs Market Analysis by By Product: Introduction
- 9.7.2. Market Size Absolute $ Opportunity Analysis and Forecast, By By Product, 2016-2032
- 9.7.3. Prescription Drugs
- 9.7.4. Over-the-Counter-Drugs
- 9.8. Middle East & Africa Ophthalmic Drugs Market Analysis, Opportunity and Forecast, By Country , 2016-2032
- 9.8.1. Middle East & Africa Ophthalmic Drugs Market Analysis by Country : Introduction
- 9.8.2. Market Size Absolute $ Opportunity Analysis and Forecast, Country , 2016-2032
- 9.8.2.1. Algeria
- 9.8.2.2. Egypt
- 9.8.2.3. Israel
- 9.8.2.4. Kuwait
- 9.8.2.5. Nigeria
- 9.8.2.6. Saudi Arabia
- 9.8.2.7. South Africa
- 9.8.2.8. Turkey
- 9.8.2.9. The UAE
- 9.8.2.10. Rest of MEA
- 10. Global Ophthalmic Drugs Market Analysis, Opportunity and Forecast, By Region , 2016-2032
- 10.1. Global Ophthalmic Drugs Market Analysis by Region : Introduction
- 10.2. Market Size Absolute $ Opportunity Analysis and Forecast, By Region , 2016-2032
- 10.2.1. North America
- 10.2.2. Western Europe
- 10.2.3. Eastern Europe
- 10.2.4. APAC
- 10.2.5. Latin America
- 10.2.6. Middle East & Africa
- 11. Global Ophthalmic Drugs Market Competitive Landscape, Market Share Analysis, and Company Profiles
- 11.1. Market Share Analysis
- 11.2. Company Profiles
- 11.3. Pfizer Inc.
- 11.3.1. Company Overview
- 11.3.2. Financial Highlights
- 11.3.3. Product Portfolio
- 11.3.4. SWOT Analysis
- 11.3.5. Key Strategies and Developments
- 11.4. Alcon
- 11.4.1. Company Overview
- 11.4.2. Financial Highlights
- 11.4.3. Product Portfolio
- 11.4.4. SWOT Analysis
- 11.4.5. Key Strategies and Developments
- 11.5. Novartis AG
- 11.5.1. Company Overview
- 11.5.2. Financial Highlights
- 11.5.3. Product Portfolio
- 11.5.4. SWOT Analysis
- 11.5.5. Key Strategies and Developments
- 11.6. Bausch Health Companies Inc.
- 11.6.1. Company Overview
- 11.6.2. Financial Highlights
- 11.6.3. Product Portfolio
- 11.6.4. SWOT Analysis
- 11.6.5. Key Strategies and Developments
- 11.7. Merck & Co., Inc
- 11.7.1. Company Overview
- 11.7.2. Financial Highlights
- 11.7.3. Product Portfolio
- 11.7.4. SWOT Analysis
- 11.7.5. Key Strategies and Developments
- 11.8. Regeneron Pharmaceuticals Inc
- 11.8.1. Company Overview
- 11.8.2. Financial Highlights
- 11.8.3. Product Portfolio
- 11.8.4. SWOT Analysis
- 11.8.5. Key Strategies and Developments
- 11.9. Allergan (AbbVie Inc)
- 11.9.1. Company Overview
- 11.9.2. Financial Highlights
- 11.9.3. Product Portfolio
- 11.9.4. SWOT Analysis
- 11.9.5. Key Strategies and Developments
- 11.10. Bayer AG
- 11.10.1. Company Overview
- 11.10.2. Financial Highlights
- 11.10.3. Product Portfolio
- 11.10.4. SWOT Analysis
- 11.10.5. Key Strategies and Developments
- 11.11. Genentech, Inc. (F. Hoffmann-La Roche Ltd)
- 11.11.1. Company Overview
- 11.11.2. Financial Highlights
- 11.11.3. Product Portfolio
- 11.11.4. SWOT Analysis
- 11.11.5. Key Strategies and Developments
- 11.12. Nicox
- 11.12.1. Company Overview
- 11.12.2. Financial Highlights
- 11.12.3. Product Portfolio
- 11.12.4. SWOT Analysis
- 11.12.5. Key Strategies and Developments
- 11.13.1. Company Overview
- 11.13.2. Financial Highlights
- 11.13.3. Product Portfolio
- 11.13.4. SWOT Analysis
- 11.13.5. Key Strategies and Developments
- 11.14. Coherus Biosciences, Inc.
- 11.14.1. Company Overview
- 11.14.2. Financial Highlights
- 11.14.3. Product Portfolio
- 11.14.4. SWOT Analysis
- 11.14.5. Key Strategies and Developments
- 12. Assumptions and Acronyms
- 13. Research Methodology
- 14. Contact
"
- List of Figures
- "
- Figure 1: Global Ophthalmic Drugs Market Revenue (US$ Mn) Market Share by By Disease in 2022
- Figure 2: Global Ophthalmic Drugs Market Market Attractiveness Analysis by By Disease, 2016-2032
- Figure 3: Global Ophthalmic Drugs Market Revenue (US$ Mn) Market Share by By Drug Classin 2022
- Figure 4: Global Ophthalmic Drugs Market Market Attractiveness Analysis by By Drug Class, 2016-2032
- Figure 5: Global Ophthalmic Drugs Market Revenue (US$ Mn) Market Share by By Dosagein 2022
- Figure 6: Global Ophthalmic Drugs Market Market Attractiveness Analysis by By Dosage, 2016-2032
- Figure 7: Global Ophthalmic Drugs Market Revenue (US$ Mn) Market Share by By Administrationin 2022
- Figure 8: Global Ophthalmic Drugs Market Market Attractiveness Analysis by By Administration, 2016-2032
- Figure 9: Global Ophthalmic Drugs Market Revenue (US$ Mn) Market Share by By Productin 2022
- Figure 10: Global Ophthalmic Drugs Market Market Attractiveness Analysis by By Product, 2016-2032
- Figure 11: Global Ophthalmic Drugs Market Revenue (US$ Mn) Market Share by Region in 2022
- Figure 12: Global Ophthalmic Drugs Market Market Attractiveness Analysis by Region, 2016-2032
- Figure 13: Global Ophthalmic Drugs Market Market Revenue (US$ Mn) (2016-2032)
- Figure 14: Global Ophthalmic Drugs Market Market Revenue (US$ Mn) Comparison by Region (2016-2032)
- Figure 15: Global Ophthalmic Drugs Market Market Revenue (US$ Mn) Comparison by By Disease (2016-2032)
- Figure 16: Global Ophthalmic Drugs Market Market Revenue (US$ Mn) Comparison by By Drug Class (2016-2032)
- Figure 17: Global Ophthalmic Drugs Market Market Revenue (US$ Mn) Comparison by By Dosage (2016-2032)
- Figure 18: Global Ophthalmic Drugs Market Market Revenue (US$ Mn) Comparison by By Administration (2016-2032)
- Figure 19: Global Ophthalmic Drugs Market Market Revenue (US$ Mn) Comparison by By Product (2016-2032)
- Figure 20: Global Ophthalmic Drugs Market Market Y-o-Y Growth Rate Comparison by Region (2016-2032)
- Figure 21: Global Ophthalmic Drugs Market Market Y-o-Y Growth Rate Comparison by By Disease (2016-2032)
- Figure 22: Global Ophthalmic Drugs Market Market Y-o-Y Growth Rate Comparison by By Drug Class (2016-2032)
- Figure 23: Global Ophthalmic Drugs Market Market Y-o-Y Growth Rate Comparison by By Dosage (2016-2032)
- Figure 24: Global Ophthalmic Drugs Market Market Y-o-Y Growth Rate Comparison by By Administration (2016-2032)
- Figure 25: Global Ophthalmic Drugs Market Market Y-o-Y Growth Rate Comparison by By Product (2016-2032)
- Figure 26: Global Ophthalmic Drugs Market Market Share Comparison by Region (2016-2032)
- Figure 27: Global Ophthalmic Drugs Market Market Share Comparison by By Disease (2016-2032)
- Figure 28: Global Ophthalmic Drugs Market Market Share Comparison by By Drug Class (2016-2032)
- Figure 29: Global Ophthalmic Drugs Market Market Share Comparison by By Dosage (2016-2032)
- Figure 30: Global Ophthalmic Drugs Market Market Share Comparison by By Administration (2016-2032)
- Figure 31: Global Ophthalmic Drugs Market Market Share Comparison by By Product (2016-2032)
- Figure 32: North America Ophthalmic Drugs Market Revenue (US$ Mn) Market Share by By Diseasein 2022
- Figure 33: North America Ophthalmic Drugs Market Market Attractiveness Analysis by By Disease, 2016-2032
- Figure 34: North America Ophthalmic Drugs Market Revenue (US$ Mn) Market Share by By Drug Classin 2022
- Figure 35: North America Ophthalmic Drugs Market Market Attractiveness Analysis by By Drug Class, 2016-2032
- Figure 36: North America Ophthalmic Drugs Market Revenue (US$ Mn) Market Share by By Dosagein 2022
- Figure 37: North America Ophthalmic Drugs Market Market Attractiveness Analysis by By Dosage, 2016-2032
- Figure 38: North America Ophthalmic Drugs Market Revenue (US$ Mn) Market Share by By Administrationin 2022
- Figure 39: North America Ophthalmic Drugs Market Market Attractiveness Analysis by By Administration, 2016-2032
- Figure 40: North America Ophthalmic Drugs Market Revenue (US$ Mn) Market Share by By Productin 2022
- Figure 41: North America Ophthalmic Drugs Market Market Attractiveness Analysis by By Product, 2016-2032
- Figure 42: North America Ophthalmic Drugs Market Revenue (US$ Mn) Market Share by Country in 2022
- Figure 43: North America Ophthalmic Drugs Market Market Attractiveness Analysis by Country, 2016-2032
- Figure 44: North America Ophthalmic Drugs Market Market Revenue (US$ Mn) (2016-2032)
- Figure 45: North America Ophthalmic Drugs Market Market Revenue (US$ Mn) Comparison by Country (2016-2032)
- Figure 46: North America Ophthalmic Drugs Market Market Revenue (US$ Mn) Comparison by By Disease (2016-2032)
- Figure 47: North America Ophthalmic Drugs Market Market Revenue (US$ Mn) Comparison by By Drug Class (2016-2032)
- Figure 48: North America Ophthalmic Drugs Market Market Revenue (US$ Mn) Comparison by By Dosage (2016-2032)
- Figure 49: North America Ophthalmic Drugs Market Market Revenue (US$ Mn) Comparison by By Administration (2016-2032)
- Figure 50: North America Ophthalmic Drugs Market Market Revenue (US$ Mn) Comparison by By Product (2016-2032)
- Figure 51: North America Ophthalmic Drugs Market Market Y-o-Y Growth Rate Comparison by Country (2016-2032)
- Figure 52: North America Ophthalmic Drugs Market Market Y-o-Y Growth Rate Comparison by By Disease (2016-2032)
- Figure 53: North America Ophthalmic Drugs Market Market Y-o-Y Growth Rate Comparison by By Drug Class (2016-2032)
- Figure 54: North America Ophthalmic Drugs Market Market Y-o-Y Growth Rate Comparison by By Dosage (2016-2032)
- Figure 55: North America Ophthalmic Drugs Market Market Y-o-Y Growth Rate Comparison by By Administration (2016-2032)
- Figure 56: North America Ophthalmic Drugs Market Market Y-o-Y Growth Rate Comparison by By Product (2016-2032)
- Figure 57: North America Ophthalmic Drugs Market Market Share Comparison by Country (2016-2032)
- Figure 58: North America Ophthalmic Drugs Market Market Share Comparison by By Disease (2016-2032)
- Figure 59: North America Ophthalmic Drugs Market Market Share Comparison by By Drug Class (2016-2032)
- Figure 60: North America Ophthalmic Drugs Market Market Share Comparison by By Dosage (2016-2032)
- Figure 61: North America Ophthalmic Drugs Market Market Share Comparison by By Administration (2016-2032)
- Figure 62: North America Ophthalmic Drugs Market Market Share Comparison by By Product (2016-2032)
- Figure 63: Western Europe Ophthalmic Drugs Market Revenue (US$ Mn) Market Share by By Diseasein 2022
- Figure 64: Western Europe Ophthalmic Drugs Market Market Attractiveness Analysis by By Disease, 2016-2032
- Figure 65: Western Europe Ophthalmic Drugs Market Revenue (US$ Mn) Market Share by By Drug Classin 2022
- Figure 66: Western Europe Ophthalmic Drugs Market Market Attractiveness Analysis by By Drug Class, 2016-2032
- Figure 67: Western Europe Ophthalmic Drugs Market Revenue (US$ Mn) Market Share by By Dosagein 2022
- Figure 68: Western Europe Ophthalmic Drugs Market Market Attractiveness Analysis by By Dosage, 2016-2032
- Figure 69: Western Europe Ophthalmic Drugs Market Revenue (US$ Mn) Market Share by By Administrationin 2022
- Figure 70: Western Europe Ophthalmic Drugs Market Market Attractiveness Analysis by By Administration, 2016-2032
- Figure 71: Western Europe Ophthalmic Drugs Market Revenue (US$ Mn) Market Share by By Productin 2022
- Figure 72: Western Europe Ophthalmic Drugs Market Market Attractiveness Analysis by By Product, 2016-2032
- Figure 73: Western Europe Ophthalmic Drugs Market Revenue (US$ Mn) Market Share by Country in 2022
- Figure 74: Western Europe Ophthalmic Drugs Market Market Attractiveness Analysis by Country, 2016-2032
- Figure 75: Western Europe Ophthalmic Drugs Market Market Revenue (US$ Mn) (2016-2032)
- Figure 76: Western Europe Ophthalmic Drugs Market Market Revenue (US$ Mn) Comparison by Country (2016-2032)
- Figure 77: Western Europe Ophthalmic Drugs Market Market Revenue (US$ Mn) Comparison by By Disease (2016-2032)
- Figure 78: Western Europe Ophthalmic Drugs Market Market Revenue (US$ Mn) Comparison by By Drug Class (2016-2032)
- Figure 79: Western Europe Ophthalmic Drugs Market Market Revenue (US$ Mn) Comparison by By Dosage (2016-2032)
- Figure 80: Western Europe Ophthalmic Drugs Market Market Revenue (US$ Mn) Comparison by By Administration (2016-2032)
- Figure 81: Western Europe Ophthalmic Drugs Market Market Revenue (US$ Mn) Comparison by By Product (2016-2032)
- Figure 82: Western Europe Ophthalmic Drugs Market Market Y-o-Y Growth Rate Comparison by Country (2016-2032)
- Figure 83: Western Europe Ophthalmic Drugs Market Market Y-o-Y Growth Rate Comparison by By Disease (2016-2032)
- Figure 84: Western Europe Ophthalmic Drugs Market Market Y-o-Y Growth Rate Comparison by By Drug Class (2016-2032)
- Figure 85: Western Europe Ophthalmic Drugs Market Market Y-o-Y Growth Rate Comparison by By Dosage (2016-2032)
- Figure 86: Western Europe Ophthalmic Drugs Market Market Y-o-Y Growth Rate Comparison by By Administration (2016-2032)
- Figure 87: Western Europe Ophthalmic Drugs Market Market Y-o-Y Growth Rate Comparison by By Product (2016-2032)
- Figure 88: Western Europe Ophthalmic Drugs Market Market Share Comparison by Country (2016-2032)
- Figure 89: Western Europe Ophthalmic Drugs Market Market Share Comparison by By Disease (2016-2032)
- Figure 90: Western Europe Ophthalmic Drugs Market Market Share Comparison by By Drug Class (2016-2032)
- Figure 91: Western Europe Ophthalmic Drugs Market Market Share Comparison by By Dosage (2016-2032)
- Figure 92: Western Europe Ophthalmic Drugs Market Market Share Comparison by By Administration (2016-2032)
- Figure 93: Western Europe Ophthalmic Drugs Market Market Share Comparison by By Product (2016-2032)
- Figure 94: Eastern Europe Ophthalmic Drugs Market Revenue (US$ Mn) Market Share by By Diseasein 2022
- Figure 95: Eastern Europe Ophthalmic Drugs Market Market Attractiveness Analysis by By Disease, 2016-2032
- Figure 96: Eastern Europe Ophthalmic Drugs Market Revenue (US$ Mn) Market Share by By Drug Classin 2022
- Figure 97: Eastern Europe Ophthalmic Drugs Market Market Attractiveness Analysis by By Drug Class, 2016-2032
- Figure 98: Eastern Europe Ophthalmic Drugs Market Revenue (US$ Mn) Market Share by By Dosagein 2022
- Figure 99: Eastern Europe Ophthalmic Drugs Market Market Attractiveness Analysis by By Dosage, 2016-2032
- Figure 100: Eastern Europe Ophthalmic Drugs Market Revenue (US$ Mn) Market Share by By Administrationin 2022
- Figure 101: Eastern Europe Ophthalmic Drugs Market Market Attractiveness Analysis by By Administration, 2016-2032
- Figure 102: Eastern Europe Ophthalmic Drugs Market Revenue (US$ Mn) Market Share by By Productin 2022
- Figure 103: Eastern Europe Ophthalmic Drugs Market Market Attractiveness Analysis by By Product, 2016-2032
- Figure 104: Eastern Europe Ophthalmic Drugs Market Revenue (US$ Mn) Market Share by Country in 2022
- Figure 105: Eastern Europe Ophthalmic Drugs Market Market Attractiveness Analysis by Country, 2016-2032
- Figure 106: Eastern Europe Ophthalmic Drugs Market Market Revenue (US$ Mn) (2016-2032)
- Figure 107: Eastern Europe Ophthalmic Drugs Market Market Revenue (US$ Mn) Comparison by Country (2016-2032)
- Figure 108: Eastern Europe Ophthalmic Drugs Market Market Revenue (US$ Mn) Comparison by By Disease (2016-2032)
- Figure 109: Eastern Europe Ophthalmic Drugs Market Market Revenue (US$ Mn) Comparison by By Drug Class (2016-2032)
- Figure 110: Eastern Europe Ophthalmic Drugs Market Market Revenue (US$ Mn) Comparison by By Dosage (2016-2032)
- Figure 111: Eastern Europe Ophthalmic Drugs Market Market Revenue (US$ Mn) Comparison by By Administration (2016-2032)
- Figure 112: Eastern Europe Ophthalmic Drugs Market Market Revenue (US$ Mn) Comparison by By Product (2016-2032)
- Figure 113: Eastern Europe Ophthalmic Drugs Market Market Y-o-Y Growth Rate Comparison by Country (2016-2032)
- Figure 114: Eastern Europe Ophthalmic Drugs Market Market Y-o-Y Growth Rate Comparison by By Disease (2016-2032)
- Figure 115: Eastern Europe Ophthalmic Drugs Market Market Y-o-Y Growth Rate Comparison by By Drug Class (2016-2032)
- Figure 116: Eastern Europe Ophthalmic Drugs Market Market Y-o-Y Growth Rate Comparison by By Dosage (2016-2032)
- Figure 117: Eastern Europe Ophthalmic Drugs Market Market Y-o-Y Growth Rate Comparison by By Administration (2016-2032)
- Figure 118: Eastern Europe Ophthalmic Drugs Market Market Y-o-Y Growth Rate Comparison by By Product (2016-2032)
- Figure 119: Eastern Europe Ophthalmic Drugs Market Market Share Comparison by Country (2016-2032)
- Figure 120: Eastern Europe Ophthalmic Drugs Market Market Share Comparison by By Disease (2016-2032)
- Figure 121: Eastern Europe Ophthalmic Drugs Market Market Share Comparison by By Drug Class (2016-2032)
- Figure 122: Eastern Europe Ophthalmic Drugs Market Market Share Comparison by By Dosage (2016-2032)
- Figure 123: Eastern Europe Ophthalmic Drugs Market Market Share Comparison by By Administration (2016-2032)
- Figure 124: Eastern Europe Ophthalmic Drugs Market Market Share Comparison by By Product (2016-2032)
- Figure 125: APAC Ophthalmic Drugs Market Revenue (US$ Mn) Market Share by By Diseasein 2022
- Figure 126: APAC Ophthalmic Drugs Market Market Attractiveness Analysis by By Disease, 2016-2032
- Figure 127: APAC Ophthalmic Drugs Market Revenue (US$ Mn) Market Share by By Drug Classin 2022
- Figure 128: APAC Ophthalmic Drugs Market Market Attractiveness Analysis by By Drug Class, 2016-2032
- Figure 129: APAC Ophthalmic Drugs Market Revenue (US$ Mn) Market Share by By Dosagein 2022
- Figure 130: APAC Ophthalmic Drugs Market Market Attractiveness Analysis by By Dosage, 2016-2032
- Figure 131: APAC Ophthalmic Drugs Market Revenue (US$ Mn) Market Share by By Administrationin 2022
- Figure 132: APAC Ophthalmic Drugs Market Market Attractiveness Analysis by By Administration, 2016-2032
- Figure 133: APAC Ophthalmic Drugs Market Revenue (US$ Mn) Market Share by By Productin 2022
- Figure 134: APAC Ophthalmic Drugs Market Market Attractiveness Analysis by By Product, 2016-2032
- Figure 135: APAC Ophthalmic Drugs Market Revenue (US$ Mn) Market Share by Country in 2022
- Figure 136: APAC Ophthalmic Drugs Market Market Attractiveness Analysis by Country, 2016-2032
- Figure 137: APAC Ophthalmic Drugs Market Market Revenue (US$ Mn) (2016-2032)
- Figure 138: APAC Ophthalmic Drugs Market Market Revenue (US$ Mn) Comparison by Country (2016-2032)
- Figure 139: APAC Ophthalmic Drugs Market Market Revenue (US$ Mn) Comparison by By Disease (2016-2032)
- Figure 140: APAC Ophthalmic Drugs Market Market Revenue (US$ Mn) Comparison by By Drug Class (2016-2032)
- Figure 141: APAC Ophthalmic Drugs Market Market Revenue (US$ Mn) Comparison by By Dosage (2016-2032)
- Figure 142: APAC Ophthalmic Drugs Market Market Revenue (US$ Mn) Comparison by By Administration (2016-2032)
- Figure 143: APAC Ophthalmic Drugs Market Market Revenue (US$ Mn) Comparison by By Product (2016-2032)
- Figure 144: APAC Ophthalmic Drugs Market Market Y-o-Y Growth Rate Comparison by Country (2016-2032)
- Figure 145: APAC Ophthalmic Drugs Market Market Y-o-Y Growth Rate Comparison by By Disease (2016-2032)
- Figure 146: APAC Ophthalmic Drugs Market Market Y-o-Y Growth Rate Comparison by By Drug Class (2016-2032)
- Figure 147: APAC Ophthalmic Drugs Market Market Y-o-Y Growth Rate Comparison by By Dosage (2016-2032)
- Figure 148: APAC Ophthalmic Drugs Market Market Y-o-Y Growth Rate Comparison by By Administration (2016-2032)
- Figure 149: APAC Ophthalmic Drugs Market Market Y-o-Y Growth Rate Comparison by By Product (2016-2032)
- Figure 150: APAC Ophthalmic Drugs Market Market Share Comparison by Country (2016-2032)
- Figure 151: APAC Ophthalmic Drugs Market Market Share Comparison by By Disease (2016-2032)
- Figure 152: APAC Ophthalmic Drugs Market Market Share Comparison by By Drug Class (2016-2032)
- Figure 153: APAC Ophthalmic Drugs Market Market Share Comparison by By Dosage (2016-2032)
- Figure 154: APAC Ophthalmic Drugs Market Market Share Comparison by By Administration (2016-2032)
- Figure 155: APAC Ophthalmic Drugs Market Market Share Comparison by By Product (2016-2032)
- Figure 156: Latin America Ophthalmic Drugs Market Revenue (US$ Mn) Market Share by By Diseasein 2022
- Figure 157: Latin America Ophthalmic Drugs Market Market Attractiveness Analysis by By Disease, 2016-2032
- Figure 158: Latin America Ophthalmic Drugs Market Revenue (US$ Mn) Market Share by By Drug Classin 2022
- Figure 159: Latin America Ophthalmic Drugs Market Market Attractiveness Analysis by By Drug Class, 2016-2032
- Figure 160: Latin America Ophthalmic Drugs Market Revenue (US$ Mn) Market Share by By Dosagein 2022
- Figure 161: Latin America Ophthalmic Drugs Market Market Attractiveness Analysis by By Dosage, 2016-2032
- Figure 162: Latin America Ophthalmic Drugs Market Revenue (US$ Mn) Market Share by By Administrationin 2022
- Figure 163: Latin America Ophthalmic Drugs Market Market Attractiveness Analysis by By Administration, 2016-2032
- Figure 164: Latin America Ophthalmic Drugs Market Revenue (US$ Mn) Market Share by By Productin 2022
- Figure 165: Latin America Ophthalmic Drugs Market Market Attractiveness Analysis by By Product, 2016-2032
- Figure 166: Latin America Ophthalmic Drugs Market Revenue (US$ Mn) Market Share by Country in 2022
- Figure 167: Latin America Ophthalmic Drugs Market Market Attractiveness Analysis by Country, 2016-2032
- Figure 168: Latin America Ophthalmic Drugs Market Market Revenue (US$ Mn) (2016-2032)
- Figure 169: Latin America Ophthalmic Drugs Market Market Revenue (US$ Mn) Comparison by Country (2016-2032)
- Figure 170: Latin America Ophthalmic Drugs Market Market Revenue (US$ Mn) Comparison by By Disease (2016-2032)
- Figure 171: Latin America Ophthalmic Drugs Market Market Revenue (US$ Mn) Comparison by By Drug Class (2016-2032)
- Figure 172: Latin America Ophthalmic Drugs Market Market Revenue (US$ Mn) Comparison by By Dosage (2016-2032)
- Figure 173: Latin America Ophthalmic Drugs Market Market Revenue (US$ Mn) Comparison by By Administration (2016-2032)
- Figure 174: Latin America Ophthalmic Drugs Market Market Revenue (US$ Mn) Comparison by By Product (2016-2032)
- Figure 175: Latin America Ophthalmic Drugs Market Market Y-o-Y Growth Rate Comparison by Country (2016-2032)
- Figure 176: Latin America Ophthalmic Drugs Market Market Y-o-Y Growth Rate Comparison by By Disease (2016-2032)
- Figure 177: Latin America Ophthalmic Drugs Market Market Y-o-Y Growth Rate Comparison by By Drug Class (2016-2032)
- Figure 178: Latin America Ophthalmic Drugs Market Market Y-o-Y Growth Rate Comparison by By Dosage (2016-2032)
- Figure 179: Latin America Ophthalmic Drugs Market Market Y-o-Y Growth Rate Comparison by By Administration (2016-2032)
- Figure 180: Latin America Ophthalmic Drugs Market Market Y-o-Y Growth Rate Comparison by By Product (2016-2032)
- Figure 181: Latin America Ophthalmic Drugs Market Market Share Comparison by Country (2016-2032)
- Figure 182: Latin America Ophthalmic Drugs Market Market Share Comparison by By Disease (2016-2032)
- Figure 183: Latin America Ophthalmic Drugs Market Market Share Comparison by By Drug Class (2016-2032)
- Figure 184: Latin America Ophthalmic Drugs Market Market Share Comparison by By Dosage (2016-2032)
- Figure 185: Latin America Ophthalmic Drugs Market Market Share Comparison by By Administration (2016-2032)
- Figure 186: Latin America Ophthalmic Drugs Market Market Share Comparison by By Product (2016-2032)
- Figure 187: Middle East & Africa Ophthalmic Drugs Market Revenue (US$ Mn) Market Share by By Diseasein 2022
- Figure 188: Middle East & Africa Ophthalmic Drugs Market Market Attractiveness Analysis by By Disease, 2016-2032
- Figure 189: Middle East & Africa Ophthalmic Drugs Market Revenue (US$ Mn) Market Share by By Drug Classin 2022
- Figure 190: Middle East & Africa Ophthalmic Drugs Market Market Attractiveness Analysis by By Drug Class, 2016-2032
- Figure 191: Middle East & Africa Ophthalmic Drugs Market Revenue (US$ Mn) Market Share by By Dosagein 2022
- Figure 192: Middle East & Africa Ophthalmic Drugs Market Market Attractiveness Analysis by By Dosage, 2016-2032
- Figure 193: Middle East & Africa Ophthalmic Drugs Market Revenue (US$ Mn) Market Share by By Administrationin 2022
- Figure 194: Middle East & Africa Ophthalmic Drugs Market Market Attractiveness Analysis by By Administration, 2016-2032
- Figure 195: Middle East & Africa Ophthalmic Drugs Market Revenue (US$ Mn) Market Share by By Productin 2022
- Figure 196: Middle East & Africa Ophthalmic Drugs Market Market Attractiveness Analysis by By Product, 2016-2032
- Figure 197: Middle East & Africa Ophthalmic Drugs Market Revenue (US$ Mn) Market Share by Country in 2022
- Figure 198: Middle East & Africa Ophthalmic Drugs Market Market Attractiveness Analysis by Country, 2016-2032
- Figure 199: Middle East & Africa Ophthalmic Drugs Market Market Revenue (US$ Mn) (2016-2032)
- Figure 200: Middle East & Africa Ophthalmic Drugs Market Market Revenue (US$ Mn) Comparison by Country (2016-2032)
- Figure 201: Middle East & Africa Ophthalmic Drugs Market Market Revenue (US$ Mn) Comparison by By Disease (2016-2032)
- Figure 202: Middle East & Africa Ophthalmic Drugs Market Market Revenue (US$ Mn) Comparison by By Drug Class (2016-2032)
- Figure 203: Middle East & Africa Ophthalmic Drugs Market Market Revenue (US$ Mn) Comparison by By Dosage (2016-2032)
- Figure 204: Middle East & Africa Ophthalmic Drugs Market Market Revenue (US$ Mn) Comparison by By Administration (2016-2032)
- Figure 205: Middle East & Africa Ophthalmic Drugs Market Market Revenue (US$ Mn) Comparison by By Product (2016-2032)
- Figure 206: Middle East & Africa Ophthalmic Drugs Market Market Y-o-Y Growth Rate Comparison by Country (2016-2032)
- Figure 207: Middle East & Africa Ophthalmic Drugs Market Market Y-o-Y Growth Rate Comparison by By Disease (2016-2032)
- Figure 208: Middle East & Africa Ophthalmic Drugs Market Market Y-o-Y Growth Rate Comparison by By Drug Class (2016-2032)
- Figure 209: Middle East & Africa Ophthalmic Drugs Market Market Y-o-Y Growth Rate Comparison by By Dosage (2016-2032)
- Figure 210: Middle East & Africa Ophthalmic Drugs Market Market Y-o-Y Growth Rate Comparison by By Administration (2016-2032)
- Figure 211: Middle East & Africa Ophthalmic Drugs Market Market Y-o-Y Growth Rate Comparison by By Product (2016-2032)
- Figure 212: Middle East & Africa Ophthalmic Drugs Market Market Share Comparison by Country (2016-2032)
- Figure 213: Middle East & Africa Ophthalmic Drugs Market Market Share Comparison by By Disease (2016-2032)
- Figure 214: Middle East & Africa Ophthalmic Drugs Market Market Share Comparison by By Drug Class (2016-2032)
- Figure 215: Middle East & Africa Ophthalmic Drugs Market Market Share Comparison by By Dosage (2016-2032)
- Figure 216: Middle East & Africa Ophthalmic Drugs Market Market Share Comparison by By Administration (2016-2032)
- Figure 217: Middle East & Africa Ophthalmic Drugs Market Market Share Comparison by By Product (2016-2032)
"
- List of Tables
- "
- Table 1: Global Ophthalmic Drugs Market Market Comparison by By Disease (2016-2032)
- Table 2: Global Ophthalmic Drugs Market Market Comparison by By Drug Class (2016-2032)
- Table 3: Global Ophthalmic Drugs Market Market Comparison by By Dosage (2016-2032)
- Table 4: Global Ophthalmic Drugs Market Market Comparison by By Administration (2016-2032)
- Table 5: Global Ophthalmic Drugs Market Market Comparison by By Product (2016-2032)
- Table 6: Global Ophthalmic Drugs Market Revenue (US$ Mn) Comparison by Region (2016-2032)
- Table 7: Global Ophthalmic Drugs Market Market Revenue (US$ Mn) (2016-2032)
- Table 8: Global Ophthalmic Drugs Market Market Revenue (US$ Mn) Comparison by Region (2016-2032)
- Table 9: Global Ophthalmic Drugs Market Market Revenue (US$ Mn) Comparison by By Disease (2016-2032)
- Table 10: Global Ophthalmic Drugs Market Market Revenue (US$ Mn) Comparison by By Drug Class (2016-2032)
- Table 11: Global Ophthalmic Drugs Market Market Revenue (US$ Mn) Comparison by By Dosage (2016-2032)
- Table 12: Global Ophthalmic Drugs Market Market Revenue (US$ Mn) Comparison by By Administration (2016-2032)
- Table 13: Global Ophthalmic Drugs Market Market Revenue (US$ Mn) Comparison by By Product (2016-2032)
- Table 14: Global Ophthalmic Drugs Market Market Y-o-Y Growth Rate Comparison by Region (2016-2032)
- Table 15: Global Ophthalmic Drugs Market Market Y-o-Y Growth Rate Comparison by By Disease (2016-2032)
- Table 16: Global Ophthalmic Drugs Market Market Y-o-Y Growth Rate Comparison by By Drug Class (2016-2032)
- Table 17: Global Ophthalmic Drugs Market Market Y-o-Y Growth Rate Comparison by By Dosage (2016-2032)
- Table 18: Global Ophthalmic Drugs Market Market Y-o-Y Growth Rate Comparison by By Administration (2016-2032)
- Table 19: Global Ophthalmic Drugs Market Market Y-o-Y Growth Rate Comparison by By Product (2016-2032)
- Table 20: Global Ophthalmic Drugs Market Market Share Comparison by Region (2016-2032)
- Table 21: Global Ophthalmic Drugs Market Market Share Comparison by By Disease (2016-2032)
- Table 22: Global Ophthalmic Drugs Market Market Share Comparison by By Drug Class (2016-2032)
- Table 23: Global Ophthalmic Drugs Market Market Share Comparison by By Dosage (2016-2032)
- Table 24: Global Ophthalmic Drugs Market Market Share Comparison by By Administration (2016-2032)
- Table 25: Global Ophthalmic Drugs Market Market Share Comparison by By Product (2016-2032)
- Table 26: North America Ophthalmic Drugs Market Market Comparison by By Drug Class (2016-2032)
- Table 27: North America Ophthalmic Drugs Market Market Comparison by By Dosage (2016-2032)
- Table 28: North America Ophthalmic Drugs Market Market Comparison by By Administration (2016-2032)
- Table 29: North America Ophthalmic Drugs Market Market Comparison by By Product (2016-2032)
- Table 30: North America Ophthalmic Drugs Market Revenue (US$ Mn) Comparison by Country (2016-2032)
- Table 31: North America Ophthalmic Drugs Market Market Revenue (US$ Mn) (2016-2032)
- Table 32: North America Ophthalmic Drugs Market Market Revenue (US$ Mn) Comparison by Country (2016-2032)
- Table 33: North America Ophthalmic Drugs Market Market Revenue (US$ Mn) Comparison by By Disease (2016-2032)
- Table 34: North America Ophthalmic Drugs Market Market Revenue (US$ Mn) Comparison by By Drug Class (2016-2032)
- Table 35: North America Ophthalmic Drugs Market Market Revenue (US$ Mn) Comparison by By Dosage (2016-2032)
- Table 36: North America Ophthalmic Drugs Market Market Revenue (US$ Mn) Comparison by By Administration (2016-2032)
- Table 37: North America Ophthalmic Drugs Market Market Revenue (US$ Mn) Comparison by By Product (2016-2032)
- Table 38: North America Ophthalmic Drugs Market Market Y-o-Y Growth Rate Comparison by Country (2016-2032)
- Table 39: North America Ophthalmic Drugs Market Market Y-o-Y Growth Rate Comparison by By Disease (2016-2032)
- Table 40: North America Ophthalmic Drugs Market Market Y-o-Y Growth Rate Comparison by By Drug Class (2016-2032)
- Table 41: North America Ophthalmic Drugs Market Market Y-o-Y Growth Rate Comparison by By Dosage (2016-2032)
- Table 42: North America Ophthalmic Drugs Market Market Y-o-Y Growth Rate Comparison by By Administration (2016-2032)
- Table 43: North America Ophthalmic Drugs Market Market Y-o-Y Growth Rate Comparison by By Product (2016-2032)
- Table 44: North America Ophthalmic Drugs Market Market Share Comparison by Country (2016-2032)
- Table 45: North America Ophthalmic Drugs Market Market Share Comparison by By Disease (2016-2032)
- Table 46: North America Ophthalmic Drugs Market Market Share Comparison by By Drug Class (2016-2032)
- Table 47: North America Ophthalmic Drugs Market Market Share Comparison by By Dosage (2016-2032)
- Table 48: North America Ophthalmic Drugs Market Market Share Comparison by By Administration (2016-2032)
- Table 49: North America Ophthalmic Drugs Market Market Share Comparison by By Product (2016-2032)
- Table 50: Western Europe Ophthalmic Drugs Market Market Comparison by By Disease (2016-2032)
- Table 51: Western Europe Ophthalmic Drugs Market Market Comparison by By Drug Class (2016-2032)
- Table 52: Western Europe Ophthalmic Drugs Market Market Comparison by By Dosage (2016-2032)
- Table 53: Western Europe Ophthalmic Drugs Market Market Comparison by By Administration (2016-2032)
- Table 54: Western Europe Ophthalmic Drugs Market Market Comparison by By Product (2016-2032)
- Table 55: Western Europe Ophthalmic Drugs Market Revenue (US$ Mn) Comparison by Country (2016-2032)
- Table 56: Western Europe Ophthalmic Drugs Market Market Revenue (US$ Mn) (2016-2032)
- Table 57: Western Europe Ophthalmic Drugs Market Market Revenue (US$ Mn) Comparison by Country (2016-2032)
- Table 58: Western Europe Ophthalmic Drugs Market Market Revenue (US$ Mn) Comparison by By Disease (2016-2032)
- Table 59: Western Europe Ophthalmic Drugs Market Market Revenue (US$ Mn) Comparison by By Drug Class (2016-2032)
- Table 60: Western Europe Ophthalmic Drugs Market Market Revenue (US$ Mn) Comparison by By Dosage (2016-2032)
- Table 61: Western Europe Ophthalmic Drugs Market Market Revenue (US$ Mn) Comparison by By Administration (2016-2032)
- Table 62: Western Europe Ophthalmic Drugs Market Market Revenue (US$ Mn) Comparison by By Product (2016-2032)
- Table 63: Western Europe Ophthalmic Drugs Market Market Y-o-Y Growth Rate Comparison by Country (2016-2032)
- Table 64: Western Europe Ophthalmic Drugs Market Market Y-o-Y Growth Rate Comparison by By Disease (2016-2032)
- Table 65: Western Europe Ophthalmic Drugs Market Market Y-o-Y Growth Rate Comparison by By Drug Class (2016-2032)
- Table 66: Western Europe Ophthalmic Drugs Market Market Y-o-Y Growth Rate Comparison by By Dosage (2016-2032)
- Table 67: Western Europe Ophthalmic Drugs Market Market Y-o-Y Growth Rate Comparison by By Administration (2016-2032)
- Table 68: Western Europe Ophthalmic Drugs Market Market Y-o-Y Growth Rate Comparison by By Product (2016-2032)
- Table 69: Western Europe Ophthalmic Drugs Market Market Share Comparison by Country (2016-2032)
- Table 70: Western Europe Ophthalmic Drugs Market Market Share Comparison by By Disease (2016-2032)
- Table 71: Western Europe Ophthalmic Drugs Market Market Share Comparison by By Drug Class (2016-2032)
- Table 72: Western Europe Ophthalmic Drugs Market Market Share Comparison by By Dosage (2016-2032)
- Table 73: Western Europe Ophthalmic Drugs Market Market Share Comparison by By Administration (2016-2032)
- Table 74: Western Europe Ophthalmic Drugs Market Market Share Comparison by By Product (2016-2032)
- Table 75: Eastern Europe Ophthalmic Drugs Market Market Comparison by By Disease (2016-2032)
- Table 76: Eastern Europe Ophthalmic Drugs Market Market Comparison by By Drug Class (2016-2032)
- Table 77: Eastern Europe Ophthalmic Drugs Market Market Comparison by By Dosage (2016-2032)
- Table 78: Eastern Europe Ophthalmic Drugs Market Market Comparison by By Administration (2016-2032)
- Table 79: Eastern Europe Ophthalmic Drugs Market Market Comparison by By Product (2016-2032)
- Table 80: Eastern Europe Ophthalmic Drugs Market Revenue (US$ Mn) Comparison by Country (2016-2032)
- Table 81: Eastern Europe Ophthalmic Drugs Market Market Revenue (US$ Mn) (2016-2032)
- Table 82: Eastern Europe Ophthalmic Drugs Market Market Revenue (US$ Mn) Comparison by Country (2016-2032)
- Table 83: Eastern Europe Ophthalmic Drugs Market Market Revenue (US$ Mn) Comparison by By Disease (2016-2032)
- Table 84: Eastern Europe Ophthalmic Drugs Market Market Revenue (US$ Mn) Comparison by By Drug Class (2016-2032)
- Table 85: Eastern Europe Ophthalmic Drugs Market Market Revenue (US$ Mn) Comparison by By Dosage (2016-2032)
- Table 86: Eastern Europe Ophthalmic Drugs Market Market Revenue (US$ Mn) Comparison by By Administration (2016-2032)
- Table 87: Eastern Europe Ophthalmic Drugs Market Market Revenue (US$ Mn) Comparison by By Product (2016-2032)
- Table 88: Eastern Europe Ophthalmic Drugs Market Market Y-o-Y Growth Rate Comparison by Country (2016-2032)
- Table 89: Eastern Europe Ophthalmic Drugs Market Market Y-o-Y Growth Rate Comparison by By Disease (2016-2032)
- Table 90: Eastern Europe Ophthalmic Drugs Market Market Y-o-Y Growth Rate Comparison by By Drug Class (2016-2032)
- Table 91: Eastern Europe Ophthalmic Drugs Market Market Y-o-Y Growth Rate Comparison by By Dosage (2016-2032)
- Table 92: Eastern Europe Ophthalmic Drugs Market Market Y-o-Y Growth Rate Comparison by By Administration (2016-2032)
- Table 93: Eastern Europe Ophthalmic Drugs Market Market Y-o-Y Growth Rate Comparison by By Product (2016-2032)
- Table 94: Eastern Europe Ophthalmic Drugs Market Market Share Comparison by Country (2016-2032)
- Table 95: Eastern Europe Ophthalmic Drugs Market Market Share Comparison by By Disease (2016-2032)
- Table 96: Eastern Europe Ophthalmic Drugs Market Market Share Comparison by By Drug Class (2016-2032)
- Table 97: Eastern Europe Ophthalmic Drugs Market Market Share Comparison by By Dosage (2016-2032)
- Table 98: Eastern Europe Ophthalmic Drugs Market Market Share Comparison by By Administration (2016-2032)
- Table 99: Eastern Europe Ophthalmic Drugs Market Market Share Comparison by By Product (2016-2032)
- Table 100: APAC Ophthalmic Drugs Market Market Comparison by By Disease (2016-2032)
- Table 101: APAC Ophthalmic Drugs Market Market Comparison by By Drug Class (2016-2032)
- Table 102: APAC Ophthalmic Drugs Market Market Comparison by By Dosage (2016-2032)
- Table 103: APAC Ophthalmic Drugs Market Market Comparison by By Administration (2016-2032)
- Table 104: APAC Ophthalmic Drugs Market Market Comparison by By Product (2016-2032)
- Table 105: APAC Ophthalmic Drugs Market Revenue (US$ Mn) Comparison by Country (2016-2032)
- Table 106: APAC Ophthalmic Drugs Market Market Revenue (US$ Mn) (2016-2032)
- Table 107: APAC Ophthalmic Drugs Market Market Revenue (US$ Mn) Comparison by Country (2016-2032)
- Table 108: APAC Ophthalmic Drugs Market Market Revenue (US$ Mn) Comparison by By Disease (2016-2032)
- Table 109: APAC Ophthalmic Drugs Market Market Revenue (US$ Mn) Comparison by By Drug Class (2016-2032)
- Table 110: APAC Ophthalmic Drugs Market Market Revenue (US$ Mn) Comparison by By Dosage (2016-2032)
- Table 111: APAC Ophthalmic Drugs Market Market Revenue (US$ Mn) Comparison by By Administration (2016-2032)
- Table 112: APAC Ophthalmic Drugs Market Market Revenue (US$ Mn) Comparison by By Product (2016-2032)
- Table 113: APAC Ophthalmic Drugs Market Market Y-o-Y Growth Rate Comparison by Country (2016-2032)
- Table 114: APAC Ophthalmic Drugs Market Market Y-o-Y Growth Rate Comparison by By Disease (2016-2032)
- Table 115: APAC Ophthalmic Drugs Market Market Y-o-Y Growth Rate Comparison by By Drug Class (2016-2032)
- Table 116: APAC Ophthalmic Drugs Market Market Y-o-Y Growth Rate Comparison by By Dosage (2016-2032)
- Table 117: APAC Ophthalmic Drugs Market Market Y-o-Y Growth Rate Comparison by By Administration (2016-2032)
- Table 118: APAC Ophthalmic Drugs Market Market Y-o-Y Growth Rate Comparison by By Product (2016-2032)
- Table 119: APAC Ophthalmic Drugs Market Market Share Comparison by Country (2016-2032)
- Table 120: APAC Ophthalmic Drugs Market Market Share Comparison by By Disease (2016-2032)
- Table 121: APAC Ophthalmic Drugs Market Market Share Comparison by By Drug Class (2016-2032)
- Table 122: APAC Ophthalmic Drugs Market Market Share Comparison by By Dosage (2016-2032)
- Table 123: APAC Ophthalmic Drugs Market Market Share Comparison by By Administration (2016-2032)
- Table 124: APAC Ophthalmic Drugs Market Market Share Comparison by By Product (2016-2032)
- Table 125: Latin America Ophthalmic Drugs Market Market Comparison by By Disease (2016-2032)
- Table 126: Latin America Ophthalmic Drugs Market Market Comparison by By Drug Class (2016-2032)
- Table 127: Latin America Ophthalmic Drugs Market Market Comparison by By Dosage (2016-2032)
- Table 128: Latin America Ophthalmic Drugs Market Market Comparison by By Administration (2016-2032)
- Table 129: Latin America Ophthalmic Drugs Market Market Comparison by By Product (2016-2032)
- Table 130: Latin America Ophthalmic Drugs Market Revenue (US$ Mn) Comparison by Country (2016-2032)
- Table 131: Latin America Ophthalmic Drugs Market Market Revenue (US$ Mn) (2016-2032)
- Table 132: Latin America Ophthalmic Drugs Market Market Revenue (US$ Mn) Comparison by Country (2016-2032)
- Table 133: Latin America Ophthalmic Drugs Market Market Revenue (US$ Mn) Comparison by By Disease (2016-2032)
- Table 134: Latin America Ophthalmic Drugs Market Market Revenue (US$ Mn) Comparison by By Drug Class (2016-2032)
- Table 135: Latin America Ophthalmic Drugs Market Market Revenue (US$ Mn) Comparison by By Dosage (2016-2032)
- Table 136: Latin America Ophthalmic Drugs Market Market Revenue (US$ Mn) Comparison by By Administration (2016-2032)
- Table 137: Latin America Ophthalmic Drugs Market Market Revenue (US$ Mn) Comparison by By Product (2016-2032)
- Table 138: Latin America Ophthalmic Drugs Market Market Y-o-Y Growth Rate Comparison by Country (2016-2032)
- Table 139: Latin America Ophthalmic Drugs Market Market Y-o-Y Growth Rate Comparison by By Disease (2016-2032)
- Table 140: Latin America Ophthalmic Drugs Market Market Y-o-Y Growth Rate Comparison by By Drug Class (2016-2032)
- Table 141: Latin America Ophthalmic Drugs Market Market Y-o-Y Growth Rate Comparison by By Dosage (2016-2032)
- Table 142: Latin America Ophthalmic Drugs Market Market Y-o-Y Growth Rate Comparison by By Administration (2016-2032)
- Table 143: Latin America Ophthalmic Drugs Market Market Y-o-Y Growth Rate Comparison by By Product (2016-2032)
- Table 144: Latin America Ophthalmic Drugs Market Market Share Comparison by Country (2016-2032)
- Table 145: Latin America Ophthalmic Drugs Market Market Share Comparison by By Disease (2016-2032)
- Table 146: Latin America Ophthalmic Drugs Market Market Share Comparison by By Drug Class (2016-2032)
- Table 147: Latin America Ophthalmic Drugs Market Market Share Comparison by By Dosage (2016-2032)
- Table 148: Latin America Ophthalmic Drugs Market Market Share Comparison by By Administration (2016-2032)
- Table 149: Latin America Ophthalmic Drugs Market Market Share Comparison by By Product (2016-2032)
- Table 150: Middle East & Africa Ophthalmic Drugs Market Market Comparison by By Disease (2016-2032)
- Table 151: Middle East & Africa Ophthalmic Drugs Market Market Comparison by By Drug Class (2016-2032)
- Table 152: Middle East & Africa Ophthalmic Drugs Market Market Comparison by By Dosage (2016-2032)
- Table 153: Middle East & Africa Ophthalmic Drugs Market Market Comparison by By Administration (2016-2032)
- Table 154: Middle East & Africa Ophthalmic Drugs Market Market Comparison by By Product (2016-2032)
- Table 155: Middle East & Africa Ophthalmic Drugs Market Revenue (US$ Mn) Comparison by Country (2016-2032)
- Table 156: Middle East & Africa Ophthalmic Drugs Market Market Revenue (US$ Mn) (2016-2032)
- Table 157: Middle East & Africa Ophthalmic Drugs Market Market Revenue (US$ Mn) Comparison by Country (2016-2032)
- Table 158: Middle East & Africa Ophthalmic Drugs Market Market Revenue (US$ Mn) Comparison by By Disease (2016-2032)
- Table 159: Middle East & Africa Ophthalmic Drugs Market Market Revenue (US$ Mn) Comparison by By Drug Class (2016-2032)
- Table 160: Middle East & Africa Ophthalmic Drugs Market Market Revenue (US$ Mn) Comparison by By Dosage (2016-2032)
- Table 161: Middle East & Africa Ophthalmic Drugs Market Market Revenue (US$ Mn) Comparison by By Administration (2016-2032)
- Table 162: Middle East & Africa Ophthalmic Drugs Market Market Revenue (US$ Mn) Comparison by By Product (2016-2032)
- Table 163: Middle East & Africa Ophthalmic Drugs Market Market Y-o-Y Growth Rate Comparison by Country (2016-2032)
- Table 164: Middle East & Africa Ophthalmic Drugs Market Market Y-o-Y Growth Rate Comparison by By Disease (2016-2032)
- Table 165: Middle East & Africa Ophthalmic Drugs Market Market Y-o-Y Growth Rate Comparison by By Drug Class (2016-2032)
- Table 166: Middle East & Africa Ophthalmic Drugs Market Market Y-o-Y Growth Rate Comparison by By Dosage (2016-2032)
- Table 167: Middle East & Africa Ophthalmic Drugs Market Market Y-o-Y Growth Rate Comparison by By Administration (2016-2032)
- Table 168: Middle East & Africa Ophthalmic Drugs Market Market Y-o-Y Growth Rate Comparison by By Product (2016-2032)
- Table 169: Middle East & Africa Ophthalmic Drugs Market Market Share Comparison by Country (2016-2032)
- Table 170: Middle East & Africa Ophthalmic Drugs Market Market Share Comparison by By Disease (2016-2032)
- Table 171: Middle East & Africa Ophthalmic Drugs Market Market Share Comparison by By Drug Class (2016-2032)
- Table 172: Middle East & Africa Ophthalmic Drugs Market Market Share Comparison by By Dosage (2016-2032)
- Table 173: Middle East & Africa Ophthalmic Drugs Market Market Share Comparison by By Administration (2016-2032)
- Table 174: Middle East & Africa Ophthalmic Drugs Market Market Share Comparison by By Product (2016-2032)
- 1. Executive Summary
-
- Pfizer Inc.
- Alcon
- Novartis AG
- Bausch Health Companies Inc.
- Merck & Co., Inc
- Regeneron Pharmaceuticals Inc
- Allergan (AbbVie Inc)
- Bayer AG
- Genentech, Inc. (F. Hoffmann-La Roche Ltd)
- Nicox
- Coherus Biosciences, Inc.
Our Clients


View Our Licence Options
