
Oilfield Services Market By Service Type (Drilling and Completion Services, Exploration and Seismic Services, Production Services, Other), By Application (Onshore Services, Offshore Services), By Region And Companies - Industry Segment Outlook, Market Assessment, Competition Scenario, Trends, And Forecast 2023-2032
-
5665
-
May 2023
-
153
-


-
This report was compiled by Shreyas Rokade Shreyas Rokade is a seasoned Research Analyst with CMFE, bringing extensive expertise in market research and consulting, with a strong background in Chemical Engineering. Correspondence Team Lead-CMFE Linkedin | Detailed Market research Methodology Our methodology involves a mix of primary research, including interviews with leading mental health experts, and secondary research from reputable medical journals and databases. View Detailed Methodology Page
-
Quick Navigation
Report Overview
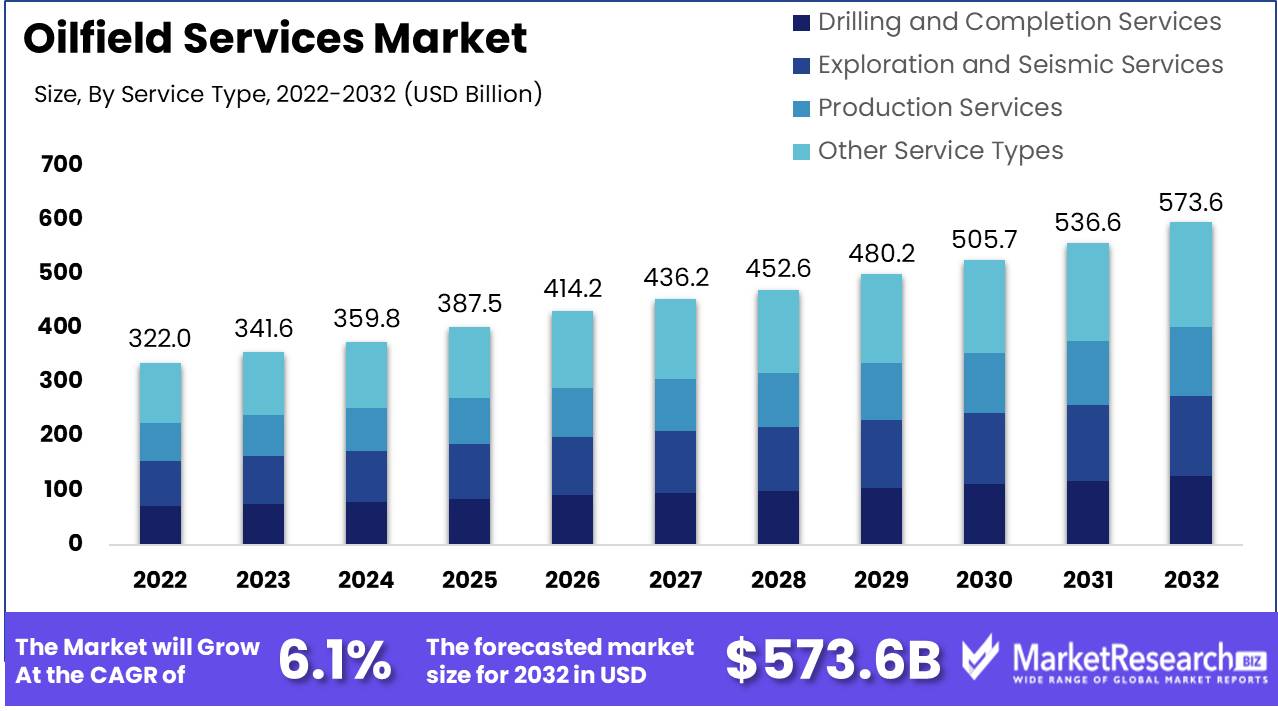
Oilfield services market size is expected to be worth around USD 573.6 Bn by 2032 from USD 322.0 Bn in 2022, growing at a CAGR of 6.1% during the forecast period from 2023 to 2032.
The oilfield services is an integral part of the energy industry, providing a variety of support services for oil and gas extraction operations. These services encompass a vast array of activities and functions, including exploration, drilling, well completion, production, and upkeep. The oilfield services market plays a crucial role in assuring the efficient and profitable extraction of oil and gas resources; thus, it is an integral component of the global energy landscape.
The primary objective of the oilfield services industry is to facilitate oil and gas companies' exploration and production activities. These companies enable the extraction of hydrocarbons from the earth's subsurface by supplying specialized services and equipment. Providers of oilfield services are primarily responsible for optimizing operational efficiency, increasing production rates, and reducing costs for their clients.
The market for oilfield services is crucial to the global energy industry. It assists oil and gas companies in streamlining operations, maximizing output, and minimizing downtime. This sector also plays a vital role in assuring the availability of energy resources for industries and consumers around the world. Without the support and expertise of oilfield services providers, oil and gas companies would struggle to extract hydrocarbons efficiently and economically.
Adoption of advanced technologies and digitalization is one of the most notable developments in the oilfield services market. To improve exploration and production, businesses are employing technologies such as artificial intelligence, big data analytics, and the Internet of Things (IoT). These advancements permit enhanced data analysis, real-time monitoring, and predictive maintenance, resulting in increased operational efficiency and decreased downtime.
Major investments and the incorporation of new technologies into products and services have also occurred on the oilfield services market. Companies are investing in R&D to create innovative technologies, tools, and instruments for oil and gas exploration and production. This includes, among other things, advancements in drilling techniques, well completion technologies, and pipeline infrastructure.
Driving factors
Increasing Global Demand for Energy
Increasing global energy demand is one of the key factors propelling the oilfield services market. As the world's economies continue to expand and develop, the demand for energy sources, especially oil and gas, has skyrocketed. This increase in demand is attributable to a number of factors, including population growth, industrialization, and urbanization. With a growing global population, energy consumption will inevitably increase. More individuals require electricity for their residences, fuel for their vehicles, and energy for a variety of industries. As developing nations endeavor to raise their living standards, their energy requirements increase exponentially.
Expansion of the Oil and Gas Industry
The expansion of the oil and gas industry is another major factor propelling the oilfield services market. As energy demand continues to increase, so too does the industry's need to meet these demands. This has led to an expansion of oil and gas exploration and production in both conventional and unconventional reserves.
Technological Advances in Drilling and Extraction
Developments in drilling and extraction technologies have also had a significant impact on the oilfield services market. With the advancement of technology, the capacity to access previously untouched oil and gas reserves has also increased. Techniques such as hydraulic fracturing (fracking) have made it possible to extract oil and gas from shale formations, vastly increasing the available resources and driving the development of the industry. The Engineering Design and Development Outsourcing Market benefits from Energy Engineering Services Outsourcing, fostering cutting-edge solutions.
Exploration and Production Efforts
Increasing exploration and production activities have also contributed to the rapid expansion of the market for oilfield services. As new reserves are discovered and developed, the demand for drilling, well construction, and completion services increases. Not only do exploration and production activities fuel the industry, but they also create opportunities for businesses to provide specialized services and equipment.
Environmental and Safety Regulations
The oil and gas industry's evolving environmental and safety regulations serve as market drivers for oilfield services. There has been a growing emphasis on environmental sustainability and safety measures in recent years. This has led to the imposition of stricter regulations on oilfield operations, mandating that companies implement cleaner and safer practices. These regulations generate demand for compliance assistance services. Environmental impact assessments, waste management, pollution control, and safety training are included in oilfield services.
Restraining Factors
Oil Price and Industry Cycle Fluctuations
The oilfield services market supports and equips oil and gas exploration, development, and production. However, many obstacles can limit this industry's growth and sustainability. Oil prices and industrial cycles may limit growth. Global economic conditions, geopolitical conflicts, and supply-demand imbalances have caused oil prices to fluctuate. Thus, oil price fluctuations affect the oilfield services market. Exploration and production grow with rising oil prices, increasing demand for oilfield services. Low oil prices reduce drilling and exploration investments, lowering demand for these services.
Geopolitical and regulatory uncertainties
The oilfield services market also faces geopolitical and regulatory issues. Politics, commerce, and regulations shape the global oil and gas business. Government policies and international relations can change market dynamics, causing uncertainty and disruption. Geopolitical tensions in oil-rich regions can interrupt supply, influencing oil prices and oilfield services. Environmental, safety, and taxes rules can change operational requirements and increase compliance costs for this industry.
Exploration/Production Cost Considerations
Capital-intensive oilfield services market exploration and production. Oil and gas extraction requires large investments in apparatus, technology, and trained workers. However, cost considerations may limit firms in this field. Geological complexity, oilfield location, infrastructure, and technology affect exploration and production costs. Deepwater or unconventional reserve extraction can be difficult and expensive. Maintaining and improving old infrastructure increases costs.
Alternative Energy Competition
Alternative energy sources particularly renewable energy are challenging the oilfield services market. Wind, solar, and hydroelectric power are in demand as the globe moves toward sustainability. This changing energy landscape may constrain the existing oilfield services market. Many nations and organizations are using renewable energy to cut greenhouse gas emissions and fight climate change. This energy preference shift may alter long-term oil and gas demand, influencing oilfield services.
Environmental and Social Issues
As society becomes more environmentally concerned, the oilfield services market is scrutinized for its environmental consequences. Oil and gas development can cause air and water pollution, habitat degradation, and community dislocation. The oilfield services market's reputation and sustainability depend on addressing these issues. Companies must prioritize environmental stewardship and social responsibility by developing comprehensive environmental management systems, following strict safety and environmental rules, and interacting with local communities to understand and address their issues.
Service Type Analysis
The Production Services Segment has emerged as the dominant service type in the oilfield services market. This segment encompasses a wide range of essential services that are required for the efficient and uninterrupted production of oil and gas reserves. These services include well intervention, artificial lift, completion and stimulation, production chemicals, and others. The primary driver behind the dominance of the Production Services Segment is its vital role in maximizing production output and minimizing operational costs. As oil and gas reserves become increasingly complex and mature, the need for specialized production services becomes paramount.
In recent years, there has been a notable shift in consumer trends and behaviors towards the Production Services Segment. Previously, oilfield operators relied heavily on in-house capabilities for production operations. However, the increasing complexity of reservoirs and the need for cost optimization has led to a growing preference for outsourcing production services to specialized service providers.
Key Market Segments
By Service Type
- Drilling and Completion Services
- Exploration and Seismic Services
- Production Services
- Other Service Types
By Application
- Onshore Services
- Offshore Services
Growth Opportunity
Utilizing the Strength of Deepwater Operations
Deepwater operations present a substantial market expansion opportunity for oilfield services. With technological advancements, ultra-deepwater oil and gas reserves are now economically viable to extract. Unlocking these resources requires specialized services and technologies, such as remotely operated vehicles (ROVs) and sophisticated drilling equipment. By providing innovative deepwater solutions, oilfield service providers can enter into a lucrative market segment and meet the growing demand for energy in regions with abundant untapped reserves.
Transforming Enhanced Oil Recovery Methods
In recent years, Enhanced Oil Recovery (EOR) techniques have acquired considerable popularity. By collaborating with oil and gas companies to optimize EOR practices, the oilfield services market can experience substantial growth. Incorporating innovative technologies such as carbon capture and storage (CCS) and steam-assisted gravity drainage (SAGD) ensures a sustainable approach to maximizing hydrocarbon recovery from mature fields as conventional extraction techniques become less effective.
Transition to Renewable Energy
The global energy landscape is swiftly changing, with renewable energy sources gaining prominence. As the world transitions to a low-carbon future, oilfield service providers can adapt and profit from this change. Diversifying into renewable energy services, such as offshore wind farm construction, environmental impact assessment, and maintenance services, offers a lucrative opportunity for expansion. By leveraging their expertise in project management and engineering, oilfield service companies can expand their revenue streams and reduce their dependence on traditional oil and gas markets while contributing to the renewable energy sector.
Innovating within the Digital Age
Utilizing the power of data and implementing cutting-edge technologies are crucial to the expansion of oilfield services in the current digital era. Implementing digital solutions, such as Internet of Things (IoT) sensors, artificial intelligence (AI), and predictive analytics, enables more efficient operations, increased safety, and improved decision-making abilities. By incorporating these technologies into their service offerings, oilfield service providers can boost asset performance, decrease downtime, and optimize resource allocation, resulting in increased profitability and customer satisfaction.
Research Institutions and Academic Institutions
Partnering with research institutions and academic institutions creates intriguing opportunities for market expansion in the oilfield services industry. Through collaboration on research and development projects, service providers can gain access to cutting-edge technologies and innovations, allowing them to remain ahead of the competition. Investing in research and nurturing the development of talent within the industry can also result in innovative solutions and enhanced efficiencies.
Latest Trends
Drilling and Completion Services
In the oil and gas industry, drilling and completion services are indispensable. As the global demand for energy continues to rise, drilling operations must become more efficient. Companies are investing significantly in cutting-edge drilling technologies and methods to improve well performance and maximize output. From horizontal drilling to hydraulic fracturing, industry executives are continuously developing new techniques to extract hydrocarbons from unconventional reservoirs. Our specialized team analyzes the most recent trends and provides valuable insights to assist you in comprehending how these innovations can impact your operations and propel your success.
Intervention and Production Boosting
Demand for well intervention and production enhancement services is skyrocketing in today's highly competitive oilfield services market. As the majority of oilfields around the world attain maturity, companies are concentrating on increasing production from existing wells. Well intervention techniques, such as stimulation, artificial lift, and workovers, are gaining in popularity as a means of enhancing well productivity. Our specialists monitor market dynamics and technological developments to guide you through the complexities of selecting the most appropriate intervention strategies, allowing you to maximize production and extend the life of your wells.
Automation and use of digital oilfield technologies
The oilfield services industry is rapidly adopting digital technologies and automation to achieve operational excellence in an era driven by digital transformation. The management of operations is being revolutionized by integrated data platforms, cloud computing, artificial intelligence, and the Internet of Things. Our highly qualified team is well-versed in these technologies and can provide valuable insight into their implementation and advantages. With our assistance, you can leverage digital solutions to enhance productivity, safety, and decision-making, and ultimately acquire a market advantage.
Integration of Oilfield Service Providers
The oilfield services industry is undergoing a transformation, with integrated service providers emerging as essential players. These businesses provide an extensive selection of services, integrating various facets of oilfield operations into a distinct entity. By combining activities such as drilling, well services, equipment supply, and maintenance, integrated service providers can deliver solutions that are both cost-effective and streamlined. Our team closely monitors this market trend, assisting you in navigating its complexities and locating a partner whose aims and objectives align with your own.
Enhanced Oil Recovery Technologies
Enhanced oil recovery (EOR) technologies are attracting a great deal of interest as companies seek to maximize hydrocarbon recovery from reservoirs. Thermal, chemical, and gas injection EOR techniques are used to release additional reserves and optimize production rates. Our industry specialists are well-versed in the most recent EOR technologies and are able to provide you with invaluable advice regarding their implementation. You can increase your oil recovery capabilities, reservoir performance, and long-term profitability by utilizing our insights.
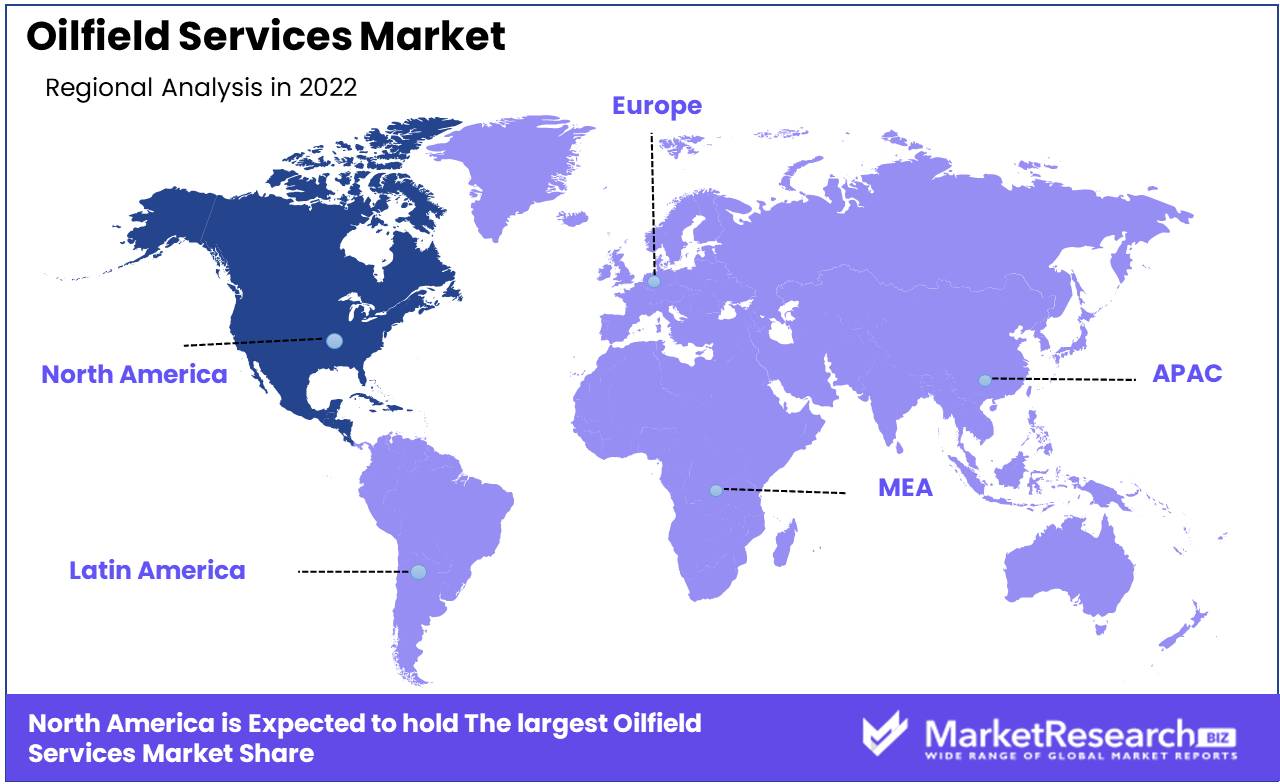
Regional Analysis
Oilfield services market Predominates in North America. In today's fast-paced world, the oil and gas industry is essential for driving economic development and meeting rising energy demands. The market for oilfield services holds a prominent position among the numerous subsectors of this industry. When it comes to dominating this market, the North American continent stands out.
The United States and Canada have emerged as market leaders in the oilfield services industry in North America. Several factors, including a well-established infrastructure, technological advancements, and abundant natural resources, contribute to the region's dominance.
In North America, especially the United States, there is a well-established network of energy and gas companies, service providers, and a vast supply chain. This infrastructure is the foundation of the region's market dominance in oilfield services. It enables seamless operations, efficient logistics, and the timely delivery of high-quality services by businesses.
North America is distinguished by its continued emphasis on technological advancements. This has led to the development of cutting-edge technologies and techniques. Modern drilling techniques, such as horizontal drilling and hydraulic fracturing, have substantially increased the oil and gas reserves' extraction potential. These developments have propelled North America to the vanguard of the market for oilfield services.
Key Regions and Countries
North America
- US
- Canada
- Mexico
Western Europe
- Germany
- France
- The UK
- Spain
- Italy
- Portugal
- Ireland
- Austria
- Switzerland
- Benelux
- Nordic
- Rest of Western Europe
Eastern Europe
- Russia
- Poland
- The Czech Republic
- Greece
- Rest of Eastern Europe
APAC
- China
- Japan
- South Korea
- India
- Australia & New Zealand
- Indonesia
- Malaysia
- Philippines
- Singapore
- Thailand
- Vietnam
- Rest of APAC
Latin America
- Brazil
- Colombia
- Chile
- Argentina
- Costa Rica
- Rest of Latin America
Middle East & Africa
- Algeria
- Egypt
- Israel
- Kuwait
- Nigeria
- Saudi Arabia
- South Africa
- Turkey
- United Arab Emirates
- Rest of MEA
Key Players Analysis
The oilfield services market is an integral part of the global energy sector. It comprises a vast array of activities, such as exploration, drilling, production, and maintenance, that facilitate the extraction and transportation of oil and gas resources. In this article, we will analyze the dominant market actors and their respective contributions, capabilities, and market standing.
Baker Hughes is an industry-leading oilfield services provider that offers a vast array of services and solutions to help oil and gas operators maximize their efficiency and output. Baker Hughes, with its headquarters in the United States, operates in multiple segments, including drilling, evaluation, completion, production, and intervention.
Another significant player in the oilfield services market, Halliburton is renowned for its innovation, dependability, and global presence. With its extensive technical expertise, the company endeavors to provide integrated solutions that address the industry's complex challenges.
Schlumberger is widely regarded as one of the largest oilfield services companies in the world, serving the energy industry in over 120 countries. The company is renowned for its commitment to research and development, which consistently pushes the limits of technological innovation.
Weatherford is a prominent global provider of equipment and services for oil and gas resource drilling, evaluation, and production. The company operates in both conventional and nonconventional fields, offering an extensive portfolio of products and solutions that are customized to satisfy the needs of individual customers.
Superior Energy Services is a diversified oilfield services company that offers a comprehensive suite of solutions to maximize global energy production and efficiency. The company offers drilling and production-related services, as well as well intervention and pressure pumping, with an emphasis on operational excellence.
NOV Inc., also known as National Oilwell Varco, is a prominent provider of advanced oil and gas industry equipment, components, and services. Rig Technologies, Wellbore Technologies, and Completion & Production Solutions are some of the business segments the company operates in.
Top Key Players in oilfield services market
- Baker Hughes Company (U.S.)
- Halliburton (U.S.)
- Schlumberger Limited. (U.S.)
- Weatherford (U.S.)
- Superior Energy Services. (U.S.)
- NOV Inc. (U.S.)
- China Oilfield Services Limited (China)
- ARCHER OILFIELD ENGINEERS (India)
- Expro Group. (U.K.)
- TechnipFMC plc (U.K.)
- General Electric (U.S.)
- Trican. (Canada)
- Welltec A/S (Denmark)
- Basic Energy Corporation. (U.S.)
- Nabors Industries Ltd. (Bermuda)
- Pioneer Natural Resources Company. (U.S.)
- Edgo (UAE)
Recent Development
- In 2023, Schlumberger's acquisition of Cameron International is expected to create a new industry giant with a combined market capitalization of over $100 billion. The deal will give Schlumberger access to Cameron International's expertise in subsea production systems, which is a key growth area for the oil and gas industry.
- In 2022, Halliburton's acquisition of Baker Hughes is expected to create a new company with a market capitalization of over $80 billion. The deal will give Halliburton access to Baker Hughes' expertise in reservoir stimulation and production technologies, which are also key growth areas for the oil and gas industry.
- In 2021, Weatherford's acquisition of Expro Group is expected to create a new company with a market capitalization of over $5 billion. The deal will give Weatherford access to Expro Group's expertise in well flow management and production solutions, which will help Weatherford to expand its product portfolio and reach new customers.
- In 2020, National Oilwell Varco's acquisition of NOV Composites is expected to give NOV a significant advantage in the market for advanced composite tubular technology. NOV Composites' products are lightweight and corrosion-resistant, which makes them ideal for use in harsh environments
Report Scope:
Report Features Description Market Value (2022) USD 322.0 Bn Forecast Revenue (2032) USD 573.6 Bn CAGR (2023-2032) 6.1% Base Year for Estimation 2022 Historic Period 2016-2022 Forecast Period 2023-2032 Report Coverage Revenue Forecast, Market Dynamics, COVID-19 Impact, Competitive Landscape, Recent Developments Segments Covered By Service Type (Drilling and Completion Services, Exploration and Seismic Services, Production Services, Other Service Types)
By Application (Onshore Services, Offshore ServicesRegional Analysis North America – The US, Canada, & Mexico; Western Europe – Germany, France, The UK, Spain, Italy, Portugal, Ireland, Austria, Switzerland, Benelux, Nordic, & Rest of Western Europe; Eastern Europe – Russia, Poland, The Czech Republic, Greece, & Rest of Eastern Europe; APAC – China, Japan, South Korea, India, Australia & New Zealand, Indonesia, Malaysia, Philippines, Singapore, Thailand, Vietnam, & Rest of APAC; Latin America – Brazil, Colombia, Chile, Argentina, Costa Rica, & Rest of Latin America; Middle East & Africa – Algeria, Egypt, Israel, Kuwait, Nigeria, Saudi Arabia, South Africa, Turkey, United Arab Emirates, & Rest of MEA Competitive Landscape Baker Hughes Company (U.S.), Halliburton (U.S.), Schlumberger Limited. (U.S.), Weatherford (U.S.), Superior Energy Services. (U.S.), NOV Inc. (U.S.), China Oilfield Services Limited (China), ARCHER OILFIELD ENGINEERS (India), Expro Group. (U.K.), TechnipFMC plc (U.K.), General Electric (U.S.), Trican. (Canada), Welltec A/S (Denmark), Basic Energy Corporation. (U.S.), Nabors Industries Ltd. (Bermuda), Pioneer Natural Resources Company. (U.S.), Edgo (UAE) Customization Scope Customization for segments, region/country-level will be provided. Moreover, additional customization can be done based on the requirements. Purchase Options We have three licenses to opt for: Single User License, Multi-User License (Up to 5 Users), Corporate Use License (Unlimited User and Printable PDF) -
- 1. Executive Summary
- 1.1. Definition
- 1.2. Taxonomy
- 1.3. Research Scope
- 1.4. Key Analysis
- 1.5. Key Findings by Major Segments
- 1.6. Top strategies by Major Players
- 2. Global Oilfield Services Market Overview
- 2.1. Oilfield Services Market Dynamics
- 2.1.1. Drivers
- 2.1.2. Opportunities
- 2.1.3. Restraints
- 2.1.4. Challenges
- 2.2. Macro-economic Factors
- 2.3. Regulatory Framework
- 2.4. Market Investment Feasibility Index
- 2.5. PEST Analysis
- 2.6. PORTER’S Five Force Analysis
- 2.7. Drivers & Restraints Impact Analysis
- 2.8. Industry Chain Analysis
- 2.9. Cost Structure Analysis
- 2.10. Marketing Strategy
- 2.11. Russia-Ukraine War Impact Analysis
- 2.12. Opportunity Map Analysis
- 2.13. Market Competition Scenario Analysis
- 2.14. Product Life Cycle Analysis
- 2.15. Opportunity Orbits
- 2.16. Manufacturer Intensity Map
- 2.17. Major Companies sales by Value & Volume
- 2.1. Oilfield Services Market Dynamics
- 3. Global Oilfield Services Market Analysis, Opportunity and Forecast, 2016-2032
- 3.1. Global Oilfield Services Market Analysis, 2016-2021
- 3.2. Global Oilfield Services Market Opportunity and Forecast, 2023-2032
- 3.3. Global Oilfield Services Market Analysis, Opportunity and Forecast, By By Service Type, 2016-2032
- 3.3.1. Global Oilfield Services Market Analysis by By Service Type: Introduction
- 3.3.2. Market Size Absolute $ Opportunity Analysis and Forecast, By By Service Type, 2016-2032
- 3.3.3. Drilling and Completion Services
- 3.3.4. Exploration and Seismic Services
- 3.3.5. Production Services
- 3.3.6. Other Service Types
- 3.4. Global Oilfield Services Market Analysis, Opportunity and Forecast, By By Application, 2016-2032
- 3.4.1. Global Oilfield Services Market Analysis by By Application: Introduction
- 3.4.2. Market Size Absolute $ Opportunity Analysis and Forecast, By By Application, 2016-2032
- 3.4.3. Onshore Services
- 3.4.4. Offshore Services
- 4. North America Oilfield Services Market Analysis, Opportunity and Forecast, 2016-2032
- 4.1. North America Oilfield Services Market Analysis, 2016-2021
- 4.2. North America Oilfield Services Market Opportunity and Forecast, 2023-2032
- 4.3. North America Oilfield Services Market Analysis, Opportunity and Forecast, By By Service Type, 2016-2032
- 4.3.1. North America Oilfield Services Market Analysis by By Service Type: Introduction
- 4.3.2. Market Size Absolute $ Opportunity Analysis and Forecast, By By Service Type, 2016-2032
- 4.3.3. Drilling and Completion Services
- 4.3.4. Exploration and Seismic Services
- 4.3.5. Production Services
- 4.3.6. Other Service Types
- 4.4. North America Oilfield Services Market Analysis, Opportunity and Forecast, By By Application, 2016-2032
- 4.4.1. North America Oilfield Services Market Analysis by By Application: Introduction
- 4.4.2. Market Size Absolute $ Opportunity Analysis and Forecast, By By Application, 2016-2032
- 4.4.3. Onshore Services
- 4.4.4. Offshore Services
- 4.5. North America Oilfield Services Market Analysis, Opportunity and Forecast, By Country , 2016-2032
- 4.5.1. North America Oilfield Services Market Analysis by Country : Introduction
- 4.5.2. Market Size Absolute $ Opportunity Analysis and Forecast, Country , 2016-2032
- 4.5.2.1. The US
- 4.5.2.2. Canada
- 4.5.2.3. Mexico
- 5. Western Europe Oilfield Services Market Analysis, Opportunity and Forecast, 2016-2032
- 5.1. Western Europe Oilfield Services Market Analysis, 2016-2021
- 5.2. Western Europe Oilfield Services Market Opportunity and Forecast, 2023-2032
- 5.3. Western Europe Oilfield Services Market Analysis, Opportunity and Forecast, By By Service Type, 2016-2032
- 5.3.1. Western Europe Oilfield Services Market Analysis by By Service Type: Introduction
- 5.3.2. Market Size Absolute $ Opportunity Analysis and Forecast, By By Service Type, 2016-2032
- 5.3.3. Drilling and Completion Services
- 5.3.4. Exploration and Seismic Services
- 5.3.5. Production Services
- 5.3.6. Other Service Types
- 5.4. Western Europe Oilfield Services Market Analysis, Opportunity and Forecast, By By Application, 2016-2032
- 5.4.1. Western Europe Oilfield Services Market Analysis by By Application: Introduction
- 5.4.2. Market Size Absolute $ Opportunity Analysis and Forecast, By By Application, 2016-2032
- 5.4.3. Onshore Services
- 5.4.4. Offshore Services
- 5.5. Western Europe Oilfield Services Market Analysis, Opportunity and Forecast, By Country , 2016-2032
- 5.5.1. Western Europe Oilfield Services Market Analysis by Country : Introduction
- 5.5.2. Market Size Absolute $ Opportunity Analysis and Forecast, Country , 2016-2032
- 5.5.2.1. Germany
- 5.5.2.2. France
- 5.5.2.3. The UK
- 5.5.2.4. Spain
- 5.5.2.5. Italy
- 5.5.2.6. Portugal
- 5.5.2.7. Ireland
- 5.5.2.8. Austria
- 5.5.2.9. Switzerland
- 5.5.2.10. Benelux
- 5.5.2.11. Nordic
- 5.5.2.12. Rest of Western Europe
- 6. Eastern Europe Oilfield Services Market Analysis, Opportunity and Forecast, 2016-2032
- 6.1. Eastern Europe Oilfield Services Market Analysis, 2016-2021
- 6.2. Eastern Europe Oilfield Services Market Opportunity and Forecast, 2023-2032
- 6.3. Eastern Europe Oilfield Services Market Analysis, Opportunity and Forecast, By By Service Type, 2016-2032
- 6.3.1. Eastern Europe Oilfield Services Market Analysis by By Service Type: Introduction
- 6.3.2. Market Size Absolute $ Opportunity Analysis and Forecast, By By Service Type, 2016-2032
- 6.3.3. Drilling and Completion Services
- 6.3.4. Exploration and Seismic Services
- 6.3.5. Production Services
- 6.3.6. Other Service Types
- 6.4. Eastern Europe Oilfield Services Market Analysis, Opportunity and Forecast, By By Application, 2016-2032
- 6.4.1. Eastern Europe Oilfield Services Market Analysis by By Application: Introduction
- 6.4.2. Market Size Absolute $ Opportunity Analysis and Forecast, By By Application, 2016-2032
- 6.4.3. Onshore Services
- 6.4.4. Offshore Services
- 6.5. Eastern Europe Oilfield Services Market Analysis, Opportunity and Forecast, By Country , 2016-2032
- 6.5.1. Eastern Europe Oilfield Services Market Analysis by Country : Introduction
- 6.5.2. Market Size Absolute $ Opportunity Analysis and Forecast, Country , 2016-2032
- 6.5.2.1. Russia
- 6.5.2.2. Poland
- 6.5.2.3. The Czech Republic
- 6.5.2.4. Greece
- 6.5.2.5. Rest of Eastern Europe
- 7. APAC Oilfield Services Market Analysis, Opportunity and Forecast, 2016-2032
- 7.1. APAC Oilfield Services Market Analysis, 2016-2021
- 7.2. APAC Oilfield Services Market Opportunity and Forecast, 2023-2032
- 7.3. APAC Oilfield Services Market Analysis, Opportunity and Forecast, By By Service Type, 2016-2032
- 7.3.1. APAC Oilfield Services Market Analysis by By Service Type: Introduction
- 7.3.2. Market Size Absolute $ Opportunity Analysis and Forecast, By By Service Type, 2016-2032
- 7.3.3. Drilling and Completion Services
- 7.3.4. Exploration and Seismic Services
- 7.3.5. Production Services
- 7.3.6. Other Service Types
- 7.4. APAC Oilfield Services Market Analysis, Opportunity and Forecast, By By Application, 2016-2032
- 7.4.1. APAC Oilfield Services Market Analysis by By Application: Introduction
- 7.4.2. Market Size Absolute $ Opportunity Analysis and Forecast, By By Application, 2016-2032
- 7.4.3. Onshore Services
- 7.4.4. Offshore Services
- 7.5. APAC Oilfield Services Market Analysis, Opportunity and Forecast, By Country , 2016-2032
- 7.5.1. APAC Oilfield Services Market Analysis by Country : Introduction
- 7.5.2. Market Size Absolute $ Opportunity Analysis and Forecast, Country , 2016-2032
- 7.5.2.1. China
- 7.5.2.2. Japan
- 7.5.2.3. South Korea
- 7.5.2.4. India
- 7.5.2.5. Australia & New Zeland
- 7.5.2.6. Indonesia
- 7.5.2.7. Malaysia
- 7.5.2.8. Philippines
- 7.5.2.9. Singapore
- 7.5.2.10. Thailand
- 7.5.2.11. Vietnam
- 7.5.2.12. Rest of APAC
- 8. Latin America Oilfield Services Market Analysis, Opportunity and Forecast, 2016-2032
- 8.1. Latin America Oilfield Services Market Analysis, 2016-2021
- 8.2. Latin America Oilfield Services Market Opportunity and Forecast, 2023-2032
- 8.3. Latin America Oilfield Services Market Analysis, Opportunity and Forecast, By By Service Type, 2016-2032
- 8.3.1. Latin America Oilfield Services Market Analysis by By Service Type: Introduction
- 8.3.2. Market Size Absolute $ Opportunity Analysis and Forecast, By By Service Type, 2016-2032
- 8.3.3. Drilling and Completion Services
- 8.3.4. Exploration and Seismic Services
- 8.3.5. Production Services
- 8.3.6. Other Service Types
- 8.4. Latin America Oilfield Services Market Analysis, Opportunity and Forecast, By By Application, 2016-2032
- 8.4.1. Latin America Oilfield Services Market Analysis by By Application: Introduction
- 8.4.2. Market Size Absolute $ Opportunity Analysis and Forecast, By By Application, 2016-2032
- 8.4.3. Onshore Services
- 8.4.4. Offshore Services
- 8.5. Latin America Oilfield Services Market Analysis, Opportunity and Forecast, By Country , 2016-2032
- 8.5.1. Latin America Oilfield Services Market Analysis by Country : Introduction
- 8.5.2. Market Size Absolute $ Opportunity Analysis and Forecast, Country , 2016-2032
- 8.5.2.1. Brazil
- 8.5.2.2. Colombia
- 8.5.2.3. Chile
- 8.5.2.4. Argentina
- 8.5.2.5. Costa Rica
- 8.5.2.6. Rest of Latin America
- 9. Middle East & Africa Oilfield Services Market Analysis, Opportunity and Forecast, 2016-2032
- 9.1. Middle East & Africa Oilfield Services Market Analysis, 2016-2021
- 9.2. Middle East & Africa Oilfield Services Market Opportunity and Forecast, 2023-2032
- 9.3. Middle East & Africa Oilfield Services Market Analysis, Opportunity and Forecast, By By Service Type, 2016-2032
- 9.3.1. Middle East & Africa Oilfield Services Market Analysis by By Service Type: Introduction
- 9.3.2. Market Size Absolute $ Opportunity Analysis and Forecast, By By Service Type, 2016-2032
- 9.3.3. Drilling and Completion Services
- 9.3.4. Exploration and Seismic Services
- 9.3.5. Production Services
- 9.3.6. Other Service Types
- 9.4. Middle East & Africa Oilfield Services Market Analysis, Opportunity and Forecast, By By Application, 2016-2032
- 9.4.1. Middle East & Africa Oilfield Services Market Analysis by By Application: Introduction
- 9.4.2. Market Size Absolute $ Opportunity Analysis and Forecast, By By Application, 2016-2032
- 9.4.3. Onshore Services
- 9.4.4. Offshore Services
- 9.5. Middle East & Africa Oilfield Services Market Analysis, Opportunity and Forecast, By Country , 2016-2032
- 9.5.1. Middle East & Africa Oilfield Services Market Analysis by Country : Introduction
- 9.5.2. Market Size Absolute $ Opportunity Analysis and Forecast, Country , 2016-2032
- 9.5.2.1. Algeria
- 9.5.2.2. Egypt
- 9.5.2.3. Israel
- 9.5.2.4. Kuwait
- 9.5.2.5. Nigeria
- 9.5.2.6. Saudi Arabia
- 9.5.2.7. South Africa
- 9.5.2.8. Turkey
- 9.5.2.9. The UAE
- 9.5.2.10. Rest of MEA
- 10. Global Oilfield Services Market Analysis, Opportunity and Forecast, By Region , 2016-2032
- 10.1. Global Oilfield Services Market Analysis by Region : Introduction
- 10.2. Market Size Absolute $ Opportunity Analysis and Forecast, By Region , 2016-2032
- 10.2.1. North America
- 10.2.2. Western Europe
- 10.2.3. Eastern Europe
- 10.2.4. APAC
- 10.2.5. Latin America
- 10.2.6. Middle East & Africa
- 11. Global Oilfield Services Market Competitive Landscape, Market Share Analysis, and Company Profiles
- 11.1. Market Share Analysis
- 11.2. Company Profiles
- 11.3. Baker Hughes Company (U.S.)
- 11.3.1. Company Overview
- 11.3.2. Financial Highlights
- 11.3.3. Product Portfolio
- 11.3.4. SWOT Analysis
- 11.3.5. Key Strategies and Developments
- 11.4. Halliburton (U.S.)
- 11.4.1. Company Overview
- 11.4.2. Financial Highlights
- 11.4.3. Product Portfolio
- 11.4.4. SWOT Analysis
- 11.4.5. Key Strategies and Developments
- 11.5. Schlumberger Limited. (U.S.)
- 11.5.1. Company Overview
- 11.5.2. Financial Highlights
- 11.5.3. Product Portfolio
- 11.5.4. SWOT Analysis
- 11.5.5. Key Strategies and Developments
- 11.6. Weatherford (U.S.)
- 11.6.1. Company Overview
- 11.6.2. Financial Highlights
- 11.6.3. Product Portfolio
- 11.6.4. SWOT Analysis
- 11.6.5. Key Strategies and Developments
- 11.7. Superior Energy Services. (U.S.)
- 11.7.1. Company Overview
- 11.7.2. Financial Highlights
- 11.7.3. Product Portfolio
- 11.7.4. SWOT Analysis
- 11.7.5. Key Strategies and Developments
- 11.8. NOV Inc. (U.S.)
- 11.8.1. Company Overview
- 11.8.2. Financial Highlights
- 11.8.3. Product Portfolio
- 11.8.4. SWOT Analysis
- 11.8.5. Key Strategies and Developments
- 11.9. China Oilfield Services Limited (China)
- 11.9.1. Company Overview
- 11.9.2. Financial Highlights
- 11.9.3. Product Portfolio
- 11.9.4. SWOT Analysis
- 11.9.5. Key Strategies and Developments
- 11.10. ARCHER OILFIELD ENGINEERS (India)
- 11.10.1. Company Overview
- 11.10.2. Financial Highlights
- 11.10.3. Product Portfolio
- 11.10.4. SWOT Analysis
- 11.10.5. Key Strategies and Developments
- 11.11. Expro Group. (U.K.)
- 11.11.1. Company Overview
- 11.11.2. Financial Highlights
- 11.11.3. Product Portfolio
- 11.11.4. SWOT Analysis
- 11.11.5. Key Strategies and Developments
- 11.12. TechnipFMC plc (U.K.)
- 11.12.1. Company Overview
- 11.12.2. Financial Highlights
- 11.12.3. Product Portfolio
- 11.12.4. SWOT Analysis
- 11.12.5. Key Strategies and Developments
- 11.13. General Electric (U.S.)
- 11.13.1. Company Overview
- 11.13.2. Financial Highlights
- 11.13.3. Product Portfolio
- 11.13.4. SWOT Analysis
- 11.13.5. Key Strategies and Developments
- 11.14. Trican. (Canada)
- 11.14.1. Company Overview
- 11.14.2. Financial Highlights
- 11.14.3. Product Portfolio
- 11.14.4. SWOT Analysis
- 11.14.5. Key Strategies and Developments
- 11.15. Welltec A/S (Denmark)
- 11.15.1. Company Overview
- 11.15.2. Financial Highlights
- 11.15.3. Product Portfolio
- 11.15.4. SWOT Analysis
- 11.15.5. Key Strategies and Developments
- 11.16. Basic Energy Corporation. (U.S.)
- 11.16.1. Company Overview
- 11.16.2. Financial Highlights
- 11.16.3. Product Portfolio
- 11.16.4. SWOT Analysis
- 11.16.5. Key Strategies and Developments
- 11.17. Nabors Industries Ltd. (Bermuda)
- 11.17.1. Company Overview
- 11.17.2. Financial Highlights
- 11.17.3. Product Portfolio
- 11.17.4. SWOT Analysis
- 11.17.5. Key Strategies and Developments
- 11.18. Pioneer Natural Resources Company. (U.S.)
- 11.18.1. Company Overview
- 11.18.2. Financial Highlights
- 11.18.3. Product Portfolio
- 11.18.4. SWOT Analysis
- 11.18.5. Key Strategies and Developments
- 11.19. Edgo (UAE)
- 11.19.1. Company Overview
- 11.19.2. Financial Highlights
- 11.19.3. Product Portfolio
- 11.19.4. SWOT Analysis
- 11.19.5. Key Strategies and Developments
- 12. Assumptions and Acronyms
- 13. Research Methodology
- 14. Contact
- List of Figures
- Figure 1: Global Oilfield Services Market Revenue (US$ Mn) Market Share by By Service Type in 2022
- Figure 2: Global Oilfield Services Market Attractiveness Analysis by By Service Type, 2016-2032
- Figure 3: Global Oilfield Services Market Revenue (US$ Mn) Market Share by By Applicationin 2022
- Figure 4: Global Oilfield Services Market Attractiveness Analysis by By Application, 2016-2032
- Figure 5: Global Oilfield Services Market Revenue (US$ Mn) Market Share by Region in 2022
- Figure 6: Global Oilfield Services Market Attractiveness Analysis by Region, 2016-2032
- Figure 7: Global Oilfield Services Market Revenue (US$ Mn) (2016-2032)
- Figure 8: Global Oilfield Services Market Revenue (US$ Mn) Comparison by Region (2016-2032)
- Figure 9: Global Oilfield Services Market Revenue (US$ Mn) Comparison by By Service Type (2016-2032)
- Figure 10: Global Oilfield Services Market Revenue (US$ Mn) Comparison by By Application (2016-2032)
- Figure 11: Global Oilfield Services Market Y-o-Y Growth Rate Comparison by Region (2016-2032)
- Figure 12: Global Oilfield Services Market Y-o-Y Growth Rate Comparison by By Service Type (2016-2032)
- Figure 13: Global Oilfield Services Market Y-o-Y Growth Rate Comparison by By Application (2016-2032)
- Figure 14: Global Oilfield Services Market Share Comparison by Region (2016-2032)
- Figure 15: Global Oilfield Services Market Share Comparison by By Service Type (2016-2032)
- Figure 16: Global Oilfield Services Market Share Comparison by By Application (2016-2032)
- Figure 17: North America Oilfield Services Market Revenue (US$ Mn) Market Share by By Service Typein 2022
- Figure 18: North America Oilfield Services Market Attractiveness Analysis by By Service Type, 2016-2032
- Figure 19: North America Oilfield Services Market Revenue (US$ Mn) Market Share by By Applicationin 2022
- Figure 20: North America Oilfield Services Market Attractiveness Analysis by By Application, 2016-2032
- Figure 21: North America Oilfield Services Market Revenue (US$ Mn) Market Share by Country in 2022
- Figure 22: North America Oilfield Services Market Attractiveness Analysis by Country, 2016-2032
- Figure 23: North America Oilfield Services Market Revenue (US$ Mn) (2016-2032)
- Figure 24: North America Oilfield Services Market Revenue (US$ Mn) Comparison by Country (2016-2032)
- Figure 25: North America Oilfield Services Market Revenue (US$ Mn) Comparison by By Service Type (2016-2032)
- Figure 26: North America Oilfield Services Market Revenue (US$ Mn) Comparison by By Application (2016-2032)
- Figure 27: North America Oilfield Services Market Y-o-Y Growth Rate Comparison by Country (2016-2032)
- Figure 28: North America Oilfield Services Market Y-o-Y Growth Rate Comparison by By Service Type (2016-2032)
- Figure 29: North America Oilfield Services Market Y-o-Y Growth Rate Comparison by By Application (2016-2032)
- Figure 30: North America Oilfield Services Market Share Comparison by Country (2016-2032)
- Figure 31: North America Oilfield Services Market Share Comparison by By Service Type (2016-2032)
- Figure 32: North America Oilfield Services Market Share Comparison by By Application (2016-2032)
- Figure 33: Western Europe Oilfield Services Market Revenue (US$ Mn) Market Share by By Service Typein 2022
- Figure 34: Western Europe Oilfield Services Market Attractiveness Analysis by By Service Type, 2016-2032
- Figure 35: Western Europe Oilfield Services Market Revenue (US$ Mn) Market Share by By Applicationin 2022
- Figure 36: Western Europe Oilfield Services Market Attractiveness Analysis by By Application, 2016-2032
- Figure 37: Western Europe Oilfield Services Market Revenue (US$ Mn) Market Share by Country in 2022
- Figure 38: Western Europe Oilfield Services Market Attractiveness Analysis by Country, 2016-2032
- Figure 39: Western Europe Oilfield Services Market Revenue (US$ Mn) (2016-2032)
- Figure 40: Western Europe Oilfield Services Market Revenue (US$ Mn) Comparison by Country (2016-2032)
- Figure 41: Western Europe Oilfield Services Market Revenue (US$ Mn) Comparison by By Service Type (2016-2032)
- Figure 42: Western Europe Oilfield Services Market Revenue (US$ Mn) Comparison by By Application (2016-2032)
- Figure 43: Western Europe Oilfield Services Market Y-o-Y Growth Rate Comparison by Country (2016-2032)
- Figure 44: Western Europe Oilfield Services Market Y-o-Y Growth Rate Comparison by By Service Type (2016-2032)
- Figure 45: Western Europe Oilfield Services Market Y-o-Y Growth Rate Comparison by By Application (2016-2032)
- Figure 46: Western Europe Oilfield Services Market Share Comparison by Country (2016-2032)
- Figure 47: Western Europe Oilfield Services Market Share Comparison by By Service Type (2016-2032)
- Figure 48: Western Europe Oilfield Services Market Share Comparison by By Application (2016-2032)
- Figure 49: Eastern Europe Oilfield Services Market Revenue (US$ Mn) Market Share by By Service Typein 2022
- Figure 50: Eastern Europe Oilfield Services Market Attractiveness Analysis by By Service Type, 2016-2032
- Figure 51: Eastern Europe Oilfield Services Market Revenue (US$ Mn) Market Share by By Applicationin 2022
- Figure 52: Eastern Europe Oilfield Services Market Attractiveness Analysis by By Application, 2016-2032
- Figure 53: Eastern Europe Oilfield Services Market Revenue (US$ Mn) Market Share by Country in 2022
- Figure 54: Eastern Europe Oilfield Services Market Attractiveness Analysis by Country, 2016-2032
- Figure 55: Eastern Europe Oilfield Services Market Revenue (US$ Mn) (2016-2032)
- Figure 56: Eastern Europe Oilfield Services Market Revenue (US$ Mn) Comparison by Country (2016-2032)
- Figure 57: Eastern Europe Oilfield Services Market Revenue (US$ Mn) Comparison by By Service Type (2016-2032)
- Figure 58: Eastern Europe Oilfield Services Market Revenue (US$ Mn) Comparison by By Application (2016-2032)
- Figure 59: Eastern Europe Oilfield Services Market Y-o-Y Growth Rate Comparison by Country (2016-2032)
- Figure 60: Eastern Europe Oilfield Services Market Y-o-Y Growth Rate Comparison by By Service Type (2016-2032)
- Figure 61: Eastern Europe Oilfield Services Market Y-o-Y Growth Rate Comparison by By Application (2016-2032)
- Figure 62: Eastern Europe Oilfield Services Market Share Comparison by Country (2016-2032)
- Figure 63: Eastern Europe Oilfield Services Market Share Comparison by By Service Type (2016-2032)
- Figure 64: Eastern Europe Oilfield Services Market Share Comparison by By Application (2016-2032)
- Figure 65: APAC Oilfield Services Market Revenue (US$ Mn) Market Share by By Service Typein 2022
- Figure 66: APAC Oilfield Services Market Attractiveness Analysis by By Service Type, 2016-2032
- Figure 67: APAC Oilfield Services Market Revenue (US$ Mn) Market Share by By Applicationin 2022
- Figure 68: APAC Oilfield Services Market Attractiveness Analysis by By Application, 2016-2032
- Figure 69: APAC Oilfield Services Market Revenue (US$ Mn) Market Share by Country in 2022
- Figure 70: APAC Oilfield Services Market Attractiveness Analysis by Country, 2016-2032
- Figure 71: APAC Oilfield Services Market Revenue (US$ Mn) (2016-2032)
- Figure 72: APAC Oilfield Services Market Revenue (US$ Mn) Comparison by Country (2016-2032)
- Figure 73: APAC Oilfield Services Market Revenue (US$ Mn) Comparison by By Service Type (2016-2032)
- Figure 74: APAC Oilfield Services Market Revenue (US$ Mn) Comparison by By Application (2016-2032)
- Figure 75: APAC Oilfield Services Market Y-o-Y Growth Rate Comparison by Country (2016-2032)
- Figure 76: APAC Oilfield Services Market Y-o-Y Growth Rate Comparison by By Service Type (2016-2032)
- Figure 77: APAC Oilfield Services Market Y-o-Y Growth Rate Comparison by By Application (2016-2032)
- Figure 78: APAC Oilfield Services Market Share Comparison by Country (2016-2032)
- Figure 79: APAC Oilfield Services Market Share Comparison by By Service Type (2016-2032)
- Figure 80: APAC Oilfield Services Market Share Comparison by By Application (2016-2032)
- Figure 81: Latin America Oilfield Services Market Revenue (US$ Mn) Market Share by By Service Typein 2022
- Figure 82: Latin America Oilfield Services Market Attractiveness Analysis by By Service Type, 2016-2032
- Figure 83: Latin America Oilfield Services Market Revenue (US$ Mn) Market Share by By Applicationin 2022
- Figure 84: Latin America Oilfield Services Market Attractiveness Analysis by By Application, 2016-2032
- Figure 85: Latin America Oilfield Services Market Revenue (US$ Mn) Market Share by Country in 2022
- Figure 86: Latin America Oilfield Services Market Attractiveness Analysis by Country, 2016-2032
- Figure 87: Latin America Oilfield Services Market Revenue (US$ Mn) (2016-2032)
- Figure 88: Latin America Oilfield Services Market Revenue (US$ Mn) Comparison by Country (2016-2032)
- Figure 89: Latin America Oilfield Services Market Revenue (US$ Mn) Comparison by By Service Type (2016-2032)
- Figure 90: Latin America Oilfield Services Market Revenue (US$ Mn) Comparison by By Application (2016-2032)
- Figure 91: Latin America Oilfield Services Market Y-o-Y Growth Rate Comparison by Country (2016-2032)
- Figure 92: Latin America Oilfield Services Market Y-o-Y Growth Rate Comparison by By Service Type (2016-2032)
- Figure 93: Latin America Oilfield Services Market Y-o-Y Growth Rate Comparison by By Application (2016-2032)
- Figure 94: Latin America Oilfield Services Market Share Comparison by Country (2016-2032)
- Figure 95: Latin America Oilfield Services Market Share Comparison by By Service Type (2016-2032)
- Figure 96: Latin America Oilfield Services Market Share Comparison by By Application (2016-2032)
- Figure 97: Middle East & Africa Oilfield Services Market Revenue (US$ Mn) Market Share by By Service Typein 2022
- Figure 98: Middle East & Africa Oilfield Services Market Attractiveness Analysis by By Service Type, 2016-2032
- Figure 99: Middle East & Africa Oilfield Services Market Revenue (US$ Mn) Market Share by By Applicationin 2022
- Figure 100: Middle East & Africa Oilfield Services Market Attractiveness Analysis by By Application, 2016-2032
- Figure 101: Middle East & Africa Oilfield Services Market Revenue (US$ Mn) Market Share by Country in 2022
- Figure 102: Middle East & Africa Oilfield Services Market Attractiveness Analysis by Country, 2016-2032
- Figure 103: Middle East & Africa Oilfield Services Market Revenue (US$ Mn) (2016-2032)
- Figure 104: Middle East & Africa Oilfield Services Market Revenue (US$ Mn) Comparison by Country (2016-2032)
- Figure 105: Middle East & Africa Oilfield Services Market Revenue (US$ Mn) Comparison by By Service Type (2016-2032)
- Figure 106: Middle East & Africa Oilfield Services Market Revenue (US$ Mn) Comparison by By Application (2016-2032)
- Figure 107: Middle East & Africa Oilfield Services Market Y-o-Y Growth Rate Comparison by Country (2016-2032)
- Figure 108: Middle East & Africa Oilfield Services Market Y-o-Y Growth Rate Comparison by By Service Type (2016-2032)
- Figure 109: Middle East & Africa Oilfield Services Market Y-o-Y Growth Rate Comparison by By Application (2016-2032)
- Figure 110: Middle East & Africa Oilfield Services Market Share Comparison by Country (2016-2032)
- Figure 111: Middle East & Africa Oilfield Services Market Share Comparison by By Service Type (2016-2032)
- Figure 112: Middle East & Africa Oilfield Services Market Share Comparison by By Application (2016-2032)
- List of Tables
- Table 1: Global Oilfield Services Market Comparison by By Service Type (2016-2032)
- Table 2: Global Oilfield Services Market Comparison by By Application (2016-2032)
- Table 3: Global Oilfield Services Market Revenue (US$ Mn) Comparison by Region (2016-2032)
- Table 4: Global Oilfield Services Market Revenue (US$ Mn) (2016-2032)
- Table 5: Global Oilfield Services Market Revenue (US$ Mn) Comparison by Region (2016-2032)
- Table 6: Global Oilfield Services Market Revenue (US$ Mn) Comparison by By Service Type (2016-2032)
- Table 7: Global Oilfield Services Market Revenue (US$ Mn) Comparison by By Application (2016-2032)
- Table 8: Global Oilfield Services Market Y-o-Y Growth Rate Comparison by Region (2016-2032)
- Table 9: Global Oilfield Services Market Y-o-Y Growth Rate Comparison by By Service Type (2016-2032)
- Table 10: Global Oilfield Services Market Y-o-Y Growth Rate Comparison by By Application (2016-2032)
- Table 11: Global Oilfield Services Market Share Comparison by Region (2016-2032)
- Table 12: Global Oilfield Services Market Share Comparison by By Service Type (2016-2032)
- Table 13: Global Oilfield Services Market Share Comparison by By Application (2016-2032)
- Table 14: North America Oilfield Services Market Comparison by By Application (2016-2032)
- Table 15: North America Oilfield Services Market Revenue (US$ Mn) Comparison by Country (2016-2032)
- Table 16: North America Oilfield Services Market Revenue (US$ Mn) (2016-2032)
- Table 17: North America Oilfield Services Market Revenue (US$ Mn) Comparison by Country (2016-2032)
- Table 18: North America Oilfield Services Market Revenue (US$ Mn) Comparison by By Service Type (2016-2032)
- Table 19: North America Oilfield Services Market Revenue (US$ Mn) Comparison by By Application (2016-2032)
- Table 20: North America Oilfield Services Market Y-o-Y Growth Rate Comparison by Country (2016-2032)
- Table 21: North America Oilfield Services Market Y-o-Y Growth Rate Comparison by By Service Type (2016-2032)
- Table 22: North America Oilfield Services Market Y-o-Y Growth Rate Comparison by By Application (2016-2032)
- Table 23: North America Oilfield Services Market Share Comparison by Country (2016-2032)
- Table 24: North America Oilfield Services Market Share Comparison by By Service Type (2016-2032)
- Table 25: North America Oilfield Services Market Share Comparison by By Application (2016-2032)
- Table 26: Western Europe Oilfield Services Market Comparison by By Service Type (2016-2032)
- Table 27: Western Europe Oilfield Services Market Comparison by By Application (2016-2032)
- Table 28: Western Europe Oilfield Services Market Revenue (US$ Mn) Comparison by Country (2016-2032)
- Table 29: Western Europe Oilfield Services Market Revenue (US$ Mn) (2016-2032)
- Table 30: Western Europe Oilfield Services Market Revenue (US$ Mn) Comparison by Country (2016-2032)
- Table 31: Western Europe Oilfield Services Market Revenue (US$ Mn) Comparison by By Service Type (2016-2032)
- Table 32: Western Europe Oilfield Services Market Revenue (US$ Mn) Comparison by By Application (2016-2032)
- Table 33: Western Europe Oilfield Services Market Y-o-Y Growth Rate Comparison by Country (2016-2032)
- Table 34: Western Europe Oilfield Services Market Y-o-Y Growth Rate Comparison by By Service Type (2016-2032)
- Table 35: Western Europe Oilfield Services Market Y-o-Y Growth Rate Comparison by By Application (2016-2032)
- Table 36: Western Europe Oilfield Services Market Share Comparison by Country (2016-2032)
- Table 37: Western Europe Oilfield Services Market Share Comparison by By Service Type (2016-2032)
- Table 38: Western Europe Oilfield Services Market Share Comparison by By Application (2016-2032)
- Table 39: Eastern Europe Oilfield Services Market Comparison by By Service Type (2016-2032)
- Table 40: Eastern Europe Oilfield Services Market Comparison by By Application (2016-2032)
- Table 41: Eastern Europe Oilfield Services Market Revenue (US$ Mn) Comparison by Country (2016-2032)
- Table 42: Eastern Europe Oilfield Services Market Revenue (US$ Mn) (2016-2032)
- Table 43: Eastern Europe Oilfield Services Market Revenue (US$ Mn) Comparison by Country (2016-2032)
- Table 44: Eastern Europe Oilfield Services Market Revenue (US$ Mn) Comparison by By Service Type (2016-2032)
- Table 45: Eastern Europe Oilfield Services Market Revenue (US$ Mn) Comparison by By Application (2016-2032)
- Table 46: Eastern Europe Oilfield Services Market Y-o-Y Growth Rate Comparison by Country (2016-2032)
- Table 47: Eastern Europe Oilfield Services Market Y-o-Y Growth Rate Comparison by By Service Type (2016-2032)
- Table 48: Eastern Europe Oilfield Services Market Y-o-Y Growth Rate Comparison by By Application (2016-2032)
- Table 49: Eastern Europe Oilfield Services Market Share Comparison by Country (2016-2032)
- Table 50: Eastern Europe Oilfield Services Market Share Comparison by By Service Type (2016-2032)
- Table 51: Eastern Europe Oilfield Services Market Share Comparison by By Application (2016-2032)
- Table 52: APAC Oilfield Services Market Comparison by By Service Type (2016-2032)
- Table 53: APAC Oilfield Services Market Comparison by By Application (2016-2032)
- Table 54: APAC Oilfield Services Market Revenue (US$ Mn) Comparison by Country (2016-2032)
- Table 55: APAC Oilfield Services Market Revenue (US$ Mn) (2016-2032)
- Table 56: APAC Oilfield Services Market Revenue (US$ Mn) Comparison by Country (2016-2032)
- Table 57: APAC Oilfield Services Market Revenue (US$ Mn) Comparison by By Service Type (2016-2032)
- Table 58: APAC Oilfield Services Market Revenue (US$ Mn) Comparison by By Application (2016-2032)
- Table 59: APAC Oilfield Services Market Y-o-Y Growth Rate Comparison by Country (2016-2032)
- Table 60: APAC Oilfield Services Market Y-o-Y Growth Rate Comparison by By Service Type (2016-2032)
- Table 61: APAC Oilfield Services Market Y-o-Y Growth Rate Comparison by By Application (2016-2032)
- Table 62: APAC Oilfield Services Market Share Comparison by Country (2016-2032)
- Table 63: APAC Oilfield Services Market Share Comparison by By Service Type (2016-2032)
- Table 64: APAC Oilfield Services Market Share Comparison by By Application (2016-2032)
- Table 65: Latin America Oilfield Services Market Comparison by By Service Type (2016-2032)
- Table 66: Latin America Oilfield Services Market Comparison by By Application (2016-2032)
- Table 67: Latin America Oilfield Services Market Revenue (US$ Mn) Comparison by Country (2016-2032)
- Table 68: Latin America Oilfield Services Market Revenue (US$ Mn) (2016-2032)
- Table 69: Latin America Oilfield Services Market Revenue (US$ Mn) Comparison by Country (2016-2032)
- Table 70: Latin America Oilfield Services Market Revenue (US$ Mn) Comparison by By Service Type (2016-2032)
- Table 71: Latin America Oilfield Services Market Revenue (US$ Mn) Comparison by By Application (2016-2032)
- Table 72: Latin America Oilfield Services Market Y-o-Y Growth Rate Comparison by Country (2016-2032)
- Table 73: Latin America Oilfield Services Market Y-o-Y Growth Rate Comparison by By Service Type (2016-2032)
- Table 74: Latin America Oilfield Services Market Y-o-Y Growth Rate Comparison by By Application (2016-2032)
- Table 75: Latin America Oilfield Services Market Share Comparison by Country (2016-2032)
- Table 76: Latin America Oilfield Services Market Share Comparison by By Service Type (2016-2032)
- Table 77: Latin America Oilfield Services Market Share Comparison by By Application (2016-2032)
- Table 78: Middle East & Africa Oilfield Services Market Comparison by By Service Type (2016-2032)
- Table 79: Middle East & Africa Oilfield Services Market Comparison by By Application (2016-2032)
- Table 80: Middle East & Africa Oilfield Services Market Revenue (US$ Mn) Comparison by Country (2016-2032)
- Table 81: Middle East & Africa Oilfield Services Market Revenue (US$ Mn) (2016-2032)
- Table 82: Middle East & Africa Oilfield Services Market Revenue (US$ Mn) Comparison by Country (2016-2032)
- Table 83: Middle East & Africa Oilfield Services Market Revenue (US$ Mn) Comparison by By Service Type (2016-2032)
- Table 84: Middle East & Africa Oilfield Services Market Revenue (US$ Mn) Comparison by By Application (2016-2032)
- Table 85: Middle East & Africa Oilfield Services Market Y-o-Y Growth Rate Comparison by Country (2016-2032)
- Table 86: Middle East & Africa Oilfield Services Market Y-o-Y Growth Rate Comparison by By Service Type (2016-2032)
- Table 87: Middle East & Africa Oilfield Services Market Y-o-Y Growth Rate Comparison by By Application (2016-2032)
- Table 88: Middle East & Africa Oilfield Services Market Share Comparison by Country (2016-2032)
- Table 89: Middle East & Africa Oilfield Services Market Share Comparison by By Service Type (2016-2032)
- Table 90: Middle East & Africa Oilfield Services Market Share Comparison by By Application (2016-2032)
- 1. Executive Summary
-
- Baker Hughes Company (U.S.)
- Halliburton (U.S.)
- Schlumberger Limited. (U.S.)
- Weatherford (U.S.)
- Superior Energy Services. (U.S.)
- NOV Inc. (U.S.)
- China Oilfield Services Limited (China)
- ARCHER OILFIELD ENGINEERS (India)
- Expro Group. (U.K.)
- TechnipFMC plc (U.K.)
- General Electric (U.S.)
- Trican. (Canada)
- Welltec A/S (Denmark)
- Basic Energy Corporation. (U.S.)
- Nabors Industries Ltd. (Bermuda)
- Pioneer Natural Resources Company. (U.S.)
- Edgo (UAE)
Our Clients


View Our Licence Options
