
Nootropics Market By Application Analysis (Memory Enhancement, Mood & Depression,Other), By Distribution Channel Analysis (Offline, Online), By Form Analysis (Capsules, Powder, Drinks), By Region And Companies - Industry Segment Outlook, Market Assessment, Competition Scenario, Trends, And Forecast 2023-2032
-
14565
-
Sep 2023
-
155
-


-
This report was compiled by Correspondence Linkedin | Detailed Market research Methodology Our methodology involves a mix of primary research, including interviews with leading mental health experts, and secondary research from reputable medical journals and databases. View Detailed Methodology Page
-
Quick Navigation
Report Overview
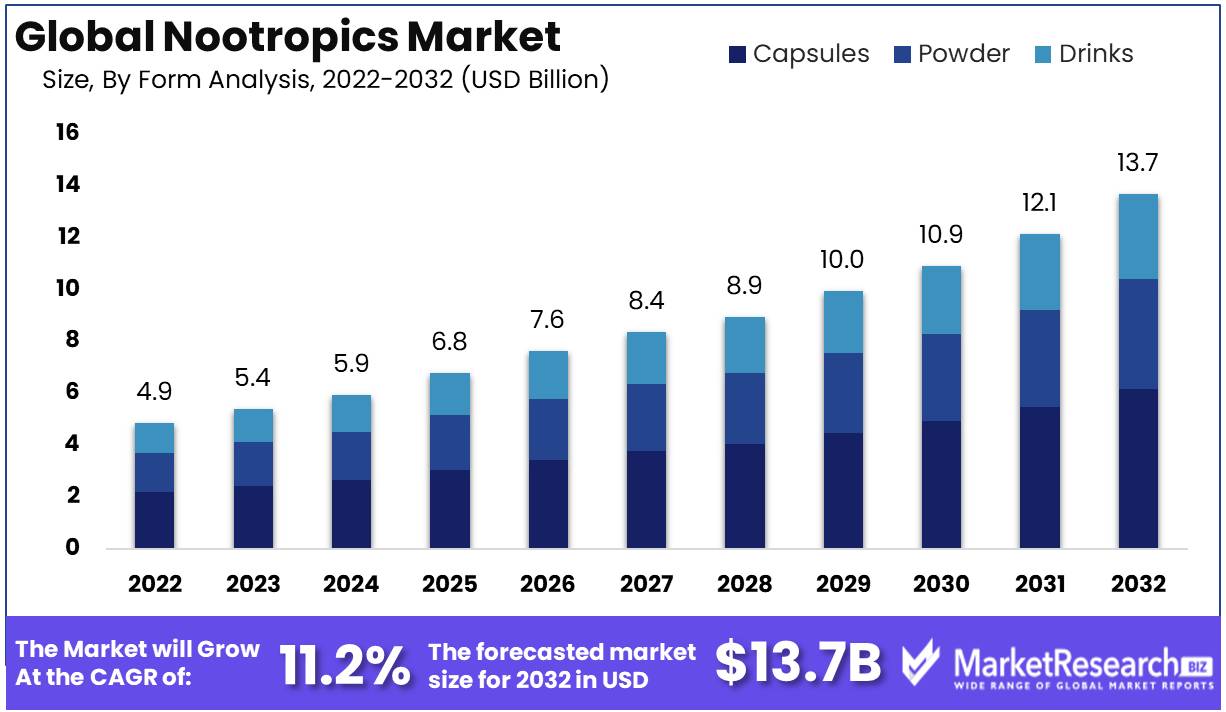
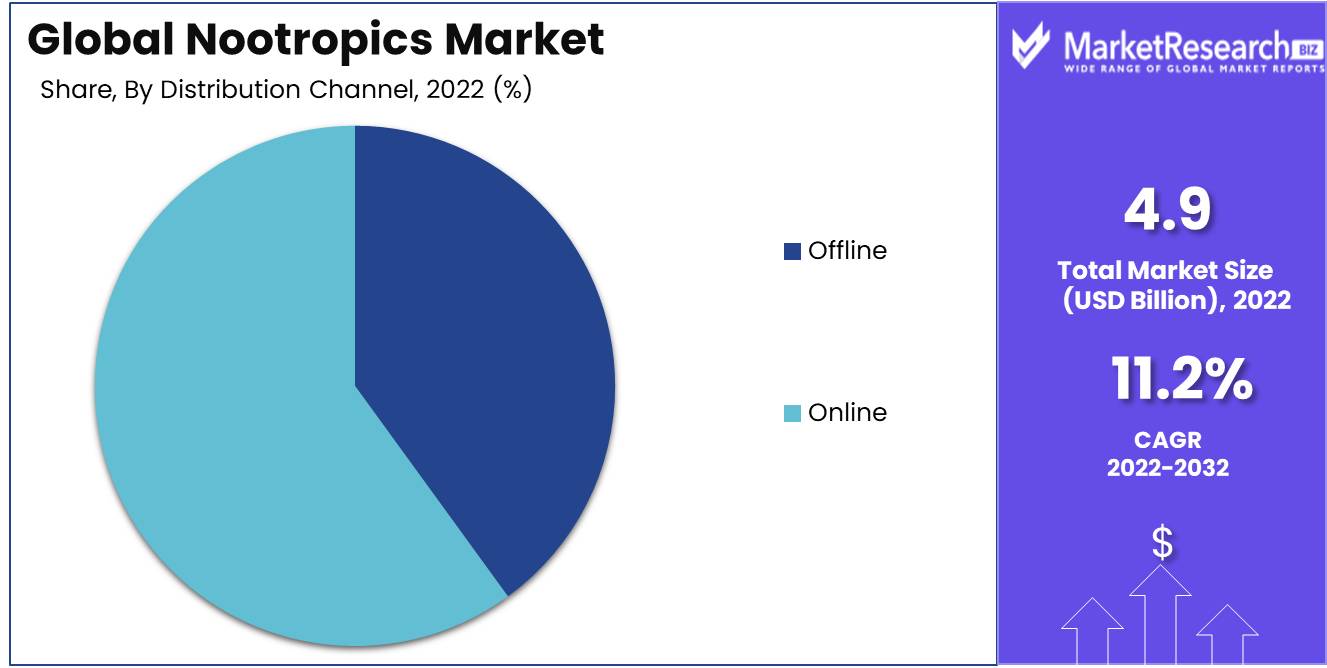
Nootropics Market size is expected to be worth around USD 13.7 Bn by 2032 from USD 4.9 Bn in 2022, growing at a CAGR of 11.2% during the forecast period from 2023 to 2032.
Nootropics, commonly referred to as cognitive enhancers or smart drugs, are products that aim to improve various aspects of cognitive function. They can be found in both natural and synthetic forms and are believed to enhance memory, creativity, and motivation.
These substances have become increasingly popular in recent years, thanks to an ever-evolving market that continually introduces innovative products. Some of the latest developments in this field include specialized nootropics tailored to enhance memory, stimulate creativity, and boost motivation. Additionally, nootropics have found their way into specific industries, leading to customized formulations to meet the cognitive demands of professions like finance and law.
The growth of the nootropics industry has attracted significant investments, propelling companies like Bulletproof, Onnit, and Nootrobox to prominence. These companies offer a range of products, from supplements to energy drinks and even nootropic-infused coffee, all promising cognitive enhancements.
However, despite the promising claims, there are concerns about the safety and effectiveness of nootropics. Reports of adverse effects, such as insomnia, anxiety, and headaches, have raised questions about their impact on health. There are also ethical considerations regarding their use in academic and professional settings, concerning fairness and legality.
To address these ethical dilemmas, there is a growing call for transparency, clarification, and accountability within the nootropics industry. This includes transparent labeling practices, detailed ingredient lists, and rigorous third-party testing to ensure the quality and effectiveness of these products.
One area where nootropics have gained significant traction is in the business world. Forward-thinking companies have incorporated these cognitive enhancers into their corporate cultures, viewing them as tools to boost productivity and creativity among their workforce.
Driving factors
The surge in Demand for Cognitive Enhancers
The growing demand for cognitive enhancers among students and working professionals is one of the most important factors. Nootropics have been shown to enhance concentration, memory, and productivity, making them a desirable option for those seeking to enhance their cognitive abilities.
Age-Related Decline Increase in Nootropics
Increasing awareness of the efficacy of nootropics in treating age-related cognitive decline is another factor positively impacting the nootropics market. As the global population continues to age, cognitive decline becomes a major concern for a growing number of individuals. Nootropics have shown promise in preventing or delaying cognitive decline, making them an appealing option for senior individuals.
In the Treatment of Disorders, Nootropics Gain Ground
The rising prevalence of neurological and psychiatric disorders such as melancholy and ADHD is also contributing to the expansion of the nootropics market. Nootropics have been shown to alleviate the symptoms of these disorders, prompting many individuals to consider them as a potential treatment option.
Utilizing Nootropics to Improve Performance
A growing trend of self-optimization and self-improvement, as well as advancements in technology and R&D for the development of effective nootropic products, have led to an increase in the use of nootropics by athletes and gamers as a performance-enhancing option. In addition, the expansion of e-commerce channels for simple accessibility of nootropic supplements and the rise in health-conscious consumers are contributing to the growth of the market.
Impact of Regulation on Nootropics in Flux
Regulations may also have an impact on the nootropics market, with potential modifications to their availability and distribution. Emerging technologies, such as brain-computer interfaces and virtual reality, may have an impact on the nootropics market by creating new cognitive enhancement avenues.
Deviating Forces Nootropics Face Obstacles
Pharmaceutical companies developing prescription medications for cognitive enhancement and alternative therapies such as mindfulness and meditation are potential market disruptors. Emerging trends, such as the growing prevalence of natural and plant-based ingredients, may also have an impact on consumer behavior in the nootropics market.
Restraining Factors
The market for Nootropics Faces Regulatory Dangers
The lack of appropriate regulation and oversight is one of the greatest obstacles facing the nootropics market. This is a significant concern for consumers who wish to feel assured that they are purchasing safe and authentic products. In the absence of regulation, counterfeit products that pose a health risk to consumers have proliferated.
Lack of Consumer Knowledge Regarding Nootropic Side Effects
The limited awareness of consumers regarding the potential adverse effects of using these supplements is another significant challenge facing the nootropics market. Although nootropics are generally regarded as safe, their long-term effects on brain health are not entirely comprehended. Headaches, vertigo, and anxiety have been reported as negative side effects by some users.
High Prices Inhibit Nootropics Market Expansion
The high price of some premium nootropic supplements is another factor restraining the nootropics market's growth. Some premium products can be prohibitively expensive, rendering them inaccessible to a significant portion of consumers. The price differential between high-end and low-end products can also be a limiting factor, as consumers may opt for less expensive alternatives.
Limited Availability Limits Access to Nootropics
Further complicating the nootropics market is the limited availability of products in developing nations. This is due to the logistical difficulties associated with transporting and disseminating products in regions with limited infrastructure. Consequently, many consumers in these regions lack access to nootropic products, despite their potential benefits.
Substance Abuse Concerns Restrain Nootropics Market
Lastly, the potential for addiction is a significant concern regarding certain nootropic supplements. Despite the fact that the majority of nootropics are safe and nonaddictive, certain substances, such as halibut and modafinil, have been shown to be addictive. A significant barrier to the growth of the nootropics market is the lack of awareness about the potential for addiction and the necessity of responsible use of these products.
Application Analysis
At the moment, the Memory Enhancement segment of the nootropics market is dominating. A person's ability to learn and recall information is improved by memory enhancers. There are a number of causes behind the increase in demand for these supplements.
The need for Memory Enhancement supplements is being driven by emerging economies. As was previously indicated, significant economic expansion in nations like China, India, and Brazil has led to an increase in disposable incomes. The demand for cognitive enhancers that boost memory has increased as more individuals have access to higher education.
The trend of consumers adopting Memory Enhancement Supplements is on the rise. More individuals are turning to these supplements due to their ability to store information, recall it when essential, and boost productivity. The demand for these supplements is also influenced by the tightening labor market and people's desire to achieve a competitive edge.
Over the upcoming years, the Memory Enhancement segment of the nootropics market is projected to experience the quickest growth rate. This is a result of the rising demand for these supplements among workers, professionals, and individuals who want to sharpen their memory and performance.
Distribution Channel Analysis
The Nootropics Market's Online Segment is now dominating the distribution channels. Due to a number of factors, purchasing nootropics is now most commonly done through online platforms.
Consumers now find it simpler to buy these supplements online thanks to the economic growth of emerging economies, which has led to a rise in internet access and usage. Consumers, especially those living in rural places where it would be more difficult to get nootropics, find it useful that internet platforms are available.
The trend of people buying nootropics online is on the rise. The convenience of purchasing from the comfort of their homes, a wider selection of products, and competitive prices are all provided by online platforms. The Internet shopping experience is improved by the fact that customers can do research, read reviews, and compare products before making a choice.
In the nootropics market over the following years, the Online Segment is anticipated to experience the quickest growth rate. The ability of the Internet, the consumer trend of purchasing goods online, and the ongoing economic growth of developing nations are the main causes of this.
Form Analysis
The Capsules Segment Currently Dominates the Nootropics Market. In comparison to other types of nootropics, capsules are more practical and simple to take.
Emerging economies' economic growth has led to a rise in disposable income, allowing consumers the ability to buy more pricey supplements like capsules. Consumers frequently choose capsules because of their practicality and ability to enhance memory and cognitive function.
The trend of consumers purchasing capsules is on the rise. Compared to other types of nootropics, including powders or liquids, they are simpler, more practical, and more appealing to use. Additionally, consumers can select the dosage of capsules they require for cognitive enhancement from a wide range of options.
In the upcoming years, the Capsules Segment of the Nootropics Market is projected to develop at the fastest rate. The ease of use of capsules, their ability to enhance memory and cognitive function, and the economic growth of emerging economies are the main causes of this.
Key Market Segments
Application Analysis
- Memory Enhancement
- Mood & Depression
- Attention & Focus
- Longevity & Anti-aging
- Sleep & Recovery
- Anxiety
Distribution Channel Analysis
- Offline
- Online
Form Analysis
- Capsules
- Powder
- Drinks
Growth Opportunity
Nootropics Market Soars Natural and Organic Demand
Opportunity for nootropics growth Demand for natural and organic nootropic supplements is rising, Genetically tailored nootropic supplements' e-commerce growth Increasing research and development for nootropic supplements with fewer side effects Brain-computer interface and neurofeedback technologies become popular.
Genetics Influence Nootropics
Technology is making people increasingly interested in mental improvement. Nootropics can help achieve this goal. Nootropics boost memory, focus, and creativity. Natural, organic, genetically tailored, and side-effect-free nootropics are in high demand.
E-commerce Increases Nootropics Sales
The expansion of the e-commerce market for nootropic supplements, the popularity of brain-computer interfaces and neurofeedback technologies, and the increasing research and development for nootropic supplements with fewer side effects all contribute to this growth potential.
Reduced Side Effects
There is an increasing demand for natural and organic supplements due to synthetic side effects. Natural and organic supplements are safer and healthier, thus people are interested in them. The nootropics market follows this trend, with many consumers seeking natural and organic supplements.
Brain-Boosting Tech
In the nootropics industry, personalized supplements are emerging based on genetic makeup. These supplements improve cognitive functioning because they're matched to an individual's genetic composition. This trend is driven by technology that allows DNA analysis and the discovery of cognitive function genes.
Natural Nootropics
Nootropic supplements are booming online. With the increasing demand for nutritional supplements, e-commerce makes it easy for consumers to buy. Many consumers choose e-commerce due to its convenience, home delivery, and low prices.
Customized Nootropics
Research and development in the nootropics sector have increased as companies try to create supplements with fewer side effects. Consumers want cognitive supplements without side effects. Research and development of these supplements are needed to achieve cognitive enhancement and safety.
E-commerce Growth Nootropics Sales Rise
The nootropics industry is increasing its use of brain-computer interfaces and neurofeedback technologies. These technologies boost cognition with brain impulses. They have improved memory, focus, and creativity without surgery. These technologies' growing appeal is driven by the desire to increase cognitive capacities without prescription.
Latest Trends
Nootropics Market
Nootropics are rapidly changing as research on their effects on cognitive performance and mental wellness is undertaken. Numerous studies have demonstrated that eating particular foods, supplements, or chemical compounds can improve cognitive ability. The use of nootropics, such as functional foods, beverages, and supplements, has grown in popularity, driving industry growth.
Nootropic Foods Rise
Functional foods and beverages provide favorable effects. Functional foods and beverages are incorporating nootropics. The growing demand for nutritious foods and beverages, particularly among millennials and Generation Z, has led to an increase in nootropic-infused functional foods and beverages.
Nootropics Validation
Plant-based nootropics market effectiveness has been researched and proven by scientific studies. Natural ingredients are preferred in nootropic supplements, herbs, and medicinal plants.
ADHD and Nootropics
ADHD, anxiety, and depression are more common. These illnesses respond well to nootropic supplements. ADHD causes hyperactivity, impulsivity, and inattention. Insomnia, weight loss, and decreased appetite are side effects of this disease medication. L-theanine and Omega-3 fatty acids are powerful nootropic supplements that can replace pharmaceutical medicine.
Anxiety/Depression Nootropics
Nootropics relieve anxiety and depression. These supplements boost mood, sleep, and stress without negative effects. The increasing prevalence of these illnesses has led to an increase in demand for natural nootropic supplements.
VR-Nootropics Synergy
The nootropics sector is embracing VR. VR boosts nootropic supplements' cognitive effects. By mixing VR with nootropic effects, users can focus and concentrate better.
Mainstream Nootropics
Nootropic supplements were once unusual. These supplements are now widespread. Nootropic market growth is drawing investors and businesses.
Natural Cognitive Enhancers Demand
Nootropics become popular due to an increased understanding of cognitive performance and mental health. The demand for natural cognitive-enhancing supplements is predicted to expand as more people adopt healthier lifestyles and use cognitive supplements.
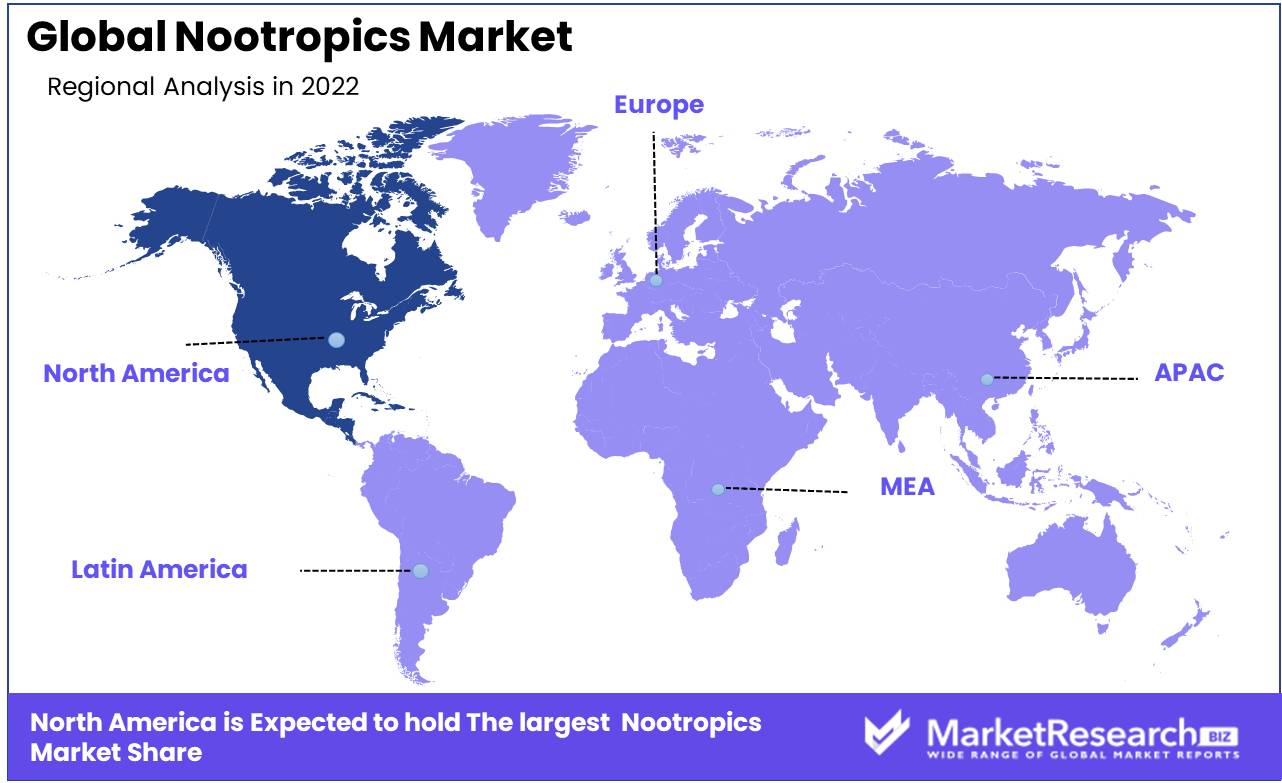
Regional Analysis
North America is the dominant market for cognitive enhancers as a result of this strong demand. In the US, a number of companies have entered the market to offer cognitive-enhancing supplements. These companies include NeuroFuse, Lumonol, Nootroo, and Nootropics City.
Cognitive enhancers, or "smart drugs," have become more popular among college students and working professionals. These supplements boost cognitive functions like memory, focus, and attentiveness. As demand for cognitive enhancers has expanded, a number of companies have joined the market to offer a variety of products.
The competitive North American work market drives demand for cognitive enhancers. Cognitive enhancers are appealing to professionals who work long hours under pressure. Cognitive enhancers assist college students study and complete coursework.
One reason North America is a dominant force in the cognitive enhancer market is the legal structure. Cognitive enhancers are regulated by the FDA and Health Canada as dietary supplements. This regulatory climate has allowed companies to manufacture and market supplements without needing to comply with prescription medicine rules.
North America dominates the cognitive enhancer market due to consumer awareness and education about these products. Individuals can investigate and compare products on the market thanks to online and social media information. A number of internet communities and forums about cognitive enhancers have formed, making it easier for individuals to share information and experiences.
Despite rising demand for cognitive enhancers in North America, safety and efficacy concerns remain. Many supplements on the market are safe, but there is no scientific evidence to support their usage. Concerns regarding long-term brain damage and addiction.
As a result, individuals considering the usage of cognitive enhancers should research the products and see a doctor before using any supplements. Individuals should buy supplements from trusted providers and watch for side effects.
Key Regions and Countries
North America
- US
- Canada
- Mexico
Western Europe
- Germany
- France
- The UK
- Spain
- Italy
- Portugal
- Ireland
- Austria
- Switzerland
- Benelux
- Nordic
- Rest of Western Europe
Eastern Europe
- Russia
- Poland
- The Czech Republic
- Greece
- Rest of Eastern Europe
APAC
- China
- Japan
- South Korea
- India
- Australia & New Zealand
- Indonesia
- Malaysia
- Philippines
- Singapore
- Thailand
- Vietnam
- Rest of APAC
Latin America
- Brazil
- Colombia
- Chile
- Argentina
- Costa Rica
- Rest of Latin America
Middle East & Africa
- Algeria
- Egypt
- Israel
- Kuwait
- Nigeria
- Saudi Arabia
- South Africa
- Turkey
- United Arab Emirates
- Rest of MEA
Key Players Analysis
The market for nootropics is expanding quickly. New companies and products are entering the market as demand for nootropics rises as more people want to improve their cognitive performance.
Nootrobox is a key player in the nootropics market. It offers cognitive supplements to boost memory, focus, and mental clarity. Their products are geared toward tech professionals and entrepreneurs and contain natural and synthetic ingredients.
Onnit, another big player, offers a variety of supplements and nootropics to boost sports performance, memory, and focus. Onnit uses only natural ingredients in its formulas, unlike other companies.
Neurohacker Collective is another unique nootropics market company that makes high-quality, science-backed cognitive supplements. Qualia, their flagship nootropic stack, contains over 40 ingredients intended to boost mental function.
Natural Stacks, Bulletproof, and Peak Nootropics are some significant players in the nootropics market. As demand for cognitive supplements rises, more companies and products will enter the market, giving consumers a variety of options. Consumers should study reliable companies that employ high-quality ingredients and follow tight manufacturing regulations.
Top Key Players in Nootropics Market
- Accelerated Intelligence Inc.
- Natural Stacks
- AlternaScript
- Bulletproof
- Health Via Modern Nutrition (HVMN)/ Nootrobox Inc.
- Onnit Labs, Inc.
- Peak Nootropics
- Teva Pharmaceutical Industries
- Purelife Bioscience Co., Ltd.
- United Pharmacies
- SupNootropic Bio Co., Ltd.
- Powder City
- Cephalon, Inc.
Recent Development
- In 2023, The combination of nootropics and technology has become a prominent trend in recent years.
- In 2022, Natural nootropics derived from plants and herbs have gained popularity due to their perceived safety and effectiveness.
- In 2021, Personalized nootropic stacks have gained traction in recent years. Rather than taking a one-size-fits-all approach, people are increasingly concentrating on combining nootropics to meet their unique cognitive needs.
- In 2020, The previous five years witnessed the discovery and development of new nootropic compounds with enhanced effects and reduced adverse effects.
- In 2019, Significant progress has been made in the understanding of the mechanisms of action and effects of various nootropic substances.
Report Scope:
Report Features Description Market Value (2022) USD 4.9 Bn Forecast Revenue (2032) USD 13.7 Bn CAGR (2023-2032) 11.2% Base Year for Estimation 2022 Historic Period 2016-2022 Forecast Period 2023-2032 Report Coverage Revenue Forecast, Market Dynamics, COVID-19 Impact, Competitive Landscape, Recent Developments Segments Covered By Application Analysis (Memory Enhancement, Mood & Depression, Attention & Focus, Longevity & Anti-aging, Sleep & Recovery, Anxiety), By Distribution Channel Analysis (Offline, Online), By Form Analysis (Capsules, Powder, Drinks) Regional Analysis North America – The US, Canada, & Mexico; Western Europe – Germany, France, The UK, Spain, Italy, Portugal, Ireland, Austria, Switzerland, Benelux, Nordic, & Rest of Western Europe; Eastern Europe – Russia, Poland, The Czech Republic, Greece, & Rest of Eastern Europe; APAC – China, Japan, South Korea, India, Australia & New Zealand, Indonesia, Malaysia, Philippines, Singapore, Thailand, Vietnam, & Rest of APAC; Latin America – Brazil, Colombia, Chile, Argentina, Costa Rica, & Rest of Latin America; Middle East & Africa – Algeria, Egypt, Israel, Kuwait, Nigeria, Saudi Arabia, South Africa, Turkey, United Arab Emirates, & Rest of MEA Competitive Landscape Accelerated Intelligence Inc., Natural Stacks, AlternaScript, Bulletproof, Health Via Modern Nutrition (HVMN)/ Nootrobox Inc., Onnit Labs, Inc., Peak Nootropics, Teva Pharmaceutical Industries, Purelife Bioscience Co., Ltd., United Pharmacies, SupNootropic Bio Co., Ltd., Powder City, Cephalon, Inc. Customization Scope Customization for segments, region/country-level will be provided. Moreover, additional customization can be done based on the requirements. Purchase Options We have three licenses to opt for: Single User License, Multi-User License (Up to 5 Users), Corporate Use License (Unlimited User and Printable PDF) -
- 1. Executive Summary
- 1.1. Definition
- 1.2. Taxonomy
- 1.3. Research Scope
- 1.4. Key Analysis
- 1.5. Key Findings by Major Segments
- 1.6. Top strategies by Major Players
- 2. Global Nootropics Market Overview
- 2.1. Nootropics Market Dynamics
- 2.1.1. Drivers
- 2.1.2. Opportunities
- 2.1.3. Restraints
- 2.1.4. Challenges
- 2.2. Macro-economic Factors
- 2.3. Regulatory Framework
- 2.4. Market Investment Feasibility Index
- 2.5. PEST Analysis
- 2.6. PORTER’S Five Force Analysis
- 2.7. Drivers & Restraints Impact Analysis
- 2.8. Industry Chain Analysis
- 2.9. Cost Structure Analysis
- 2.10. Marketing Strategy
- 2.11. Russia-Ukraine War Impact Analysis
- 2.12. Opportunity Map Analysis
- 2.13. Market Competition Scenario Analysis
- 2.14. Product Life Cycle Analysis
- 2.15. Opportunity Orbits
- 2.16. Manufacturer Intensity Map
- 2.17. Major Companies sales by Value & Volume
- 2.1. Nootropics Market Dynamics
- 3. Global Nootropics Market Analysis, Opportunity and Forecast, 2016-2032
- 3.1. Global Nootropics Market Analysis, 2016-2021
- 3.2. Global Nootropics Market Opportunity and Forecast, 2023-2032
- 3.3. Global Nootropics Market Analysis, Opportunity and Forecast, By Application Analysis, 2016-2032
- 3.3.1. Global Nootropics Market Analysis by Application Analysis: Introduction
- 3.3.2. Market Size Absolute $ Opportunity Analysis and Forecast, By Application Analysis, 2016-2032
- 3.3.3. Memory Enhancement
- 3.3.4. Mood & Depression
- 3.3.5. Attention & Focus
- 3.3.6. Longevity & Anti-aging
- 3.3.7. Sleep & Recovery
- 3.3.8. Anxiety
- 3.4. Global Nootropics Market Analysis, Opportunity and Forecast, By Distribution Channel Analysis, 2016-2032
- 3.4.1. Global Nootropics Market Analysis by Distribution Channel Analysis: Introduction
- 3.4.2. Market Size Absolute $ Opportunity Analysis and Forecast, By Distribution Channel Analysis, 2016-2032
- 3.4.3. Offline
- 3.4.4. Online
- 3.5. Global Nootropics Market Analysis, Opportunity and Forecast, By Form Analysis, 2016-2032
- 3.5.1. Global Nootropics Market Analysis by Form Analysis: Introduction
- 3.5.2. Market Size Absolute $ Opportunity Analysis and Forecast, By Form Analysis, 2016-2032
- 3.5.3. Capsules
- 3.5.4. Powder
- 3.5.5. Drinks
- 4. North America Nootropics Market Analysis, Opportunity and Forecast, 2016-2032
- 4.1. North America Nootropics Market Analysis, 2016-2021
- 4.2. North America Nootropics Market Opportunity and Forecast, 2023-2032
- 4.3. North America Nootropics Market Analysis, Opportunity and Forecast, By Application Analysis, 2016-2032
- 4.3.1. North America Nootropics Market Analysis by Application Analysis: Introduction
- 4.3.2. Market Size Absolute $ Opportunity Analysis and Forecast, By Application Analysis, 2016-2032
- 4.3.3. Memory Enhancement
- 4.3.4. Mood & Depression
- 4.3.5. Attention & Focus
- 4.3.6. Longevity & Anti-aging
- 4.3.7. Sleep & Recovery
- 4.3.8. Anxiety
- 4.4. North America Nootropics Market Analysis, Opportunity and Forecast, By Distribution Channel Analysis, 2016-2032
- 4.4.1. North America Nootropics Market Analysis by Distribution Channel Analysis: Introduction
- 4.4.2. Market Size Absolute $ Opportunity Analysis and Forecast, By Distribution Channel Analysis, 2016-2032
- 4.4.3. Offline
- 4.4.4. Online
- 4.5. North America Nootropics Market Analysis, Opportunity and Forecast, By Form Analysis, 2016-2032
- 4.5.1. North America Nootropics Market Analysis by Form Analysis: Introduction
- 4.5.2. Market Size Absolute $ Opportunity Analysis and Forecast, By Form Analysis, 2016-2032
- 4.5.3. Capsules
- 4.5.4. Powder
- 4.5.5. Drinks
- 4.6. North America Nootropics Market Analysis, Opportunity and Forecast, By Country , 2016-2032
- 4.6.1. North America Nootropics Market Analysis by Country : Introduction
- 4.6.2. Market Size Absolute $ Opportunity Analysis and Forecast, Country , 2016-2032
- 4.6.2.1. The US
- 4.6.2.2. Canada
- 4.6.2.3. Mexico
- 5. Western Europe Nootropics Market Analysis, Opportunity and Forecast, 2016-2032
- 5.1. Western Europe Nootropics Market Analysis, 2016-2021
- 5.2. Western Europe Nootropics Market Opportunity and Forecast, 2023-2032
- 5.3. Western Europe Nootropics Market Analysis, Opportunity and Forecast, By Application Analysis, 2016-2032
- 5.3.1. Western Europe Nootropics Market Analysis by Application Analysis: Introduction
- 5.3.2. Market Size Absolute $ Opportunity Analysis and Forecast, By Application Analysis, 2016-2032
- 5.3.3. Memory Enhancement
- 5.3.4. Mood & Depression
- 5.3.5. Attention & Focus
- 5.3.6. Longevity & Anti-aging
- 5.3.7. Sleep & Recovery
- 5.3.8. Anxiety
- 5.4. Western Europe Nootropics Market Analysis, Opportunity and Forecast, By Distribution Channel Analysis, 2016-2032
- 5.4.1. Western Europe Nootropics Market Analysis by Distribution Channel Analysis: Introduction
- 5.4.2. Market Size Absolute $ Opportunity Analysis and Forecast, By Distribution Channel Analysis, 2016-2032
- 5.4.3. Offline
- 5.4.4. Online
- 5.5. Western Europe Nootropics Market Analysis, Opportunity and Forecast, By Form Analysis, 2016-2032
- 5.5.1. Western Europe Nootropics Market Analysis by Form Analysis: Introduction
- 5.5.2. Market Size Absolute $ Opportunity Analysis and Forecast, By Form Analysis, 2016-2032
- 5.5.3. Capsules
- 5.5.4. Powder
- 5.5.5. Drinks
- 5.6. Western Europe Nootropics Market Analysis, Opportunity and Forecast, By Country , 2016-2032
- 5.6.1. Western Europe Nootropics Market Analysis by Country : Introduction
- 5.6.2. Market Size Absolute $ Opportunity Analysis and Forecast, Country , 2016-2032
- 5.6.2.1. Germany
- 5.6.2.2. France
- 5.6.2.3. The UK
- 5.6.2.4. Spain
- 5.6.2.5. Italy
- 5.6.2.6. Portugal
- 5.6.2.7. Ireland
- 5.6.2.8. Austria
- 5.6.2.9. Switzerland
- 5.6.2.10. Benelux
- 5.6.2.11. Nordic
- 5.6.2.12. Rest of Western Europe
- 6. Eastern Europe Nootropics Market Analysis, Opportunity and Forecast, 2016-2032
- 6.1. Eastern Europe Nootropics Market Analysis, 2016-2021
- 6.2. Eastern Europe Nootropics Market Opportunity and Forecast, 2023-2032
- 6.3. Eastern Europe Nootropics Market Analysis, Opportunity and Forecast, By Application Analysis, 2016-2032
- 6.3.1. Eastern Europe Nootropics Market Analysis by Application Analysis: Introduction
- 6.3.2. Market Size Absolute $ Opportunity Analysis and Forecast, By Application Analysis, 2016-2032
- 6.3.3. Memory Enhancement
- 6.3.4. Mood & Depression
- 6.3.5. Attention & Focus
- 6.3.6. Longevity & Anti-aging
- 6.3.7. Sleep & Recovery
- 6.3.8. Anxiety
- 6.4. Eastern Europe Nootropics Market Analysis, Opportunity and Forecast, By Distribution Channel Analysis, 2016-2032
- 6.4.1. Eastern Europe Nootropics Market Analysis by Distribution Channel Analysis: Introduction
- 6.4.2. Market Size Absolute $ Opportunity Analysis and Forecast, By Distribution Channel Analysis, 2016-2032
- 6.4.3. Offline
- 6.4.4. Online
- 6.5. Eastern Europe Nootropics Market Analysis, Opportunity and Forecast, By Form Analysis, 2016-2032
- 6.5.1. Eastern Europe Nootropics Market Analysis by Form Analysis: Introduction
- 6.5.2. Market Size Absolute $ Opportunity Analysis and Forecast, By Form Analysis, 2016-2032
- 6.5.3. Capsules
- 6.5.4. Powder
- 6.5.5. Drinks
- 6.6. Eastern Europe Nootropics Market Analysis, Opportunity and Forecast, By Country , 2016-2032
- 6.6.1. Eastern Europe Nootropics Market Analysis by Country : Introduction
- 6.6.2. Market Size Absolute $ Opportunity Analysis and Forecast, Country , 2016-2032
- 6.6.2.1. Russia
- 6.6.2.2. Poland
- 6.6.2.3. The Czech Republic
- 6.6.2.4. Greece
- 6.6.2.5. Rest of Eastern Europe
- 7. APAC Nootropics Market Analysis, Opportunity and Forecast, 2016-2032
- 7.1. APAC Nootropics Market Analysis, 2016-2021
- 7.2. APAC Nootropics Market Opportunity and Forecast, 2023-2032
- 7.3. APAC Nootropics Market Analysis, Opportunity and Forecast, By Application Analysis, 2016-2032
- 7.3.1. APAC Nootropics Market Analysis by Application Analysis: Introduction
- 7.3.2. Market Size Absolute $ Opportunity Analysis and Forecast, By Application Analysis, 2016-2032
- 7.3.3. Memory Enhancement
- 7.3.4. Mood & Depression
- 7.3.5. Attention & Focus
- 7.3.6. Longevity & Anti-aging
- 7.3.7. Sleep & Recovery
- 7.3.8. Anxiety
- 7.4. APAC Nootropics Market Analysis, Opportunity and Forecast, By Distribution Channel Analysis, 2016-2032
- 7.4.1. APAC Nootropics Market Analysis by Distribution Channel Analysis: Introduction
- 7.4.2. Market Size Absolute $ Opportunity Analysis and Forecast, By Distribution Channel Analysis, 2016-2032
- 7.4.3. Offline
- 7.4.4. Online
- 7.5. APAC Nootropics Market Analysis, Opportunity and Forecast, By Form Analysis, 2016-2032
- 7.5.1. APAC Nootropics Market Analysis by Form Analysis: Introduction
- 7.5.2. Market Size Absolute $ Opportunity Analysis and Forecast, By Form Analysis, 2016-2032
- 7.5.3. Capsules
- 7.5.4. Powder
- 7.5.5. Drinks
- 7.6. APAC Nootropics Market Analysis, Opportunity and Forecast, By Country , 2016-2032
- 7.6.1. APAC Nootropics Market Analysis by Country : Introduction
- 7.6.2. Market Size Absolute $ Opportunity Analysis and Forecast, Country , 2016-2032
- 7.6.2.1. China
- 7.6.2.2. Japan
- 7.6.2.3. South Korea
- 7.6.2.4. India
- 7.6.2.5. Australia & New Zeland
- 7.6.2.6. Indonesia
- 7.6.2.7. Malaysia
- 7.6.2.8. Philippines
- 7.6.2.9. Singapore
- 7.6.2.10. Thailand
- 7.6.2.11. Vietnam
- 7.6.2.12. Rest of APAC
- 8. Latin America Nootropics Market Analysis, Opportunity and Forecast, 2016-2032
- 8.1. Latin America Nootropics Market Analysis, 2016-2021
- 8.2. Latin America Nootropics Market Opportunity and Forecast, 2023-2032
- 8.3. Latin America Nootropics Market Analysis, Opportunity and Forecast, By Application Analysis, 2016-2032
- 8.3.1. Latin America Nootropics Market Analysis by Application Analysis: Introduction
- 8.3.2. Market Size Absolute $ Opportunity Analysis and Forecast, By Application Analysis, 2016-2032
- 8.3.3. Memory Enhancement
- 8.3.4. Mood & Depression
- 8.3.5. Attention & Focus
- 8.3.6. Longevity & Anti-aging
- 8.3.7. Sleep & Recovery
- 8.3.8. Anxiety
- 8.4. Latin America Nootropics Market Analysis, Opportunity and Forecast, By Distribution Channel Analysis, 2016-2032
- 8.4.1. Latin America Nootropics Market Analysis by Distribution Channel Analysis: Introduction
- 8.4.2. Market Size Absolute $ Opportunity Analysis and Forecast, By Distribution Channel Analysis, 2016-2032
- 8.4.3. Offline
- 8.4.4. Online
- 8.5. Latin America Nootropics Market Analysis, Opportunity and Forecast, By Form Analysis, 2016-2032
- 8.5.1. Latin America Nootropics Market Analysis by Form Analysis: Introduction
- 8.5.2. Market Size Absolute $ Opportunity Analysis and Forecast, By Form Analysis, 2016-2032
- 8.5.3. Capsules
- 8.5.4. Powder
- 8.5.5. Drinks
- 8.6. Latin America Nootropics Market Analysis, Opportunity and Forecast, By Country , 2016-2032
- 8.6.1. Latin America Nootropics Market Analysis by Country : Introduction
- 8.6.2. Market Size Absolute $ Opportunity Analysis and Forecast, Country , 2016-2032
- 8.6.2.1. Brazil
- 8.6.2.2. Colombia
- 8.6.2.3. Chile
- 8.6.2.4. Argentina
- 8.6.2.5. Costa Rica
- 8.6.2.6. Rest of Latin America
- 9. Middle East & Africa Nootropics Market Analysis, Opportunity and Forecast, 2016-2032
- 9.1. Middle East & Africa Nootropics Market Analysis, 2016-2021
- 9.2. Middle East & Africa Nootropics Market Opportunity and Forecast, 2023-2032
- 9.3. Middle East & Africa Nootropics Market Analysis, Opportunity and Forecast, By Application Analysis, 2016-2032
- 9.3.1. Middle East & Africa Nootropics Market Analysis by Application Analysis: Introduction
- 9.3.2. Market Size Absolute $ Opportunity Analysis and Forecast, By Application Analysis, 2016-2032
- 9.3.3. Memory Enhancement
- 9.3.4. Mood & Depression
- 9.3.5. Attention & Focus
- 9.3.6. Longevity & Anti-aging
- 9.3.7. Sleep & Recovery
- 9.3.8. Anxiety
- 9.4. Middle East & Africa Nootropics Market Analysis, Opportunity and Forecast, By Distribution Channel Analysis, 2016-2032
- 9.4.1. Middle East & Africa Nootropics Market Analysis by Distribution Channel Analysis: Introduction
- 9.4.2. Market Size Absolute $ Opportunity Analysis and Forecast, By Distribution Channel Analysis, 2016-2032
- 9.4.3. Offline
- 9.4.4. Online
- 9.5. Middle East & Africa Nootropics Market Analysis, Opportunity and Forecast, By Form Analysis, 2016-2032
- 9.5.1. Middle East & Africa Nootropics Market Analysis by Form Analysis: Introduction
- 9.5.2. Market Size Absolute $ Opportunity Analysis and Forecast, By Form Analysis, 2016-2032
- 9.5.3. Capsules
- 9.5.4. Powder
- 9.5.5. Drinks
- 9.6. Middle East & Africa Nootropics Market Analysis, Opportunity and Forecast, By Country , 2016-2032
- 9.6.1. Middle East & Africa Nootropics Market Analysis by Country : Introduction
- 9.6.2. Market Size Absolute $ Opportunity Analysis and Forecast, Country , 2016-2032
- 9.6.2.1. Algeria
- 9.6.2.2. Egypt
- 9.6.2.3. Israel
- 9.6.2.4. Kuwait
- 9.6.2.5. Nigeria
- 9.6.2.6. Saudi Arabia
- 9.6.2.7. South Africa
- 9.6.2.8. Turkey
- 9.6.2.9. The UAE
- 9.6.2.10. Rest of MEA
- 10. Global Nootropics Market Analysis, Opportunity and Forecast, By Region , 2016-2032
- 10.1. Global Nootropics Market Analysis by Region : Introduction
- 10.2. Market Size Absolute $ Opportunity Analysis and Forecast, By Region , 2016-2032
- 10.2.1. North America
- 10.2.2. Western Europe
- 10.2.3. Eastern Europe
- 10.2.4. APAC
- 10.2.5. Latin America
- 10.2.6. Middle East & Africa
- 11. Global Nootropics Market Competitive Landscape, Market Share Analysis, and Company Profiles
- 11.1. Market Share Analysis
- 11.2. Company Profiles
- 11.3. Accelerated Intelligence Inc.
- 11.3.1. Company Overview
- 11.3.2. Financial Highlights
- 11.3.3. Product Portfolio
- 11.3.4. SWOT Analysis
- 11.3.5. Key Strategies and Developments
- 11.4. Natural Stacks
- 11.4.1. Company Overview
- 11.4.2. Financial Highlights
- 11.4.3. Product Portfolio
- 11.4.4. SWOT Analysis
- 11.4.5. Key Strategies and Developments
- 11.5. AlternaScript
- 11.5.1. Company Overview
- 11.5.2. Financial Highlights
- 11.5.3. Product Portfolio
- 11.5.4. SWOT Analysis
- 11.5.5. Key Strategies and Developments
- 11.6. Bulletproof
- 11.6.1. Company Overview
- 11.6.2. Financial Highlights
- 11.6.3. Product Portfolio
- 11.6.4. SWOT Analysis
- 11.6.5. Key Strategies and Developments
- 11.7. Health Via Modern Nutrition (HVMN)/ Nootrobox Inc.
- 11.7.1. Company Overview
- 11.7.2. Financial Highlights
- 11.7.3. Product Portfolio
- 11.7.4. SWOT Analysis
- 11.7.5. Key Strategies and Developments
- 11.8. Onnit Labs, Inc.
- 11.8.1. Company Overview
- 11.8.2. Financial Highlights
- 11.8.3. Product Portfolio
- 11.8.4. SWOT Analysis
- 11.8.5. Key Strategies and Developments
- 11.9. Peak Nootropics
- 11.9.1. Company Overview
- 11.9.2. Financial Highlights
- 11.9.3. Product Portfolio
- 11.9.4. SWOT Analysis
- 11.9.5. Key Strategies and Developments
- 11.10. Teva Pharmaceutical Industries
- 11.10.1. Company Overview
- 11.10.2. Financial Highlights
- 11.10.3. Product Portfolio
- 11.10.4. SWOT Analysis
- 11.10.5. Key Strategies and Developments
- 11.11. Purelife Bioscience Co., Ltd.
- 11.11.1. Company Overview
- 11.11.2. Financial Highlights
- 11.11.3. Product Portfolio
- 11.11.4. SWOT Analysis
- 11.11.5. Key Strategies and Developments
- 11.12. (US$ Mn & Units)ed Pharmacies
- 11.12.1. Company Overview
- 11.12.2. Financial Highlights
- 11.12.3. Product Portfolio
- 11.12.4. SWOT Analysis
- 11.12.5. Key Strategies and Developments
- 11.13. SupNootropic Bio Co., Ltd.
- 11.13.1. Company Overview
- 11.13.2. Financial Highlights
- 11.13.3. Product Portfolio
- 11.13.4. SWOT Analysis
- 11.13.5. Key Strategies and Developments
- 11.14. Powder City
- 11.14.1. Company Overview
- 11.14.2. Financial Highlights
- 11.14.3. Product Portfolio
- 11.14.4. SWOT Analysis
- 11.14.5. Key Strategies and Developments
- 11.15. Cephalon, Inc.
- 11.15.1. Company Overview
- 11.15.2. Financial Highlights
- 11.15.3. Product Portfolio
- 11.15.4. SWOT Analysis
- 11.15.5. Key Strategies and Developments
- 12. Assumptions and Acronyms
- 13. Research Methodology
- 14. Contact
List of Figures
-
- Figure 1: Global Nootropics Market Revenue (US$ Mn) Market Share by Application Analysis in 2022
- Figure 2: Global Nootropics Market Attractiveness Analysis by Application Analysis, 2016-2032
- Figure 3: Global Nootropics Market Revenue (US$ Mn) Market Share by Distribution Channel Analysisin 2022
- Figure 4: Global Nootropics Market Attractiveness Analysis by Distribution Channel Analysis, 2016-2032
- Figure 5: Global Nootropics Market Revenue (US$ Mn) Market Share by Form Analysisin 2022
- Figure 6: Global Nootropics Market Attractiveness Analysis by Form Analysis, 2016-2032
- Figure 7: Global Nootropics Market Revenue (US$ Mn) Market Share by Region in 2022
- Figure 8: Global Nootropics Market Attractiveness Analysis by Region, 2016-2032
- Figure 9: Global Nootropics Market Revenue (US$ Mn) (2016-2032)
- Figure 10: Global Nootropics Market Revenue (US$ Mn) Comparison by Region (2016-2032)
- Figure 11: Global Nootropics Market Revenue (US$ Mn) Comparison by Application Analysis (2016-2032)
- Figure 12: Global Nootropics Market Revenue (US$ Mn) Comparison by Distribution Channel Analysis (2016-2032)
- Figure 13: Global Nootropics Market Revenue (US$ Mn) Comparison by Form Analysis (2016-2032)
- Figure 14: Global Nootropics Market Y-o-Y Growth Rate Comparison by Region (2016-2032)
- Figure 15: Global Nootropics Market Y-o-Y Growth Rate Comparison by Application Analysis (2016-2032)
- Figure 16: Global Nootropics Market Y-o-Y Growth Rate Comparison by Distribution Channel Analysis (2016-2032)
- Figure 17: Global Nootropics Market Y-o-Y Growth Rate Comparison by Form Analysis (2016-2032)
- Figure 18: Global Nootropics Market Share Comparison by Region (2016-2032)
- Figure 19: Global Nootropics Market Share Comparison by Application Analysis (2016-2032)
- Figure 20: Global Nootropics Market Share Comparison by Distribution Channel Analysis (2016-2032)
- Figure 21: Global Nootropics Market Share Comparison by Form Analysis (2016-2032)
- Figure 22: North America Nootropics Market Revenue (US$ Mn) Market Share by Application Analysisin 2022
- Figure 23: North America Nootropics Market Attractiveness Analysis by Application Analysis, 2016-2032
- Figure 24: North America Nootropics Market Revenue (US$ Mn) Market Share by Distribution Channel Analysisin 2022
- Figure 25: North America Nootropics Market Attractiveness Analysis by Distribution Channel Analysis, 2016-2032
- Figure 26: North America Nootropics Market Revenue (US$ Mn) Market Share by Form Analysisin 2022
- Figure 27: North America Nootropics Market Attractiveness Analysis by Form Analysis, 2016-2032
- Figure 28: North America Nootropics Market Revenue (US$ Mn) Market Share by Country in 2022
- Figure 29: North America Nootropics Market Attractiveness Analysis by Country, 2016-2032
- Figure 30: North America Nootropics Market Revenue (US$ Mn) (2016-2032)
- Figure 31: North America Nootropics Market Revenue (US$ Mn) Comparison by Country (2016-2032)
- Figure 32: North America Nootropics Market Revenue (US$ Mn) Comparison by Application Analysis (2016-2032)
- Figure 33: North America Nootropics Market Revenue (US$ Mn) Comparison by Distribution Channel Analysis (2016-2032)
- Figure 34: North America Nootropics Market Revenue (US$ Mn) Comparison by Form Analysis (2016-2032)
- Figure 35: North America Nootropics Market Y-o-Y Growth Rate Comparison by Country (2016-2032)
- Figure 36: North America Nootropics Market Y-o-Y Growth Rate Comparison by Application Analysis (2016-2032)
- Figure 37: North America Nootropics Market Y-o-Y Growth Rate Comparison by Distribution Channel Analysis (2016-2032)
- Figure 38: North America Nootropics Market Y-o-Y Growth Rate Comparison by Form Analysis (2016-2032)
- Figure 39: North America Nootropics Market Share Comparison by Country (2016-2032)
- Figure 40: North America Nootropics Market Share Comparison by Application Analysis (2016-2032)
- Figure 41: North America Nootropics Market Share Comparison by Distribution Channel Analysis (2016-2032)
- Figure 42: North America Nootropics Market Share Comparison by Form Analysis (2016-2032)
- Figure 43: Western Europe Nootropics Market Revenue (US$ Mn) Market Share by Application Analysisin 2022
- Figure 44: Western Europe Nootropics Market Attractiveness Analysis by Application Analysis, 2016-2032
- Figure 45: Western Europe Nootropics Market Revenue (US$ Mn) Market Share by Distribution Channel Analysisin 2022
- Figure 46: Western Europe Nootropics Market Attractiveness Analysis by Distribution Channel Analysis, 2016-2032
- Figure 47: Western Europe Nootropics Market Revenue (US$ Mn) Market Share by Form Analysisin 2022
- Figure 48: Western Europe Nootropics Market Attractiveness Analysis by Form Analysis, 2016-2032
- Figure 49: Western Europe Nootropics Market Revenue (US$ Mn) Market Share by Country in 2022
- Figure 50: Western Europe Nootropics Market Attractiveness Analysis by Country, 2016-2032
- Figure 51: Western Europe Nootropics Market Revenue (US$ Mn) (2016-2032)
- Figure 52: Western Europe Nootropics Market Revenue (US$ Mn) Comparison by Country (2016-2032)
- Figure 53: Western Europe Nootropics Market Revenue (US$ Mn) Comparison by Application Analysis (2016-2032)
- Figure 54: Western Europe Nootropics Market Revenue (US$ Mn) Comparison by Distribution Channel Analysis (2016-2032)
- Figure 55: Western Europe Nootropics Market Revenue (US$ Mn) Comparison by Form Analysis (2016-2032)
- Figure 56: Western Europe Nootropics Market Y-o-Y Growth Rate Comparison by Country (2016-2032)
- Figure 57: Western Europe Nootropics Market Y-o-Y Growth Rate Comparison by Application Analysis (2016-2032)
- Figure 58: Western Europe Nootropics Market Y-o-Y Growth Rate Comparison by Distribution Channel Analysis (2016-2032)
- Figure 59: Western Europe Nootropics Market Y-o-Y Growth Rate Comparison by Form Analysis (2016-2032)
- Figure 60: Western Europe Nootropics Market Share Comparison by Country (2016-2032)
- Figure 61: Western Europe Nootropics Market Share Comparison by Application Analysis (2016-2032)
- Figure 62: Western Europe Nootropics Market Share Comparison by Distribution Channel Analysis (2016-2032)
- Figure 63: Western Europe Nootropics Market Share Comparison by Form Analysis (2016-2032)
- Figure 64: Eastern Europe Nootropics Market Revenue (US$ Mn) Market Share by Application Analysisin 2022
- Figure 65: Eastern Europe Nootropics Market Attractiveness Analysis by Application Analysis, 2016-2032
- Figure 66: Eastern Europe Nootropics Market Revenue (US$ Mn) Market Share by Distribution Channel Analysisin 2022
- Figure 67: Eastern Europe Nootropics Market Attractiveness Analysis by Distribution Channel Analysis, 2016-2032
- Figure 68: Eastern Europe Nootropics Market Revenue (US$ Mn) Market Share by Form Analysisin 2022
- Figure 69: Eastern Europe Nootropics Market Attractiveness Analysis by Form Analysis, 2016-2032
- Figure 70: Eastern Europe Nootropics Market Revenue (US$ Mn) Market Share by Country in 2022
- Figure 71: Eastern Europe Nootropics Market Attractiveness Analysis by Country, 2016-2032
- Figure 72: Eastern Europe Nootropics Market Revenue (US$ Mn) (2016-2032)
- Figure 73: Eastern Europe Nootropics Market Revenue (US$ Mn) Comparison by Country (2016-2032)
- Figure 74: Eastern Europe Nootropics Market Revenue (US$ Mn) Comparison by Application Analysis (2016-2032)
- Figure 75: Eastern Europe Nootropics Market Revenue (US$ Mn) Comparison by Distribution Channel Analysis (2016-2032)
- Figure 76: Eastern Europe Nootropics Market Revenue (US$ Mn) Comparison by Form Analysis (2016-2032)
- Figure 77: Eastern Europe Nootropics Market Y-o-Y Growth Rate Comparison by Country (2016-2032)
- Figure 78: Eastern Europe Nootropics Market Y-o-Y Growth Rate Comparison by Application Analysis (2016-2032)
- Figure 79: Eastern Europe Nootropics Market Y-o-Y Growth Rate Comparison by Distribution Channel Analysis (2016-2032)
- Figure 80: Eastern Europe Nootropics Market Y-o-Y Growth Rate Comparison by Form Analysis (2016-2032)
- Figure 81: Eastern Europe Nootropics Market Share Comparison by Country (2016-2032)
- Figure 82: Eastern Europe Nootropics Market Share Comparison by Application Analysis (2016-2032)
- Figure 83: Eastern Europe Nootropics Market Share Comparison by Distribution Channel Analysis (2016-2032)
- Figure 84: Eastern Europe Nootropics Market Share Comparison by Form Analysis (2016-2032)
- Figure 85: APAC Nootropics Market Revenue (US$ Mn) Market Share by Application Analysisin 2022
- Figure 86: APAC Nootropics Market Attractiveness Analysis by Application Analysis, 2016-2032
- Figure 87: APAC Nootropics Market Revenue (US$ Mn) Market Share by Distribution Channel Analysisin 2022
- Figure 88: APAC Nootropics Market Attractiveness Analysis by Distribution Channel Analysis, 2016-2032
- Figure 89: APAC Nootropics Market Revenue (US$ Mn) Market Share by Form Analysisin 2022
- Figure 90: APAC Nootropics Market Attractiveness Analysis by Form Analysis, 2016-2032
- Figure 91: APAC Nootropics Market Revenue (US$ Mn) Market Share by Country in 2022
- Figure 92: APAC Nootropics Market Attractiveness Analysis by Country, 2016-2032
- Figure 93: APAC Nootropics Market Revenue (US$ Mn) (2016-2032)
- Figure 94: APAC Nootropics Market Revenue (US$ Mn) Comparison by Country (2016-2032)
- Figure 95: APAC Nootropics Market Revenue (US$ Mn) Comparison by Application Analysis (2016-2032)
- Figure 96: APAC Nootropics Market Revenue (US$ Mn) Comparison by Distribution Channel Analysis (2016-2032)
- Figure 97: APAC Nootropics Market Revenue (US$ Mn) Comparison by Form Analysis (2016-2032)
- Figure 98: APAC Nootropics Market Y-o-Y Growth Rate Comparison by Country (2016-2032)
- Figure 99: APAC Nootropics Market Y-o-Y Growth Rate Comparison by Application Analysis (2016-2032)
- Figure 100: APAC Nootropics Market Y-o-Y Growth Rate Comparison by Distribution Channel Analysis (2016-2032)
- Figure 101: APAC Nootropics Market Y-o-Y Growth Rate Comparison by Form Analysis (2016-2032)
- Figure 102: APAC Nootropics Market Share Comparison by Country (2016-2032)
- Figure 103: APAC Nootropics Market Share Comparison by Application Analysis (2016-2032)
- Figure 104: APAC Nootropics Market Share Comparison by Distribution Channel Analysis (2016-2032)
- Figure 105: APAC Nootropics Market Share Comparison by Form Analysis (2016-2032)
- Figure 106: Latin America Nootropics Market Revenue (US$ Mn) Market Share by Application Analysisin 2022
- Figure 107: Latin America Nootropics Market Attractiveness Analysis by Application Analysis, 2016-2032
- Figure 108: Latin America Nootropics Market Revenue (US$ Mn) Market Share by Distribution Channel Analysisin 2022
- Figure 109: Latin America Nootropics Market Attractiveness Analysis by Distribution Channel Analysis, 2016-2032
- Figure 110: Latin America Nootropics Market Revenue (US$ Mn) Market Share by Form Analysisin 2022
- Figure 111: Latin America Nootropics Market Attractiveness Analysis by Form Analysis, 2016-2032
- Figure 112: Latin America Nootropics Market Revenue (US$ Mn) Market Share by Country in 2022
- Figure 113: Latin America Nootropics Market Attractiveness Analysis by Country, 2016-2032
- Figure 114: Latin America Nootropics Market Revenue (US$ Mn) (2016-2032)
- Figure 115: Latin America Nootropics Market Revenue (US$ Mn) Comparison by Country (2016-2032)
- Figure 116: Latin America Nootropics Market Revenue (US$ Mn) Comparison by Application Analysis (2016-2032)
- Figure 117: Latin America Nootropics Market Revenue (US$ Mn) Comparison by Distribution Channel Analysis (2016-2032)
- Figure 118: Latin America Nootropics Market Revenue (US$ Mn) Comparison by Form Analysis (2016-2032)
- Figure 119: Latin America Nootropics Market Y-o-Y Growth Rate Comparison by Country (2016-2032)
- Figure 120: Latin America Nootropics Market Y-o-Y Growth Rate Comparison by Application Analysis (2016-2032)
- Figure 121: Latin America Nootropics Market Y-o-Y Growth Rate Comparison by Distribution Channel Analysis (2016-2032)
- Figure 122: Latin America Nootropics Market Y-o-Y Growth Rate Comparison by Form Analysis (2016-2032)
- Figure 123: Latin America Nootropics Market Share Comparison by Country (2016-2032)
- Figure 124: Latin America Nootropics Market Share Comparison by Application Analysis (2016-2032)
- Figure 125: Latin America Nootropics Market Share Comparison by Distribution Channel Analysis (2016-2032)
- Figure 126: Latin America Nootropics Market Share Comparison by Form Analysis (2016-2032)
- Figure 127: Middle East & Africa Nootropics Market Revenue (US$ Mn) Market Share by Application Analysisin 2022
- Figure 128: Middle East & Africa Nootropics Market Attractiveness Analysis by Application Analysis, 2016-2032
- Figure 129: Middle East & Africa Nootropics Market Revenue (US$ Mn) Market Share by Distribution Channel Analysisin 2022
- Figure 130: Middle East & Africa Nootropics Market Attractiveness Analysis by Distribution Channel Analysis, 2016-2032
- Figure 131: Middle East & Africa Nootropics Market Revenue (US$ Mn) Market Share by Form Analysisin 2022
- Figure 132: Middle East & Africa Nootropics Market Attractiveness Analysis by Form Analysis, 2016-2032
- Figure 133: Middle East & Africa Nootropics Market Revenue (US$ Mn) Market Share by Country in 2022
- Figure 134: Middle East & Africa Nootropics Market Attractiveness Analysis by Country, 2016-2032
- Figure 135: Middle East & Africa Nootropics Market Revenue (US$ Mn) (2016-2032)
- Figure 136: Middle East & Africa Nootropics Market Revenue (US$ Mn) Comparison by Country (2016-2032)
- Figure 137: Middle East & Africa Nootropics Market Revenue (US$ Mn) Comparison by Application Analysis (2016-2032)
- Figure 138: Middle East & Africa Nootropics Market Revenue (US$ Mn) Comparison by Distribution Channel Analysis (2016-2032)
- Figure 139: Middle East & Africa Nootropics Market Revenue (US$ Mn) Comparison by Form Analysis (2016-2032)
- Figure 140: Middle East & Africa Nootropics Market Y-o-Y Growth Rate Comparison by Country (2016-2032)
- Figure 141: Middle East & Africa Nootropics Market Y-o-Y Growth Rate Comparison by Application Analysis (2016-2032)
- Figure 142: Middle East & Africa Nootropics Market Y-o-Y Growth Rate Comparison by Distribution Channel Analysis (2016-2032)
- Figure 143: Middle East & Africa Nootropics Market Y-o-Y Growth Rate Comparison by Form Analysis (2016-2032)
- Figure 144: Middle East & Africa Nootropics Market Share Comparison by Country (2016-2032)
- Figure 145: Middle East & Africa Nootropics Market Share Comparison by Application Analysis (2016-2032)
- Figure 146: Middle East & Africa Nootropics Market Share Comparison by Distribution Channel Analysis (2016-2032)
- Figure 147: Middle East & Africa Nootropics Market Share Comparison by Form Analysis (2016-2032)
List of Tables
-
- Table 1: Global Nootropics Market Comparison by Application Analysis (2016-2032)
- Table 2: Global Nootropics Market Comparison by Distribution Channel Analysis (2016-2032)
- Table 3: Global Nootropics Market Comparison by Form Analysis (2016-2032)
- Table 4: Global Nootropics Market Revenue (US$ Mn) Comparison by Region (2016-2032)
- Table 5: Global Nootropics Market Revenue (US$ Mn) (2016-2032)
- Table 6: Global Nootropics Market Revenue (US$ Mn) Comparison by Region (2016-2032)
- Table 7: Global Nootropics Market Revenue (US$ Mn) Comparison by Application Analysis (2016-2032)
- Table 8: Global Nootropics Market Revenue (US$ Mn) Comparison by Distribution Channel Analysis (2016-2032)
- Table 9: Global Nootropics Market Revenue (US$ Mn) Comparison by Form Analysis (2016-2032)
- Table 10: Global Nootropics Market Y-o-Y Growth Rate Comparison by Region (2016-2032)
- Table 11: Global Nootropics Market Y-o-Y Growth Rate Comparison by Application Analysis (2016-2032)
- Table 12: Global Nootropics Market Y-o-Y Growth Rate Comparison by Distribution Channel Analysis (2016-2032)
- Table 13: Global Nootropics Market Y-o-Y Growth Rate Comparison by Form Analysis (2016-2032)
- Table 14: Global Nootropics Market Share Comparison by Region (2016-2032)
- Table 15: Global Nootropics Market Share Comparison by Application Analysis (2016-2032)
- Table 16: Global Nootropics Market Share Comparison by Distribution Channel Analysis (2016-2032)
- Table 17: Global Nootropics Market Share Comparison by Form Analysis (2016-2032)
- Table 18: North America Nootropics Market Comparison by Distribution Channel Analysis (2016-2032)
- Table 19: North America Nootropics Market Comparison by Form Analysis (2016-2032)
- Table 20: North America Nootropics Market Revenue (US$ Mn) Comparison by Country (2016-2032)
- Table 21: North America Nootropics Market Revenue (US$ Mn) (2016-2032)
- Table 22: North America Nootropics Market Revenue (US$ Mn) Comparison by Country (2016-2032)
- Table 23: North America Nootropics Market Revenue (US$ Mn) Comparison by Application Analysis (2016-2032)
- Table 24: North America Nootropics Market Revenue (US$ Mn) Comparison by Distribution Channel Analysis (2016-2032)
- Table 25: North America Nootropics Market Revenue (US$ Mn) Comparison by Form Analysis (2016-2032)
- Table 26: North America Nootropics Market Y-o-Y Growth Rate Comparison by Country (2016-2032)
- Table 27: North America Nootropics Market Y-o-Y Growth Rate Comparison by Application Analysis (2016-2032)
- Table 28: North America Nootropics Market Y-o-Y Growth Rate Comparison by Distribution Channel Analysis (2016-2032)
- Table 29: North America Nootropics Market Y-o-Y Growth Rate Comparison by Form Analysis (2016-2032)
- Table 30: North America Nootropics Market Share Comparison by Country (2016-2032)
- Table 31: North America Nootropics Market Share Comparison by Application Analysis (2016-2032)
- Table 32: North America Nootropics Market Share Comparison by Distribution Channel Analysis (2016-2032)
- Table 33: North America Nootropics Market Share Comparison by Form Analysis (2016-2032)
- Table 34: Western Europe Nootropics Market Comparison by Application Analysis (2016-2032)
- Table 35: Western Europe Nootropics Market Comparison by Distribution Channel Analysis (2016-2032)
- Table 36: Western Europe Nootropics Market Comparison by Form Analysis (2016-2032)
- Table 37: Western Europe Nootropics Market Revenue (US$ Mn) Comparison by Country (2016-2032)
- Table 38: Western Europe Nootropics Market Revenue (US$ Mn) (2016-2032)
- Table 39: Western Europe Nootropics Market Revenue (US$ Mn) Comparison by Country (2016-2032)
- Table 40: Western Europe Nootropics Market Revenue (US$ Mn) Comparison by Application Analysis (2016-2032)
- Table 41: Western Europe Nootropics Market Revenue (US$ Mn) Comparison by Distribution Channel Analysis (2016-2032)
- Table 42: Western Europe Nootropics Market Revenue (US$ Mn) Comparison by Form Analysis (2016-2032)
- Table 43: Western Europe Nootropics Market Y-o-Y Growth Rate Comparison by Country (2016-2032)
- Table 44: Western Europe Nootropics Market Y-o-Y Growth Rate Comparison by Application Analysis (2016-2032)
- Table 45: Western Europe Nootropics Market Y-o-Y Growth Rate Comparison by Distribution Channel Analysis (2016-2032)
- Table 46: Western Europe Nootropics Market Y-o-Y Growth Rate Comparison by Form Analysis (2016-2032)
- Table 47: Western Europe Nootropics Market Share Comparison by Country (2016-2032)
- Table 48: Western Europe Nootropics Market Share Comparison by Application Analysis (2016-2032)
- Table 49: Western Europe Nootropics Market Share Comparison by Distribution Channel Analysis (2016-2032)
- Table 50: Western Europe Nootropics Market Share Comparison by Form Analysis (2016-2032)
- Table 51: Eastern Europe Nootropics Market Comparison by Application Analysis (2016-2032)
- Table 52: Eastern Europe Nootropics Market Comparison by Distribution Channel Analysis (2016-2032)
- Table 53: Eastern Europe Nootropics Market Comparison by Form Analysis (2016-2032)
- Table 54: Eastern Europe Nootropics Market Revenue (US$ Mn) Comparison by Country (2016-2032)
- Table 55: Eastern Europe Nootropics Market Revenue (US$ Mn) (2016-2032)
- Table 56: Eastern Europe Nootropics Market Revenue (US$ Mn) Comparison by Country (2016-2032)
- Table 57: Eastern Europe Nootropics Market Revenue (US$ Mn) Comparison by Application Analysis (2016-2032)
- Table 58: Eastern Europe Nootropics Market Revenue (US$ Mn) Comparison by Distribution Channel Analysis (2016-2032)
- Table 59: Eastern Europe Nootropics Market Revenue (US$ Mn) Comparison by Form Analysis (2016-2032)
- Table 60: Eastern Europe Nootropics Market Y-o-Y Growth Rate Comparison by Country (2016-2032)
- Table 61: Eastern Europe Nootropics Market Y-o-Y Growth Rate Comparison by Application Analysis (2016-2032)
- Table 62: Eastern Europe Nootropics Market Y-o-Y Growth Rate Comparison by Distribution Channel Analysis (2016-2032)
- Table 63: Eastern Europe Nootropics Market Y-o-Y Growth Rate Comparison by Form Analysis (2016-2032)
- Table 64: Eastern Europe Nootropics Market Share Comparison by Country (2016-2032)
- Table 65: Eastern Europe Nootropics Market Share Comparison by Application Analysis (2016-2032)
- Table 66: Eastern Europe Nootropics Market Share Comparison by Distribution Channel Analysis (2016-2032)
- Table 67: Eastern Europe Nootropics Market Share Comparison by Form Analysis (2016-2032)
- Table 68: APAC Nootropics Market Comparison by Application Analysis (2016-2032)
- Table 69: APAC Nootropics Market Comparison by Distribution Channel Analysis (2016-2032)
- Table 70: APAC Nootropics Market Comparison by Form Analysis (2016-2032)
- Table 71: APAC Nootropics Market Revenue (US$ Mn) Comparison by Country (2016-2032)
- Table 72: APAC Nootropics Market Revenue (US$ Mn) (2016-2032)
- Table 73: APAC Nootropics Market Revenue (US$ Mn) Comparison by Country (2016-2032)
- Table 74: APAC Nootropics Market Revenue (US$ Mn) Comparison by Application Analysis (2016-2032)
- Table 75: APAC Nootropics Market Revenue (US$ Mn) Comparison by Distribution Channel Analysis (2016-2032)
- Table 76: APAC Nootropics Market Revenue (US$ Mn) Comparison by Form Analysis (2016-2032)
- Table 77: APAC Nootropics Market Y-o-Y Growth Rate Comparison by Country (2016-2032)
- Table 78: APAC Nootropics Market Y-o-Y Growth Rate Comparison by Application Analysis (2016-2032)
- Table 79: APAC Nootropics Market Y-o-Y Growth Rate Comparison by Distribution Channel Analysis (2016-2032)
- Table 80: APAC Nootropics Market Y-o-Y Growth Rate Comparison by Form Analysis (2016-2032)
- Table 81: APAC Nootropics Market Share Comparison by Country (2016-2032)
- Table 82: APAC Nootropics Market Share Comparison by Application Analysis (2016-2032)
- Table 83: APAC Nootropics Market Share Comparison by Distribution Channel Analysis (2016-2032)
- Table 84: APAC Nootropics Market Share Comparison by Form Analysis (2016-2032)
- Table 85: Latin America Nootropics Market Comparison by Application Analysis (2016-2032)
- Table 86: Latin America Nootropics Market Comparison by Distribution Channel Analysis (2016-2032)
- Table 87: Latin America Nootropics Market Comparison by Form Analysis (2016-2032)
- Table 88: Latin America Nootropics Market Revenue (US$ Mn) Comparison by Country (2016-2032)
- Table 89: Latin America Nootropics Market Revenue (US$ Mn) (2016-2032)
- Table 90: Latin America Nootropics Market Revenue (US$ Mn) Comparison by Country (2016-2032)
- Table 91: Latin America Nootropics Market Revenue (US$ Mn) Comparison by Application Analysis (2016-2032)
- Table 92: Latin America Nootropics Market Revenue (US$ Mn) Comparison by Distribution Channel Analysis (2016-2032)
- Table 93: Latin America Nootropics Market Revenue (US$ Mn) Comparison by Form Analysis (2016-2032)
- Table 94: Latin America Nootropics Market Y-o-Y Growth Rate Comparison by Country (2016-2032)
- Table 95: Latin America Nootropics Market Y-o-Y Growth Rate Comparison by Application Analysis (2016-2032)
- Table 96: Latin America Nootropics Market Y-o-Y Growth Rate Comparison by Distribution Channel Analysis (2016-2032)
- Table 97: Latin America Nootropics Market Y-o-Y Growth Rate Comparison by Form Analysis (2016-2032)
- Table 98: Latin America Nootropics Market Share Comparison by Country (2016-2032)
- Table 99: Latin America Nootropics Market Share Comparison by Application Analysis (2016-2032)
- Table 100: Latin America Nootropics Market Share Comparison by Distribution Channel Analysis (2016-2032)
- Table 101: Latin America Nootropics Market Share Comparison by Form Analysis (2016-2032)
- Table 102: Middle East & Africa Nootropics Market Comparison by Application Analysis (2016-2032)
- Table 103: Middle East & Africa Nootropics Market Comparison by Distribution Channel Analysis (2016-2032)
- Table 104: Middle East & Africa Nootropics Market Comparison by Form Analysis (2016-2032)
- Table 105: Middle East & Africa Nootropics Market Revenue (US$ Mn) Comparison by Country (2016-2032)
- Table 106: Middle East & Africa Nootropics Market Revenue (US$ Mn) (2016-2032)
- Table 107: Middle East & Africa Nootropics Market Revenue (US$ Mn) Comparison by Country (2016-2032)
- Table 108: Middle East & Africa Nootropics Market Revenue (US$ Mn) Comparison by Application Analysis (2016-2032)
- Table 109: Middle East & Africa Nootropics Market Revenue (US$ Mn) Comparison by Distribution Channel Analysis (2016-2032)
- Table 110: Middle East & Africa Nootropics Market Revenue (US$ Mn) Comparison by Form Analysis (2016-2032)
- Table 111: Middle East & Africa Nootropics Market Y-o-Y Growth Rate Comparison by Country (2016-2032)
- Table 112: Middle East & Africa Nootropics Market Y-o-Y Growth Rate Comparison by Application Analysis (2016-2032)
- Table 113: Middle East & Africa Nootropics Market Y-o-Y Growth Rate Comparison by Distribution Channel Analysis (2016-2032)
- Table 114: Middle East & Africa Nootropics Market Y-o-Y Growth Rate Comparison by Form Analysis (2016-2032)
- Table 115: Middle East & Africa Nootropics Market Share Comparison by Country (2016-2032)
- Table 116: Middle East & Africa Nootropics Market Share Comparison by Application Analysis (2016-2032)
- Table 117: Middle East & Africa Nootropics Market Share Comparison by Distribution Channel Analysis (2016-2032)
- Table 118: Middle East & Africa Nootropics Market Share Comparison by Form Analysis (2016-2032)
- 1. Executive Summary
-
- Accelerated Intelligence Inc.
- Natural Stacks
- AlternaScript
- Bulletproof
- Health Via Modern Nutrition (HVMN)/ Nootrobox Inc.
- Onnit Labs, Inc.
- Peak Nootropics
- Teva Pharmaceutical Industries
- Purelife Bioscience Co., Ltd.
- United Pharmacies
- SupNootropic Bio Co., Ltd.
- Powder City
- Cephalon, Inc.
Our Clients


View Our Licence Options
