Non Halogenated Flame Retardants Market By Product (Aluminum Hydroxide, Magnesium Dihydroxide, Phosphorous Based, Others), By Application(Polyolefins, Epoxy Resins, UPE, PVC, ETP, Rubber, Styrenics, Other Applications), By End-use (Electrical & Electronics, Construction, Transportation, Others), By Region And Companies - Industry Segment Outlook, Market Assessment, Competition Scenario, Trends, And Forecast 2024-2033
-
48088
-
June 2024
-
300
-


-
This report was compiled by Shreyas Rokade Shreyas Rokade is a seasoned Research Analyst with CMFE, bringing extensive expertise in market research and consulting, with a strong background in Chemical Engineering. Correspondence Team Lead-CMFE Linkedin | Detailed Market research Methodology Our methodology involves a mix of primary research, including interviews with leading mental health experts, and secondary research from reputable medical journals and databases. View Detailed Methodology Page
-
Quick Navigation
Report Overview
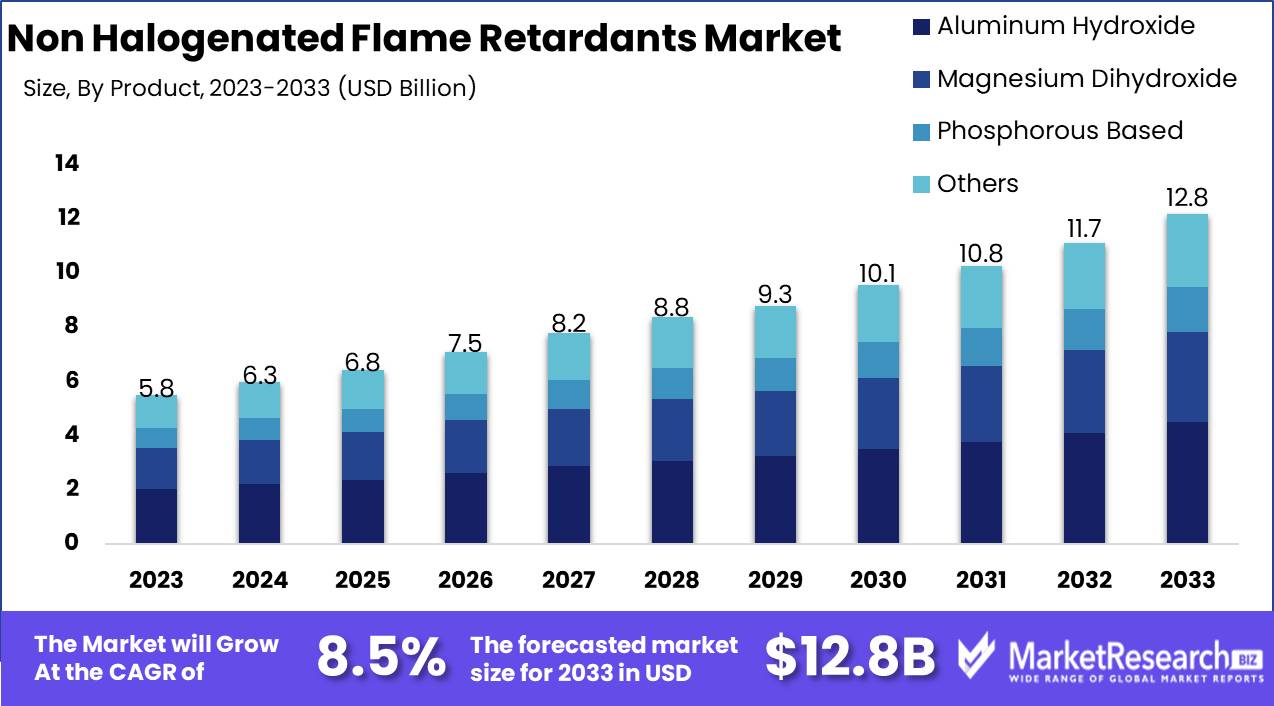
The Non-Halogenated Flame Retardants Market was valued at USD 5.8 billion in 2023. It is expected to reach USD 12.8 billion by 2033, with a CAGR of 8.5% during the forecast period from 2024 to 2033.
The Non-Halogenated Flame Retardants Market encompasses the production and application of flame retardant materials that do not contain halogens, such as chlorine or bromine. These retardants are pivotal in enhancing fire safety across various industries, including electronics, construction, automotive, and textiles, by reducing flammability and slowing the spread of fire. Unlike halogenated counterparts, non-halogenated flame retardants offer improved environmental and health profiles, as they generate less toxic smoke and byproducts during combustion. This market is driven by stringent fire safety regulations, growing environmental awareness, and increasing demand for safer, sustainable alternatives in consumer and industrial applications.
The non-halogenated flame retardants (NHFR) market is poised for substantial growth, driven by stringent environmental regulations and a rising emphasis on sustainable solutions across industries. Regulatory bodies, particularly in Europe and North America, are increasingly enforcing limitations on the use of halogenated flame retardants due to their adverse environmental and health impacts. This regulatory pressure is catalyzing a shift towards NHFRs, which offer a more environmentally benign profile. However, the higher cost of NHFRs compared to their halogenated counterparts presents a significant barrier to widespread adoption, particularly in cost-sensitive markets. The competitive landscape is further complicated by the need for these alternatives to meet rigorous performance standards, which has traditionally been a strength of halogenated flame retardants.
Despite these challenges, the NHFR market is witnessing robust investment in research and development. Innovations are focused on enhancing the performance characteristics of NHFRs, aiming to bridge the gap with halogenated flame retardants. These advancements are expected to not only improve the efficacy of NHFRs but also reduce their cost, making them more competitive and attractive for broader market applications. As industries such as electronics, automotive, and construction increasingly prioritize sustainability, the demand for high-performance, cost-effective NHFRs is projected to escalate.
Overall, while the transition to non-halogenated flame retardants entails overcoming cost and performance hurdles, the regulatory landscape and ongoing technological advancements provide a conducive environment for market growth. Strategic investments in R&D and scaling of production processes will be critical in driving the adoption of NHFRs and capturing market share in an evolving regulatory and competitive landscape.
Key Takeaways
- Market Growth: The Non-Halogenated Flame Retardants Market was valued at USD 5.8 billion in 2023. It is expected to reach USD 8.2 billion by 2033, with a CAGR of 8.5% during the forecast period from 2024 to 2033.
- By Product: Aluminum Hydroxide dominated the Non-Halogenated Flame Retardants Market.
- By Application: Polyolefins dominated non-halogenated flame retardants across multiple applications.
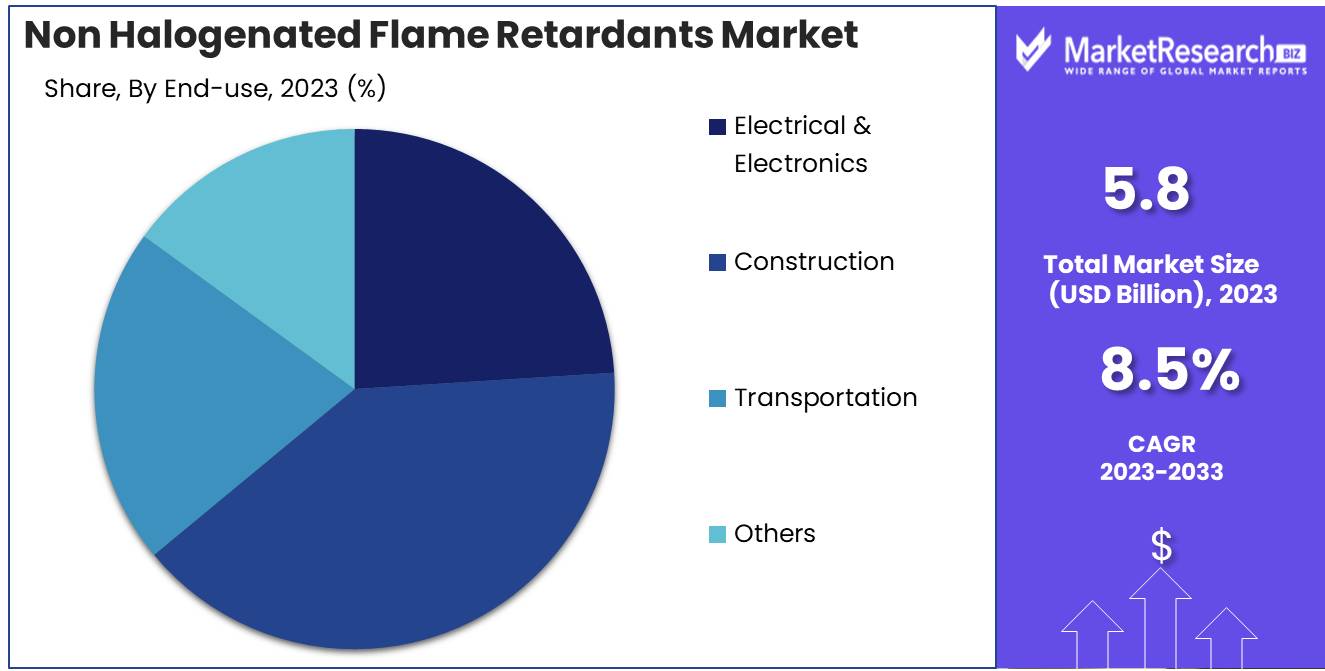
- By End-use: Construction dominated the Non Halogenated Flame Retardants Market.
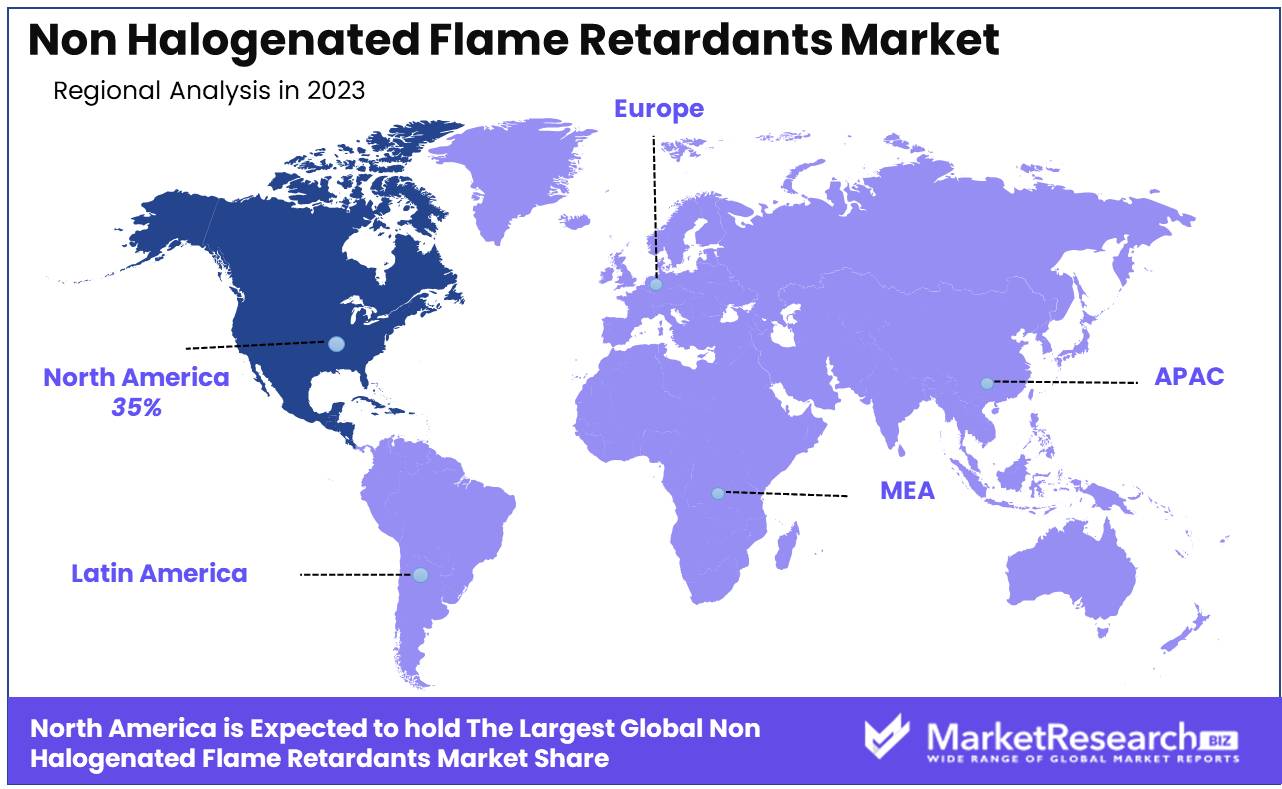
- Regional Dominance: North America dominates the non-halogenated flame retardants market at 35% largest market share.
- Growth Opportunity: The global non-halogenated flame retardants market is set for robust growth driven by automotive and construction sector demand.
Driving factors
Increasing Demand for Fire-Safe and Environmentally-Friendly Products: Catalyzing Market Expansion
The growing awareness of fire safety and environmental sustainability is a significant driver for the non-halogenated flame retardants market. Consumers and industries alike are increasingly prioritizing products that reduce fire hazards while also minimizing environmental impact. Non-halogenated flame retardants are preferred over their halogenated counterparts due to their lower toxicity and lesser environmental persistence. Regulatory bodies across the globe, such as the European Union's REACH (Registration, Evaluation, Authorisation, and Restriction of Chemicals) regulation, are imposing stricter controls on the use of hazardous substances, further propelling the adoption of non-halogenated alternatives. This shift is evidenced by the rising preference for materials that meet stringent fire safety standards without compromising ecological health, thereby driving market growth
Growth in the Automotive and Transportation Industry: Accelerating Demand for Safer Materials
The automotive and transportation industry is experiencing robust growth, driven by technological advancements and increasing consumer demand for safer and more efficient vehicles. Non-halogenated flame retardants play a crucial role in enhancing the fire safety of automotive components, such as interiors, seat fabrics, and electronic systems. As electric vehicles (EVs) gain popularity, the need for superior flame-retardant materials becomes even more critical due to the high-energy density of lithium-ion batteries used in EVs. This sector's expansion directly contributes to the rising demand for non-halogenated flame retardants, as manufacturers seek to comply with rigorous safety standards while also addressing environmental concerns. The global automotive market's shift towards lightweight and sustainable materials further underscores the importance of non-halogenated flame retardants, ensuring the continued growth of this market segment.
Expansion of the Electrical and Electronics Industry: Boosting the Market for Advanced Flame Retardants
The rapid growth of the electrical and electronics industry significantly drives the demand for non-halogenated flame retardants. With the proliferation of electronic devices and the increasing complexity of electrical systems, there is a heightened focus on fire safety. Non-halogenated flame retardants are integral to the manufacturing of various electronic components, such as printed circuit boards (PCBs), connectors, and casings, which require high fire resistance without compromising performance. The industry’s expansion is further fueled by the increasing adoption of smart technologies and the Internet of Things (IoT), leading to a greater need for reliable and safe electronic products. This trend is evident in the anticipated market growth, where the electrical and electronics sector's demand for non-halogenated flame retardants is projected to grow substantially, aligning with the broader market trends toward safety and sustainability.
Restraining Factors
Volatility in Raw Material Prices: A Major Growth Constraint
The non-halogenated flame retardants market is significantly impacted by the volatility in raw material prices, a factor that directly affects production costs and profit margins. Non-halogenated flame retardants are derived from various raw materials, including phosphorus, nitrogen, and magnesium hydroxide. The prices of these materials are influenced by multiple factors such as geopolitical tensions, supply chain disruptions, and fluctuations in global demand.
For instance, phosphorus, a key component, has seen price fluctuations due to changes in mining outputs and environmental regulations that restrict production in certain regions. Similarly, the extraction and processing of magnesium hydroxide are affected by the cost of energy and mining regulations, contributing to unpredictable cost variations. This price volatility poses a significant challenge for manufacturers, making it difficult to forecast expenses and plan long-term investments.
Such unpredictability can lead to higher product prices, reducing the competitiveness of non-halogenated flame retardants in comparison to their halogenated counterparts. This situation is further exacerbated by the fact that buyers, particularly in cost-sensitive sectors like electronics and automotive, may opt for cheaper alternatives, thereby restraining market growth.
Harmful Chemical Use in Flame Retardants: Driving Regulatory and Consumer Pushback
The use of harmful chemicals in traditional flame retardants has raised significant health and environmental concerns, driving a push towards safer alternatives like non-halogenated flame retardants. Conventional flame retardants, often halogenated, have been linked to severe health risks such as endocrine disruption, reproductive toxicity, and carcinogenicity. These concerns have spurred stringent regulatory actions across various regions.
As a result, there is a growing demand for non-halogenated flame retardants, which are perceived as safer and more environmentally friendly. This shift is particularly evident in industries such as electronics, textiles, and construction, where consumer awareness and regulatory compliance are driving the adoption of non-toxic alternatives. However, the transition to non-halogenated options can be challenging due to the need for reformulation and testing of new materials, which can be time-consuming and costly.
By Product Analysis
In 2023, Aluminum Hydroxide dominated the Non-Halogenated Flame Retardants Market.
In 2023, Aluminum Hydroxide held a dominant market position in the by-product segment of the Non-Halogenated Flame Retardants Market. Aluminum Hydroxide's superior flame-retardant properties, coupled with its affordability and widespread availability, significantly contributed to its market leadership. It is extensively utilized in various applications, including plastics, rubber, and textiles, owing to its effectiveness in reducing flammability and smoke emissions.
Magnesium Dihydroxide, the second-leading product, gained traction due to its higher thermal stability and environmental benefits. This segment experienced growth, particularly in applications requiring enhanced performance at elevated temperatures. Its non-toxic nature and lower environmental impact align with the increasing regulatory push towards sustainable flame retardants.
Phosphorous-based flame retardants, though less dominant, saw increased adoption in specialized applications. Their high efficiency at lower loadings and compatibility with a broad range of polymers make them ideal for electrical and electronic products, contributing to their steady market presence.
The "Others" category encompasses a diverse range of flame retardants, including zinc borates and nitrogen-based compounds, which cater to niche applications. This segment, while smaller, addresses specific requirements in various industries, thus maintaining a stable market share.
By Application Analysis
In 2023, Polyolefins dominated non-halogenated flame retardants across multiple applications.
In 2023, Polyolefins held a dominant market position in the Non-Halogenated Flame Retardants (NHFR) market, particularly within the "By Application" segment. Polyolefins, widely used due to their excellent mechanical properties and cost-effectiveness, accounted for a significant share, driven by their extensive application in packaging, automotive, and construction industries. The increasing regulatory pressure to reduce halogenated flame retardants boosted the demand for NHFR in polyolefins, emphasizing their sustainability and reduced toxicity.
Epoxy Resins, another key application segment, benefited from their use in electronics and electrical systems, owing to their superior thermal stability and electrical insulation properties. Unsaturated Polyester Resins (UPE) followed closely, with substantial applications in transportation and construction, driven by their high-performance characteristics.
PVC (Polyvinyl Chloride) demand in NHFR applications was fueled by the construction industry's preference for safe and durable materials. Engineering Thermoplastics (ETP) also showed significant growth, attributed to their utilization in high-temperature environments and advanced engineering applications.
Rubber applications, including automotive and industrial uses, saw steady growth due to the necessity for flame retardancy in safety-critical components. Styrenics, used in consumer goods and packaging, leveraged NHFR to meet stringent fire safety standards.
Lastly, the "Other Applications" category, encompassing niche markets like textiles and adhesives, demonstrated a growing awareness and adoption of NHFR, driven by evolving safety regulations and an increasing focus on sustainable material solutions. This comprehensive uptake across various segments underscores the versatile applicability and critical importance of NHFR in modern industrial and consumer products.
By End-use Analysis
In 2023, Construction dominated the Non-Halogenated Flame Retardants Market.
In 2023, Construction held a dominant market position in the By End-use segment of the Non-Halogenated Flame Retardants Market. The sector's robust growth can be attributed to stringent fire safety regulations and an increasing emphasis on sustainable building practices. With the construction industry increasingly adopting green building standards, the demand for non-halogenated flame retardants, which offer environmental and health benefits, has surged. This trend is particularly evident in residential and commercial building projects, where the need for safer, non-toxic materials is paramount.
Meanwhile, the Electrical & Electronics segment also demonstrated significant growth, driven by the rising proliferation of consumer electronics and the ongoing transition towards electric vehicles (EVs). Non-halogenated flame retardants are essential in ensuring the safety and reliability of these products, enhancing their appeal in a market that prioritizes both performance and sustainability.
The Transportation segment, encompassing automotive, aerospace, and rail industries, witnessed moderate growth. This is driven by stringent safety regulations and the increasing use of lightweight composite materials, which require effective flame-retardant solutions to meet safety standards.
Lastly, the 'Others' category, which includes textiles, furniture, and industrial applications, showed steady demand. This diverse segment benefits from the versatile applications of non-halogenated flame retardants, meeting the needs for fire safety across various industries. Collectively, these end-use industries segments underscore the critical role of non-halogenated flame retardants in enhancing safety and sustainability across multiple sectors.
Key Market Segments
By Product
- Aluminum Hydroxide
- Magnesium Dihydroxide
- Phosphorous Based
- Others
By Application
- Polyolefins
- Epoxy Resins
- UPE
- PVC
- ETP
- Rubber
- Styrenics
- Other Applications
By End-use
- Electrical & Electronics
- Construction
- Transportation
- Others
Growth Opportunity
Increasing Demand for Polymers in the Automotive Industry
The automotive industry is experiencing a significant shift towards lightweight materials, driven by the need for improved fuel efficiency and reduced emissions. Non-halogenated flame retardants (NHFRs) are emerging as essential additives in polymers used in automotive applications due to their ability to enhance fire safety without compromising material performance. As the industry accelerates its adoption of advanced polymer composites and engineering plastics, the demand for NHFRs is poised to grow substantially. This trend presents a lucrative opportunity for NHFR manufacturers to capitalize on the evolving material requirements of automotive OEMs and tier-one suppliers.
Rising Construction Activities and Infrastructure Spending
Global construction activities are on an upward trajectory, fueled by robust infrastructure spending in both developed and emerging markets. Non-halogenated flame retardants are increasingly being integrated into construction materials such as insulation foams, cables, and coatings to meet stringent fire safety standards. With governments and private sector entities investing heavily in smart city initiatives and green building projects, the market for NHFRs is expected to expand significantly. This surge in construction activities presents a strategic growth opportunity for NHFR suppliers to cater to the heightened demand for fire-resistant materials in residential, commercial, and industrial infrastructure projects.
Latest Trends
Increasing Demand from the Electrical & Electronics Industry
The non-halogenated flame retardants market is poised for significant growth, primarily driven by escalating demand from the electrical and electronics industry. As the sector expands, particularly with the proliferation of advanced consumer electronics, electric vehicles, and smart devices, the need for effective fire safety solutions intensifies.
Non-halogenated flame retardants are increasingly favored due to their superior performance in preventing fire hazards without compromising the material properties of electronic components. This trend is further bolstered by stringent regulatory standards mandating higher fire safety levels, compelling manufacturers to integrate these retardants into their products. Consequently, companies within this sector are likely to see increased investments in non-halogenated options to meet both safety standards and consumer expectations.
Shift Towards More Environment-Friendly Alternatives
Environmental sustainability is becoming a central focus across industries, and the flame retardants market is no exception. A noticeable shift towards more environment-friendly alternatives is expected to shape the market landscape. Non-halogenated flame retardants, which are free from harmful halogens, align with global environmental directives aimed at reducing ecological footprints and improving human health safety. This shift is driven by both regulatory pressures and growing consumer awareness about the environmental impact of traditional flame retardants.
Industries such as construction, textiles, and automotive are increasingly adopting non-halogenated solutions to enhance their sustainability profiles and comply with evolving environmental regulations. Additionally, ongoing innovations in green chemistry and material science are likely to yield new, more efficient non-halogenated formulations, further accelerating their adoption.
Regional Analysis
North America dominates the non-halogenated flame retardants market at 35% largest market share.
The non-halogenated flame retardants market exhibits distinct regional dynamics, with North America leading the charge, accounting for approximately 35% of the global market share. This dominance is primarily driven by stringent fire safety regulations and the increasing adoption of environmentally friendly products. The U.S. and Canada are at the forefront, with substantial investments in research and development to enhance product efficacy and sustainability.
In Europe, the market is bolstered by robust regulatory frameworks such as REACH and the Restriction of Hazardous Substances (RoHS) Directive, fostering demand for non-halogenated alternatives. Germany, France, and the UK are key contributors, driven by strong automotive and electronics sectors.
The Asia Pacific region is experiencing rapid growth, projected to achieve the highest CAGR during the forecast period. This surge is attributed to expanding construction activities, increasing industrialization, and rising awareness about fire safety. China, Japan, and India are major players, with China alone expected to witness a substantial increase in consumption due to its large manufacturing base.
The Middle East & Africa and Latin America are also witnessing gradual growth. In the Middle East & Africa, urbanization and infrastructure development in countries like the UAE and South Africa are key drivers. In Latin America, Brazil and Mexico are leading the demand, supported by growth in the automotive and electronics industries.
Key Regions and Countries
North America
- The US
- Canada
- Rest of North America
Europe
- Germany
- France
- The UK
- Spain
- Netherlands
- Russia
- Italy
- Rest of Europe
Asia-Pacific
- China
- Japan
- Singapore
- Thailand
- South Korea
- Vietnam
- India
- New Zealand
- Rest of Asia Pacific
Latin America
- Mexico
- Brazil
- Rest of Latin America
Middle East & Africa
- Saudi Arabia
- South Africa
- UAE
- Rest of the Middle East & Africa
Key Players Analysis
In 2024, the global Non-Halogenated Flame Retardants (NHFR) market is witnessing significant contributions from key players, driven by stringent environmental regulations and rising demand for safer, sustainable fire protection solutions. Leading companies such as Albemarle Corporation, ICL, and Chemtura Corporation are at the forefront, leveraging their extensive R&D capabilities to innovate advanced NHFR solutions. Albemarle Corporation is focusing on expanding its portfolio through strategic acquisitions and collaborations, enhancing its market position.
ICL and Chemtura Corporation continue to invest in green chemistry, developing halogen-free flame retardants that meet global safety standards. Italmatch Chemicals S.p.A and Huber Engineered Materials are also pivotal, emphasizing high-performance materials tailored for automotive and electronics industries, where non-toxicity and efficiency are crucial.
Thor Group Ltd. and LANXESS AG are strengthening their competitive edge through diversification and technological advancements, ensuring a broad application spectrum for their products. DSM and FRX Innovations are notable for their contributions to polymer and resin industries, offering flame retardants that align with evolving material requirements.
Nabaltec AG and DuPont bring significant expertise in inorganic flame retardants, emphasizing eco-friendly and durable solutions suitable for construction and textiles. Collectively, these companies are driving the NHFR market's growth by prioritizing sustainability, regulatory compliance, and innovative product development, thus shaping a safer and more sustainable future.
Market Key Players
- Albemarle Corporation
- ICL
- Chemtura Corporation
- Clariant AG
- Italmatch Chemicals S.p.A
- Huber Engineered Materials
- Thor Group Ltd.
- LANXESS AG
- DSM
- FRX Innovations
- Nabaltec AG
- DuPont
Recent Development
- In April 2024, BASF, a leading chemical company, entered into a strategic partnership with Shanghai E-Giant Chemical Co., Ltd. This collaboration aims to enhance the development and commercialization of advanced non-halogenated flame retardants. The partnership focuses on leveraging BASF's innovative chemical processes with E-Giant's market reach in Asia, driving sustainable solutions in flame retardancy.
- In March 2024, Clariant, a global specialty chemicals company, expanded its EcoTain® product range with new non-halogenated flame retardants designed for the electronics and automotive sectors. These products are formulated to provide high performance while adhering to stringent environmental regulations, reflecting Clariant’s commitment to sustainability and safety in material sciences.
- In February 2024, Dow Inc. launched a new line of non-halogenated flame retardants under the brand name "FlamePro". These products are specifically developed for use in construction materials and consumer electronics, offering enhanced fire resistance without the environmental concerns associated with halogenated compounds. This initiative is part of Dow's broader strategy to promote safer and more sustainable chemical solutions.
Report Scope
Report Features Description Market Value (2023) USD 5.8 Billion Forecast Revenue (2033) USD 8.2 Billion CAGR (2024-2032) 8.5% Base Year for Estimation 2023 Historic Period 2016-2023 Forecast Period 2024-2033 Report Coverage Revenue Forecast, Market Dynamics, COVID-19 Impact, Competitive Landscape, Recent Developments Segments Covered By Product (Aluminum Hydroxide, Magnesium Dihydroxide, Phosphorous Based, Others), By Application(Polyolefins, Epoxy Resins, UPE, PVC, ETP, Rubber, Styrenics, Other Applications), By End-use (Electrical & Electronics, Construction, Transportation, Others) Regional Analysis North America - The US, Canada, Rest of North America, Europe - Germany, France, The UK, Spain, Italy, Russia, Netherlands, Rest of Europe, Asia-Pacific - China, Japan, South Korea, India, New Zealand, Singapore, Thailand, Vietnam, Rest of Asia Pacific, Latin America - Brazil, Mexico, Rest of Latin America, Middle East & Africa - South Africa, Saudi Arabia, UAE, Rest of Middle East & Africa Competitive Landscape Albemarle Corporation, ICL, Chemtura Corporation,Clariant AG, Italmatch Chemicals S.p.A, Huber Engineered Materials, Thor Group Ltd., LANXESS AG, DSM, FRX Innovations, Nabaltec AG, DuPont Customization Scope Customization for segments, region/country-level will be provided. Moreover, additional customization can be done based on the requirements. Purchase Options We have three licenses to opt for Single User License, Multi-User License (Up to 5 Users), Corporate Use License (Unlimited User and Printable PDF) -
- 1. Executive Summary
- 1.1. Definition
- 1.2. Taxonomy
- 1.3. Research Scope
- 1.4. Key Analysis
- 1.5. Key Findings by Major Segments
- 1.6. Top strategies by Major Players
- 2. Global Non Halogenated Flame Retardants Market Overview
- 2.1. Non Halogenated Flame Retardants Market Dynamics
- 2.1.1. Drivers
- 2.1.2. Opportunities
- 2.1.3. Restraints
- 2.1.4. Challenges
- 2.2. Macro-economic Factors
- 2.3. Regulatory Framework
- 2.4. Market Investment Feasibility Index
- 2.5. PEST Analysis
- 2.6. PORTER’S Five Force Analysis
- 2.7. Drivers & Restraints Impact Analysis
- 2.8. Industry Chain Analysis
- 2.9. Cost Structure Analysis
- 2.10. Marketing Strategy
- 2.11. Russia-Ukraine War Impact Analysis
- 2.12. Opportunity Map Analysis
- 2.13. Market Competition Scenario Analysis
- 2.14. Product Life Cycle Analysis
- 2.15. Opportunity Orbits
- 2.16. Manufacturer Intensity Map
- 2.17. Major Companies sales by Value & Volume
- 2.1. Non Halogenated Flame Retardants Market Dynamics
- 3. Global Non Halogenated Flame Retardants Market Analysis, Opportunity and Forecast, 2016-2032
- 3.1. Global Non Halogenated Flame Retardants Market Analysis, 2016-2021
- 3.2. Global Non Halogenated Flame Retardants Market Opportunity and Forecast, 2023-2032
- 3.3. Global Non Halogenated Flame Retardants Market Analysis, Opportunity and Forecast, By Product , 2016-2032
- 3.3.1. Global Non Halogenated Flame Retardants Market Analysis by Product : Introduction
- 3.3.2. Market Size Absolute $ Opportunity Analysis and Forecast, By Product , 2016-2032
- 3.3.3. Aluminum Hydroxide
- 3.3.4. Magnesium Dihydroxide
- 3.3.5. Phosphorous Based
- 3.3.6. Others
- 3.4. Global Non Halogenated Flame Retardants Market Analysis, Opportunity and Forecast, By Application, 2016-2032
- 3.4.1. Global Non Halogenated Flame Retardants Market Analysis by Application: Introduction
- 3.4.2. Market Size Absolute $ Opportunity Analysis and Forecast, By Application, 2016-2032
- 3.4.3. Polyolefins
- 3.4.4. Epoxy Resins
- 3.4.5. UPE
- 3.4.6. PVC
- 3.4.7. ETP
- 3.4.8. Rubber
- 3.4.9. Styrenics
- 3.4.10. Other Applications
- 3.5. Global Non Halogenated Flame Retardants Market Analysis, Opportunity and Forecast, By End-use, 2016-2032
- 3.5.1. Global Non Halogenated Flame Retardants Market Analysis by End-use: Introduction
- 3.5.2. Market Size Absolute $ Opportunity Analysis and Forecast, By End-use, 2016-2032
- 3.5.3. Electrical & Electronics
- 3.5.4. Construction
- 3.5.5. Transportation
- 3.5.6. Others
- 4. North America Non Halogenated Flame Retardants Market Analysis, Opportunity and Forecast, 2016-2032
- 4.1. North America Non Halogenated Flame Retardants Market Analysis, 2016-2021
- 4.2. North America Non Halogenated Flame Retardants Market Opportunity and Forecast, 2023-2032
- 4.3. North America Non Halogenated Flame Retardants Market Analysis, Opportunity and Forecast, By Product , 2016-2032
- 4.3.1. North America Non Halogenated Flame Retardants Market Analysis by Product : Introduction
- 4.3.2. Market Size Absolute $ Opportunity Analysis and Forecast, By Product , 2016-2032
- 4.3.3. Aluminum Hydroxide
- 4.3.4. Magnesium Dihydroxide
- 4.3.5. Phosphorous Based
- 4.3.6. Others
- 4.4. North America Non Halogenated Flame Retardants Market Analysis, Opportunity and Forecast, By Application, 2016-2032
- 4.4.1. North America Non Halogenated Flame Retardants Market Analysis by Application: Introduction
- 4.4.2. Market Size Absolute $ Opportunity Analysis and Forecast, By Application, 2016-2032
- 4.4.3. Polyolefins
- 4.4.4. Epoxy Resins
- 4.4.5. UPE
- 4.4.6. PVC
- 4.4.7. ETP
- 4.4.8. Rubber
- 4.4.9. Styrenics
- 4.4.10. Other Applications
- 4.5. North America Non Halogenated Flame Retardants Market Analysis, Opportunity and Forecast, By End-use, 2016-2032
- 4.5.1. North America Non Halogenated Flame Retardants Market Analysis by End-use: Introduction
- 4.5.2. Market Size Absolute $ Opportunity Analysis and Forecast, By End-use, 2016-2032
- 4.5.3. Electrical & Electronics
- 4.5.4. Construction
- 4.5.5. Transportation
- 4.5.6. Others
- 4.6. North America Non Halogenated Flame Retardants Market Analysis, Opportunity and Forecast, By Country , 2016-2032
- 4.6.1. North America Non Halogenated Flame Retardants Market Analysis by Country : Introduction
- 4.6.2. Market Size Absolute $ Opportunity Analysis and Forecast, Country , 2016-2032
- 4.6.2.1. The US
- 4.6.2.2. Canada
- 4.6.2.3. Mexico
- 5. Western Europe Non Halogenated Flame Retardants Market Analysis, Opportunity and Forecast, 2016-2032
- 5.1. Western Europe Non Halogenated Flame Retardants Market Analysis, 2016-2021
- 5.2. Western Europe Non Halogenated Flame Retardants Market Opportunity and Forecast, 2023-2032
- 5.3. Western Europe Non Halogenated Flame Retardants Market Analysis, Opportunity and Forecast, By Product , 2016-2032
- 5.3.1. Western Europe Non Halogenated Flame Retardants Market Analysis by Product : Introduction
- 5.3.2. Market Size Absolute $ Opportunity Analysis and Forecast, By Product , 2016-2032
- 5.3.3. Aluminum Hydroxide
- 5.3.4. Magnesium Dihydroxide
- 5.3.5. Phosphorous Based
- 5.3.6. Others
- 5.4. Western Europe Non Halogenated Flame Retardants Market Analysis, Opportunity and Forecast, By Application, 2016-2032
- 5.4.1. Western Europe Non Halogenated Flame Retardants Market Analysis by Application: Introduction
- 5.4.2. Market Size Absolute $ Opportunity Analysis and Forecast, By Application, 2016-2032
- 5.4.3. Polyolefins
- 5.4.4. Epoxy Resins
- 5.4.5. UPE
- 5.4.6. PVC
- 5.4.7. ETP
- 5.4.8. Rubber
- 5.4.9. Styrenics
- 5.4.10. Other Applications
- 5.5. Western Europe Non Halogenated Flame Retardants Market Analysis, Opportunity and Forecast, By End-use, 2016-2032
- 5.5.1. Western Europe Non Halogenated Flame Retardants Market Analysis by End-use: Introduction
- 5.5.2. Market Size Absolute $ Opportunity Analysis and Forecast, By End-use, 2016-2032
- 5.5.3. Electrical & Electronics
- 5.5.4. Construction
- 5.5.5. Transportation
- 5.5.6. Others
- 5.6. Western Europe Non Halogenated Flame Retardants Market Analysis, Opportunity and Forecast, By Country , 2016-2032
- 5.6.1. Western Europe Non Halogenated Flame Retardants Market Analysis by Country : Introduction
- 5.6.2. Market Size Absolute $ Opportunity Analysis and Forecast, Country , 2016-2032
- 5.6.2.1. Germany
- 5.6.2.2. France
- 5.6.2.3. The UK
- 5.6.2.4. Spain
- 5.6.2.5. Italy
- 5.6.2.6. Portugal
- 5.6.2.7. Ireland
- 5.6.2.8. Austria
- 5.6.2.9. Switzerland
- 5.6.2.10. Benelux
- 5.6.2.11. Nordic
- 5.6.2.12. Rest of Western Europe
- 6. Eastern Europe Non Halogenated Flame Retardants Market Analysis, Opportunity and Forecast, 2016-2032
- 6.1. Eastern Europe Non Halogenated Flame Retardants Market Analysis, 2016-2021
- 6.2. Eastern Europe Non Halogenated Flame Retardants Market Opportunity and Forecast, 2023-2032
- 6.3. Eastern Europe Non Halogenated Flame Retardants Market Analysis, Opportunity and Forecast, By Product , 2016-2032
- 6.3.1. Eastern Europe Non Halogenated Flame Retardants Market Analysis by Product : Introduction
- 6.3.2. Market Size Absolute $ Opportunity Analysis and Forecast, By Product , 2016-2032
- 6.3.3. Aluminum Hydroxide
- 6.3.4. Magnesium Dihydroxide
- 6.3.5. Phosphorous Based
- 6.3.6. Others
- 6.4. Eastern Europe Non Halogenated Flame Retardants Market Analysis, Opportunity and Forecast, By Application, 2016-2032
- 6.4.1. Eastern Europe Non Halogenated Flame Retardants Market Analysis by Application: Introduction
- 6.4.2. Market Size Absolute $ Opportunity Analysis and Forecast, By Application, 2016-2032
- 6.4.3. Polyolefins
- 6.4.4. Epoxy Resins
- 6.4.5. UPE
- 6.4.6. PVC
- 6.4.7. ETP
- 6.4.8. Rubber
- 6.4.9. Styrenics
- 6.4.10. Other Applications
- 6.5. Eastern Europe Non Halogenated Flame Retardants Market Analysis, Opportunity and Forecast, By End-use, 2016-2032
- 6.5.1. Eastern Europe Non Halogenated Flame Retardants Market Analysis by End-use: Introduction
- 6.5.2. Market Size Absolute $ Opportunity Analysis and Forecast, By End-use, 2016-2032
- 6.5.3. Electrical & Electronics
- 6.5.4. Construction
- 6.5.5. Transportation
- 6.5.6. Others
- 6.6. Eastern Europe Non Halogenated Flame Retardants Market Analysis, Opportunity and Forecast, By Country , 2016-2032
- 6.6.1. Eastern Europe Non Halogenated Flame Retardants Market Analysis by Country : Introduction
- 6.6.2. Market Size Absolute $ Opportunity Analysis and Forecast, Country , 2016-2032
- 6.6.2.1. Russia
- 6.6.2.2. Poland
- 6.6.2.3. The Czech Republic
- 6.6.2.4. Greece
- 6.6.2.5. Rest of Eastern Europe
- 7. APAC Non Halogenated Flame Retardants Market Analysis, Opportunity and Forecast, 2016-2032
- 7.1. APAC Non Halogenated Flame Retardants Market Analysis, 2016-2021
- 7.2. APAC Non Halogenated Flame Retardants Market Opportunity and Forecast, 2023-2032
- 7.3. APAC Non Halogenated Flame Retardants Market Analysis, Opportunity and Forecast, By Product , 2016-2032
- 7.3.1. APAC Non Halogenated Flame Retardants Market Analysis by Product : Introduction
- 7.3.2. Market Size Absolute $ Opportunity Analysis and Forecast, By Product , 2016-2032
- 7.3.3. Aluminum Hydroxide
- 7.3.4. Magnesium Dihydroxide
- 7.3.5. Phosphorous Based
- 7.3.6. Others
- 7.4. APAC Non Halogenated Flame Retardants Market Analysis, Opportunity and Forecast, By Application, 2016-2032
- 7.4.1. APAC Non Halogenated Flame Retardants Market Analysis by Application: Introduction
- 7.4.2. Market Size Absolute $ Opportunity Analysis and Forecast, By Application, 2016-2032
- 7.4.3. Polyolefins
- 7.4.4. Epoxy Resins
- 7.4.5. UPE
- 7.4.6. PVC
- 7.4.7. ETP
- 7.4.8. Rubber
- 7.4.9. Styrenics
- 7.4.10. Other Applications
- 7.5. APAC Non Halogenated Flame Retardants Market Analysis, Opportunity and Forecast, By End-use, 2016-2032
- 7.5.1. APAC Non Halogenated Flame Retardants Market Analysis by End-use: Introduction
- 7.5.2. Market Size Absolute $ Opportunity Analysis and Forecast, By End-use, 2016-2032
- 7.5.3. Electrical & Electronics
- 7.5.4. Construction
- 7.5.5. Transportation
- 7.5.6. Others
- 7.6. APAC Non Halogenated Flame Retardants Market Analysis, Opportunity and Forecast, By Country , 2016-2032
- 7.6.1. APAC Non Halogenated Flame Retardants Market Analysis by Country : Introduction
- 7.6.2. Market Size Absolute $ Opportunity Analysis and Forecast, Country , 2016-2032
- 7.6.2.1. China
- 7.6.2.2. Japan
- 7.6.2.3. South Korea
- 7.6.2.4. India
- 7.6.2.5. Australia & New Zeland
- 7.6.2.6. Indonesia
- 7.6.2.7. Malaysia
- 7.6.2.8. Philippines
- 7.6.2.9. Singapore
- 7.6.2.10. Thailand
- 7.6.2.11. Vietnam
- 7.6.2.12. Rest of APAC
- 8. Latin America Non Halogenated Flame Retardants Market Analysis, Opportunity and Forecast, 2016-2032
- 8.1. Latin America Non Halogenated Flame Retardants Market Analysis, 2016-2021
- 8.2. Latin America Non Halogenated Flame Retardants Market Opportunity and Forecast, 2023-2032
- 8.3. Latin America Non Halogenated Flame Retardants Market Analysis, Opportunity and Forecast, By Product , 2016-2032
- 8.3.1. Latin America Non Halogenated Flame Retardants Market Analysis by Product : Introduction
- 8.3.2. Market Size Absolute $ Opportunity Analysis and Forecast, By Product , 2016-2032
- 8.3.3. Aluminum Hydroxide
- 8.3.4. Magnesium Dihydroxide
- 8.3.5. Phosphorous Based
- 8.3.6. Others
- 8.4. Latin America Non Halogenated Flame Retardants Market Analysis, Opportunity and Forecast, By Application, 2016-2032
- 8.4.1. Latin America Non Halogenated Flame Retardants Market Analysis by Application: Introduction
- 8.4.2. Market Size Absolute $ Opportunity Analysis and Forecast, By Application, 2016-2032
- 8.4.3. Polyolefins
- 8.4.4. Epoxy Resins
- 8.4.5. UPE
- 8.4.6. PVC
- 8.4.7. ETP
- 8.4.8. Rubber
- 8.4.9. Styrenics
- 8.4.10. Other Applications
- 8.5. Latin America Non Halogenated Flame Retardants Market Analysis, Opportunity and Forecast, By End-use, 2016-2032
- 8.5.1. Latin America Non Halogenated Flame Retardants Market Analysis by End-use: Introduction
- 8.5.2. Market Size Absolute $ Opportunity Analysis and Forecast, By End-use, 2016-2032
- 8.5.3. Electrical & Electronics
- 8.5.4. Construction
- 8.5.5. Transportation
- 8.5.6. Others
- 8.6. Latin America Non Halogenated Flame Retardants Market Analysis, Opportunity and Forecast, By Country , 2016-2032
- 8.6.1. Latin America Non Halogenated Flame Retardants Market Analysis by Country : Introduction
- 8.6.2. Market Size Absolute $ Opportunity Analysis and Forecast, Country , 2016-2032
- 8.6.2.1. Brazil
- 8.6.2.2. Colombia
- 8.6.2.3. Chile
- 8.6.2.4. Argentina
- 8.6.2.5. Costa Rica
- 8.6.2.6. Rest of Latin America
- 9. Middle East & Africa Non Halogenated Flame Retardants Market Analysis, Opportunity and Forecast, 2016-2032
- 9.1. Middle East & Africa Non Halogenated Flame Retardants Market Analysis, 2016-2021
- 9.2. Middle East & Africa Non Halogenated Flame Retardants Market Opportunity and Forecast, 2023-2032
- 9.3. Middle East & Africa Non Halogenated Flame Retardants Market Analysis, Opportunity and Forecast, By Product , 2016-2032
- 9.3.1. Middle East & Africa Non Halogenated Flame Retardants Market Analysis by Product : Introduction
- 9.3.2. Market Size Absolute $ Opportunity Analysis and Forecast, By Product , 2016-2032
- 9.3.3. Aluminum Hydroxide
- 9.3.4. Magnesium Dihydroxide
- 9.3.5. Phosphorous Based
- 9.3.6. Others
- 9.4. Middle East & Africa Non Halogenated Flame Retardants Market Analysis, Opportunity and Forecast, By Application, 2016-2032
- 9.4.1. Middle East & Africa Non Halogenated Flame Retardants Market Analysis by Application: Introduction
- 9.4.2. Market Size Absolute $ Opportunity Analysis and Forecast, By Application, 2016-2032
- 9.4.3. Polyolefins
- 9.4.4. Epoxy Resins
- 9.4.5. UPE
- 9.4.6. PVC
- 9.4.7. ETP
- 9.4.8. Rubber
- 9.4.9. Styrenics
- 9.4.10. Other Applications
- 9.5. Middle East & Africa Non Halogenated Flame Retardants Market Analysis, Opportunity and Forecast, By End-use, 2016-2032
- 9.5.1. Middle East & Africa Non Halogenated Flame Retardants Market Analysis by End-use: Introduction
- 9.5.2. Market Size Absolute $ Opportunity Analysis and Forecast, By End-use, 2016-2032
- 9.5.3. Electrical & Electronics
- 9.5.4. Construction
- 9.5.5. Transportation
- 9.5.6. Others
- 9.6. Middle East & Africa Non Halogenated Flame Retardants Market Analysis, Opportunity and Forecast, By Country , 2016-2032
- 9.6.1. Middle East & Africa Non Halogenated Flame Retardants Market Analysis by Country : Introduction
- 9.6.2. Market Size Absolute $ Opportunity Analysis and Forecast, Country , 2016-2032
- 9.6.2.1. Algeria
- 9.6.2.2. Egypt
- 9.6.2.3. Israel
- 9.6.2.4. Kuwait
- 9.6.2.5. Nigeria
- 9.6.2.6. Saudi Arabia
- 9.6.2.7. South Africa
- 9.6.2.8. Turkey
- 9.6.2.9. The UAE
- 9.6.2.10. Rest of MEA
- 10. Global Non Halogenated Flame Retardants Market Analysis, Opportunity and Forecast, By Region , 2016-2032
- 10.1. Global Non Halogenated Flame Retardants Market Analysis by Region : Introduction
- 10.2. Market Size Absolute $ Opportunity Analysis and Forecast, By Region , 2016-2032
- 10.2.1. North America
- 10.2.2. Western Europe
- 10.2.3. Eastern Europe
- 10.2.4. APAC
- 10.2.5. Latin America
- 10.2.6. Middle East & Africa
- 11. Global Non Halogenated Flame Retardants Market Competitive Landscape, Market Share Analysis, and Company Profiles
- 11.1. Market Share Analysis
- 11.2. Company Profiles
- 11.3. Albemarle Corporation
- 11.3.1. Company Overview
- 11.3.2. Financial Highlights
- 11.3.3. Product Portfolio
- 11.3.4. SWOT Analysis
- 11.3.5. Key Strategies and Developments
- 11.4. ICL
- 11.4.1. Company Overview
- 11.4.2. Financial Highlights
- 11.4.3. Product Portfolio
- 11.4.4. SWOT Analysis
- 11.4.5. Key Strategies and Developments
- 11.5. Chemtura Corporation
- 11.5.1. Company Overview
- 11.5.2. Financial Highlights
- 11.5.3. Product Portfolio
- 11.5.4. SWOT Analysis
- 11.5.5. Key Strategies and Developments
- 11.6. CLARIANT
- 11.6.1. Company Overview
- 11.6.2. Financial Highlights
- 11.6.3. Product Portfolio
- 11.6.4. SWOT Analysis
- 11.6.5. Key Strategies and Developments
- 11.7. Italmatch Chemicals S.p.A
- 11.7.1. Company Overview
- 11.7.2. Financial Highlights
- 11.7.3. Product Portfolio
- 11.7.4. SWOT Analysis
- 11.7.5. Key Strategies and Developments
- 11.8. Huber Engineered Materials
- 11.8.1. Company Overview
- 11.8.2. Financial Highlights
- 11.8.3. Product Portfolio
- 11.8.4. SWOT Analysis
- 11.8.5. Key Strategies and Developments
- 11.9. THOR
- 11.9.1. Company Overview
- 11.9.2. Financial Highlights
- 11.9.3. Product Portfolio
- 11.9.4. SWOT Analysis
- 11.9.5. Key Strategies and Developments
- 11.10. LANXESS
- 11.10.1. Company Overview
- 11.10.2. Financial Highlights
- 11.10.3. Product Portfolio
- 11.10.4. SWOT Analysis
- 11.10.5. Key Strategies and Developments
- 11.11. DSM
- 11.11.1. Company Overview
- 11.11.2. Financial Highlights
- 11.11.3. Product Portfolio
- 11.11.4. SWOT Analysis
- 11.11.5. Key Strategies and Developments
- 11.12. FRX Innovations
- 11.12.1. Company Overview
- 11.12.2. Financial Highlights
- 11.12.3. Product Portfolio
- 11.12.4. SWOT Analysis
- 11.12.5. Key Strategies and Developments
- 11.13.1. Company Overview
- 11.13.2. Financial Highlights
- 11.13.3. Product Portfolio
- 11.13.4. SWOT Analysis
- 11.13.5. Key Strategies and Developments
- 11.14. Nabaltec AG
- 11.14.1. Company Overview
- 11.14.2. Financial Highlights
- 11.14.3. Product Portfolio
- 11.14.4. SWOT Analysis
- 11.14.5. Key Strategies and Developments
- 12. Assumptions and Acronyms
- 13. Research Methodology
- 14. Contact
"
- List of Figures
- "
- Figure 1: Global Non Halogenated Flame Retardants Market Revenue (US$ Mn) Market Share by Product in 2022
- Figure 2: Global Non Halogenated Flame Retardants Market Market Attractiveness Analysis by Product , 2016-2032
- Figure 3: Global Non Halogenated Flame Retardants Market Revenue (US$ Mn) Market Share by Applicationin 2022
- Figure 4: Global Non Halogenated Flame Retardants Market Market Attractiveness Analysis by Application, 2016-2032
- Figure 5: Global Non Halogenated Flame Retardants Market Revenue (US$ Mn) Market Share by End-usein 2022
- Figure 6: Global Non Halogenated Flame Retardants Market Market Attractiveness Analysis by End-use, 2016-2032
- Figure 7: Global Non Halogenated Flame Retardants Market Revenue (US$ Mn) Market Share by Region in 2022
- Figure 8: Global Non Halogenated Flame Retardants Market Market Attractiveness Analysis by Region, 2016-2032
- Figure 9: Global Non Halogenated Flame Retardants Market Market Revenue (US$ Mn) (2016-2032)
- Figure 10: Global Non Halogenated Flame Retardants Market Market Revenue (US$ Mn) Comparison by Region (2016-2032)
- Figure 11: Global Non Halogenated Flame Retardants Market Market Revenue (US$ Mn) Comparison by Product (2016-2032)
- Figure 12: Global Non Halogenated Flame Retardants Market Market Revenue (US$ Mn) Comparison by Application (2016-2032)
- Figure 13: Global Non Halogenated Flame Retardants Market Market Revenue (US$ Mn) Comparison by End-use (2016-2032)
- Figure 14: Global Non Halogenated Flame Retardants Market Market Y-o-Y Growth Rate Comparison by Region (2016-2032)
- Figure 15: Global Non Halogenated Flame Retardants Market Market Y-o-Y Growth Rate Comparison by Product (2016-2032)
- Figure 16: Global Non Halogenated Flame Retardants Market Market Y-o-Y Growth Rate Comparison by Application (2016-2032)
- Figure 17: Global Non Halogenated Flame Retardants Market Market Y-o-Y Growth Rate Comparison by End-use (2016-2032)
- Figure 18: Global Non Halogenated Flame Retardants Market Market Share Comparison by Region (2016-2032)
- Figure 19: Global Non Halogenated Flame Retardants Market Market Share Comparison by Product (2016-2032)
- Figure 20: Global Non Halogenated Flame Retardants Market Market Share Comparison by Application (2016-2032)
- Figure 21: Global Non Halogenated Flame Retardants Market Market Share Comparison by End-use (2016-2032)
- Figure 22: North America Non Halogenated Flame Retardants Market Revenue (US$ Mn) Market Share by Product in 2022
- Figure 23: North America Non Halogenated Flame Retardants Market Market Attractiveness Analysis by Product , 2016-2032
- Figure 24: North America Non Halogenated Flame Retardants Market Revenue (US$ Mn) Market Share by Applicationin 2022
- Figure 25: North America Non Halogenated Flame Retardants Market Market Attractiveness Analysis by Application, 2016-2032
- Figure 26: North America Non Halogenated Flame Retardants Market Revenue (US$ Mn) Market Share by End-usein 2022
- Figure 27: North America Non Halogenated Flame Retardants Market Market Attractiveness Analysis by End-use, 2016-2032
- Figure 28: North America Non Halogenated Flame Retardants Market Revenue (US$ Mn) Market Share by Country in 2022
- Figure 29: North America Non Halogenated Flame Retardants Market Market Attractiveness Analysis by Country, 2016-2032
- Figure 30: North America Non Halogenated Flame Retardants Market Market Revenue (US$ Mn) (2016-2032)
- Figure 31: North America Non Halogenated Flame Retardants Market Market Revenue (US$ Mn) Comparison by Country (2016-2032)
- Figure 32: North America Non Halogenated Flame Retardants Market Market Revenue (US$ Mn) Comparison by Product (2016-2032)
- Figure 33: North America Non Halogenated Flame Retardants Market Market Revenue (US$ Mn) Comparison by Application (2016-2032)
- Figure 34: North America Non Halogenated Flame Retardants Market Market Revenue (US$ Mn) Comparison by End-use (2016-2032)
- Figure 35: North America Non Halogenated Flame Retardants Market Market Y-o-Y Growth Rate Comparison by Country (2016-2032)
- Figure 36: North America Non Halogenated Flame Retardants Market Market Y-o-Y Growth Rate Comparison by Product (2016-2032)
- Figure 37: North America Non Halogenated Flame Retardants Market Market Y-o-Y Growth Rate Comparison by Application (2016-2032)
- Figure 38: North America Non Halogenated Flame Retardants Market Market Y-o-Y Growth Rate Comparison by End-use (2016-2032)
- Figure 39: North America Non Halogenated Flame Retardants Market Market Share Comparison by Country (2016-2032)
- Figure 40: North America Non Halogenated Flame Retardants Market Market Share Comparison by Product (2016-2032)
- Figure 41: North America Non Halogenated Flame Retardants Market Market Share Comparison by Application (2016-2032)
- Figure 42: North America Non Halogenated Flame Retardants Market Market Share Comparison by End-use (2016-2032)
- Figure 43: Western Europe Non Halogenated Flame Retardants Market Revenue (US$ Mn) Market Share by Product in 2022
- Figure 44: Western Europe Non Halogenated Flame Retardants Market Market Attractiveness Analysis by Product , 2016-2032
- Figure 45: Western Europe Non Halogenated Flame Retardants Market Revenue (US$ Mn) Market Share by Applicationin 2022
- Figure 46: Western Europe Non Halogenated Flame Retardants Market Market Attractiveness Analysis by Application, 2016-2032
- Figure 47: Western Europe Non Halogenated Flame Retardants Market Revenue (US$ Mn) Market Share by End-usein 2022
- Figure 48: Western Europe Non Halogenated Flame Retardants Market Market Attractiveness Analysis by End-use, 2016-2032
- Figure 49: Western Europe Non Halogenated Flame Retardants Market Revenue (US$ Mn) Market Share by Country in 2022
- Figure 50: Western Europe Non Halogenated Flame Retardants Market Market Attractiveness Analysis by Country, 2016-2032
- Figure 51: Western Europe Non Halogenated Flame Retardants Market Market Revenue (US$ Mn) (2016-2032)
- Figure 52: Western Europe Non Halogenated Flame Retardants Market Market Revenue (US$ Mn) Comparison by Country (2016-2032)
- Figure 53: Western Europe Non Halogenated Flame Retardants Market Market Revenue (US$ Mn) Comparison by Product (2016-2032)
- Figure 54: Western Europe Non Halogenated Flame Retardants Market Market Revenue (US$ Mn) Comparison by Application (2016-2032)
- Figure 55: Western Europe Non Halogenated Flame Retardants Market Market Revenue (US$ Mn) Comparison by End-use (2016-2032)
- Figure 56: Western Europe Non Halogenated Flame Retardants Market Market Y-o-Y Growth Rate Comparison by Country (2016-2032)
- Figure 57: Western Europe Non Halogenated Flame Retardants Market Market Y-o-Y Growth Rate Comparison by Product (2016-2032)
- Figure 58: Western Europe Non Halogenated Flame Retardants Market Market Y-o-Y Growth Rate Comparison by Application (2016-2032)
- Figure 59: Western Europe Non Halogenated Flame Retardants Market Market Y-o-Y Growth Rate Comparison by End-use (2016-2032)
- Figure 60: Western Europe Non Halogenated Flame Retardants Market Market Share Comparison by Country (2016-2032)
- Figure 61: Western Europe Non Halogenated Flame Retardants Market Market Share Comparison by Product (2016-2032)
- Figure 62: Western Europe Non Halogenated Flame Retardants Market Market Share Comparison by Application (2016-2032)
- Figure 63: Western Europe Non Halogenated Flame Retardants Market Market Share Comparison by End-use (2016-2032)
- Figure 64: Eastern Europe Non Halogenated Flame Retardants Market Revenue (US$ Mn) Market Share by Product in 2022
- Figure 65: Eastern Europe Non Halogenated Flame Retardants Market Market Attractiveness Analysis by Product , 2016-2032
- Figure 66: Eastern Europe Non Halogenated Flame Retardants Market Revenue (US$ Mn) Market Share by Applicationin 2022
- Figure 67: Eastern Europe Non Halogenated Flame Retardants Market Market Attractiveness Analysis by Application, 2016-2032
- Figure 68: Eastern Europe Non Halogenated Flame Retardants Market Revenue (US$ Mn) Market Share by End-usein 2022
- Figure 69: Eastern Europe Non Halogenated Flame Retardants Market Market Attractiveness Analysis by End-use, 2016-2032
- Figure 70: Eastern Europe Non Halogenated Flame Retardants Market Revenue (US$ Mn) Market Share by Country in 2022
- Figure 71: Eastern Europe Non Halogenated Flame Retardants Market Market Attractiveness Analysis by Country, 2016-2032
- Figure 72: Eastern Europe Non Halogenated Flame Retardants Market Market Revenue (US$ Mn) (2016-2032)
- Figure 73: Eastern Europe Non Halogenated Flame Retardants Market Market Revenue (US$ Mn) Comparison by Country (2016-2032)
- Figure 74: Eastern Europe Non Halogenated Flame Retardants Market Market Revenue (US$ Mn) Comparison by Product (2016-2032)
- Figure 75: Eastern Europe Non Halogenated Flame Retardants Market Market Revenue (US$ Mn) Comparison by Application (2016-2032)
- Figure 76: Eastern Europe Non Halogenated Flame Retardants Market Market Revenue (US$ Mn) Comparison by End-use (2016-2032)
- Figure 77: Eastern Europe Non Halogenated Flame Retardants Market Market Y-o-Y Growth Rate Comparison by Country (2016-2032)
- Figure 78: Eastern Europe Non Halogenated Flame Retardants Market Market Y-o-Y Growth Rate Comparison by Product (2016-2032)
- Figure 79: Eastern Europe Non Halogenated Flame Retardants Market Market Y-o-Y Growth Rate Comparison by Application (2016-2032)
- Figure 80: Eastern Europe Non Halogenated Flame Retardants Market Market Y-o-Y Growth Rate Comparison by End-use (2016-2032)
- Figure 81: Eastern Europe Non Halogenated Flame Retardants Market Market Share Comparison by Country (2016-2032)
- Figure 82: Eastern Europe Non Halogenated Flame Retardants Market Market Share Comparison by Product (2016-2032)
- Figure 83: Eastern Europe Non Halogenated Flame Retardants Market Market Share Comparison by Application (2016-2032)
- Figure 84: Eastern Europe Non Halogenated Flame Retardants Market Market Share Comparison by End-use (2016-2032)
- Figure 85: APAC Non Halogenated Flame Retardants Market Revenue (US$ Mn) Market Share by Product in 2022
- Figure 86: APAC Non Halogenated Flame Retardants Market Market Attractiveness Analysis by Product , 2016-2032
- Figure 87: APAC Non Halogenated Flame Retardants Market Revenue (US$ Mn) Market Share by Applicationin 2022
- Figure 88: APAC Non Halogenated Flame Retardants Market Market Attractiveness Analysis by Application, 2016-2032
- Figure 89: APAC Non Halogenated Flame Retardants Market Revenue (US$ Mn) Market Share by End-usein 2022
- Figure 90: APAC Non Halogenated Flame Retardants Market Market Attractiveness Analysis by End-use, 2016-2032
- Figure 91: APAC Non Halogenated Flame Retardants Market Revenue (US$ Mn) Market Share by Country in 2022
- Figure 92: APAC Non Halogenated Flame Retardants Market Market Attractiveness Analysis by Country, 2016-2032
- Figure 93: APAC Non Halogenated Flame Retardants Market Market Revenue (US$ Mn) (2016-2032)
- Figure 94: APAC Non Halogenated Flame Retardants Market Market Revenue (US$ Mn) Comparison by Country (2016-2032)
- Figure 95: APAC Non Halogenated Flame Retardants Market Market Revenue (US$ Mn) Comparison by Product (2016-2032)
- Figure 96: APAC Non Halogenated Flame Retardants Market Market Revenue (US$ Mn) Comparison by Application (2016-2032)
- Figure 97: APAC Non Halogenated Flame Retardants Market Market Revenue (US$ Mn) Comparison by End-use (2016-2032)
- Figure 98: APAC Non Halogenated Flame Retardants Market Market Y-o-Y Growth Rate Comparison by Country (2016-2032)
- Figure 99: APAC Non Halogenated Flame Retardants Market Market Y-o-Y Growth Rate Comparison by Product (2016-2032)
- Figure 100: APAC Non Halogenated Flame Retardants Market Market Y-o-Y Growth Rate Comparison by Application (2016-2032)
- Figure 101: APAC Non Halogenated Flame Retardants Market Market Y-o-Y Growth Rate Comparison by End-use (2016-2032)
- Figure 102: APAC Non Halogenated Flame Retardants Market Market Share Comparison by Country (2016-2032)
- Figure 103: APAC Non Halogenated Flame Retardants Market Market Share Comparison by Product (2016-2032)
- Figure 104: APAC Non Halogenated Flame Retardants Market Market Share Comparison by Application (2016-2032)
- Figure 105: APAC Non Halogenated Flame Retardants Market Market Share Comparison by End-use (2016-2032)
- Figure 106: Latin America Non Halogenated Flame Retardants Market Revenue (US$ Mn) Market Share by Product in 2022
- Figure 107: Latin America Non Halogenated Flame Retardants Market Market Attractiveness Analysis by Product , 2016-2032
- Figure 108: Latin America Non Halogenated Flame Retardants Market Revenue (US$ Mn) Market Share by Applicationin 2022
- Figure 109: Latin America Non Halogenated Flame Retardants Market Market Attractiveness Analysis by Application, 2016-2032
- Figure 110: Latin America Non Halogenated Flame Retardants Market Revenue (US$ Mn) Market Share by End-usein 2022
- Figure 111: Latin America Non Halogenated Flame Retardants Market Market Attractiveness Analysis by End-use, 2016-2032
- Figure 112: Latin America Non Halogenated Flame Retardants Market Revenue (US$ Mn) Market Share by Country in 2022
- Figure 113: Latin America Non Halogenated Flame Retardants Market Market Attractiveness Analysis by Country, 2016-2032
- Figure 114: Latin America Non Halogenated Flame Retardants Market Market Revenue (US$ Mn) (2016-2032)
- Figure 115: Latin America Non Halogenated Flame Retardants Market Market Revenue (US$ Mn) Comparison by Country (2016-2032)
- Figure 116: Latin America Non Halogenated Flame Retardants Market Market Revenue (US$ Mn) Comparison by Product (2016-2032)
- Figure 117: Latin America Non Halogenated Flame Retardants Market Market Revenue (US$ Mn) Comparison by Application (2016-2032)
- Figure 118: Latin America Non Halogenated Flame Retardants Market Market Revenue (US$ Mn) Comparison by End-use (2016-2032)
- Figure 119: Latin America Non Halogenated Flame Retardants Market Market Y-o-Y Growth Rate Comparison by Country (2016-2032)
- Figure 120: Latin America Non Halogenated Flame Retardants Market Market Y-o-Y Growth Rate Comparison by Product (2016-2032)
- Figure 121: Latin America Non Halogenated Flame Retardants Market Market Y-o-Y Growth Rate Comparison by Application (2016-2032)
- Figure 122: Latin America Non Halogenated Flame Retardants Market Market Y-o-Y Growth Rate Comparison by End-use (2016-2032)
- Figure 123: Latin America Non Halogenated Flame Retardants Market Market Share Comparison by Country (2016-2032)
- Figure 124: Latin America Non Halogenated Flame Retardants Market Market Share Comparison by Product (2016-2032)
- Figure 125: Latin America Non Halogenated Flame Retardants Market Market Share Comparison by Application (2016-2032)
- Figure 126: Latin America Non Halogenated Flame Retardants Market Market Share Comparison by End-use (2016-2032)
- Figure 127: Middle East & Africa Non Halogenated Flame Retardants Market Revenue (US$ Mn) Market Share by Product in 2022
- Figure 128: Middle East & Africa Non Halogenated Flame Retardants Market Market Attractiveness Analysis by Product , 2016-2032
- Figure 129: Middle East & Africa Non Halogenated Flame Retardants Market Revenue (US$ Mn) Market Share by Applicationin 2022
- Figure 130: Middle East & Africa Non Halogenated Flame Retardants Market Market Attractiveness Analysis by Application, 2016-2032
- Figure 131: Middle East & Africa Non Halogenated Flame Retardants Market Revenue (US$ Mn) Market Share by End-usein 2022
- Figure 132: Middle East & Africa Non Halogenated Flame Retardants Market Market Attractiveness Analysis by End-use, 2016-2032
- Figure 133: Middle East & Africa Non Halogenated Flame Retardants Market Revenue (US$ Mn) Market Share by Country in 2022
- Figure 134: Middle East & Africa Non Halogenated Flame Retardants Market Market Attractiveness Analysis by Country, 2016-2032
- Figure 135: Middle East & Africa Non Halogenated Flame Retardants Market Market Revenue (US$ Mn) (2016-2032)
- Figure 136: Middle East & Africa Non Halogenated Flame Retardants Market Market Revenue (US$ Mn) Comparison by Country (2016-2032)
- Figure 137: Middle East & Africa Non Halogenated Flame Retardants Market Market Revenue (US$ Mn) Comparison by Product (2016-2032)
- Figure 138: Middle East & Africa Non Halogenated Flame Retardants Market Market Revenue (US$ Mn) Comparison by Application (2016-2032)
- Figure 139: Middle East & Africa Non Halogenated Flame Retardants Market Market Revenue (US$ Mn) Comparison by End-use (2016-2032)
- Figure 140: Middle East & Africa Non Halogenated Flame Retardants Market Market Y-o-Y Growth Rate Comparison by Country (2016-2032)
- Figure 141: Middle East & Africa Non Halogenated Flame Retardants Market Market Y-o-Y Growth Rate Comparison by Product (2016-2032)
- Figure 142: Middle East & Africa Non Halogenated Flame Retardants Market Market Y-o-Y Growth Rate Comparison by Application (2016-2032)
- Figure 143: Middle East & Africa Non Halogenated Flame Retardants Market Market Y-o-Y Growth Rate Comparison by End-use (2016-2032)
- Figure 144: Middle East & Africa Non Halogenated Flame Retardants Market Market Share Comparison by Country (2016-2032)
- Figure 145: Middle East & Africa Non Halogenated Flame Retardants Market Market Share Comparison by Product (2016-2032)
- Figure 146: Middle East & Africa Non Halogenated Flame Retardants Market Market Share Comparison by Application (2016-2032)
- Figure 147: Middle East & Africa Non Halogenated Flame Retardants Market Market Share Comparison by End-use (2016-2032)
"
- List of Tables
- "
- Table 1: Global Non Halogenated Flame Retardants Market Market Comparison by Product (2016-2032)
- Table 2: Global Non Halogenated Flame Retardants Market Market Comparison by Application (2016-2032)
- Table 3: Global Non Halogenated Flame Retardants Market Market Comparison by End-use (2016-2032)
- Table 4: Global Non Halogenated Flame Retardants Market Revenue (US$ Mn) Comparison by Region (2016-2032)
- Table 5: Global Non Halogenated Flame Retardants Market Market Revenue (US$ Mn) (2016-2032)
- Table 6: Global Non Halogenated Flame Retardants Market Market Revenue (US$ Mn) Comparison by Region (2016-2032)
- Table 7: Global Non Halogenated Flame Retardants Market Market Revenue (US$ Mn) Comparison by Product (2016-2032)
- Table 8: Global Non Halogenated Flame Retardants Market Market Revenue (US$ Mn) Comparison by Application (2016-2032)
- Table 9: Global Non Halogenated Flame Retardants Market Market Revenue (US$ Mn) Comparison by End-use (2016-2032)
- Table 10: Global Non Halogenated Flame Retardants Market Market Y-o-Y Growth Rate Comparison by Region (2016-2032)
- Table 11: Global Non Halogenated Flame Retardants Market Market Y-o-Y Growth Rate Comparison by Product (2016-2032)
- Table 12: Global Non Halogenated Flame Retardants Market Market Y-o-Y Growth Rate Comparison by Application (2016-2032)
- Table 13: Global Non Halogenated Flame Retardants Market Market Y-o-Y Growth Rate Comparison by End-use (2016-2032)
- Table 14: Global Non Halogenated Flame Retardants Market Market Share Comparison by Region (2016-2032)
- Table 15: Global Non Halogenated Flame Retardants Market Market Share Comparison by Product (2016-2032)
- Table 16: Global Non Halogenated Flame Retardants Market Market Share Comparison by Application (2016-2032)
- Table 17: Global Non Halogenated Flame Retardants Market Market Share Comparison by End-use (2016-2032)
- Table 18: North America Non Halogenated Flame Retardants Market Market Comparison by Application (2016-2032)
- Table 19: North America Non Halogenated Flame Retardants Market Market Comparison by End-use (2016-2032)
- Table 20: North America Non Halogenated Flame Retardants Market Revenue (US$ Mn) Comparison by Country (2016-2032)
- Table 21: North America Non Halogenated Flame Retardants Market Market Revenue (US$ Mn) (2016-2032)
- Table 22: North America Non Halogenated Flame Retardants Market Market Revenue (US$ Mn) Comparison by Country (2016-2032)
- Table 23: North America Non Halogenated Flame Retardants Market Market Revenue (US$ Mn) Comparison by Product (2016-2032)
- Table 24: North America Non Halogenated Flame Retardants Market Market Revenue (US$ Mn) Comparison by Application (2016-2032)
- Table 25: North America Non Halogenated Flame Retardants Market Market Revenue (US$ Mn) Comparison by End-use (2016-2032)
- Table 26: North America Non Halogenated Flame Retardants Market Market Y-o-Y Growth Rate Comparison by Country (2016-2032)
- Table 27: North America Non Halogenated Flame Retardants Market Market Y-o-Y Growth Rate Comparison by Product (2016-2032)
- Table 28: North America Non Halogenated Flame Retardants Market Market Y-o-Y Growth Rate Comparison by Application (2016-2032)
- Table 29: North America Non Halogenated Flame Retardants Market Market Y-o-Y Growth Rate Comparison by End-use (2016-2032)
- Table 30: North America Non Halogenated Flame Retardants Market Market Share Comparison by Country (2016-2032)
- Table 31: North America Non Halogenated Flame Retardants Market Market Share Comparison by Product (2016-2032)
- Table 32: North America Non Halogenated Flame Retardants Market Market Share Comparison by Application (2016-2032)
- Table 33: North America Non Halogenated Flame Retardants Market Market Share Comparison by End-use (2016-2032)
- Table 34: Western Europe Non Halogenated Flame Retardants Market Market Comparison by Product (2016-2032)
- Table 35: Western Europe Non Halogenated Flame Retardants Market Market Comparison by Application (2016-2032)
- Table 36: Western Europe Non Halogenated Flame Retardants Market Market Comparison by End-use (2016-2032)
- Table 37: Western Europe Non Halogenated Flame Retardants Market Revenue (US$ Mn) Comparison by Country (2016-2032)
- Table 38: Western Europe Non Halogenated Flame Retardants Market Market Revenue (US$ Mn) (2016-2032)
- Table 39: Western Europe Non Halogenated Flame Retardants Market Market Revenue (US$ Mn) Comparison by Country (2016-2032)
- Table 40: Western Europe Non Halogenated Flame Retardants Market Market Revenue (US$ Mn) Comparison by Product (2016-2032)
- Table 41: Western Europe Non Halogenated Flame Retardants Market Market Revenue (US$ Mn) Comparison by Application (2016-2032)
- Table 42: Western Europe Non Halogenated Flame Retardants Market Market Revenue (US$ Mn) Comparison by End-use (2016-2032)
- Table 43: Western Europe Non Halogenated Flame Retardants Market Market Y-o-Y Growth Rate Comparison by Country (2016-2032)
- Table 44: Western Europe Non Halogenated Flame Retardants Market Market Y-o-Y Growth Rate Comparison by Product (2016-2032)
- Table 45: Western Europe Non Halogenated Flame Retardants Market Market Y-o-Y Growth Rate Comparison by Application (2016-2032)
- Table 46: Western Europe Non Halogenated Flame Retardants Market Market Y-o-Y Growth Rate Comparison by End-use (2016-2032)
- Table 47: Western Europe Non Halogenated Flame Retardants Market Market Share Comparison by Country (2016-2032)
- Table 48: Western Europe Non Halogenated Flame Retardants Market Market Share Comparison by Product (2016-2032)
- Table 49: Western Europe Non Halogenated Flame Retardants Market Market Share Comparison by Application (2016-2032)
- Table 50: Western Europe Non Halogenated Flame Retardants Market Market Share Comparison by End-use (2016-2032)
- Table 51: Eastern Europe Non Halogenated Flame Retardants Market Market Comparison by Product (2016-2032)
- Table 52: Eastern Europe Non Halogenated Flame Retardants Market Market Comparison by Application (2016-2032)
- Table 53: Eastern Europe Non Halogenated Flame Retardants Market Market Comparison by End-use (2016-2032)
- Table 54: Eastern Europe Non Halogenated Flame Retardants Market Revenue (US$ Mn) Comparison by Country (2016-2032)
- Table 55: Eastern Europe Non Halogenated Flame Retardants Market Market Revenue (US$ Mn) (2016-2032)
- Table 56: Eastern Europe Non Halogenated Flame Retardants Market Market Revenue (US$ Mn) Comparison by Country (2016-2032)
- Table 57: Eastern Europe Non Halogenated Flame Retardants Market Market Revenue (US$ Mn) Comparison by Product (2016-2032)
- Table 58: Eastern Europe Non Halogenated Flame Retardants Market Market Revenue (US$ Mn) Comparison by Application (2016-2032)
- Table 59: Eastern Europe Non Halogenated Flame Retardants Market Market Revenue (US$ Mn) Comparison by End-use (2016-2032)
- Table 60: Eastern Europe Non Halogenated Flame Retardants Market Market Y-o-Y Growth Rate Comparison by Country (2016-2032)
- Table 61: Eastern Europe Non Halogenated Flame Retardants Market Market Y-o-Y Growth Rate Comparison by Product (2016-2032)
- Table 62: Eastern Europe Non Halogenated Flame Retardants Market Market Y-o-Y Growth Rate Comparison by Application (2016-2032)
- Table 63: Eastern Europe Non Halogenated Flame Retardants Market Market Y-o-Y Growth Rate Comparison by End-use (2016-2032)
- Table 64: Eastern Europe Non Halogenated Flame Retardants Market Market Share Comparison by Country (2016-2032)
- Table 65: Eastern Europe Non Halogenated Flame Retardants Market Market Share Comparison by Product (2016-2032)
- Table 66: Eastern Europe Non Halogenated Flame Retardants Market Market Share Comparison by Application (2016-2032)
- Table 67: Eastern Europe Non Halogenated Flame Retardants Market Market Share Comparison by End-use (2016-2032)
- Table 68: APAC Non Halogenated Flame Retardants Market Market Comparison by Product (2016-2032)
- Table 69: APAC Non Halogenated Flame Retardants Market Market Comparison by Application (2016-2032)
- Table 70: APAC Non Halogenated Flame Retardants Market Market Comparison by End-use (2016-2032)
- Table 71: APAC Non Halogenated Flame Retardants Market Revenue (US$ Mn) Comparison by Country (2016-2032)
- Table 72: APAC Non Halogenated Flame Retardants Market Market Revenue (US$ Mn) (2016-2032)
- Table 73: APAC Non Halogenated Flame Retardants Market Market Revenue (US$ Mn) Comparison by Country (2016-2032)
- Table 74: APAC Non Halogenated Flame Retardants Market Market Revenue (US$ Mn) Comparison by Product (2016-2032)
- Table 75: APAC Non Halogenated Flame Retardants Market Market Revenue (US$ Mn) Comparison by Application (2016-2032)
- Table 76: APAC Non Halogenated Flame Retardants Market Market Revenue (US$ Mn) Comparison by End-use (2016-2032)
- Table 77: APAC Non Halogenated Flame Retardants Market Market Y-o-Y Growth Rate Comparison by Country (2016-2032)
- Table 78: APAC Non Halogenated Flame Retardants Market Market Y-o-Y Growth Rate Comparison by Product (2016-2032)
- Table 79: APAC Non Halogenated Flame Retardants Market Market Y-o-Y Growth Rate Comparison by Application (2016-2032)
- Table 80: APAC Non Halogenated Flame Retardants Market Market Y-o-Y Growth Rate Comparison by End-use (2016-2032)
- Table 81: APAC Non Halogenated Flame Retardants Market Market Share Comparison by Country (2016-2032)
- Table 82: APAC Non Halogenated Flame Retardants Market Market Share Comparison by Product (2016-2032)
- Table 83: APAC Non Halogenated Flame Retardants Market Market Share Comparison by Application (2016-2032)
- Table 84: APAC Non Halogenated Flame Retardants Market Market Share Comparison by End-use (2016-2032)
- Table 85: Latin America Non Halogenated Flame Retardants Market Market Comparison by Product (2016-2032)
- Table 86: Latin America Non Halogenated Flame Retardants Market Market Comparison by Application (2016-2032)
- Table 87: Latin America Non Halogenated Flame Retardants Market Market Comparison by End-use (2016-2032)
- Table 88: Latin America Non Halogenated Flame Retardants Market Revenue (US$ Mn) Comparison by Country (2016-2032)
- Table 89: Latin America Non Halogenated Flame Retardants Market Market Revenue (US$ Mn) (2016-2032)
- Table 90: Latin America Non Halogenated Flame Retardants Market Market Revenue (US$ Mn) Comparison by Country (2016-2032)
- Table 91: Latin America Non Halogenated Flame Retardants Market Market Revenue (US$ Mn) Comparison by Product (2016-2032)
- Table 92: Latin America Non Halogenated Flame Retardants Market Market Revenue (US$ Mn) Comparison by Application (2016-2032)
- Table 93: Latin America Non Halogenated Flame Retardants Market Market Revenue (US$ Mn) Comparison by End-use (2016-2032)
- Table 94: Latin America Non Halogenated Flame Retardants Market Market Y-o-Y Growth Rate Comparison by Country (2016-2032)
- Table 95: Latin America Non Halogenated Flame Retardants Market Market Y-o-Y Growth Rate Comparison by Product (2016-2032)
- Table 96: Latin America Non Halogenated Flame Retardants Market Market Y-o-Y Growth Rate Comparison by Application (2016-2032)
- Table 97: Latin America Non Halogenated Flame Retardants Market Market Y-o-Y Growth Rate Comparison by End-use (2016-2032)
- Table 98: Latin America Non Halogenated Flame Retardants Market Market Share Comparison by Country (2016-2032)
- Table 99: Latin America Non Halogenated Flame Retardants Market Market Share Comparison by Product (2016-2032)
- Table 100: Latin America Non Halogenated Flame Retardants Market Market Share Comparison by Application (2016-2032)
- Table 101: Latin America Non Halogenated Flame Retardants Market Market Share Comparison by End-use (2016-2032)
- Table 102: Middle East & Africa Non Halogenated Flame Retardants Market Market Comparison by Product (2016-2032)
- Table 103: Middle East & Africa Non Halogenated Flame Retardants Market Market Comparison by Application (2016-2032)
- Table 104: Middle East & Africa Non Halogenated Flame Retardants Market Market Comparison by End-use (2016-2032)
- Table 105: Middle East & Africa Non Halogenated Flame Retardants Market Revenue (US$ Mn) Comparison by Country (2016-2032)
- Table 106: Middle East & Africa Non Halogenated Flame Retardants Market Market Revenue (US$ Mn) (2016-2032)
- Table 107: Middle East & Africa Non Halogenated Flame Retardants Market Market Revenue (US$ Mn) Comparison by Country (2016-2032)
- Table 108: Middle East & Africa Non Halogenated Flame Retardants Market Market Revenue (US$ Mn) Comparison by Product (2016-2032)
- Table 109: Middle East & Africa Non Halogenated Flame Retardants Market Market Revenue (US$ Mn) Comparison by Application (2016-2032)
- Table 110: Middle East & Africa Non Halogenated Flame Retardants Market Market Revenue (US$ Mn) Comparison by End-use (2016-2032)
- Table 111: Middle East & Africa Non Halogenated Flame Retardants Market Market Y-o-Y Growth Rate Comparison by Country (2016-2032)
- Table 112: Middle East & Africa Non Halogenated Flame Retardants Market Market Y-o-Y Growth Rate Comparison by Product (2016-2032)
- Table 113: Middle East & Africa Non Halogenated Flame Retardants Market Market Y-o-Y Growth Rate Comparison by Application (2016-2032)
- Table 114: Middle East & Africa Non Halogenated Flame Retardants Market Market Y-o-Y Growth Rate Comparison by End-use (2016-2032)
- Table 115: Middle East & Africa Non Halogenated Flame Retardants Market Market Share Comparison by Country (2016-2032)
- Table 116: Middle East & Africa Non Halogenated Flame Retardants Market Market Share Comparison by Product (2016-2032)
- Table 117: Middle East & Africa Non Halogenated Flame Retardants Market Market Share Comparison by Application (2016-2032)
- Table 118: Middle East & Africa Non Halogenated Flame Retardants Market Market Share Comparison by End-use (2016-2032)
- 1. Executive Summary
-
- Albemarle Corporation
- ICL
- Chemtura Corporation
- Clariant AG
- Italmatch Chemicals S.p.A
- Huber Engineered Materials
- Thor Group Ltd.
- LANXESS AG
- DSM
- FRX Innovations
- Nabaltec AG
- DuPont
Our Clients


View Our Licence Options
