
Natural Dyes Market By Source (Plants, Animals, Others), By Distribution Channel (Retail Stores, Online Channels, Specialty Stores, Others), By Chemical Constitution (Indigoid Dyes, Anthraquinone Dyes, Alpha Naphthoquinones, Flavonoids, Others), By Application (Textiles & Leather, Food and Beverages, Cosmetics, Pharmaceuticals, Others), By Region And Companies - Industry Segment Outlook, Market Assessment, Competition Scenario, Trends, And Forecast 2024-2033
-
28792
-
July 2024
-
300300
-


-
This report was compiled by Shreyas Rokade Shreyas Rokade is a seasoned Research Analyst with CMFE, bringing extensive expertise in market research and consulting, with a strong background in Chemical Engineering. Correspondence Team Lead-CMFE Linkedin | Detailed Market research Methodology Our methodology involves a mix of primary research, including interviews with leading mental health experts, and secondary research from reputable medical journals and databases. View Detailed Methodology Page
-
Quick Navigation
Report Overview
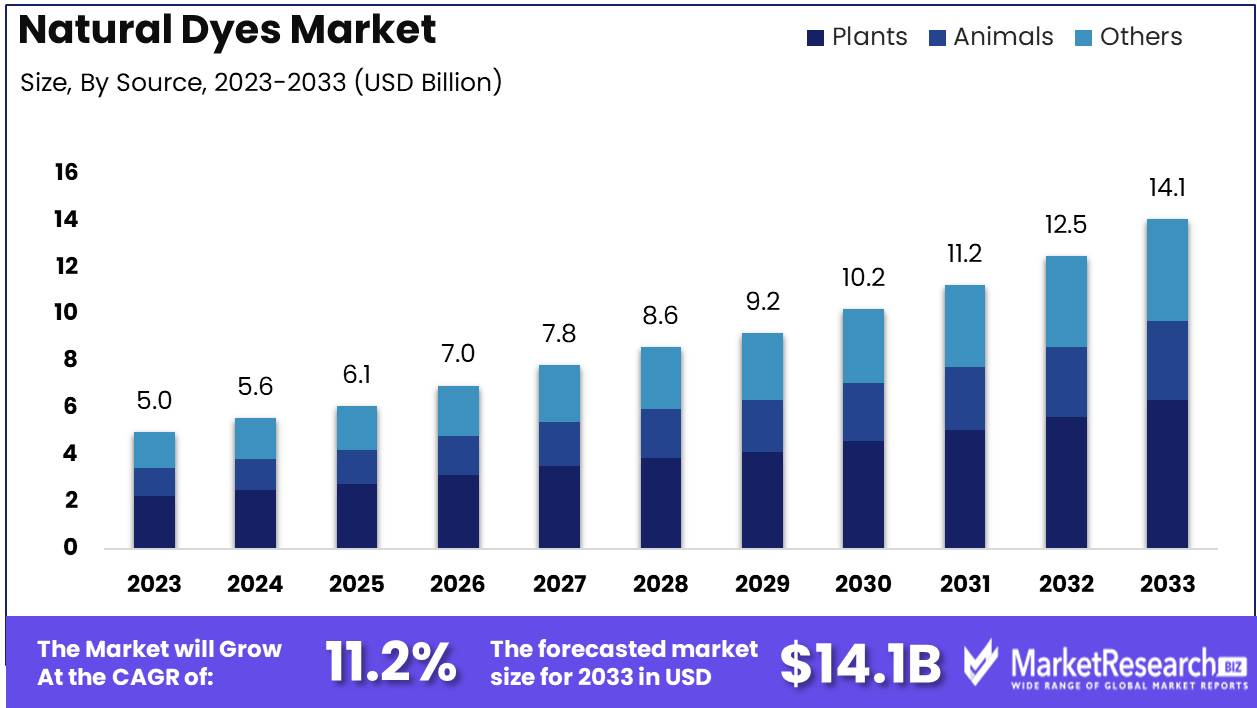
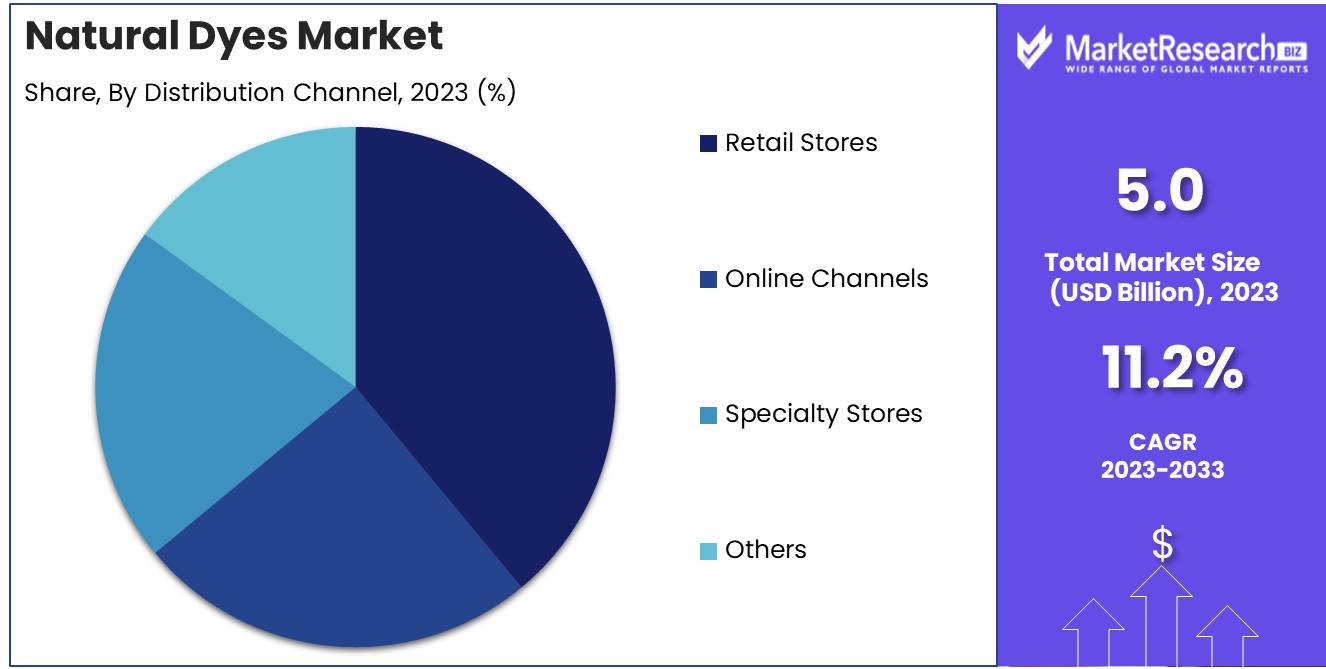
The Natural Dyes Market was valued at USD 5.0 billion in 2023. It is expected to reach USD 14.1 billion by 2033, with a CAGR of 11.2% during the forecast period from 2024 to 2033.
The Natural Dyes Market encompasses the production, distribution, and application of colorants derived from natural sources such as plants, minerals, and insects. This market is driven by increasing consumer demand for sustainable and eco-friendly products across various industries, including textiles, food, cosmetics, and personal care. Natural dyes are favored for their biodegradability, reduced environmental impact, and potential health benefits.
The Natural Dyes Market is poised for significant growth, driven by an increasing awareness and demand for sustainable and eco-friendly products. Regulatory support and favorable policies are further encouraging the adoption of natural dyes over synthetic alternatives. For instance, many governments are introducing stringent regulations on synthetic dyes due to their environmental and health impacts, thereby providing an impetus for natural dyes.
Additionally, the market is witnessing a notable shift towards plant-based dyes such as indigo and turmeric, which are gaining popularity due to their minimal environmental footprint and cultural significance. However, despite these positive trends, the high cost of natural dyes remains a substantial barrier to widespread adoption. The production of natural dyes involves labor-intensive processes and higher raw material costs compared to synthetic dyes, which impacts their market competitiveness.
Moreover, the market faces challenges related to the limited availability and inconsistent quality of raw materials. The supply chain for natural dyes is often fragmented, leading to variability in dye quality and reliability. This inconsistency can affect the color fastness and overall performance of natural-dyed textiles, posing a challenge for manufacturers and end-users. Nonetheless, ongoing research and development efforts are focused on improving the extraction and standardization processes to enhance the quality and consistency of natural dyes. As consumers continue to prioritize sustainability, and as regulatory landscapes evolve to support eco-friendly practices, the natural dyes market is expected to expand, albeit at a measured pace due to these underlying challenges.
Key Takeaways
- Market Growth: The Natural Dyes Market was valued at USD 5.0 billion in 2023. It is expected to reach USD 14.1 billion by 2033, with a CAGR of 11.2% during the forecast period from 2024 to 2033.
- By Source: Plants segment dominated the Natural Dyes Market.
- By Distribution Channel: Retail stores dominated the Natural Dyes Market distribution.
- By Chemical Constitution: Indigoid Dyes dominated the Natural Dyes Market segment.
- By Application: The Textiles & Leather segment dominated the Natural Dyes Market.
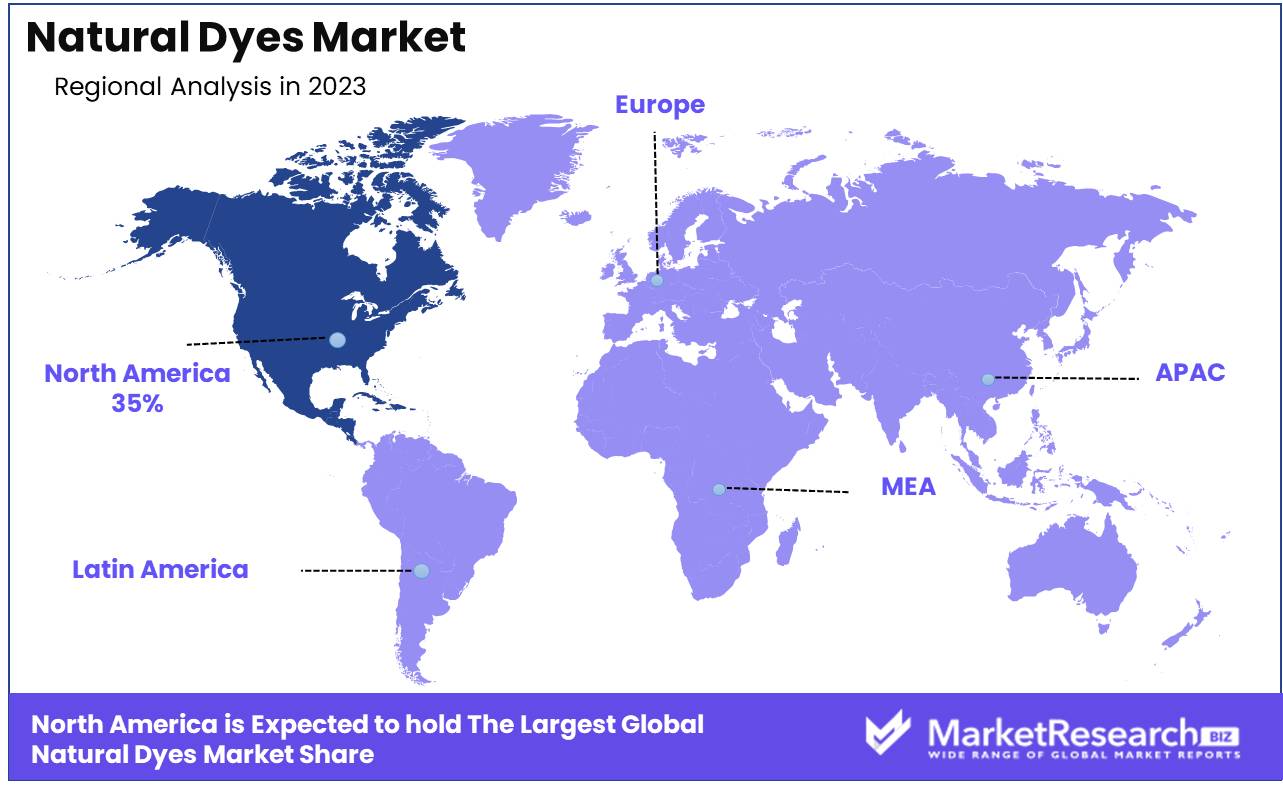
- Regional Dominance: North America leads the Natural Dyes Market with a 35% largest share.
- Growth Opportunity: The Natural Dyes Market will thrive due to rising eco-friendly product demand and textile industry expansion.
Driving factors
Increasing Environmental Awareness Driving the Adoption of Natural Dyes
The growing concern for environmental sustainability is significantly boosting the Natural Dyes Market. As consumers become more environmentally conscious, they prefer products that have minimal ecological impact. Synthetic dyes, which dominate the market, are known for their detrimental effects on the environment, including water pollution and non-biodegradability. In contrast, natural dyes, derived from renewable sources such as plants, insects, and minerals, offer an eco-friendly alternative. This shift in consumer preference is evident in various industries, especially textiles, where eco-friendly dyes are increasingly favored.
According to market data, the global textile dyeing and finishing industry, responsible for approximately 20% of industrial water pollution, is seeing a gradual but steady move towards sustainable practices, thereby fueling the demand for natural dyes.
Rising Demand for Organic Products Fueling Natural Dyes Market Growth
The global rise in demand for organic products is a major driver for the growth of the Natural Dyes Market. Consumers are increasingly seeking products that are free from synthetic chemicals and genetically modified organisms (GMOs). This trend is particularly prominent in the food and beverage, cosmetics, and textile industries. Natural dyes, being organic, align perfectly with this consumer demand.
The organic food market alone has seen a substantial increase, with the global market size valued at approximately USD 220 billion in 2022, and projected to grow at a CAGR of 9.7% from 2023 to 2030. This surge in organic product consumption directly translates to higher demand for natural dyes, as they are essential in the production of certified organic goods. Moreover, the preference for organic textiles and cosmetics, which use natural dyes, is also contributing to market expansion.
Health Concerns Catalyzing the Shift to Natural Dyes
Health concerns associated with synthetic dyes are significantly catalyzing the shift towards natural dyes. Synthetic dyes often contain toxic chemicals and allergens that can cause various health issues, including skin irritations and long-term illnesses. The awareness of these potential health risks has led consumers and manufacturers to seek safer alternatives. Natural dyes, which are typically non-toxic and hypoallergenic, are thus becoming increasingly popular.
For instance, the textile industry is witnessing a growing preference for naturally dyed fabrics, especially in baby clothing and products intended for sensitive skin. This health-driven demand is not only evident in textiles but also in the food and beverage and cosmetics industries, where consumers are wary of artificial colorants and prefer naturally dyed products. Studies indicate that around 60% of consumers globally are concerned about the presence of synthetic chemicals in their daily use products, which is driving the market towards natural dyes.
Restraining Factors
High Competition from Synthetic Dyes: A Major Barrier to the Natural Dyes Market Growth
The natural dyes market faces significant restraint due to the intense competition from synthetic dyes. Synthetic dyes dominate the market due to their cost-effectiveness, ease of production, and consistent quality. According to industry data, synthetic dyes account for over 90% of the total dyes market, showcasing their overwhelming presence and preference in various industries, including textiles, food, and cosmetics. This dominance is primarily because synthetic dyes offer a broader color range and better colorfastness at a fraction of the cost and production time required for natural dyes.
Moreover, synthetic dyes are heavily favored in industrial applications due to their ability to meet high-volume demands efficiently. The scalability of synthetic dye production contrasts sharply with the limitations in the availability of natural dye sources, which are often dependent on agricultural yields and seasonal variations. This disparity places natural dyes at a competitive disadvantage, limiting their market penetration and growth.
Furthermore, synthetic dyes have established a robust supply chain infrastructure that ensures consistent availability and distribution. In contrast, the supply chain for natural dyes is less developed and more fragmented, adding another layer of complexity and cost for manufacturers who might consider switching to natural alternatives. The established position of synthetic dyes thus creates a significant barrier to the expansion of the natural dyes market.
Cost of Natural Dyes: A Key Factor Hindering Market Expansion
The high cost associated with natural dyes is another critical restraining factor impacting their market growth. Natural dyes are generally more expensive to produce compared to synthetic dyes due to several inherent challenges. The extraction and processing of natural dyes from plants, insects, and minerals are labor-intensive and time-consuming processes that contribute to the higher cost. Additionally, the cultivation of natural dye sources often requires significant agricultural input, including land, water, and labor, further escalating production costs.
Statistics indicate that the cost of producing natural dyes can be up to 5-10 times higher than that of synthetic dyes, making them less economically viable for large-scale industrial applications. This cost disparity is a major deterrent for manufacturers, particularly in price-sensitive markets. As a result, the adoption of natural dyes remains limited to niche markets and high-end products where consumers are willing to pay a premium for eco-friendly and sustainable options.
By Source Analysis
In 2023, The Plants segment dominated the Natural Dyes Market.
In 2023, The Plants segment held a dominant market position in the By Source segment of the Natural Dyes Market. The extensive use of plant-based dyes in various industries, including textiles, food, and cosmetics, significantly contributed to this dominance. Plant-based dyes are preferred for their eco-friendly and sustainable properties, aligning with the growing consumer demand for natural and organic products. Key plant sources, such as indigo, madder, and turmeric, are widely utilized due to their vibrant hues and non-toxic nature. Additionally, advancements in extraction and processing technologies have enhanced the efficiency and quality of plant-based dyes, further driving their adoption.
The Animals segment, although smaller in comparison, plays a crucial role, particularly in traditional and artisanal applications. Cochineal and lac insects are notable sources, valued for their unique color properties.
The Others segment includes minerals and microbial sources, gaining traction for specialized uses but still lagging behind plant-based dyes in market share. Overall, the Plants segment's strong market presence is a testament to the increasing shift towards sustainable and natural dyeing solutions across various industries.
By Distribution Channel Analysis
In 2023, Retail stores dominated the Natural Dyes Market distribution.
In 2023, Retail stores held a dominant market position in the distribution channel segment of the Natural Dyes Market. Retail stores accounted for the largest share due to their extensive reach and the growing consumer preference for in-person shopping experiences. The availability of a wide variety of natural dyes, coupled with personalized customer service, has bolstered the prominence of retail stores.
Online channels, although rapidly growing, followed as the second largest segment. This growth is attributed to the increasing penetration of e-commerce platforms and the convenience of online shopping, which allows consumers to access a broad range of products from the comfort of their homes. Specialty stores, catering to niche markets and offering high-quality, unique natural dye products, secured the third position. These stores appeal to discerning customers seeking exclusive and eco-friendly dye options.
Lastly, the 'Others' segment, encompassing alternative distribution channels such as direct sales and flea markets, held a smaller yet notable share. The diverse distribution landscape highlights the evolving consumer preferences and the dynamic nature of the Natural Dyes Market.
By Chemical Constitution Analysis
In 2023, Indigoid Dyes dominated the Natural Dyes Market segment.
In 2023, Indigoid Dyes held a dominant market position in the By Chemical Constitution segment of the Natural Dyes Market. This segment includes various categories such as Indigoid Dyes, Anthraquinone Dyes, Alpha Naphthoquinones, Flavonoids, Di-Hydropyrans, Anthocyanidins, and Carotenoids. Indigoid Dyes, primarily derived from indigo, are renowned for their deep blue color and have been a staple in the dye industry for centuries. Their widespread use in textiles and increasing adoption of eco-friendly applications contribute significantly to their market dominance.
Anthraquinone Dyes, known for their vibrant colors and stability, are also prominent within this segment and used extensively in printing and textile applications. Alpha Naphthoquinones and Flavonoids, while less dominant, serve niche applications due to their unique color properties and natural origin.
Di-hydropyrans and Anthocyanidins, valued for their diverse range of colors, are gaining traction in the natural dyes market due to rising consumer preference for natural and organic products. Carotenoids, recognized for their bright hues and antioxidant properties, are increasingly utilized in the food and cosmetic industries. Collectively, these chemical constituents reflect the diverse and evolving landscape of the Natural Dyes Market.
By Application Analysis
In 2023, The Textiles & Leather segment dominated the Natural Dyes Market.
In 2023, The Textiles & Leather segment held a dominant market position in the Natural Dyes Market, driven by the increasing consumer preference for eco-friendly and sustainable products. The textile industry's significant demand for natural dyes can be attributed to a growing awareness of the environmental impacts associated with synthetic dyes. This trend has led to a substantial shift towards natural dyes, which are perceived as more sustainable and less harmful to the environment.
The Food and Beverages segment also saw considerable growth, fueled by rising consumer inclination towards natural and organic food products. Natural dyes are increasingly used in food and beverage applications due to their safety, non-toxic properties, and ability to provide vibrant, appealing colors without artificial additives.
In the Cosmetics sector, the use of natural dyes has gained traction due to the clean beauty movement, which emphasizes the use of natural and non-toxic ingredients. Natural dyes are valued for their safety and efficacy in cosmetic formulations.
The Pharmaceuticals segment utilized natural dyes for their applications in drug coloring and as indicators in various pharmaceutical processes, although this sector remains relatively niche compared to textiles and food applications.
The Others category includes diverse applications, such as art supplies and household products, where natural dyes are favored for their eco-friendly characteristics and aesthetic appeal.
Key Market Segments
By Source
- Plants
- Animals
- Others
By Distribution Channel
- Retail Stores
- Online Channels
- Specialty Stores
- Others
By Chemical Constitution
- Indigoid Dyes
- Anthraquinone Dyes
- Alpha Naphthoquinones
- Flavonoids
- Di-Hydropyrans
- Anthocyanidins
- Carotenoids
By Application
- Textiles & Leather
- Food and Beverages
- Cosmetics
- Pharmaceuticals
- Others
Growth Opportunity
Rising Demand for Eco-Friendly Products
The global Natural Dyes Market is poised for substantial growth, primarily driven by the increasing consumer demand for eco-friendly and sustainable products. As environmental concerns escalate, consumers are progressively opting for natural dyes over synthetic alternatives. Natural dyes are perceived as safer and less harmful to both human health and the environment. This shift is propelling manufacturers to adopt and innovate with natural dyeing techniques, expanding market opportunities. The rising trend of sustainability across various sectors, including fashion and home textiles, is creating a robust demand for natural dyes, thereby opening new avenues for market players.
Expansion in the Textile Industry
Another significant opportunity for the Natural Dyes Market is the expansion of the textile industry. As the global textile sector continues to grow, the need for diverse and sustainable dyeing options becomes more pronounced. Natural dyes, with their unique properties and eco-friendly profile, are increasingly being integrated into textile manufacturing processes. This integration not only caters to the growing consumer preference for sustainable products but also enhances the overall value proposition of textile products. The expansion of textile applications, including in luxury and high-end fashion segments, is expected to drive increased adoption of natural dyes, further stimulating market growth.
Latest Trends
Technological Advancements
The natural dyes market is poised for significant transformation due to advancements in technology. The development of innovative extraction techniques and more efficient processing methods has enhanced the quality and stability of natural dyes. Technologies such as supercritical fluid extraction and enzyme-assisted extraction are revolutionizing the industry by improving yield and reducing environmental impact.
Additionally, advancements in digital dyeing technology and precision application methods are allowing for greater control over color outcomes and consistency, catering to increasingly sophisticated consumer preferences. These technological strides not only bolster the market's appeal in traditional applications but also facilitate its expansion into new sectors, including textiles and food.
Expansion in Personal Care Products
The expansion of natural dyes into the personal care products sector represents a noteworthy trend. With growing consumer awareness of the potential health risks associated with synthetic dyes, there is a marked shift towards natural alternatives. Natural dyes, known for their organic and eco-friendly attributes, are being increasingly incorporated into cosmetics, skincare, and hair care products. This shift is driven by rising demand for clean and green beauty products that align with the broader sustainability movement. Major personal care brands are leveraging natural dyes to differentiate their offerings and appeal to health-conscious consumers. As a result, the natural dyes market is experiencing a surge in demand, with significant opportunities for growth and innovation in this segment.
Regional Analysis
North America leads the Natural Dyes Market with a 35% largest share.
The Natural Dyes Market exhibits diverse regional dynamics, with varying growth patterns and market shares across North America, Europe, Asia Pacific, Middle East & Africa, and Latin America.
North America is a leading region in the natural dyes market, driven by increasing consumer preference for sustainable and eco-friendly products. The market in this region is estimated to hold a significant share, approximately 35% of the global market. The strong demand is supported by a well-established textile industry and rising awareness about the environmental benefits of natural dyes. Key players in North America, including companies like Colorex, are investing in innovative dyeing technologies to cater to the growing market.
Europe follows, with substantial growth attributed to stringent environmental regulations and high consumer awareness regarding sustainable practices. The European market is valued for its innovation in dyeing techniques and is expected to contribute around 30% to the global market share.
Asia Pacific shows rapid growth, driven by the burgeoning textile industry and increasing adoption of natural dyes in emerging economies like India and China. This region is projected to hold approximately 25% of the market share. Middle East & Africa and Latin America have smaller shares, with growth driven by niche markets and increasing demand for natural products in textiles and cosmetics.
Key Regions and Countries
North America
- The US
- Canada
- Rest of North America
Europe
- Germany
- France
- The UK
- Spain
- Netherlands
- Russia
- Italy
- Rest of Europe
Asia-Pacific
- China
- Japan
- Singapore
- Thailand
- South Korea
- Vietnam
- India
- New Zealand
- Rest of Asia Pacific
Latin America
- Mexico
- Brazil
- Rest of Latin America
Middle East & Africa
- Saudi Arabia
- South Africa
- UAE
- Rest of the Middle East & Africa
Key Players Analysis
The global Natural Dyes Market is characterized by a diverse array of key players, each contributing to the market's growth and innovation. Leading companies such as BASF SE, DSM N.V., and Archroma stand out for their extensive research and development capabilities, advancing the technological applications of natural dyes. BASF SE and DSM N.V. leverage their strong chemical backgrounds to enhance dye formulations, ensuring superior performance and sustainability.
GNT Group B.V. and Sun Food Tech are notable for their emphasis on natural colorants derived from food sources, aligning with the increasing consumer demand for organic and safe products. Their expertise in extracting and processing dyes from natural ingredients positions them competitively in the market. Stony Creek Colors and Wild Colours are prominent in the realm of sustainable and eco-friendly dye solutions. Their commitment to reducing environmental impact through innovative production methods and the use of plant-based materials resonates with the growing trend towards sustainability.
Kemin Industries and Natural Earth Paint offer unique value propositions through their focus on health-conscious and environmentally friendly dye options. Their products cater to niche markets within the natural dyes sector, emphasizing safety and ecological responsibility. Couleurs de Plantes and Earthues contribute to the market with their extensive range of plant-based dyes, promoting biodiversity and traditional dyeing techniques. Their emphasis on heritage and craftsmanship appeals to segments of the market valuing artisanal quality.
Companies like Abbey Color Inc., AMA Herbal Laboratories, and Pylam Products Company play crucial roles in maintaining the market's dynamic nature through their specialized offerings and established industry presence. Their collective contributions reflect the broad scope of natural dye applications, from textiles to food and beyond.
Market Key Players
- Abbey Color Inc
- AMA Herbal Laboratories
- Aura Herbal Textiles
- Maiwa
- Pylam Products Company
- Sun Food Tech
- GNT Group B.V.
- Stony Creek Colors
- NIG Food Engineering
- Couleurs de Plantes
- Aurora Silk
- Earthues
- Wild Colours
- Renaissance Dyeing
- Ashford Handicrafts
- Sam vegetable Colours
- Green matter Natural Dye
- Shiva Exim
- Biodye
- BASF SE
- DSM N.V.
- Archroma
- Kemin Industries
- Natural Earth Paint
- Colourtex
Recent Development
- In June 2024, Archroma announced its expansion into natural dyes with a new product line focused on plant-based dyes. This move aims to cater to the increasing demand for eco-friendly and sustainable dyeing solutions in the textile industry.
- In May 2024, Maiwa, in collaboration with several fashion brands, introduced a line of naturally dyed garments. This initiative aims to promote the use of natural dyes in mainstream fashion, emphasizing transparency and sustainability in the production process.
- In March 2024, Stony Creek Colors launched a new bio-based indigo dye, enhancing its portfolio of sustainable dyes. This innovation is particularly significant for the denim industry, offering a viable alternative to synthetic indigo dyes, which are known for their environmental impact.
Report Scope
Report Features Description Market Value (2023) USD 5.0 Billion Forecast Revenue (2033) USD 14.1 Billion CAGR (2024-2032) 11.2% Base Year for Estimation 2023 Historic Period 2016-2023 Forecast Period 2024-2033 Report Coverage Revenue Forecast, Market Dynamics, COVID-19 Impact, Competitive Landscape, Recent Developments Segments Covered By Source (Plants, Animals, Others), By Distribution Channel (Retail Stores, Online Channels, Specialty Stores, Others), By Chemical Constitution (Indigoid Dyes, Anthraquinone Dyes, Alpha Naphthoquinones, Flavonoids, Others), By Application (Textiles & Leather, Food and Beverages, Cosmetics, Pharmaceuticals, Others) Regional Analysis North America - The US, Canada, Rest of North America, Europe - Germany, France, The UK, Spain, Italy, Russia, Netherlands, Rest of Europe, Asia-Pacific - China, Japan, South Korea, India, New Zealand, Singapore, Thailand, Vietnam, Rest of Asia Pacific, Latin America - Brazil, Mexico, Rest of Latin America, Middle East & Africa - South Africa, Saudi Arabia, UAE, Rest of Middle East & Africa Competitive Landscape Abbey Color Inc, AMA Herbal Laboratories, Aura Herbal Textiles, Maiwa, Pylam Products Company, Sun Food Tech, GNT Group B.V., Stony Creek Colors, NIG Food Engineering, Couleurs de Plantes, Aurora Silk, Earthues, Wild Colours, Renaissance Dyeing, Ashford Handicrafts, Sam vegetable Colours, Green matter Natural Dye, Shiva Exim, Biodye, BASF SE, DSM N.V., Archroma, Kemin Industries, Natural Earth Paint, Colourtex Customization Scope Customization for segments, region/country-level will be provided. Moreover, additional customization can be done based on the requirements. Purchase Options We have three licenses to opt for Single User License, Multi-User License (Up to 5 Users), Corporate Use License (Unlimited User and Printable PDF) -
- 1. Executive Summary
- 1.1. Definition
- 1.2. Taxonomy
- 1.3. Research Scope
- 1.4. Key Analysis
- 1.5. Key Findings by Major Segments
- 1.6. Top strategies by Major Players
- 2. Global Natural Dyes Market Overview
- 2.1. Natural Dyes Market Dynamics
- 2.1.1. Drivers
- 2.1.2. Opportunities
- 2.1.3. Restraints
- 2.1.4. Challenges
- 2.2. Macro-economic Factors
- 2.3. Regulatory Framework
- 2.4. Market Investment Feasibility Index
- 2.5. PEST Analysis
- 2.6. PORTER’S Five Force Analysis
- 2.7. Drivers & Restraints Impact Analysis
- 2.8. Industry Chain Analysis
- 2.9. Cost Structure Analysis
- 2.10. Marketing Strategy
- 2.11. Russia-Ukraine War Impact Analysis
- 2.12. Opportunity Map Analysis
- 2.13. Market Competition Scenario Analysis
- 2.14. Product Life Cycle Analysis
- 2.15. Opportunity Orbits
- 2.16. Manufacturer Intensity Map
- 2.17. Major Companies sales by Value & Volume
- 2.1. Natural Dyes Market Dynamics
- 3. Global Natural Dyes Market Analysis, Opportunity and Forecast, 2016-2032
- 3.1. Global Natural Dyes Market Analysis, 2016-2021
- 3.2. Global Natural Dyes Market Opportunity and Forecast, 2023-2032
- 3.3. Global Natural Dyes Market Analysis, Opportunity and Forecast, By Source, 2016-2032
- 3.3.1. Global Natural Dyes Market Analysis by Source: Introduction
- 3.3.2. Market Size Absolute $ Opportunity Analysis and Forecast, By Source, 2016-2032
- 3.3.3. Plants
- 3.3.4. Animals
- 3.3.5. Others
- 3.4. Global Natural Dyes Market Analysis, Opportunity and Forecast, By Distribution Channel, 2016-2032
- 3.4.1. Global Natural Dyes Market Analysis by Distribution Channel: Introduction
- 3.4.2. Market Size Absolute $ Opportunity Analysis and Forecast, By Distribution Channel, 2016-2032
- 3.4.3. Retail Stores
- 3.4.4. Online Channels
- 3.4.5. Specialty Stores
- 3.4.6. Others
- 3.5. Global Natural Dyes Market Analysis, Opportunity and Forecast, By Chemical Constitution, 2016-2032
- 3.5.1. Global Natural Dyes Market Analysis by Chemical Constitution: Introduction
- 3.5.2. Market Size Absolute $ Opportunity Analysis and Forecast, By Chemical Constitution, 2016-2032
- 3.5.3. Indigoid Dyes
- 3.5.4. Anthraquinone Dyes
- 3.5.5. Alpha Naphthoquinones
- 3.5.6. Flavonoids
- 3.5.7. Di-Hydropyrans
- 3.5.8. Anthocyanidins
- 3.5.9. Carotenoids
- 3.6. Global Natural Dyes Market Analysis, Opportunity and Forecast, By Application, 2016-2032
- 3.6.1. Global Natural Dyes Market Analysis by Application: Introduction
- 3.6.2. Market Size Absolute $ Opportunity Analysis and Forecast, By Application, 2016-2032
- 3.6.3. Textiles & Leather
- 3.6.4. Food and Beverages
- 3.6.5. Cosmetics
- 3.6.6. Pharmaceuticals
- 3.6.7. Others
- 4. North America Natural Dyes Market Analysis, Opportunity and Forecast, 2016-2032
- 4.1. North America Natural Dyes Market Analysis, 2016-2021
- 4.2. North America Natural Dyes Market Opportunity and Forecast, 2023-2032
- 4.3. North America Natural Dyes Market Analysis, Opportunity and Forecast, By Source, 2016-2032
- 4.3.1. North America Natural Dyes Market Analysis by Source: Introduction
- 4.3.2. Market Size Absolute $ Opportunity Analysis and Forecast, By Source, 2016-2032
- 4.3.3. Plants
- 4.3.4. Animals
- 4.3.5. Others
- 4.4. North America Natural Dyes Market Analysis, Opportunity and Forecast, By Distribution Channel, 2016-2032
- 4.4.1. North America Natural Dyes Market Analysis by Distribution Channel: Introduction
- 4.4.2. Market Size Absolute $ Opportunity Analysis and Forecast, By Distribution Channel, 2016-2032
- 4.4.3. Retail Stores
- 4.4.4. Online Channels
- 4.4.5. Specialty Stores
- 4.4.6. Others
- 4.5. North America Natural Dyes Market Analysis, Opportunity and Forecast, By Chemical Constitution, 2016-2032
- 4.5.1. North America Natural Dyes Market Analysis by Chemical Constitution: Introduction
- 4.5.2. Market Size Absolute $ Opportunity Analysis and Forecast, By Chemical Constitution, 2016-2032
- 4.5.3. Indigoid Dyes
- 4.5.4. Anthraquinone Dyes
- 4.5.5. Alpha Naphthoquinones
- 4.5.6. Flavonoids
- 4.5.7. Di-Hydropyrans
- 4.5.8. Anthocyanidins
- 4.5.9. Carotenoids
- 4.6. North America Natural Dyes Market Analysis, Opportunity and Forecast, By Application, 2016-2032
- 4.6.1. North America Natural Dyes Market Analysis by Application: Introduction
- 4.6.2. Market Size Absolute $ Opportunity Analysis and Forecast, By Application, 2016-2032
- 4.6.3. Textiles & Leather
- 4.6.4. Food and Beverages
- 4.6.5. Cosmetics
- 4.6.6. Pharmaceuticals
- 4.6.7. Others
- 4.7. North America Natural Dyes Market Analysis, Opportunity and Forecast, By Country , 2016-2032
- 4.7.1. North America Natural Dyes Market Analysis by Country : Introduction
- 4.7.2. Market Size Absolute $ Opportunity Analysis and Forecast, Country , 2016-2032
- 4.7.2.1. The US
- 4.7.2.2. Canada
- 4.7.2.3. Mexico
- 5. Western Europe Natural Dyes Market Analysis, Opportunity and Forecast, 2016-2032
- 5.1. Western Europe Natural Dyes Market Analysis, 2016-2021
- 5.2. Western Europe Natural Dyes Market Opportunity and Forecast, 2023-2032
- 5.3. Western Europe Natural Dyes Market Analysis, Opportunity and Forecast, By Source, 2016-2032
- 5.3.1. Western Europe Natural Dyes Market Analysis by Source: Introduction
- 5.3.2. Market Size Absolute $ Opportunity Analysis and Forecast, By Source, 2016-2032
- 5.3.3. Plants
- 5.3.4. Animals
- 5.3.5. Others
- 5.4. Western Europe Natural Dyes Market Analysis, Opportunity and Forecast, By Distribution Channel, 2016-2032
- 5.4.1. Western Europe Natural Dyes Market Analysis by Distribution Channel: Introduction
- 5.4.2. Market Size Absolute $ Opportunity Analysis and Forecast, By Distribution Channel, 2016-2032
- 5.4.3. Retail Stores
- 5.4.4. Online Channels
- 5.4.5. Specialty Stores
- 5.4.6. Others
- 5.5. Western Europe Natural Dyes Market Analysis, Opportunity and Forecast, By Chemical Constitution, 2016-2032
- 5.5.1. Western Europe Natural Dyes Market Analysis by Chemical Constitution: Introduction
- 5.5.2. Market Size Absolute $ Opportunity Analysis and Forecast, By Chemical Constitution, 2016-2032
- 5.5.3. Indigoid Dyes
- 5.5.4. Anthraquinone Dyes
- 5.5.5. Alpha Naphthoquinones
- 5.5.6. Flavonoids
- 5.5.7. Di-Hydropyrans
- 5.5.8. Anthocyanidins
- 5.5.9. Carotenoids
- 5.6. Western Europe Natural Dyes Market Analysis, Opportunity and Forecast, By Application, 2016-2032
- 5.6.1. Western Europe Natural Dyes Market Analysis by Application: Introduction
- 5.6.2. Market Size Absolute $ Opportunity Analysis and Forecast, By Application, 2016-2032
- 5.6.3. Textiles & Leather
- 5.6.4. Food and Beverages
- 5.6.5. Cosmetics
- 5.6.6. Pharmaceuticals
- 5.6.7. Others
- 5.7. Western Europe Natural Dyes Market Analysis, Opportunity and Forecast, By Country , 2016-2032
- 5.7.1. Western Europe Natural Dyes Market Analysis by Country : Introduction
- 5.7.2. Market Size Absolute $ Opportunity Analysis and Forecast, Country , 2016-2032
- 5.7.2.1. Germany
- 5.7.2.2. France
- 5.7.2.3. The UK
- 5.7.2.4. Spain
- 5.7.2.5. Italy
- 5.7.2.6. Portugal
- 5.7.2.7. Ireland
- 5.7.2.8. Austria
- 5.7.2.9. Switzerland
- 5.7.2.10. Benelux
- 5.7.2.11. Nordic
- 5.7.2.12. Rest of Western Europe
- 6. Eastern Europe Natural Dyes Market Analysis, Opportunity and Forecast, 2016-2032
- 6.1. Eastern Europe Natural Dyes Market Analysis, 2016-2021
- 6.2. Eastern Europe Natural Dyes Market Opportunity and Forecast, 2023-2032
- 6.3. Eastern Europe Natural Dyes Market Analysis, Opportunity and Forecast, By Source, 2016-2032
- 6.3.1. Eastern Europe Natural Dyes Market Analysis by Source: Introduction
- 6.3.2. Market Size Absolute $ Opportunity Analysis and Forecast, By Source, 2016-2032
- 6.3.3. Plants
- 6.3.4. Animals
- 6.3.5. Others
- 6.4. Eastern Europe Natural Dyes Market Analysis, Opportunity and Forecast, By Distribution Channel, 2016-2032
- 6.4.1. Eastern Europe Natural Dyes Market Analysis by Distribution Channel: Introduction
- 6.4.2. Market Size Absolute $ Opportunity Analysis and Forecast, By Distribution Channel, 2016-2032
- 6.4.3. Retail Stores
- 6.4.4. Online Channels
- 6.4.5. Specialty Stores
- 6.4.6. Others
- 6.5. Eastern Europe Natural Dyes Market Analysis, Opportunity and Forecast, By Chemical Constitution, 2016-2032
- 6.5.1. Eastern Europe Natural Dyes Market Analysis by Chemical Constitution: Introduction
- 6.5.2. Market Size Absolute $ Opportunity Analysis and Forecast, By Chemical Constitution, 2016-2032
- 6.5.3. Indigoid Dyes
- 6.5.4. Anthraquinone Dyes
- 6.5.5. Alpha Naphthoquinones
- 6.5.6. Flavonoids
- 6.5.7. Di-Hydropyrans
- 6.5.8. Anthocyanidins
- 6.5.9. Carotenoids
- 6.6. Eastern Europe Natural Dyes Market Analysis, Opportunity and Forecast, By Application, 2016-2032
- 6.6.1. Eastern Europe Natural Dyes Market Analysis by Application: Introduction
- 6.6.2. Market Size Absolute $ Opportunity Analysis and Forecast, By Application, 2016-2032
- 6.6.3. Textiles & Leather
- 6.6.4. Food and Beverages
- 6.6.5. Cosmetics
- 6.6.6. Pharmaceuticals
- 6.6.7. Others
- 6.7. Eastern Europe Natural Dyes Market Analysis, Opportunity and Forecast, By Country , 2016-2032
- 6.7.1. Eastern Europe Natural Dyes Market Analysis by Country : Introduction
- 6.7.2. Market Size Absolute $ Opportunity Analysis and Forecast, Country , 2016-2032
- 6.7.2.1. Russia
- 6.7.2.2. Poland
- 6.7.2.3. The Czech Republic
- 6.7.2.4. Greece
- 6.7.2.5. Rest of Eastern Europe
- 7. APAC Natural Dyes Market Analysis, Opportunity and Forecast, 2016-2032
- 7.1. APAC Natural Dyes Market Analysis, 2016-2021
- 7.2. APAC Natural Dyes Market Opportunity and Forecast, 2023-2032
- 7.3. APAC Natural Dyes Market Analysis, Opportunity and Forecast, By Source, 2016-2032
- 7.3.1. APAC Natural Dyes Market Analysis by Source: Introduction
- 7.3.2. Market Size Absolute $ Opportunity Analysis and Forecast, By Source, 2016-2032
- 7.3.3. Plants
- 7.3.4. Animals
- 7.3.5. Others
- 7.4. APAC Natural Dyes Market Analysis, Opportunity and Forecast, By Distribution Channel, 2016-2032
- 7.4.1. APAC Natural Dyes Market Analysis by Distribution Channel: Introduction
- 7.4.2. Market Size Absolute $ Opportunity Analysis and Forecast, By Distribution Channel, 2016-2032
- 7.4.3. Retail Stores
- 7.4.4. Online Channels
- 7.4.5. Specialty Stores
- 7.4.6. Others
- 7.5. APAC Natural Dyes Market Analysis, Opportunity and Forecast, By Chemical Constitution, 2016-2032
- 7.5.1. APAC Natural Dyes Market Analysis by Chemical Constitution: Introduction
- 7.5.2. Market Size Absolute $ Opportunity Analysis and Forecast, By Chemical Constitution, 2016-2032
- 7.5.3. Indigoid Dyes
- 7.5.4. Anthraquinone Dyes
- 7.5.5. Alpha Naphthoquinones
- 7.5.6. Flavonoids
- 7.5.7. Di-Hydropyrans
- 7.5.8. Anthocyanidins
- 7.5.9. Carotenoids
- 7.6. APAC Natural Dyes Market Analysis, Opportunity and Forecast, By Application, 2016-2032
- 7.6.1. APAC Natural Dyes Market Analysis by Application: Introduction
- 7.6.2. Market Size Absolute $ Opportunity Analysis and Forecast, By Application, 2016-2032
- 7.6.3. Textiles & Leather
- 7.6.4. Food and Beverages
- 7.6.5. Cosmetics
- 7.6.6. Pharmaceuticals
- 7.6.7. Others
- 7.7. APAC Natural Dyes Market Analysis, Opportunity and Forecast, By Country , 2016-2032
- 7.7.1. APAC Natural Dyes Market Analysis by Country : Introduction
- 7.7.2. Market Size Absolute $ Opportunity Analysis and Forecast, Country , 2016-2032
- 7.7.2.1. China
- 7.7.2.2. Japan
- 7.7.2.3. South Korea
- 7.7.2.4. India
- 7.7.2.5. Australia & New Zeland
- 7.7.2.6. Indonesia
- 7.7.2.7. Malaysia
- 7.7.2.8. Philippines
- 7.7.2.9. Singapore
- 7.7.2.10. Thailand
- 7.7.2.11. Vietnam
- 7.7.2.12. Rest of APAC
- 8. Latin America Natural Dyes Market Analysis, Opportunity and Forecast, 2016-2032
- 8.1. Latin America Natural Dyes Market Analysis, 2016-2021
- 8.2. Latin America Natural Dyes Market Opportunity and Forecast, 2023-2032
- 8.3. Latin America Natural Dyes Market Analysis, Opportunity and Forecast, By Source, 2016-2032
- 8.3.1. Latin America Natural Dyes Market Analysis by Source: Introduction
- 8.3.2. Market Size Absolute $ Opportunity Analysis and Forecast, By Source, 2016-2032
- 8.3.3. Plants
- 8.3.4. Animals
- 8.3.5. Others
- 8.4. Latin America Natural Dyes Market Analysis, Opportunity and Forecast, By Distribution Channel, 2016-2032
- 8.4.1. Latin America Natural Dyes Market Analysis by Distribution Channel: Introduction
- 8.4.2. Market Size Absolute $ Opportunity Analysis and Forecast, By Distribution Channel, 2016-2032
- 8.4.3. Retail Stores
- 8.4.4. Online Channels
- 8.4.5. Specialty Stores
- 8.4.6. Others
- 8.5. Latin America Natural Dyes Market Analysis, Opportunity and Forecast, By Chemical Constitution, 2016-2032
- 8.5.1. Latin America Natural Dyes Market Analysis by Chemical Constitution: Introduction
- 8.5.2. Market Size Absolute $ Opportunity Analysis and Forecast, By Chemical Constitution, 2016-2032
- 8.5.3. Indigoid Dyes
- 8.5.4. Anthraquinone Dyes
- 8.5.5. Alpha Naphthoquinones
- 8.5.6. Flavonoids
- 8.5.7. Di-Hydropyrans
- 8.5.8. Anthocyanidins
- 8.5.9. Carotenoids
- 8.6. Latin America Natural Dyes Market Analysis, Opportunity and Forecast, By Application, 2016-2032
- 8.6.1. Latin America Natural Dyes Market Analysis by Application: Introduction
- 8.6.2. Market Size Absolute $ Opportunity Analysis and Forecast, By Application, 2016-2032
- 8.6.3. Textiles & Leather
- 8.6.4. Food and Beverages
- 8.6.5. Cosmetics
- 8.6.6. Pharmaceuticals
- 8.6.7. Others
- 8.7. Latin America Natural Dyes Market Analysis, Opportunity and Forecast, By Country , 2016-2032
- 8.7.1. Latin America Natural Dyes Market Analysis by Country : Introduction
- 8.7.2. Market Size Absolute $ Opportunity Analysis and Forecast, Country , 2016-2032
- 8.7.2.1. Brazil
- 8.7.2.2. Colombia
- 8.7.2.3. Chile
- 8.7.2.4. Argentina
- 8.7.2.5. Costa Rica
- 8.7.2.6. Rest of Latin America
- 9. Middle East & Africa Natural Dyes Market Analysis, Opportunity and Forecast, 2016-2032
- 9.1. Middle East & Africa Natural Dyes Market Analysis, 2016-2021
- 9.2. Middle East & Africa Natural Dyes Market Opportunity and Forecast, 2023-2032
- 9.3. Middle East & Africa Natural Dyes Market Analysis, Opportunity and Forecast, By Source, 2016-2032
- 9.3.1. Middle East & Africa Natural Dyes Market Analysis by Source: Introduction
- 9.3.2. Market Size Absolute $ Opportunity Analysis and Forecast, By Source, 2016-2032
- 9.3.3. Plants
- 9.3.4. Animals
- 9.3.5. Others
- 9.4. Middle East & Africa Natural Dyes Market Analysis, Opportunity and Forecast, By Distribution Channel, 2016-2032
- 9.4.1. Middle East & Africa Natural Dyes Market Analysis by Distribution Channel: Introduction
- 9.4.2. Market Size Absolute $ Opportunity Analysis and Forecast, By Distribution Channel, 2016-2032
- 9.4.3. Retail Stores
- 9.4.4. Online Channels
- 9.4.5. Specialty Stores
- 9.4.6. Others
- 9.5. Middle East & Africa Natural Dyes Market Analysis, Opportunity and Forecast, By Chemical Constitution, 2016-2032
- 9.5.1. Middle East & Africa Natural Dyes Market Analysis by Chemical Constitution: Introduction
- 9.5.2. Market Size Absolute $ Opportunity Analysis and Forecast, By Chemical Constitution, 2016-2032
- 9.5.3. Indigoid Dyes
- 9.5.4. Anthraquinone Dyes
- 9.5.5. Alpha Naphthoquinones
- 9.5.6. Flavonoids
- 9.5.7. Di-Hydropyrans
- 9.5.8. Anthocyanidins
- 9.5.9. Carotenoids
- 9.6. Middle East & Africa Natural Dyes Market Analysis, Opportunity and Forecast, By Application, 2016-2032
- 9.6.1. Middle East & Africa Natural Dyes Market Analysis by Application: Introduction
- 9.6.2. Market Size Absolute $ Opportunity Analysis and Forecast, By Application, 2016-2032
- 9.6.3. Textiles & Leather
- 9.6.4. Food and Beverages
- 9.6.5. Cosmetics
- 9.6.6. Pharmaceuticals
- 9.6.7. Others
- 9.7. Middle East & Africa Natural Dyes Market Analysis, Opportunity and Forecast, By Country , 2016-2032
- 9.7.1. Middle East & Africa Natural Dyes Market Analysis by Country : Introduction
- 9.7.2. Market Size Absolute $ Opportunity Analysis and Forecast, Country , 2016-2032
- 9.7.2.1. Algeria
- 9.7.2.2. Egypt
- 9.7.2.3. Israel
- 9.7.2.4. Kuwait
- 9.7.2.5. Nigeria
- 9.7.2.6. Saudi Arabia
- 9.7.2.7. South Africa
- 9.7.2.8. Turkey
- 9.7.2.9. The UAE
- 9.7.2.10. Rest of MEA
- 10. Global Natural Dyes Market Analysis, Opportunity and Forecast, By Region , 2016-2032
- 10.1. Global Natural Dyes Market Analysis by Region : Introduction
- 10.2. Market Size Absolute $ Opportunity Analysis and Forecast, By Region , 2016-2032
- 10.2.1. North America
- 10.2.2. Western Europe
- 10.2.3. Eastern Europe
- 10.2.4. APAC
- 10.2.5. Latin America
- 10.2.6. Middle East & Africa
- 11. Global Natural Dyes Market Competitive Landscape, Market Share Analysis, and Company Profiles
- 11.1. Market Share Analysis
- 11.2. Company Profiles
- 11.3. Abbey Color Inc
- 11.3.1. Company Overview
- 11.3.2. Financial Highlights
- 11.3.3. Product Portfolio
- 11.3.4. SWOT Analysis
- 11.3.5. Key Strategies and Developments
- 11.4. AMA Herbal Laboratories
- 11.4.1. Company Overview
- 11.4.2. Financial Highlights
- 11.4.3. Product Portfolio
- 11.4.4. SWOT Analysis
- 11.4.5. Key Strategies and Developments
- 11.5. Aura Herbal Textiles
- 11.5.1. Company Overview
- 11.5.2. Financial Highlights
- 11.5.3. Product Portfolio
- 11.5.4. SWOT Analysis
- 11.5.5. Key Strategies and Developments
- 11.6. Maiwa
- 11.6.1. Company Overview
- 11.6.2. Financial Highlights
- 11.6.3. Product Portfolio
- 11.6.4. SWOT Analysis
- 11.6.5. Key Strategies and Developments
- 11.7. Pylam Products Company
- 11.7.1. Company Overview
- 11.7.2. Financial Highlights
- 11.7.3. Product Portfolio
- 11.7.4. SWOT Analysis
- 11.7.5. Key Strategies and Developments
- 11.8. Sun Food Tech
- 11.8.1. Company Overview
- 11.8.2. Financial Highlights
- 11.8.3. Product Portfolio
- 11.8.4. SWOT Analysis
- 11.8.5. Key Strategies and Developments
- 11.9. GNT Group B.V.
- 11.9.1. Company Overview
- 11.9.2. Financial Highlights
- 11.9.3. Product Portfolio
- 11.9.4. SWOT Analysis
- 11.9.5. Key Strategies and Developments
- 11.10. Stony Creek Colors
- 11.10.1. Company Overview
- 11.10.2. Financial Highlights
- 11.10.3. Product Portfolio
- 11.10.4. SWOT Analysis
- 11.10.5. Key Strategies and Developments
- 11.11. NIG Food Engineering
- 11.11.1. Company Overview
- 11.11.2. Financial Highlights
- 11.11.3. Product Portfolio
- 11.11.4. SWOT Analysis
- 11.11.5. Key Strategies and Developments
- 11.12. Couleurs de Plantes
- 11.12.1. Company Overview
- 11.12.2. Financial Highlights
- 11.12.3. Product Portfolio
- 11.12.4. SWOT Analysis
- 11.12.5. Key Strategies and Developments
- 11.13.1. Company Overview
- 11.13.2. Financial Highlights
- 11.13.3. Product Portfolio
- 11.13.4. SWOT Analysis
- 11.13.5. Key Strategies and Developments
- 11.14. Aurora Silk
- 11.14.1. Company Overview
- 11.14.2. Financial Highlights
- 11.14.3. Product Portfolio
- 11.14.4. SWOT Analysis
- 11.14.5. Key Strategies and Developments
- 11.15. Wild Colours
- 11.15.1. Company Overview
- 11.15.2. Financial Highlights
- 11.15.3. Product Portfolio
- 11.15.4. SWOT Analysis
- 11.15.5. Key Strategies and Developments
- 11.16. Renaissance Dyeing
- 11.16.1. Company Overview
- 11.16.2. Financial Highlights
- 11.16.3. Product Portfolio
- 11.16.4. SWOT Analysis
- 11.16.5. Key Strategies and Developments
- 11.17. Ashford Handicrafts
- 11.17.1. Company Overview
- 11.17.2. Financial Highlights
- 11.17.3. Product Portfolio
- 11.17.4. SWOT Analysis
- 11.17.5. Key Strategies and Developments
- 11.18. Sam vegetable Colours
- 11.18.1. Company Overview
- 11.18.2. Financial Highlights
- 11.18.3. Product Portfolio
- 11.18.4. SWOT Analysis
- 11.18.5. Key Strategies and Developments
- 11.19. Green matter Natural Dye
- 11.19.1. Company Overview
- 11.19.2. Financial Highlights
- 11.19.3. Product Portfolio
- 11.19.4. SWOT Analysis
- 11.19.5. Key Strategies and Developments
- 11.20. Shiva Exim
- 11.20.1. Company Overview
- 11.20.2. Financial Highlights
- 11.20.3. Product Portfolio
- 11.20.4. SWOT Analysis
- 11.20.5. Key Strategies and Developments
- 11.21. Biodye
- 11.21.1. Company Overview
- 11.21.2. Financial Highlights
- 11.21.3. Product Portfolio
- 11.21.4. SWOT Analysis
- 11.21.5. Key Strategies and Developments
- 11.22. BASF SE
- 11.22.1. Company Overview
- 11.22.2. Financial Highlights
- 11.22.3. Product Portfolio
- 11.22.4. SWOT Analysis
- 11.22.5. Key Strategies and Developments
- 12. Assumptions and Acronyms
- 13. Research Methodology
- 14. Contact
"
- List of Figures
- "
- Figure 1: Global Natural Dyes Market Revenue (US$ Mn) Market Share by Source in 2022
- Figure 2: Global Natural Dyes Market Market Attractiveness Analysis by Source, 2016-2032
- Figure 3: Global Natural Dyes Market Revenue (US$ Mn) Market Share by Distribution Channelin 2022
- Figure 4: Global Natural Dyes Market Market Attractiveness Analysis by Distribution Channel, 2016-2032
- Figure 5: Global Natural Dyes Market Revenue (US$ Mn) Market Share by Chemical Constitutionin 2022
- Figure 6: Global Natural Dyes Market Market Attractiveness Analysis by Chemical Constitution, 2016-2032
- Figure 7: Global Natural Dyes Market Revenue (US$ Mn) Market Share by Applicationin 2022
- Figure 8: Global Natural Dyes Market Market Attractiveness Analysis by Application, 2016-2032
- Figure 9: Global Natural Dyes Market Revenue (US$ Mn) Market Share by Region in 2022
- Figure 10: Global Natural Dyes Market Market Attractiveness Analysis by Region, 2016-2032
- Figure 11: Global Natural Dyes Market Market Revenue (US$ Mn) (2016-2032)
- Figure 12: Global Natural Dyes Market Market Revenue (US$ Mn) Comparison by Region (2016-2032)
- Figure 13: Global Natural Dyes Market Market Revenue (US$ Mn) Comparison by Source (2016-2032)
- Figure 14: Global Natural Dyes Market Market Revenue (US$ Mn) Comparison by Distribution Channel (2016-2032)
- Figure 15: Global Natural Dyes Market Market Revenue (US$ Mn) Comparison by Chemical Constitution (2016-2032)
- Figure 16: Global Natural Dyes Market Market Revenue (US$ Mn) Comparison by Application (2016-2032)
- Figure 17: Global Natural Dyes Market Market Y-o-Y Growth Rate Comparison by Region (2016-2032)
- Figure 18: Global Natural Dyes Market Market Y-o-Y Growth Rate Comparison by Source (2016-2032)
- Figure 19: Global Natural Dyes Market Market Y-o-Y Growth Rate Comparison by Distribution Channel (2016-2032)
- Figure 20: Global Natural Dyes Market Market Y-o-Y Growth Rate Comparison by Chemical Constitution (2016-2032)
- Figure 21: Global Natural Dyes Market Market Y-o-Y Growth Rate Comparison by Application (2016-2032)
- Figure 22: Global Natural Dyes Market Market Share Comparison by Region (2016-2032)
- Figure 23: Global Natural Dyes Market Market Share Comparison by Source (2016-2032)
- Figure 24: Global Natural Dyes Market Market Share Comparison by Distribution Channel (2016-2032)
- Figure 25: Global Natural Dyes Market Market Share Comparison by Chemical Constitution (2016-2032)
- Figure 26: Global Natural Dyes Market Market Share Comparison by Application (2016-2032)
- Figure 27: North America Natural Dyes Market Revenue (US$ Mn) Market Share by Sourcein 2022
- Figure 28: North America Natural Dyes Market Market Attractiveness Analysis by Source, 2016-2032
- Figure 29: North America Natural Dyes Market Revenue (US$ Mn) Market Share by Distribution Channelin 2022
- Figure 30: North America Natural Dyes Market Market Attractiveness Analysis by Distribution Channel, 2016-2032
- Figure 31: North America Natural Dyes Market Revenue (US$ Mn) Market Share by Chemical Constitutionin 2022
- Figure 32: North America Natural Dyes Market Market Attractiveness Analysis by Chemical Constitution, 2016-2032
- Figure 33: North America Natural Dyes Market Revenue (US$ Mn) Market Share by Applicationin 2022
- Figure 34: North America Natural Dyes Market Market Attractiveness Analysis by Application, 2016-2032
- Figure 35: North America Natural Dyes Market Revenue (US$ Mn) Market Share by Country in 2022
- Figure 36: North America Natural Dyes Market Market Attractiveness Analysis by Country, 2016-2032
- Figure 37: North America Natural Dyes Market Market Revenue (US$ Mn) (2016-2032)
- Figure 38: North America Natural Dyes Market Market Revenue (US$ Mn) Comparison by Country (2016-2032)
- Figure 39: North America Natural Dyes Market Market Revenue (US$ Mn) Comparison by Source (2016-2032)
- Figure 40: North America Natural Dyes Market Market Revenue (US$ Mn) Comparison by Distribution Channel (2016-2032)
- Figure 41: North America Natural Dyes Market Market Revenue (US$ Mn) Comparison by Chemical Constitution (2016-2032)
- Figure 42: North America Natural Dyes Market Market Revenue (US$ Mn) Comparison by Application (2016-2032)
- Figure 43: North America Natural Dyes Market Market Y-o-Y Growth Rate Comparison by Country (2016-2032)
- Figure 44: North America Natural Dyes Market Market Y-o-Y Growth Rate Comparison by Source (2016-2032)
- Figure 45: North America Natural Dyes Market Market Y-o-Y Growth Rate Comparison by Distribution Channel (2016-2032)
- Figure 46: North America Natural Dyes Market Market Y-o-Y Growth Rate Comparison by Chemical Constitution (2016-2032)
- Figure 47: North America Natural Dyes Market Market Y-o-Y Growth Rate Comparison by Application (2016-2032)
- Figure 48: North America Natural Dyes Market Market Share Comparison by Country (2016-2032)
- Figure 49: North America Natural Dyes Market Market Share Comparison by Source (2016-2032)
- Figure 50: North America Natural Dyes Market Market Share Comparison by Distribution Channel (2016-2032)
- Figure 51: North America Natural Dyes Market Market Share Comparison by Chemical Constitution (2016-2032)
- Figure 52: North America Natural Dyes Market Market Share Comparison by Application (2016-2032)
- Figure 53: Western Europe Natural Dyes Market Revenue (US$ Mn) Market Share by Sourcein 2022
- Figure 54: Western Europe Natural Dyes Market Market Attractiveness Analysis by Source, 2016-2032
- Figure 55: Western Europe Natural Dyes Market Revenue (US$ Mn) Market Share by Distribution Channelin 2022
- Figure 56: Western Europe Natural Dyes Market Market Attractiveness Analysis by Distribution Channel, 2016-2032
- Figure 57: Western Europe Natural Dyes Market Revenue (US$ Mn) Market Share by Chemical Constitutionin 2022
- Figure 58: Western Europe Natural Dyes Market Market Attractiveness Analysis by Chemical Constitution, 2016-2032
- Figure 59: Western Europe Natural Dyes Market Revenue (US$ Mn) Market Share by Applicationin 2022
- Figure 60: Western Europe Natural Dyes Market Market Attractiveness Analysis by Application, 2016-2032
- Figure 61: Western Europe Natural Dyes Market Revenue (US$ Mn) Market Share by Country in 2022
- Figure 62: Western Europe Natural Dyes Market Market Attractiveness Analysis by Country, 2016-2032
- Figure 63: Western Europe Natural Dyes Market Market Revenue (US$ Mn) (2016-2032)
- Figure 64: Western Europe Natural Dyes Market Market Revenue (US$ Mn) Comparison by Country (2016-2032)
- Figure 65: Western Europe Natural Dyes Market Market Revenue (US$ Mn) Comparison by Source (2016-2032)
- Figure 66: Western Europe Natural Dyes Market Market Revenue (US$ Mn) Comparison by Distribution Channel (2016-2032)
- Figure 67: Western Europe Natural Dyes Market Market Revenue (US$ Mn) Comparison by Chemical Constitution (2016-2032)
- Figure 68: Western Europe Natural Dyes Market Market Revenue (US$ Mn) Comparison by Application (2016-2032)
- Figure 69: Western Europe Natural Dyes Market Market Y-o-Y Growth Rate Comparison by Country (2016-2032)
- Figure 70: Western Europe Natural Dyes Market Market Y-o-Y Growth Rate Comparison by Source (2016-2032)
- Figure 71: Western Europe Natural Dyes Market Market Y-o-Y Growth Rate Comparison by Distribution Channel (2016-2032)
- Figure 72: Western Europe Natural Dyes Market Market Y-o-Y Growth Rate Comparison by Chemical Constitution (2016-2032)
- Figure 73: Western Europe Natural Dyes Market Market Y-o-Y Growth Rate Comparison by Application (2016-2032)
- Figure 74: Western Europe Natural Dyes Market Market Share Comparison by Country (2016-2032)
- Figure 75: Western Europe Natural Dyes Market Market Share Comparison by Source (2016-2032)
- Figure 76: Western Europe Natural Dyes Market Market Share Comparison by Distribution Channel (2016-2032)
- Figure 77: Western Europe Natural Dyes Market Market Share Comparison by Chemical Constitution (2016-2032)
- Figure 78: Western Europe Natural Dyes Market Market Share Comparison by Application (2016-2032)
- Figure 79: Eastern Europe Natural Dyes Market Revenue (US$ Mn) Market Share by Sourcein 2022
- Figure 80: Eastern Europe Natural Dyes Market Market Attractiveness Analysis by Source, 2016-2032
- Figure 81: Eastern Europe Natural Dyes Market Revenue (US$ Mn) Market Share by Distribution Channelin 2022
- Figure 82: Eastern Europe Natural Dyes Market Market Attractiveness Analysis by Distribution Channel, 2016-2032
- Figure 83: Eastern Europe Natural Dyes Market Revenue (US$ Mn) Market Share by Chemical Constitutionin 2022
- Figure 84: Eastern Europe Natural Dyes Market Market Attractiveness Analysis by Chemical Constitution, 2016-2032
- Figure 85: Eastern Europe Natural Dyes Market Revenue (US$ Mn) Market Share by Applicationin 2022
- Figure 86: Eastern Europe Natural Dyes Market Market Attractiveness Analysis by Application, 2016-2032
- Figure 87: Eastern Europe Natural Dyes Market Revenue (US$ Mn) Market Share by Country in 2022
- Figure 88: Eastern Europe Natural Dyes Market Market Attractiveness Analysis by Country, 2016-2032
- Figure 89: Eastern Europe Natural Dyes Market Market Revenue (US$ Mn) (2016-2032)
- Figure 90: Eastern Europe Natural Dyes Market Market Revenue (US$ Mn) Comparison by Country (2016-2032)
- Figure 91: Eastern Europe Natural Dyes Market Market Revenue (US$ Mn) Comparison by Source (2016-2032)
- Figure 92: Eastern Europe Natural Dyes Market Market Revenue (US$ Mn) Comparison by Distribution Channel (2016-2032)
- Figure 93: Eastern Europe Natural Dyes Market Market Revenue (US$ Mn) Comparison by Chemical Constitution (2016-2032)
- Figure 94: Eastern Europe Natural Dyes Market Market Revenue (US$ Mn) Comparison by Application (2016-2032)
- Figure 95: Eastern Europe Natural Dyes Market Market Y-o-Y Growth Rate Comparison by Country (2016-2032)
- Figure 96: Eastern Europe Natural Dyes Market Market Y-o-Y Growth Rate Comparison by Source (2016-2032)
- Figure 97: Eastern Europe Natural Dyes Market Market Y-o-Y Growth Rate Comparison by Distribution Channel (2016-2032)
- Figure 98: Eastern Europe Natural Dyes Market Market Y-o-Y Growth Rate Comparison by Chemical Constitution (2016-2032)
- Figure 99: Eastern Europe Natural Dyes Market Market Y-o-Y Growth Rate Comparison by Application (2016-2032)
- Figure 100: Eastern Europe Natural Dyes Market Market Share Comparison by Country (2016-2032)
- Figure 101: Eastern Europe Natural Dyes Market Market Share Comparison by Source (2016-2032)
- Figure 102: Eastern Europe Natural Dyes Market Market Share Comparison by Distribution Channel (2016-2032)
- Figure 103: Eastern Europe Natural Dyes Market Market Share Comparison by Chemical Constitution (2016-2032)
- Figure 104: Eastern Europe Natural Dyes Market Market Share Comparison by Application (2016-2032)
- Figure 105: APAC Natural Dyes Market Revenue (US$ Mn) Market Share by Sourcein 2022
- Figure 106: APAC Natural Dyes Market Market Attractiveness Analysis by Source, 2016-2032
- Figure 107: APAC Natural Dyes Market Revenue (US$ Mn) Market Share by Distribution Channelin 2022
- Figure 108: APAC Natural Dyes Market Market Attractiveness Analysis by Distribution Channel, 2016-2032
- Figure 109: APAC Natural Dyes Market Revenue (US$ Mn) Market Share by Chemical Constitutionin 2022
- Figure 110: APAC Natural Dyes Market Market Attractiveness Analysis by Chemical Constitution, 2016-2032
- Figure 111: APAC Natural Dyes Market Revenue (US$ Mn) Market Share by Applicationin 2022
- Figure 112: APAC Natural Dyes Market Market Attractiveness Analysis by Application, 2016-2032
- Figure 113: APAC Natural Dyes Market Revenue (US$ Mn) Market Share by Country in 2022
- Figure 114: APAC Natural Dyes Market Market Attractiveness Analysis by Country, 2016-2032
- Figure 115: APAC Natural Dyes Market Market Revenue (US$ Mn) (2016-2032)
- Figure 116: APAC Natural Dyes Market Market Revenue (US$ Mn) Comparison by Country (2016-2032)
- Figure 117: APAC Natural Dyes Market Market Revenue (US$ Mn) Comparison by Source (2016-2032)
- Figure 118: APAC Natural Dyes Market Market Revenue (US$ Mn) Comparison by Distribution Channel (2016-2032)
- Figure 119: APAC Natural Dyes Market Market Revenue (US$ Mn) Comparison by Chemical Constitution (2016-2032)
- Figure 120: APAC Natural Dyes Market Market Revenue (US$ Mn) Comparison by Application (2016-2032)
- Figure 121: APAC Natural Dyes Market Market Y-o-Y Growth Rate Comparison by Country (2016-2032)
- Figure 122: APAC Natural Dyes Market Market Y-o-Y Growth Rate Comparison by Source (2016-2032)
- Figure 123: APAC Natural Dyes Market Market Y-o-Y Growth Rate Comparison by Distribution Channel (2016-2032)
- Figure 124: APAC Natural Dyes Market Market Y-o-Y Growth Rate Comparison by Chemical Constitution (2016-2032)
- Figure 125: APAC Natural Dyes Market Market Y-o-Y Growth Rate Comparison by Application (2016-2032)
- Figure 126: APAC Natural Dyes Market Market Share Comparison by Country (2016-2032)
- Figure 127: APAC Natural Dyes Market Market Share Comparison by Source (2016-2032)
- Figure 128: APAC Natural Dyes Market Market Share Comparison by Distribution Channel (2016-2032)
- Figure 129: APAC Natural Dyes Market Market Share Comparison by Chemical Constitution (2016-2032)
- Figure 130: APAC Natural Dyes Market Market Share Comparison by Application (2016-2032)
- Figure 131: Latin America Natural Dyes Market Revenue (US$ Mn) Market Share by Sourcein 2022
- Figure 132: Latin America Natural Dyes Market Market Attractiveness Analysis by Source, 2016-2032
- Figure 133: Latin America Natural Dyes Market Revenue (US$ Mn) Market Share by Distribution Channelin 2022
- Figure 134: Latin America Natural Dyes Market Market Attractiveness Analysis by Distribution Channel, 2016-2032
- Figure 135: Latin America Natural Dyes Market Revenue (US$ Mn) Market Share by Chemical Constitutionin 2022
- Figure 136: Latin America Natural Dyes Market Market Attractiveness Analysis by Chemical Constitution, 2016-2032
- Figure 137: Latin America Natural Dyes Market Revenue (US$ Mn) Market Share by Applicationin 2022
- Figure 138: Latin America Natural Dyes Market Market Attractiveness Analysis by Application, 2016-2032
- Figure 139: Latin America Natural Dyes Market Revenue (US$ Mn) Market Share by Country in 2022
- Figure 140: Latin America Natural Dyes Market Market Attractiveness Analysis by Country, 2016-2032
- Figure 141: Latin America Natural Dyes Market Market Revenue (US$ Mn) (2016-2032)
- Figure 142: Latin America Natural Dyes Market Market Revenue (US$ Mn) Comparison by Country (2016-2032)
- Figure 143: Latin America Natural Dyes Market Market Revenue (US$ Mn) Comparison by Source (2016-2032)
- Figure 144: Latin America Natural Dyes Market Market Revenue (US$ Mn) Comparison by Distribution Channel (2016-2032)
- Figure 145: Latin America Natural Dyes Market Market Revenue (US$ Mn) Comparison by Chemical Constitution (2016-2032)
- Figure 146: Latin America Natural Dyes Market Market Revenue (US$ Mn) Comparison by Application (2016-2032)
- Figure 147: Latin America Natural Dyes Market Market Y-o-Y Growth Rate Comparison by Country (2016-2032)
- Figure 148: Latin America Natural Dyes Market Market Y-o-Y Growth Rate Comparison by Source (2016-2032)
- Figure 149: Latin America Natural Dyes Market Market Y-o-Y Growth Rate Comparison by Distribution Channel (2016-2032)
- Figure 150: Latin America Natural Dyes Market Market Y-o-Y Growth Rate Comparison by Chemical Constitution (2016-2032)
- Figure 151: Latin America Natural Dyes Market Market Y-o-Y Growth Rate Comparison by Application (2016-2032)
- Figure 152: Latin America Natural Dyes Market Market Share Comparison by Country (2016-2032)
- Figure 153: Latin America Natural Dyes Market Market Share Comparison by Source (2016-2032)
- Figure 154: Latin America Natural Dyes Market Market Share Comparison by Distribution Channel (2016-2032)
- Figure 155: Latin America Natural Dyes Market Market Share Comparison by Chemical Constitution (2016-2032)
- Figure 156: Latin America Natural Dyes Market Market Share Comparison by Application (2016-2032)
- Figure 157: Middle East & Africa Natural Dyes Market Revenue (US$ Mn) Market Share by Sourcein 2022
- Figure 158: Middle East & Africa Natural Dyes Market Market Attractiveness Analysis by Source, 2016-2032
- Figure 159: Middle East & Africa Natural Dyes Market Revenue (US$ Mn) Market Share by Distribution Channelin 2022
- Figure 160: Middle East & Africa Natural Dyes Market Market Attractiveness Analysis by Distribution Channel, 2016-2032
- Figure 161: Middle East & Africa Natural Dyes Market Revenue (US$ Mn) Market Share by Chemical Constitutionin 2022
- Figure 162: Middle East & Africa Natural Dyes Market Market Attractiveness Analysis by Chemical Constitution, 2016-2032
- Figure 163: Middle East & Africa Natural Dyes Market Revenue (US$ Mn) Market Share by Applicationin 2022
- Figure 164: Middle East & Africa Natural Dyes Market Market Attractiveness Analysis by Application, 2016-2032
- Figure 165: Middle East & Africa Natural Dyes Market Revenue (US$ Mn) Market Share by Country in 2022
- Figure 166: Middle East & Africa Natural Dyes Market Market Attractiveness Analysis by Country, 2016-2032
- Figure 167: Middle East & Africa Natural Dyes Market Market Revenue (US$ Mn) (2016-2032)
- Figure 168: Middle East & Africa Natural Dyes Market Market Revenue (US$ Mn) Comparison by Country (2016-2032)
- Figure 169: Middle East & Africa Natural Dyes Market Market Revenue (US$ Mn) Comparison by Source (2016-2032)
- Figure 170: Middle East & Africa Natural Dyes Market Market Revenue (US$ Mn) Comparison by Distribution Channel (2016-2032)
- Figure 171: Middle East & Africa Natural Dyes Market Market Revenue (US$ Mn) Comparison by Chemical Constitution (2016-2032)
- Figure 172: Middle East & Africa Natural Dyes Market Market Revenue (US$ Mn) Comparison by Application (2016-2032)
- Figure 173: Middle East & Africa Natural Dyes Market Market Y-o-Y Growth Rate Comparison by Country (2016-2032)
- Figure 174: Middle East & Africa Natural Dyes Market Market Y-o-Y Growth Rate Comparison by Source (2016-2032)
- Figure 175: Middle East & Africa Natural Dyes Market Market Y-o-Y Growth Rate Comparison by Distribution Channel (2016-2032)
- Figure 176: Middle East & Africa Natural Dyes Market Market Y-o-Y Growth Rate Comparison by Chemical Constitution (2016-2032)
- Figure 177: Middle East & Africa Natural Dyes Market Market Y-o-Y Growth Rate Comparison by Application (2016-2032)
- Figure 178: Middle East & Africa Natural Dyes Market Market Share Comparison by Country (2016-2032)
- Figure 179: Middle East & Africa Natural Dyes Market Market Share Comparison by Source (2016-2032)
- Figure 180: Middle East & Africa Natural Dyes Market Market Share Comparison by Distribution Channel (2016-2032)
- Figure 181: Middle East & Africa Natural Dyes Market Market Share Comparison by Chemical Constitution (2016-2032)
- Figure 182: Middle East & Africa Natural Dyes Market Market Share Comparison by Application (2016-2032)
"
- List of Tables
- "
- Table 1: Global Natural Dyes Market Market Comparison by Source (2016-2032)
- Table 2: Global Natural Dyes Market Market Comparison by Distribution Channel (2016-2032)
- Table 3: Global Natural Dyes Market Market Comparison by Chemical Constitution (2016-2032)
- Table 4: Global Natural Dyes Market Market Comparison by Application (2016-2032)
- Table 5: Global Natural Dyes Market Revenue (US$ Mn) Comparison by Region (2016-2032)
- Table 6: Global Natural Dyes Market Market Revenue (US$ Mn) (2016-2032)
- Table 7: Global Natural Dyes Market Market Revenue (US$ Mn) Comparison by Region (2016-2032)
- Table 8: Global Natural Dyes Market Market Revenue (US$ Mn) Comparison by Source (2016-2032)
- Table 9: Global Natural Dyes Market Market Revenue (US$ Mn) Comparison by Distribution Channel (2016-2032)
- Table 10: Global Natural Dyes Market Market Revenue (US$ Mn) Comparison by Chemical Constitution (2016-2032)
- Table 11: Global Natural Dyes Market Market Revenue (US$ Mn) Comparison by Application (2016-2032)
- Table 12: Global Natural Dyes Market Market Y-o-Y Growth Rate Comparison by Region (2016-2032)
- Table 13: Global Natural Dyes Market Market Y-o-Y Growth Rate Comparison by Source (2016-2032)
- Table 14: Global Natural Dyes Market Market Y-o-Y Growth Rate Comparison by Distribution Channel (2016-2032)
- Table 15: Global Natural Dyes Market Market Y-o-Y Growth Rate Comparison by Chemical Constitution (2016-2032)
- Table 16: Global Natural Dyes Market Market Y-o-Y Growth Rate Comparison by Application (2016-2032)
- Table 17: Global Natural Dyes Market Market Share Comparison by Region (2016-2032)
- Table 18: Global Natural Dyes Market Market Share Comparison by Source (2016-2032)
- Table 19: Global Natural Dyes Market Market Share Comparison by Distribution Channel (2016-2032)
- Table 20: Global Natural Dyes Market Market Share Comparison by Chemical Constitution (2016-2032)
- Table 21: Global Natural Dyes Market Market Share Comparison by Application (2016-2032)
- Table 22: North America Natural Dyes Market Market Comparison by Distribution Channel (2016-2032)
- Table 23: North America Natural Dyes Market Market Comparison by Chemical Constitution (2016-2032)
- Table 24: North America Natural Dyes Market Market Comparison by Application (2016-2032)
- Table 25: North America Natural Dyes Market Revenue (US$ Mn) Comparison by Country (2016-2032)
- Table 26: North America Natural Dyes Market Market Revenue (US$ Mn) (2016-2032)
- Table 27: North America Natural Dyes Market Market Revenue (US$ Mn) Comparison by Country (2016-2032)
- Table 28: North America Natural Dyes Market Market Revenue (US$ Mn) Comparison by Source (2016-2032)
- Table 29: North America Natural Dyes Market Market Revenue (US$ Mn) Comparison by Distribution Channel (2016-2032)
- Table 30: North America Natural Dyes Market Market Revenue (US$ Mn) Comparison by Chemical Constitution (2016-2032)
- Table 31: North America Natural Dyes Market Market Revenue (US$ Mn) Comparison by Application (2016-2032)
- Table 32: North America Natural Dyes Market Market Y-o-Y Growth Rate Comparison by Country (2016-2032)
- Table 33: North America Natural Dyes Market Market Y-o-Y Growth Rate Comparison by Source (2016-2032)
- Table 34: North America Natural Dyes Market Market Y-o-Y Growth Rate Comparison by Distribution Channel (2016-2032)
- Table 35: North America Natural Dyes Market Market Y-o-Y Growth Rate Comparison by Chemical Constitution (2016-2032)
- Table 36: North America Natural Dyes Market Market Y-o-Y Growth Rate Comparison by Application (2016-2032)
- Table 37: North America Natural Dyes Market Market Share Comparison by Country (2016-2032)
- Table 38: North America Natural Dyes Market Market Share Comparison by Source (2016-2032)
- Table 39: North America Natural Dyes Market Market Share Comparison by Distribution Channel (2016-2032)
- Table 40: North America Natural Dyes Market Market Share Comparison by Chemical Constitution (2016-2032)
- Table 41: North America Natural Dyes Market Market Share Comparison by Application (2016-2032)
- Table 42: Western Europe Natural Dyes Market Market Comparison by Source (2016-2032)
- Table 43: Western Europe Natural Dyes Market Market Comparison by Distribution Channel (2016-2032)
- Table 44: Western Europe Natural Dyes Market Market Comparison by Chemical Constitution (2016-2032)
- Table 45: Western Europe Natural Dyes Market Market Comparison by Application (2016-2032)
- Table 46: Western Europe Natural Dyes Market Revenue (US$ Mn) Comparison by Country (2016-2032)
- Table 47: Western Europe Natural Dyes Market Market Revenue (US$ Mn) (2016-2032)
- Table 48: Western Europe Natural Dyes Market Market Revenue (US$ Mn) Comparison by Country (2016-2032)
- Table 49: Western Europe Natural Dyes Market Market Revenue (US$ Mn) Comparison by Source (2016-2032)
- Table 50: Western Europe Natural Dyes Market Market Revenue (US$ Mn) Comparison by Distribution Channel (2016-2032)
- Table 51: Western Europe Natural Dyes Market Market Revenue (US$ Mn) Comparison by Chemical Constitution (2016-2032)
- Table 52: Western Europe Natural Dyes Market Market Revenue (US$ Mn) Comparison by Application (2016-2032)
- Table 53: Western Europe Natural Dyes Market Market Y-o-Y Growth Rate Comparison by Country (2016-2032)
- Table 54: Western Europe Natural Dyes Market Market Y-o-Y Growth Rate Comparison by Source (2016-2032)
- Table 55: Western Europe Natural Dyes Market Market Y-o-Y Growth Rate Comparison by Distribution Channel (2016-2032)
- Table 56: Western Europe Natural Dyes Market Market Y-o-Y Growth Rate Comparison by Chemical Constitution (2016-2032)
- Table 57: Western Europe Natural Dyes Market Market Y-o-Y Growth Rate Comparison by Application (2016-2032)
- Table 58: Western Europe Natural Dyes Market Market Share Comparison by Country (2016-2032)
- Table 59: Western Europe Natural Dyes Market Market Share Comparison by Source (2016-2032)
- Table 60: Western Europe Natural Dyes Market Market Share Comparison by Distribution Channel (2016-2032)
- Table 61: Western Europe Natural Dyes Market Market Share Comparison by Chemical Constitution (2016-2032)
- Table 62: Western Europe Natural Dyes Market Market Share Comparison by Application (2016-2032)
- Table 63: Eastern Europe Natural Dyes Market Market Comparison by Source (2016-2032)
- Table 64: Eastern Europe Natural Dyes Market Market Comparison by Distribution Channel (2016-2032)
- Table 65: Eastern Europe Natural Dyes Market Market Comparison by Chemical Constitution (2016-2032)
- Table 66: Eastern Europe Natural Dyes Market Market Comparison by Application (2016-2032)
- Table 67: Eastern Europe Natural Dyes Market Revenue (US$ Mn) Comparison by Country (2016-2032)
- Table 68: Eastern Europe Natural Dyes Market Market Revenue (US$ Mn) (2016-2032)
- Table 69: Eastern Europe Natural Dyes Market Market Revenue (US$ Mn) Comparison by Country (2016-2032)
- Table 70: Eastern Europe Natural Dyes Market Market Revenue (US$ Mn) Comparison by Source (2016-2032)
- Table 71: Eastern Europe Natural Dyes Market Market Revenue (US$ Mn) Comparison by Distribution Channel (2016-2032)
- Table 72: Eastern Europe Natural Dyes Market Market Revenue (US$ Mn) Comparison by Chemical Constitution (2016-2032)
- Table 73: Eastern Europe Natural Dyes Market Market Revenue (US$ Mn) Comparison by Application (2016-2032)
- Table 74: Eastern Europe Natural Dyes Market Market Y-o-Y Growth Rate Comparison by Country (2016-2032)
- Table 75: Eastern Europe Natural Dyes Market Market Y-o-Y Growth Rate Comparison by Source (2016-2032)
- Table 76: Eastern Europe Natural Dyes Market Market Y-o-Y Growth Rate Comparison by Distribution Channel (2016-2032)
- Table 77: Eastern Europe Natural Dyes Market Market Y-o-Y Growth Rate Comparison by Chemical Constitution (2016-2032)
- Table 78: Eastern Europe Natural Dyes Market Market Y-o-Y Growth Rate Comparison by Application (2016-2032)
- Table 79: Eastern Europe Natural Dyes Market Market Share Comparison by Country (2016-2032)
- Table 80: Eastern Europe Natural Dyes Market Market Share Comparison by Source (2016-2032)
- Table 81: Eastern Europe Natural Dyes Market Market Share Comparison by Distribution Channel (2016-2032)
- Table 82: Eastern Europe Natural Dyes Market Market Share Comparison by Chemical Constitution (2016-2032)
- Table 83: Eastern Europe Natural Dyes Market Market Share Comparison by Application (2016-2032)
- Table 84: APAC Natural Dyes Market Market Comparison by Source (2016-2032)
- Table 85: APAC Natural Dyes Market Market Comparison by Distribution Channel (2016-2032)
- Table 86: APAC Natural Dyes Market Market Comparison by Chemical Constitution (2016-2032)
- Table 87: APAC Natural Dyes Market Market Comparison by Application (2016-2032)
- Table 88: APAC Natural Dyes Market Revenue (US$ Mn) Comparison by Country (2016-2032)
- Table 89: APAC Natural Dyes Market Market Revenue (US$ Mn) (2016-2032)
- Table 90: APAC Natural Dyes Market Market Revenue (US$ Mn) Comparison by Country (2016-2032)
- Table 91: APAC Natural Dyes Market Market Revenue (US$ Mn) Comparison by Source (2016-2032)
- Table 92: APAC Natural Dyes Market Market Revenue (US$ Mn) Comparison by Distribution Channel (2016-2032)
- Table 93: APAC Natural Dyes Market Market Revenue (US$ Mn) Comparison by Chemical Constitution (2016-2032)
- Table 94: APAC Natural Dyes Market Market Revenue (US$ Mn) Comparison by Application (2016-2032)
- Table 95: APAC Natural Dyes Market Market Y-o-Y Growth Rate Comparison by Country (2016-2032)
- Table 96: APAC Natural Dyes Market Market Y-o-Y Growth Rate Comparison by Source (2016-2032)
- Table 97: APAC Natural Dyes Market Market Y-o-Y Growth Rate Comparison by Distribution Channel (2016-2032)
- Table 98: APAC Natural Dyes Market Market Y-o-Y Growth Rate Comparison by Chemical Constitution (2016-2032)
- Table 99: APAC Natural Dyes Market Market Y-o-Y Growth Rate Comparison by Application (2016-2032)
- Table 100: APAC Natural Dyes Market Market Share Comparison by Country (2016-2032)
- Table 101: APAC Natural Dyes Market Market Share Comparison by Source (2016-2032)
- Table 102: APAC Natural Dyes Market Market Share Comparison by Distribution Channel (2016-2032)
- Table 103: APAC Natural Dyes Market Market Share Comparison by Chemical Constitution (2016-2032)
- Table 104: APAC Natural Dyes Market Market Share Comparison by Application (2016-2032)
- Table 105: Latin America Natural Dyes Market Market Comparison by Source (2016-2032)
- Table 106: Latin America Natural Dyes Market Market Comparison by Distribution Channel (2016-2032)
- Table 107: Latin America Natural Dyes Market Market Comparison by Chemical Constitution (2016-2032)
- Table 108: Latin America Natural Dyes Market Market Comparison by Application (2016-2032)
- Table 109: Latin America Natural Dyes Market Revenue (US$ Mn) Comparison by Country (2016-2032)
- Table 110: Latin America Natural Dyes Market Market Revenue (US$ Mn) (2016-2032)
- Table 111: Latin America Natural Dyes Market Market Revenue (US$ Mn) Comparison by Country (2016-2032)
- Table 112: Latin America Natural Dyes Market Market Revenue (US$ Mn) Comparison by Source (2016-2032)
- Table 113: Latin America Natural Dyes Market Market Revenue (US$ Mn) Comparison by Distribution Channel (2016-2032)
- Table 114: Latin America Natural Dyes Market Market Revenue (US$ Mn) Comparison by Chemical Constitution (2016-2032)
- Table 115: Latin America Natural Dyes Market Market Revenue (US$ Mn) Comparison by Application (2016-2032)
- Table 116: Latin America Natural Dyes Market Market Y-o-Y Growth Rate Comparison by Country (2016-2032)
- Table 117: Latin America Natural Dyes Market Market Y-o-Y Growth Rate Comparison by Source (2016-2032)
- Table 118: Latin America Natural Dyes Market Market Y-o-Y Growth Rate Comparison by Distribution Channel (2016-2032)
- Table 119: Latin America Natural Dyes Market Market Y-o-Y Growth Rate Comparison by Chemical Constitution (2016-2032)
- Table 120: Latin America Natural Dyes Market Market Y-o-Y Growth Rate Comparison by Application (2016-2032)
- Table 121: Latin America Natural Dyes Market Market Share Comparison by Country (2016-2032)
- Table 122: Latin America Natural Dyes Market Market Share Comparison by Source (2016-2032)
- Table 123: Latin America Natural Dyes Market Market Share Comparison by Distribution Channel (2016-2032)
- Table 124: Latin America Natural Dyes Market Market Share Comparison by Chemical Constitution (2016-2032)
- Table 125: Latin America Natural Dyes Market Market Share Comparison by Application (2016-2032)
- Table 126: Middle East & Africa Natural Dyes Market Market Comparison by Source (2016-2032)
- Table 127: Middle East & Africa Natural Dyes Market Market Comparison by Distribution Channel (2016-2032)
- Table 128: Middle East & Africa Natural Dyes Market Market Comparison by Chemical Constitution (2016-2032)
- Table 129: Middle East & Africa Natural Dyes Market Market Comparison by Application (2016-2032)
- Table 130: Middle East & Africa Natural Dyes Market Revenue (US$ Mn) Comparison by Country (2016-2032)
- Table 131: Middle East & Africa Natural Dyes Market Market Revenue (US$ Mn) (2016-2032)
- Table 132: Middle East & Africa Natural Dyes Market Market Revenue (US$ Mn) Comparison by Country (2016-2032)
- Table 133: Middle East & Africa Natural Dyes Market Market Revenue (US$ Mn) Comparison by Source (2016-2032)
- Table 134: Middle East & Africa Natural Dyes Market Market Revenue (US$ Mn) Comparison by Distribution Channel (2016-2032)
- Table 135: Middle East & Africa Natural Dyes Market Market Revenue (US$ Mn) Comparison by Chemical Constitution (2016-2032)
- Table 136: Middle East & Africa Natural Dyes Market Market Revenue (US$ Mn) Comparison by Application (2016-2032)
- Table 137: Middle East & Africa Natural Dyes Market Market Y-o-Y Growth Rate Comparison by Country (2016-2032)
- Table 138: Middle East & Africa Natural Dyes Market Market Y-o-Y Growth Rate Comparison by Source (2016-2032)
- Table 139: Middle East & Africa Natural Dyes Market Market Y-o-Y Growth Rate Comparison by Distribution Channel (2016-2032)
- Table 140: Middle East & Africa Natural Dyes Market Market Y-o-Y Growth Rate Comparison by Chemical Constitution (2016-2032)
- Table 141: Middle East & Africa Natural Dyes Market Market Y-o-Y Growth Rate Comparison by Application (2016-2032)
- Table 142: Middle East & Africa Natural Dyes Market Market Share Comparison by Country (2016-2032)
- Table 143: Middle East & Africa Natural Dyes Market Market Share Comparison by Source (2016-2032)
- Table 144: Middle East & Africa Natural Dyes Market Market Share Comparison by Distribution Channel (2016-2032)
- Table 145: Middle East & Africa Natural Dyes Market Market Share Comparison by Chemical Constitution (2016-2032)
- Table 146: Middle East & Africa Natural Dyes Market Market Share Comparison by Application (2016-2032)
- 1. Executive Summary
-
- Abbey Color Inc
- AMA Herbal Laboratories
- Aura Herbal Textiles
- Maiwa
- Pylam Products Company
- Sun Food Tech
- GNT Group B.V.
- Stony Creek Colors
- NIG Food Engineering
- Couleurs de Plantes
- Aurora Silk
- Earthues
- Wild Colours
- Renaissance Dyeing
- Ashford Handicrafts
- Sam vegetable Colours
- Green matter Natural Dye
- Shiva Exim
- Biodye
- BASF SE
- DSM N.V.
- Archroma
- Kemin Industries
- Natural Earth Paint
- Colourtex
Our Clients


View Our Licence Options
