
Mobile Operating Systems (OS) Haptic Interface Market By Component (Hardware, Software), By Operating System (Android, iOS (Apple), Windows Mobile, Other Operating Systems), By Device Type (Smartphones, Tablets, Wearable Devices, Automotive Infotainment Systems, Gaming Devices, Other), By Application, By Region And Companies - Industry Segment Outlook, Market Assessment, Competition Scenario, Trends, And Forecast 2023-2032
-
40522
-
Aug 2023
-
137
-


-
This report was compiled by Vishwa Gaul Vishwa is an experienced market research and consulting professional with over 8 years of expertise in the ICT industry, contributing to over 700 reports across telecommunications, software, hardware, and digital solutions. Correspondence Team Lead- ICT Linkedin | Detailed Market research Methodology Our methodology involves a mix of primary research, including interviews with leading mental health experts, and secondary research from reputable medical journals and databases. View Detailed Methodology Page
-
Quick Navigation
Report Overview
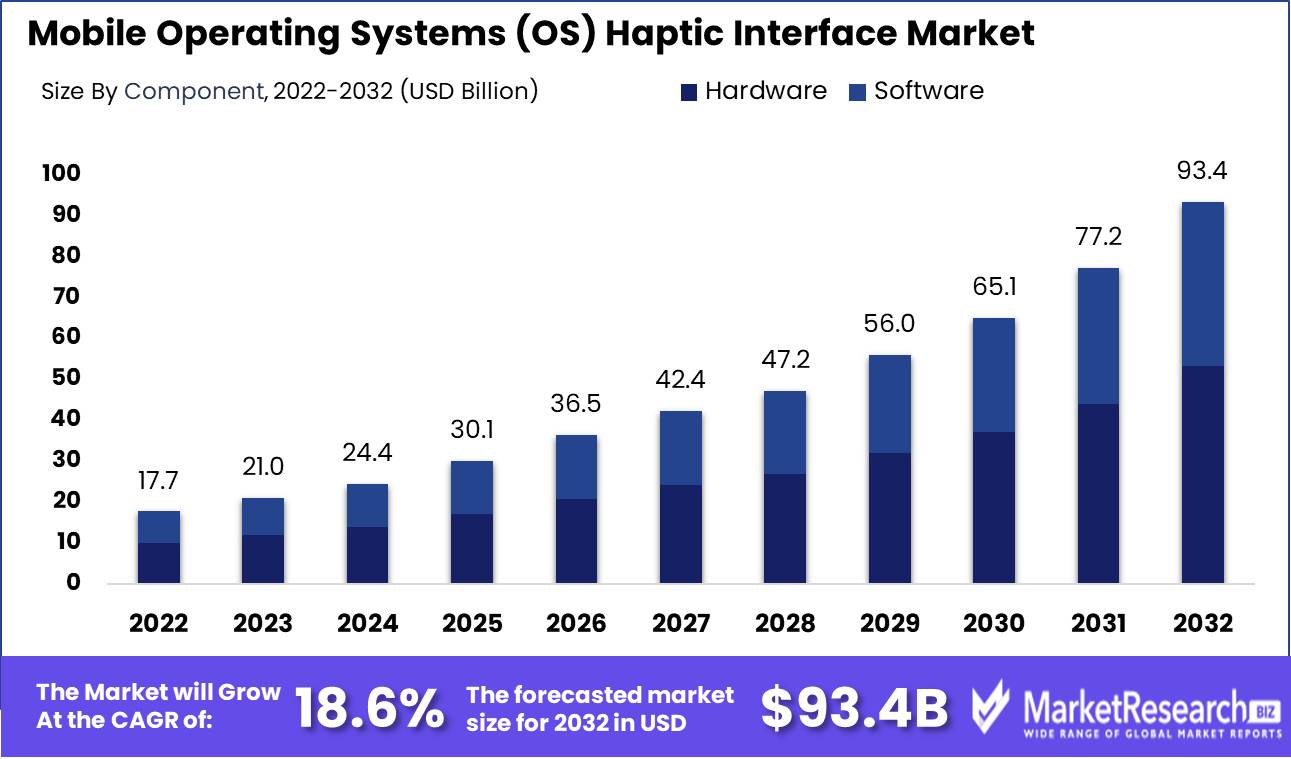
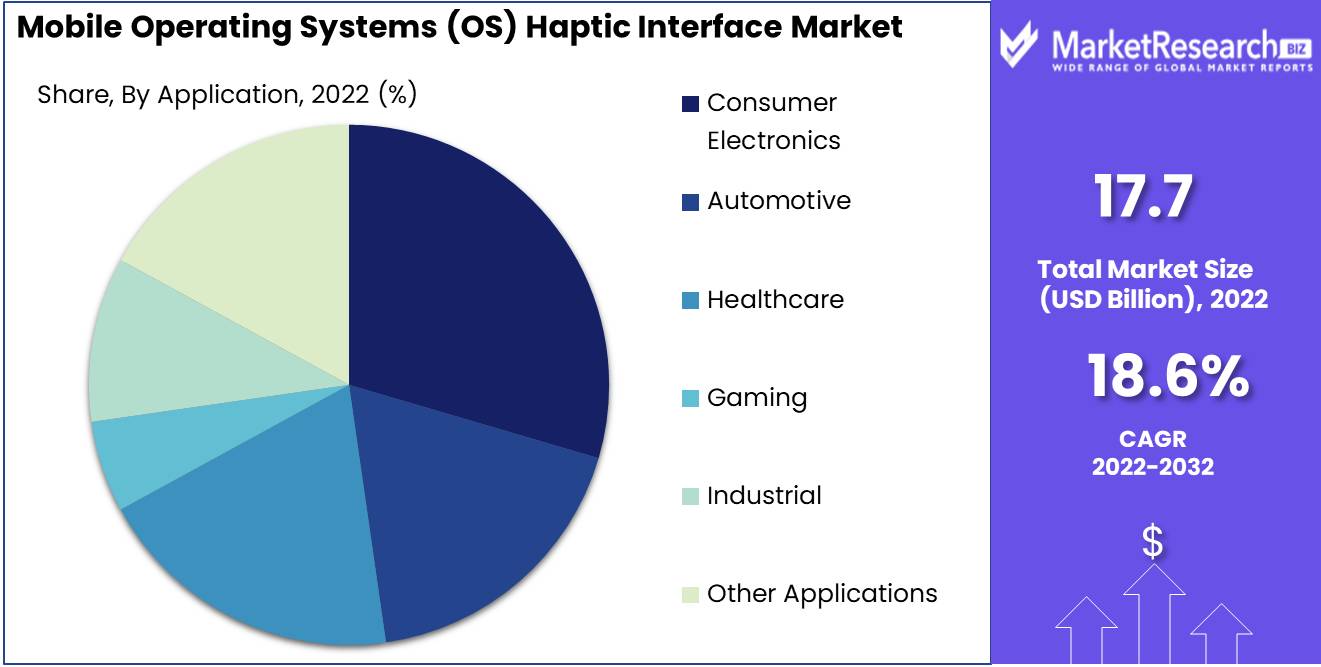
Mobile Operating Systems (OS) Haptic Interface Market size is expected to be worth around USD 93.4 Bn by 2032 from USD 17.7 Bn in 2022, growing at a CAGR of 18.6% during the forecast period from 2023 to 2032.
Mobile operating systems (OS) haptic interface market have become an indispensable component of our daily lives in the contemporary digital era. Tactile feedback is provided to users through the integration of vibrations, motion, and various other stimuli within these interfaces. The mobile OS haptic interface market pertains to the market for haptic feedback systems within mobile operating systems. The main purpose of these interfaces is to enhance the user experience through the provision of interactive and lifelike touch-based feedback. The feedback provided may encompass various sensory modalities, such as vibrations, textures, or simulated movements.
The importance of mobile operating systems (OS) haptic interface market cannot be overstated. Due to the growing prevalence of smartphones and other mobile devices, users have developed an expectation for a smooth and instinctive interaction with these technologies. Haptic interfaces serve to enhance the natural and intuitive aspects of touchscreen interactions by effectively bridging the divide between the digital and physical domains. Furthermore, haptic feedback plays a pivotal role in delivering essential cues and notifications, such as verifying the activation of a button or alerting the user to an impending message or phone call.
The introduction of advanced haptic technologies has emerged as a highly significant innovation in the mobile operating system haptic interface market. Historically, haptic feedback predominantly relied on rudimentary vibrations. Nevertheless, recent technological progress has facilitated the development of more intricate and refined forms of interaction. The implementation of high-definition haptic engines has enabled users to perceive feedback that is more authentic and accurate. This includes the ability to experience sensations like rotating a physical knob or scrolling through a list.
The mobile operating system (OS) haptic interfaces market has garnered substantial investments and integration into various industries' products and services. There is a growing recognition among companies regarding the significance of haptic feedback as a means to distinguish their products and services, as well as to augment user satisfaction. Smartphone manufacturers are integrating haptic feedback technology into their devices in order to enhance their perceived quality and provide users with a more tactile experience. By leveraging haptic technologies, gaming companies are augmenting gameplay and fostering heightened levels of immersion.
The mobile operating systems (OS) haptic interface market has experienced substantial growth as a result of these investments and advancements. In the foreseeable future, it is expected that the market will witness significant expansion as a result of various factors, including the increasing demand for improved user experiences, the growing population of mobile device users, and the continuous advancements in haptic technologies.
Driving factors
Immersive User Experiences
As technology continues to advance, users are no longer satisfied with basic visual and auditory interactions. They seek more immersive experiences that engage multiple senses simultaneously. This demand has led to the development and integration of haptic feedback within mobile operating systems, creating a more dynamic and interactive user interface.
In the mobile operating systems (OS) haptic interface market, developers are constantly innovating to provide users with a tactile experience that complements the visual and auditory stimulation. Haptic feedback technology utilizes vibrations, force, and other physical cues to simulate touch sensations, allowing users to feel and perceive virtual objects as if they were real. This heightened sense of immersion enhances the overall user experience and encourages prolonged engagement.
Advancements in Haptic Feedback Technology
The advancements in haptic feedback technology have been a key driver in the growth of the mobile operating systems (OS) haptic interface market. Manufacturers and developers are continuously improving the capabilities of haptic systems, enabling more nuanced and realistic touch sensations.
One example of this progress can be seen in the incorporation of advanced haptic motors and actuators in mobile devices. These components provide precise and localized vibrations, creating a more refined sense of touch. Additionally, the introduction of high-definition haptics has revolutionized the way users interact with touch screens. These haptics offer a greater range of sensations, allowing users to experience different textures, surfaces, and feedback levels, further enriching the user experience.
Growing Popularity of Touch-Based Interfaces
The rise in touch-based interfaces can be attributed to the increased popularity of smartphones, tablets, and other handheld devices. These devices rely heavily on touch interactions, providing an intuitive and user-friendly experience. The integration of haptic feedback into touch-based interfaces enhances the sense of touch, making interactions more engaging and fulfilling.
With touch-based interfaces becoming the norm in technology, the demand for mobile operating systems with robust haptic capabilities has skyrocketed. Users now expect their devices to respond not only visually and audibly but also kinesthetically. Haptic feedback technology allows developers to bridge the gap between the virtual and physical world, creating a more immersive and satisfying user experience.
Mobile Gaming and Virtual Reality Applications
The mobile gaming industry has come a long way, from simple games to complex and immersive experiences. As the popularity of mobile gaming continues to rise, so does the expectation of a more realistic and engaging gameplay experience. mobile operating systems (OS) haptic interface market provide gamers with a heightened sense of immersion, allowing them to feel the impact of in-game actions and events.
Furthermore, the integration of virtual reality (VR) applications with mobile operating systems has opened up a whole new realm of possibilities. VR allows users to step into virtual worlds and interact with them in a more realistic and immersive way. Haptic feedback complements VR experiences, enabling users to feel the virtual environment and objects within it. The combination of haptics and VR on mobile devices creates an unparalleled level of immersion that was once exclusive to high-end gaming consoles and desktop setups.
Restraining Factors
Technical Limitations in Implementing Haptic Feedback
The mobile operating systems (OS) haptic interface market is constantly evolving, providing users with enhanced tactile experiences on their devices. However, when it comes to implementing haptic feedback on small devices, certain technical limitations arise. These constraints can hinder the seamless integration of haptic feedback technology. Let's explore some of the primary technical limitations faced in this domain.
Power Consumption Concerns
One major restraining factor in implementing haptic feedback on small devices is the potential power consumption concerns. Haptic feedback technology requires additional hardware components and specialized software algorithms, both of which can consume significant amounts of power. Small devices, such as smartphones and wearables, often have limited battery capacities, and adding haptic feedback features may drain the battery faster, impacting the overall user experience. Balancing the desire for immersive tactile feedback with the need for extended battery life is a challenge that developers and manufacturers face in the mobile operating systems (OS) haptic interface market.
Compatibility Issues with Different Operating Systems
Another significant restraining factor in the implementation of haptic feedback on small devices relates to compatibility issues with different operating systems (OS). The mobile operating systems (OS) haptic interface market comprises various platforms, such as Android, iOS, and Windows, each with its unique characteristics and requirements. Ensuring seamless integration of haptic feedback across these diverse operating systems poses a challenge for developers and manufacturers.
Component Analysis
The mobile operating systems (OS) haptic interface market is witnessing a dominant presence of the hardware segment. The haptic interface technology has gained significant popularity among mobile users due to its ability to provide a realistic touch sensation. This has particularly been the case in the hardware segment, where the haptic interface can be seamlessly integrated into the physical buttons and controls of smartphones and other mobile devices.
Consumer trends and behavior towards the hardware segment have also been instrumental in its dominance in the mobile operating systems (OS) haptic interface market. Today's consumers are more conscious about their mobile experiences and expect a high level of interactivity and responsiveness from their devices. The hardware segment fulfills these expectations by providing tactile feedback, making it easier for users to navigate through various applications and functions.
Operating System Analysis
In the mobile operating systems (OS) haptic interface market, the Android segment holds a dominant position. Android OS has become the operating system of choice for a majority of smartphone users worldwide, accounting for a significant market share. This widespread adoption of Android has directly influenced the dominance of the Android segment in the haptic interface market.
Consumer trends and behavior also strongly favor the Android segment in the mobile operating systems (OS) haptic interface market. Android devices offer a wide range of customization options, applications, and functionalities. This appeals to consumers who seek personalized and adaptable mobile experiences. Additionally, the vast ecosystem of Android applications provides ample opportunities for developers to incorporate haptic feedback, further enhancing the user experience.
Device Type Analysis
Among the various device types, smartphones dominate the mobile operating systems (OS) haptic interface market. Smartphones have become an indispensable part of people's lives, serving multiple purposes beyond communication. The haptic interface technology plays a crucial role in enhancing the overall smartphone user experience.
Consumer trends and behavior also point towards the dominance of smartphones in the mobile operating systems (OS) haptic interface market. Consumers increasingly rely on smartphones to perform various tasks, such as browsing the internet, playing games, and accessing social media platforms. The tactile feedback provided by haptic technology enhances these experiences, making smartphones the preferred choice for consumers.
Application Analysis
The consumer electronics segment dominates the mobile operating systems (OS) haptic interface market. Consumer electronics encompass a wide range of devices, including smartphones, tablets, gaming consoles, and wearables, which all rely on haptic technology to enhance user experiences.
Consumer trends and behavior also play a pivotal role in the dominance of the consumer electronics segment in the haptic interface market. The increasing demand for mobile entertainment, gaming, and virtual reality experiences has led to the integration of haptic technology in consumer electronics. Users expect a tactile feedback that adds realism and interactivity to their experiences, making the adoption of haptic interfaces crucial for consumer electronics manufacturers.
Key Market Segments
By Component
- Hardware
- Software
By Operating System
- Android
- iOS (Apple)
- Windows Mobile
- Other Operating Systems
By Device Type
- Smartphones
- Tablets
- Wearable Devices
- Automotive Infotainment Systems
- Gaming Devices
- Other Device Types
By Application
- Consumer Electronics
- Automotive
- Healthcare
- Gaming
- Industrial
- Other Applications
Growth Opportunity
Haptic Technology in Wearable Devices
The surge in wearable technology has given rise to a burgeoning demand for haptic feedback solutions. The seamless incorporation of haptic technology into wearable devices, such as smartwatches and fitness trackers, presents a significant growth opportunity for the mobile operating systems (OS) haptic interface market. By providing tactile feedback, haptic technologies can enrich the user experience and offer a more interactive and immersive feel, revolutionizing the way consumers engage with these devices.
Haptic Feedback in Automotive Infotainment Systems
The automotive industry is undergoing a paradigm shift towards connected and autonomous vehicles. As infotainment systems become more sophisticated, haptic feedback plays a vital role in enhancing driver and passenger experiences. Mobile operating system haptic interfaces can be integrated into touchscreens, control panels, and steering wheels to offer tactile feedback that improves safety, usability, and overall user satisfaction. Collaborations between mobile OS providers, automotive manufacturers, and app developers can accelerate the adoption of haptic technology in this domain, unlocking immense growth potential.
Haptic Feedback in Medical and Healthcare Applications
The healthcare industry is another realm where haptic technology can create substantial growth opportunities. Mobile OS operating system haptic interfaces can enhance medical simulations, surgical training, and rehabilitation processes. By providing a realistic haptic experience, practitioners and patients can gain valuable insights and improve their skills effectively. Moreover, the customization of haptic feedback in medical devices can enable individuals with sensory impairments to experience touch and interact with their environment more meaningfully. Collaboration between haptic technology developers, medical device manufacturers, and healthcare professionals can drive innovation, leading to improved patient outcomes and transformative advancements in the medical field.
Latest Trends
Haptic Feedback in Gaming and Entertainment Apps
Driven by the constant quest for immersive experiences, the gaming and entertainment industries have readily embraced haptic feedback as a means to enhance user engagement. By simulating touch sensations, haptic technology enables users to feel vibrations, textures, and even simulate physical impact. This unlocks a whole new dimension of realism in virtual worlds and plays a vital role in amplifying the excitement and enjoyment of gaming and entertainment applications.
Developers are using haptics to create dynamic feedback tailored to various in-game scenarios. From delicate environmental cues, such as the rustling of leaves or the sensation of raindrops, to intense combat situations where every explosion and collision can be felt, haptic feedback elevates the overall gaming experience. As the demand for more immersive and engaging content grows, developers are continuously exploring innovative ways to leverage haptic technology, leading to a surge in the development of haptic-enabled gaming and entertainment apps.
Haptics in Accessibility Features
Inclusivity and accessibility are at the forefront of technological advancements, and haptic technology plays a significant role in improving the lives of individuals with disabilities. By providing tactile feedback, haptic interfaces enable visually impaired users to navigate digital environments with greater ease and confidence. With the integration of haptic feedback, mobile devices can deliver cues, notifications, and even spatial information through vibrations and touch sensations. Screen readers equipped with haptic feedback allow visually impaired users to feel" the content displayed on their devices, making it easier to access emails, messages, reports, and more.
Customizable Haptic Settings Shaping
Mobile operating system (OS) providers have recognized the significance of haptic technology in enhancing user experiences. As a result, smartphone manufacturers and OS developers have introduced customizable haptic settings, allowing users to personalize their haptic feedback preferences. This market trend has had a profound impact on the mobile OS haptic interface market, as it caters to the diverse preferences and sensitivities of users. With customizable haptic settings, users can adjust the intensity, duration, and even specific haptic patterns to align with their preferences. This level of personalization ensures that each user can fine-tune their haptic feedback experience to match their sensory preferences and requirements."
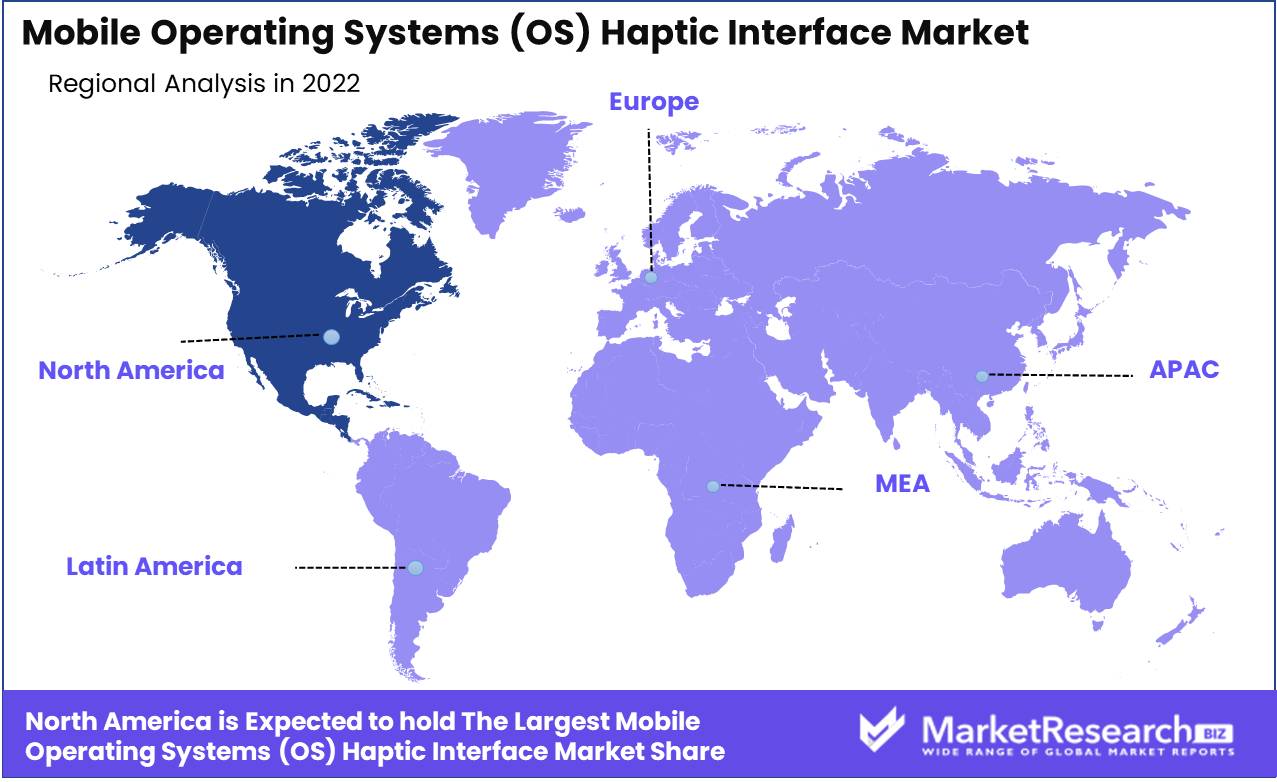
Regional Analysis
North America Region Dominates the mobile operating systems (OS) haptic interface market. In today's technologically advanced era, the mobile industry is witnessing an exponential rise in innovations. One such groundbreaking advancement is the integration of haptic interfaces within mobile operating systems (OS). These haptic interfaces provide users with a tactile feedback experience, enhancing their interaction and overall user experience. Among the various regions across the globe, North America stands out as the dominant player in the mobile OS haptic interface market, revolutionizing the way we interact with our smartphones.
The demand for haptic interfaces in mobile OS has been soaring in recent years due to their ability to simulate the sense of touch, making the interaction with a device more intuitive and engaging. As a result, numerous manufacturers and tech giants have devoted substantial resources to develop and implement this cutting-edge technology into their mobile devices. This increased adoption of haptic interfaces has significantly contributed to the growth of the market, and North America has emerged as the frontier.
North America's dominance in the mobile OS haptic interface market is driven by several factors. Firstly, the region showcases a high concentration of leading mobile device manufacturers, such as Apple and Google. These industry leaders continuously strive to provide their users with innovative features and functionalities, including haptic feedback. Their relentless efforts and significant investments have allowed North America to spearhead the haptic interface revolution.
North American market boasts a tech-savvy and mobile-centric population. Smartphones have become an integral part of people's lives, serving as their primary communication and entertainment tool. Consequently, the demand for immersive user experiences has skyrocketed, and haptic interfaces perfectly fit the bill. The region's consumer base actively seeks devices equipped with haptic feedback, generating a substantial market share and propelling North America to the forefront.
Key Regions and Countries
North America
- US
- Canada
- Mexico
Western Europe
- Germany
- France
- The UK
- Spain
- Italy
- Portugal
- Ireland
- Austria
- Switzerland
- Benelux
- Nordic
- Rest of Western Europe
Eastern Europe
- Russia
- Poland
- The Czech Republic
- Greece
- Rest of Eastern Europe
APAC
- China
- Japan
- South Korea
- India
- Australia & New Zealand
- Indonesia
- Malaysia
- Philippines
- Singapore
- Thailand
- Vietnam
- Rest of APAC
Latin America
- Brazil
- Colombia
- Chile
- Argentina
- Costa Rica
- Rest of Latin America
Middle East & Africa
- Algeria
- Egypt
- Israel
- Kuwait
- Nigeria
- Saudi Arabia
- South Africa
- Turkey
- United Arab Emirates
- Rest of MEA
Key Players Analysis
As experts in mobile operating systems (OS) and haptic interface technologies, we analyze the market leaders. This report will highlight major firms that have advanced mobile OS haptic interfaces. They're shaping mobile device experiences. Come explore Apple Inc., Google LLC, HAPTION U.S., Immersion, 3D Systems Inc., and Nuance Communications Inc.
Apple Inc., a US-based technology business, has innovated mobile devices and operating systems. With its robust haptic feedback engine, their flagship iOS provides a seamless and immersive experience. Apple's Taptic Engine technology improved user engagement and usefulness with precise tactile feedback. Apple has become a leader in the mobile OS haptic interface market by investing in haptic technology research and development.
Google LLC, another major mobile OS participant, is investigating ways to incorporate haptic feedback technology into their Android operating system. Google wants Android users to have a better interactive experience by using their vast resources. Google works with haptic interface technology companies to improve Android smartphones' tactile and intuitive interfaces.
HAPTION U.S. is a leader in industrial haptic interface technology. Their precise and realistic haptic gadgets are crucial in vehicle design, medical simulation, and virtual reality. HAPTION U.S. works with mobile OS developers to integrate haptic feedback into mobile devices to improve virtual environment interaction.
Immersion, a US company, develops innovative touch feedback solutions for mobile devices and other industries. Immersion wants to make mobile OS platforms more immersive and intuitive by adding TouchSense technology. Their haptic technology lets users feel textures, vibrations, and targeted pressure when engaging with their devices, opening up new possibilities for mobile gaming, virtual reality, and other multimedia experiences.
3D Systems Inc., a leader in additive manufacturing and 3D printing, has made important contributions to the haptic interface market. They create realistic tactile experiences using 3D modeling, simulation, and haptic feedback. Their haptic technology has enabled creative applications in healthcare, education, architecture, and entertainment.
Nuance Communications Inc., a voice recognition and natural language processing expert, is participating in the haptic interface market. They develop industry-leading voice recognition software and integrate haptic feedback into mobile devices. Nuance Communication Inc. wants to make mobile operating systems easier to use by merging voice commands with haptic replies.
Top Key Players in Mobile Operating Systems (OS) Haptic Interface Market
- Apple Inc. (U.S.)
- Google LLC (U.S.)
- HAPTION U.S.)
- Immersion (U.S.)
- 3D Systems Inc. (U.S.)
- Nuance Communications Inc. (U.S.)
Recent Development
- In 2020, OnePlus, a popular smartphone maker, acquired Tactus, making ripples in the haptic interface market. Tactus, a prominent haptic interface technology firm, develops novel tactile feedback solutions. OnePlus's acquisition of Tactus showed its dedication to seamless, engaging smartphone experiences.
- In 2021, Samsung and Microsoft collaborated on a new Galaxy haptic interface. This strategic alliance sought to develop cutting-edge haptic interface technologies for Samsung devices. The goal was to improve Galaxy device interactions, touch feedback, and immersion.
- In 2022, Google's haptic interface market dominance was due to their US research expansion. Google continued to explore new haptic technologies to give people new sensory experiences. This expansion showed Google's focus to haptic interface innovation and mobile OS user interaction revolution.
- In 2023, Apple announced a breakthrough iPhone haptic interface recently. Apple's iPhone innovation promises to reinvent touch experiences on mobile devices. Tech fans eagerly await Apple's next haptic interface, which is likely to set new industry norms and challenge competitors.
Report Scope:
Report Features Description Market Value (2022) USD 17.7 Bn Forecast Revenue (2032) USD 93.4 Bn CAGR (2023-2032) 18.6% Base Year for Estimation 2022 Historic Period 2016-2022 Forecast Period 2023-2032 Report Coverage Revenue Forecast, Market Dynamics, COVID-19 Impact, Competitive Landscape, Recent Developments Segments Covered By Component (Hardware, Software), By Operating System (Android, iOS (Apple), Windows Mobile, Other Operating Systems), By Device Type (Smartphones, Tablets, Wearable Devices, Automotive Infotainment Systems, Gaming Devices, Other Device Types), By Application (Consumer Electronics, Automotive, Healthcare, Gaming, Industrial, Other Applications) Regional Analysis North America – The US, Canada, & Mexico; Western Europe – Germany, France, The UK, Spain, Italy, Portugal, Ireland, Austria, Switzerland, Benelux, Nordic, & Rest of Western Europe; Eastern Europe – Russia, Poland, The Czech Republic, Greece, & Rest of Eastern Europe; APAC – China, Japan, South Korea, India, Australia & New Zealand, Indonesia, Malaysia, Philippines, Singapore, Thailand, Vietnam, & Rest of APAC; Latin America – Brazil, Colombia, Chile, Argentina, Costa Rica, & Rest of Latin America; Middle East & Africa – Algeria, Egypt, Israel, Kuwait, Nigeria, Saudi Arabia, South Africa, Turkey, United Arab Emirates, & Rest of MEA Competitive Landscape Apple Inc. (U.S.), Google LLC (U.S.), HAPTION U.S.), Immersion (U.S.), 3D Systems Inc. (U.S.), Nuance Communications Inc. (U.S.) Customization Scope Customization for segments, region/country-level will be provided. Moreover, additional customization can be done based on the requirements. Purchase Options We have three licenses to opt for: Single User License, Multi-User License (Up to 5 Users), Corporate Use License (Unlimited User and Printable PDF) -
- 1. Executive Summary
- 1.1. Definition
- 1.2. Taxonomy
- 1.3. Research Scope
- 1.4. Key Analysis
- 1.5. Key Findings by Major Segments
- 1.6. Top strategies by Major Players
- 2. Global Mobile Operating Systems (OS) Haptic Interface Market Overview
- 2.1. Mobile Operating Systems (OS) Haptic Interface Market Dynamics
- 2.1.1. Drivers
- 2.1.2. Opportunities
- 2.1.3. Restraints
- 2.1.4. Challenges
- 2.2. Macro-economic Factors
- 2.3. Regulatory Framework
- 2.4. Market Investment Feasibility Index
- 2.5. PEST Analysis
- 2.6. PORTER’S Five Force Analysis
- 2.7. Drivers & Restraints Impact Analysis
- 2.8. Industry Chain Analysis
- 2.9. Cost Structure Analysis
- 2.10. Marketing Strategy
- 2.11. Russia-Ukraine War Impact Analysis
- 2.12. Opportunity Map Analysis
- 2.13. Market Competition Scenario Analysis
- 2.14. Product Life Cycle Analysis
- 2.15. Opportunity Orbits
- 2.16. Manufacturer Intensity Map
- 2.17. Major Companies sales by Value & Volume
- 2.1. Mobile Operating Systems (OS) Haptic Interface Market Dynamics
- 3. Global Mobile Operating Systems (OS) Haptic Interface Market Analysis, Opportunity and Forecast, 2016-2032
- 3.1. Global Mobile Operating Systems (OS) Haptic Interface Market Analysis, 2016-2021
- 3.2. Global Mobile Operating Systems (OS) Haptic Interface Market Opportunity and Forecast, 2023-2032
- 3.3. Global Mobile Operating Systems (OS) Haptic Interface Market Analysis, Opportunity and Forecast, By By Component, 2016-2032
- 3.3.1. Global Mobile Operating Systems (OS) Haptic Interface Market Analysis by By Component: Introduction
- 3.3.2. Market Size Absolute $ Opportunity Analysis and Forecast, By By Component, 2016-2032
- 3.3.3. Hardware
- 3.3.4. Software
- 3.4. Global Mobile Operating Systems (OS) Haptic Interface Market Analysis, Opportunity and Forecast, By By Operating System, 2016-2032
- 3.4.1. Global Mobile Operating Systems (OS) Haptic Interface Market Analysis by By Operating System: Introduction
- 3.4.2. Market Size Absolute $ Opportunity Analysis and Forecast, By By Operating System, 2016-2032
- 3.4.3. Android
- 3.4.4. iOS (Apple)
- 3.4.5. Windows Mobile
- 3.4.6. Other Operating Systems
- 3.5. Global Mobile Operating Systems (OS) Haptic Interface Market Analysis, Opportunity and Forecast, By By Device Type, 2016-2032
- 3.5.1. Global Mobile Operating Systems (OS) Haptic Interface Market Analysis by By Device Type: Introduction
- 3.5.2. Market Size Absolute $ Opportunity Analysis and Forecast, By By Device Type, 2016-2032
- 3.5.3. Smartphones
- 3.5.4. Tablets
- 3.5.5. Wearable Devices
- 3.5.6. Automotive Infotainment Systems
- 3.5.7. Gaming Devices
- 3.5.8. Other Device Types
- 3.6. Global Mobile Operating Systems (OS) Haptic Interface Market Analysis, Opportunity and Forecast, By By Application, 2016-2032
- 3.6.1. Global Mobile Operating Systems (OS) Haptic Interface Market Analysis by By Application: Introduction
- 3.6.2. Market Size Absolute $ Opportunity Analysis and Forecast, By By Application, 2016-2032
- 3.6.3. Consumer Electronics
- 3.6.4. Automotive
- 3.6.5. Healthcare
- 3.6.6. Gaming
- 3.6.7. Industrial
- 3.6.8. Other Applications
- 4. North America Mobile Operating Systems (OS) Haptic Interface Market Analysis, Opportunity and Forecast, 2016-2032
- 4.1. North America Mobile Operating Systems (OS) Haptic Interface Market Analysis, 2016-2021
- 4.2. North America Mobile Operating Systems (OS) Haptic Interface Market Opportunity and Forecast, 2023-2032
- 4.3. North America Mobile Operating Systems (OS) Haptic Interface Market Analysis, Opportunity and Forecast, By By Component, 2016-2032
- 4.3.1. North America Mobile Operating Systems (OS) Haptic Interface Market Analysis by By Component: Introduction
- 4.3.2. Market Size Absolute $ Opportunity Analysis and Forecast, By By Component, 2016-2032
- 4.3.3. Hardware
- 4.3.4. Software
- 4.4. North America Mobile Operating Systems (OS) Haptic Interface Market Analysis, Opportunity and Forecast, By By Operating System, 2016-2032
- 4.4.1. North America Mobile Operating Systems (OS) Haptic Interface Market Analysis by By Operating System: Introduction
- 4.4.2. Market Size Absolute $ Opportunity Analysis and Forecast, By By Operating System, 2016-2032
- 4.4.3. Android
- 4.4.4. iOS (Apple)
- 4.4.5. Windows Mobile
- 4.4.6. Other Operating Systems
- 4.5. North America Mobile Operating Systems (OS) Haptic Interface Market Analysis, Opportunity and Forecast, By By Device Type, 2016-2032
- 4.5.1. North America Mobile Operating Systems (OS) Haptic Interface Market Analysis by By Device Type: Introduction
- 4.5.2. Market Size Absolute $ Opportunity Analysis and Forecast, By By Device Type, 2016-2032
- 4.5.3. Smartphones
- 4.5.4. Tablets
- 4.5.5. Wearable Devices
- 4.5.6. Automotive Infotainment Systems
- 4.5.7. Gaming Devices
- 4.5.8. Other Device Types
- 4.6. North America Mobile Operating Systems (OS) Haptic Interface Market Analysis, Opportunity and Forecast, By By Application, 2016-2032
- 4.6.1. North America Mobile Operating Systems (OS) Haptic Interface Market Analysis by By Application: Introduction
- 4.6.2. Market Size Absolute $ Opportunity Analysis and Forecast, By By Application, 2016-2032
- 4.6.3. Consumer Electronics
- 4.6.4. Automotive
- 4.6.5. Healthcare
- 4.6.6. Gaming
- 4.6.7. Industrial
- 4.6.8. Other Applications
- 4.7. North America Mobile Operating Systems (OS) Haptic Interface Market Analysis, Opportunity and Forecast, By Country , 2016-2032
- 4.7.1. North America Mobile Operating Systems (OS) Haptic Interface Market Analysis by Country : Introduction
- 4.7.2. Market Size Absolute $ Opportunity Analysis and Forecast, Country , 2016-2032
- 4.7.2.1. The US
- 4.7.2.2. Canada
- 4.7.2.3. Mexico
- 5. Western Europe Mobile Operating Systems (OS) Haptic Interface Market Analysis, Opportunity and Forecast, 2016-2032
- 5.1. Western Europe Mobile Operating Systems (OS) Haptic Interface Market Analysis, 2016-2021
- 5.2. Western Europe Mobile Operating Systems (OS) Haptic Interface Market Opportunity and Forecast, 2023-2032
- 5.3. Western Europe Mobile Operating Systems (OS) Haptic Interface Market Analysis, Opportunity and Forecast, By By Component, 2016-2032
- 5.3.1. Western Europe Mobile Operating Systems (OS) Haptic Interface Market Analysis by By Component: Introduction
- 5.3.2. Market Size Absolute $ Opportunity Analysis and Forecast, By By Component, 2016-2032
- 5.3.3. Hardware
- 5.3.4. Software
- 5.4. Western Europe Mobile Operating Systems (OS) Haptic Interface Market Analysis, Opportunity and Forecast, By By Operating System, 2016-2032
- 5.4.1. Western Europe Mobile Operating Systems (OS) Haptic Interface Market Analysis by By Operating System: Introduction
- 5.4.2. Market Size Absolute $ Opportunity Analysis and Forecast, By By Operating System, 2016-2032
- 5.4.3. Android
- 5.4.4. iOS (Apple)
- 5.4.5. Windows Mobile
- 5.4.6. Other Operating Systems
- 5.5. Western Europe Mobile Operating Systems (OS) Haptic Interface Market Analysis, Opportunity and Forecast, By By Device Type, 2016-2032
- 5.5.1. Western Europe Mobile Operating Systems (OS) Haptic Interface Market Analysis by By Device Type: Introduction
- 5.5.2. Market Size Absolute $ Opportunity Analysis and Forecast, By By Device Type, 2016-2032
- 5.5.3. Smartphones
- 5.5.4. Tablets
- 5.5.5. Wearable Devices
- 5.5.6. Automotive Infotainment Systems
- 5.5.7. Gaming Devices
- 5.5.8. Other Device Types
- 5.6. Western Europe Mobile Operating Systems (OS) Haptic Interface Market Analysis, Opportunity and Forecast, By By Application, 2016-2032
- 5.6.1. Western Europe Mobile Operating Systems (OS) Haptic Interface Market Analysis by By Application: Introduction
- 5.6.2. Market Size Absolute $ Opportunity Analysis and Forecast, By By Application, 2016-2032
- 5.6.3. Consumer Electronics
- 5.6.4. Automotive
- 5.6.5. Healthcare
- 5.6.6. Gaming
- 5.6.7. Industrial
- 5.6.8. Other Applications
- 5.7. Western Europe Mobile Operating Systems (OS) Haptic Interface Market Analysis, Opportunity and Forecast, By Country , 2016-2032
- 5.7.1. Western Europe Mobile Operating Systems (OS) Haptic Interface Market Analysis by Country : Introduction
- 5.7.2. Market Size Absolute $ Opportunity Analysis and Forecast, Country , 2016-2032
- 5.7.2.1. Germany
- 5.7.2.2. France
- 5.7.2.3. The UK
- 5.7.2.4. Spain
- 5.7.2.5. Italy
- 5.7.2.6. Portugal
- 5.7.2.7. Ireland
- 5.7.2.8. Austria
- 5.7.2.9. Switzerland
- 5.7.2.10. Benelux
- 5.7.2.11. Nordic
- 5.7.2.12. Rest of Western Europe
- 6. Eastern Europe Mobile Operating Systems (OS) Haptic Interface Market Analysis, Opportunity and Forecast, 2016-2032
- 6.1. Eastern Europe Mobile Operating Systems (OS) Haptic Interface Market Analysis, 2016-2021
- 6.2. Eastern Europe Mobile Operating Systems (OS) Haptic Interface Market Opportunity and Forecast, 2023-2032
- 6.3. Eastern Europe Mobile Operating Systems (OS) Haptic Interface Market Analysis, Opportunity and Forecast, By By Component, 2016-2032
- 6.3.1. Eastern Europe Mobile Operating Systems (OS) Haptic Interface Market Analysis by By Component: Introduction
- 6.3.2. Market Size Absolute $ Opportunity Analysis and Forecast, By By Component, 2016-2032
- 6.3.3. Hardware
- 6.3.4. Software
- 6.4. Eastern Europe Mobile Operating Systems (OS) Haptic Interface Market Analysis, Opportunity and Forecast, By By Operating System, 2016-2032
- 6.4.1. Eastern Europe Mobile Operating Systems (OS) Haptic Interface Market Analysis by By Operating System: Introduction
- 6.4.2. Market Size Absolute $ Opportunity Analysis and Forecast, By By Operating System, 2016-2032
- 6.4.3. Android
- 6.4.4. iOS (Apple)
- 6.4.5. Windows Mobile
- 6.4.6. Other Operating Systems
- 6.5. Eastern Europe Mobile Operating Systems (OS) Haptic Interface Market Analysis, Opportunity and Forecast, By By Device Type, 2016-2032
- 6.5.1. Eastern Europe Mobile Operating Systems (OS) Haptic Interface Market Analysis by By Device Type: Introduction
- 6.5.2. Market Size Absolute $ Opportunity Analysis and Forecast, By By Device Type, 2016-2032
- 6.5.3. Smartphones
- 6.5.4. Tablets
- 6.5.5. Wearable Devices
- 6.5.6. Automotive Infotainment Systems
- 6.5.7. Gaming Devices
- 6.5.8. Other Device Types
- 6.6. Eastern Europe Mobile Operating Systems (OS) Haptic Interface Market Analysis, Opportunity and Forecast, By By Application, 2016-2032
- 6.6.1. Eastern Europe Mobile Operating Systems (OS) Haptic Interface Market Analysis by By Application: Introduction
- 6.6.2. Market Size Absolute $ Opportunity Analysis and Forecast, By By Application, 2016-2032
- 6.6.3. Consumer Electronics
- 6.6.4. Automotive
- 6.6.5. Healthcare
- 6.6.6. Gaming
- 6.6.7. Industrial
- 6.6.8. Other Applications
- 6.7. Eastern Europe Mobile Operating Systems (OS) Haptic Interface Market Analysis, Opportunity and Forecast, By Country , 2016-2032
- 6.7.1. Eastern Europe Mobile Operating Systems (OS) Haptic Interface Market Analysis by Country : Introduction
- 6.7.2. Market Size Absolute $ Opportunity Analysis and Forecast, Country , 2016-2032
- 6.7.2.1. Russia
- 6.7.2.2. Poland
- 6.7.2.3. The Czech Republic
- 6.7.2.4. Greece
- 6.7.2.5. Rest of Eastern Europe
- 7. APAC Mobile Operating Systems (OS) Haptic Interface Market Analysis, Opportunity and Forecast, 2016-2032
- 7.1. APAC Mobile Operating Systems (OS) Haptic Interface Market Analysis, 2016-2021
- 7.2. APAC Mobile Operating Systems (OS) Haptic Interface Market Opportunity and Forecast, 2023-2032
- 7.3. APAC Mobile Operating Systems (OS) Haptic Interface Market Analysis, Opportunity and Forecast, By By Component, 2016-2032
- 7.3.1. APAC Mobile Operating Systems (OS) Haptic Interface Market Analysis by By Component: Introduction
- 7.3.2. Market Size Absolute $ Opportunity Analysis and Forecast, By By Component, 2016-2032
- 7.3.3. Hardware
- 7.3.4. Software
- 7.4. APAC Mobile Operating Systems (OS) Haptic Interface Market Analysis, Opportunity and Forecast, By By Operating System, 2016-2032
- 7.4.1. APAC Mobile Operating Systems (OS) Haptic Interface Market Analysis by By Operating System: Introduction
- 7.4.2. Market Size Absolute $ Opportunity Analysis and Forecast, By By Operating System, 2016-2032
- 7.4.3. Android
- 7.4.4. iOS (Apple)
- 7.4.5. Windows Mobile
- 7.4.6. Other Operating Systems
- 7.5. APAC Mobile Operating Systems (OS) Haptic Interface Market Analysis, Opportunity and Forecast, By By Device Type, 2016-2032
- 7.5.1. APAC Mobile Operating Systems (OS) Haptic Interface Market Analysis by By Device Type: Introduction
- 7.5.2. Market Size Absolute $ Opportunity Analysis and Forecast, By By Device Type, 2016-2032
- 7.5.3. Smartphones
- 7.5.4. Tablets
- 7.5.5. Wearable Devices
- 7.5.6. Automotive Infotainment Systems
- 7.5.7. Gaming Devices
- 7.5.8. Other Device Types
- 7.6. APAC Mobile Operating Systems (OS) Haptic Interface Market Analysis, Opportunity and Forecast, By By Application, 2016-2032
- 7.6.1. APAC Mobile Operating Systems (OS) Haptic Interface Market Analysis by By Application: Introduction
- 7.6.2. Market Size Absolute $ Opportunity Analysis and Forecast, By By Application, 2016-2032
- 7.6.3. Consumer Electronics
- 7.6.4. Automotive
- 7.6.5. Healthcare
- 7.6.6. Gaming
- 7.6.7. Industrial
- 7.6.8. Other Applications
- 7.7. APAC Mobile Operating Systems (OS) Haptic Interface Market Analysis, Opportunity and Forecast, By Country , 2016-2032
- 7.7.1. APAC Mobile Operating Systems (OS) Haptic Interface Market Analysis by Country : Introduction
- 7.7.2. Market Size Absolute $ Opportunity Analysis and Forecast, Country , 2016-2032
- 7.7.2.1. China
- 7.7.2.2. Japan
- 7.7.2.3. South Korea
- 7.7.2.4. India
- 7.7.2.5. Australia & New Zeland
- 7.7.2.6. Indonesia
- 7.7.2.7. Malaysia
- 7.7.2.8. Philippines
- 7.7.2.9. Singapore
- 7.7.2.10. Thailand
- 7.7.2.11. Vietnam
- 7.7.2.12. Rest of APAC
- 8. Latin America Mobile Operating Systems (OS) Haptic Interface Market Analysis, Opportunity and Forecast, 2016-2032
- 8.1. Latin America Mobile Operating Systems (OS) Haptic Interface Market Analysis, 2016-2021
- 8.2. Latin America Mobile Operating Systems (OS) Haptic Interface Market Opportunity and Forecast, 2023-2032
- 8.3. Latin America Mobile Operating Systems (OS) Haptic Interface Market Analysis, Opportunity and Forecast, By By Component, 2016-2032
- 8.3.1. Latin America Mobile Operating Systems (OS) Haptic Interface Market Analysis by By Component: Introduction
- 8.3.2. Market Size Absolute $ Opportunity Analysis and Forecast, By By Component, 2016-2032
- 8.3.3. Hardware
- 8.3.4. Software
- 8.4. Latin America Mobile Operating Systems (OS) Haptic Interface Market Analysis, Opportunity and Forecast, By By Operating System, 2016-2032
- 8.4.1. Latin America Mobile Operating Systems (OS) Haptic Interface Market Analysis by By Operating System: Introduction
- 8.4.2. Market Size Absolute $ Opportunity Analysis and Forecast, By By Operating System, 2016-2032
- 8.4.3. Android
- 8.4.4. iOS (Apple)
- 8.4.5. Windows Mobile
- 8.4.6. Other Operating Systems
- 8.5. Latin America Mobile Operating Systems (OS) Haptic Interface Market Analysis, Opportunity and Forecast, By By Device Type, 2016-2032
- 8.5.1. Latin America Mobile Operating Systems (OS) Haptic Interface Market Analysis by By Device Type: Introduction
- 8.5.2. Market Size Absolute $ Opportunity Analysis and Forecast, By By Device Type, 2016-2032
- 8.5.3. Smartphones
- 8.5.4. Tablets
- 8.5.5. Wearable Devices
- 8.5.6. Automotive Infotainment Systems
- 8.5.7. Gaming Devices
- 8.5.8. Other Device Types
- 8.6. Latin America Mobile Operating Systems (OS) Haptic Interface Market Analysis, Opportunity and Forecast, By By Application, 2016-2032
- 8.6.1. Latin America Mobile Operating Systems (OS) Haptic Interface Market Analysis by By Application: Introduction
- 8.6.2. Market Size Absolute $ Opportunity Analysis and Forecast, By By Application, 2016-2032
- 8.6.3. Consumer Electronics
- 8.6.4. Automotive
- 8.6.5. Healthcare
- 8.6.6. Gaming
- 8.6.7. Industrial
- 8.6.8. Other Applications
- 8.7. Latin America Mobile Operating Systems (OS) Haptic Interface Market Analysis, Opportunity and Forecast, By Country , 2016-2032
- 8.7.1. Latin America Mobile Operating Systems (OS) Haptic Interface Market Analysis by Country : Introduction
- 8.7.2. Market Size Absolute $ Opportunity Analysis and Forecast, Country , 2016-2032
- 8.7.2.1. Brazil
- 8.7.2.2. Colombia
- 8.7.2.3. Chile
- 8.7.2.4. Argentina
- 8.7.2.5. Costa Rica
- 8.7.2.6. Rest of Latin America
- 9. Middle East & Africa Mobile Operating Systems (OS) Haptic Interface Market Analysis, Opportunity and Forecast, 2016-2032
- 9.1. Middle East & Africa Mobile Operating Systems (OS) Haptic Interface Market Analysis, 2016-2021
- 9.2. Middle East & Africa Mobile Operating Systems (OS) Haptic Interface Market Opportunity and Forecast, 2023-2032
- 9.3. Middle East & Africa Mobile Operating Systems (OS) Haptic Interface Market Analysis, Opportunity and Forecast, By By Component, 2016-2032
- 9.3.1. Middle East & Africa Mobile Operating Systems (OS) Haptic Interface Market Analysis by By Component: Introduction
- 9.3.2. Market Size Absolute $ Opportunity Analysis and Forecast, By By Component, 2016-2032
- 9.3.3. Hardware
- 9.3.4. Software
- 9.4. Middle East & Africa Mobile Operating Systems (OS) Haptic Interface Market Analysis, Opportunity and Forecast, By By Operating System, 2016-2032
- 9.4.1. Middle East & Africa Mobile Operating Systems (OS) Haptic Interface Market Analysis by By Operating System: Introduction
- 9.4.2. Market Size Absolute $ Opportunity Analysis and Forecast, By By Operating System, 2016-2032
- 9.4.3. Android
- 9.4.4. iOS (Apple)
- 9.4.5. Windows Mobile
- 9.4.6. Other Operating Systems
- 9.5. Middle East & Africa Mobile Operating Systems (OS) Haptic Interface Market Analysis, Opportunity and Forecast, By By Device Type, 2016-2032
- 9.5.1. Middle East & Africa Mobile Operating Systems (OS) Haptic Interface Market Analysis by By Device Type: Introduction
- 9.5.2. Market Size Absolute $ Opportunity Analysis and Forecast, By By Device Type, 2016-2032
- 9.5.3. Smartphones
- 9.5.4. Tablets
- 9.5.5. Wearable Devices
- 9.5.6. Automotive Infotainment Systems
- 9.5.7. Gaming Devices
- 9.5.8. Other Device Types
- 9.6. Middle East & Africa Mobile Operating Systems (OS) Haptic Interface Market Analysis, Opportunity and Forecast, By By Application, 2016-2032
- 9.6.1. Middle East & Africa Mobile Operating Systems (OS) Haptic Interface Market Analysis by By Application: Introduction
- 9.6.2. Market Size Absolute $ Opportunity Analysis and Forecast, By By Application, 2016-2032
- 9.6.3. Consumer Electronics
- 9.6.4. Automotive
- 9.6.5. Healthcare
- 9.6.6. Gaming
- 9.6.7. Industrial
- 9.6.8. Other Applications
- 9.7. Middle East & Africa Mobile Operating Systems (OS) Haptic Interface Market Analysis, Opportunity and Forecast, By Country , 2016-2032
- 9.7.1. Middle East & Africa Mobile Operating Systems (OS) Haptic Interface Market Analysis by Country : Introduction
- 9.7.2. Market Size Absolute $ Opportunity Analysis and Forecast, Country , 2016-2032
- 9.7.2.1. Algeria
- 9.7.2.2. Egypt
- 9.7.2.3. Israel
- 9.7.2.4. Kuwait
- 9.7.2.5. Nigeria
- 9.7.2.6. Saudi Arabia
- 9.7.2.7. South Africa
- 9.7.2.8. Turkey
- 9.7.2.9. The UAE
- 9.7.2.10. Rest of MEA
- 10. Global Mobile Operating Systems (OS) Haptic Interface Market Analysis, Opportunity and Forecast, By Region , 2016-2032
- 10.1. Global Mobile Operating Systems (OS) Haptic Interface Market Analysis by Region : Introduction
- 10.2. Market Size Absolute $ Opportunity Analysis and Forecast, By Region , 2016-2032
- 10.2.1. North America
- 10.2.2. Western Europe
- 10.2.3. Eastern Europe
- 10.2.4. APAC
- 10.2.5. Latin America
- 10.2.6. Middle East & Africa
- 11. Global Mobile Operating Systems (OS) Haptic Interface Market Competitive Landscape, Market Share Analysis, and Company Profiles
- 11.1. Market Share Analysis
- 11.2. Company Profiles
- 11.3. Apple Inc. (U.S.)
- 11.3.1. Company Overview
- 11.3.2. Financial Highlights
- 11.3.3. Product Portfolio
- 11.3.4. SWOT Analysis
- 11.3.5. Key Strategies and Developments
- 11.4. Google LLC (U.S.)
- 11.4.1. Company Overview
- 11.4.2. Financial Highlights
- 11.4.3. Product Portfolio
- 11.4.4. SWOT Analysis
- 11.4.5. Key Strategies and Developments
- 11.5. HAPTION U.S.)
- 11.5.1. Company Overview
- 11.5.2. Financial Highlights
- 11.5.3. Product Portfolio
- 11.5.4. SWOT Analysis
- 11.5.5. Key Strategies and Developments
- 11.6. Immersion (U.S.)
- 11.6.1. Company Overview
- 11.6.2. Financial Highlights
- 11.6.3. Product Portfolio
- 11.6.4. SWOT Analysis
- 11.6.5. Key Strategies and Developments
- 11.7. 3D Systems Inc. (U.S.)
- 11.7.1. Company Overview
- 11.7.2. Financial Highlights
- 11.7.3. Product Portfolio
- 11.7.4. SWOT Analysis
- 11.7.5. Key Strategies and Developments
- 11.8. Nuance Communications Inc. (U.S.)
- 11.8.1. Company Overview
- 11.8.2. Financial Highlights
- 11.8.3. Product Portfolio
- 11.8.4. SWOT Analysis
- 11.8.5. Key Strategies and Developments
- 12. Assumptions and Acronyms
- 13. Research Methodology
- 14. Contact
- List of Figures
- Figure 1: Global Mobile Operating Systems (OS) Haptic Interface Market Revenue (US$ Mn) Market Share by By Component in 2022
- Figure 2: Global Mobile Operating Systems (OS) Haptic Interface Market Attractiveness Analysis by By Component, 2016-2032
- Figure 3: Global Mobile Operating Systems (OS) Haptic Interface Market Revenue (US$ Mn) Market Share by By Operating Systemin 2022
- Figure 4: Global Mobile Operating Systems (OS) Haptic Interface Market Attractiveness Analysis by By Operating System, 2016-2032
- Figure 5: Global Mobile Operating Systems (OS) Haptic Interface Market Revenue (US$ Mn) Market Share by By Device Typein 2022
- Figure 6: Global Mobile Operating Systems (OS) Haptic Interface Market Attractiveness Analysis by By Device Type, 2016-2032
- Figure 7: Global Mobile Operating Systems (OS) Haptic Interface Market Revenue (US$ Mn) Market Share by By Applicationin 2022
- Figure 8: Global Mobile Operating Systems (OS) Haptic Interface Market Attractiveness Analysis by By Application, 2016-2032
- Figure 9: Global Mobile Operating Systems (OS) Haptic Interface Market Revenue (US$ Mn) Market Share by Region in 2022
- Figure 10: Global Mobile Operating Systems (OS) Haptic Interface Market Attractiveness Analysis by Region, 2016-2032
- Figure 11: Global Mobile Operating Systems (OS) Haptic Interface Market Revenue (US$ Mn) (2016-2032)
- Figure 12: Global Mobile Operating Systems (OS) Haptic Interface Market Revenue (US$ Mn) Comparison by Region (2016-2032)
- Figure 13: Global Mobile Operating Systems (OS) Haptic Interface Market Revenue (US$ Mn) Comparison by By Component (2016-2032)
- Figure 14: Global Mobile Operating Systems (OS) Haptic Interface Market Revenue (US$ Mn) Comparison by By Operating System (2016-2032)
- Figure 15: Global Mobile Operating Systems (OS) Haptic Interface Market Revenue (US$ Mn) Comparison by By Device Type (2016-2032)
- Figure 16: Global Mobile Operating Systems (OS) Haptic Interface Market Revenue (US$ Mn) Comparison by By Application (2016-2032)
- Figure 17: Global Mobile Operating Systems (OS) Haptic Interface Market Y-o-Y Growth Rate Comparison by Region (2016-2032)
- Figure 18: Global Mobile Operating Systems (OS) Haptic Interface Market Y-o-Y Growth Rate Comparison by By Component (2016-2032)
- Figure 19: Global Mobile Operating Systems (OS) Haptic Interface Market Y-o-Y Growth Rate Comparison by By Operating System (2016-2032)
- Figure 20: Global Mobile Operating Systems (OS) Haptic Interface Market Y-o-Y Growth Rate Comparison by By Device Type (2016-2032)
- Figure 21: Global Mobile Operating Systems (OS) Haptic Interface Market Y-o-Y Growth Rate Comparison by By Application (2016-2032)
- Figure 22: Global Mobile Operating Systems (OS) Haptic Interface Market Share Comparison by Region (2016-2032)
- Figure 23: Global Mobile Operating Systems (OS) Haptic Interface Market Share Comparison by By Component (2016-2032)
- Figure 24: Global Mobile Operating Systems (OS) Haptic Interface Market Share Comparison by By Operating System (2016-2032)
- Figure 25: Global Mobile Operating Systems (OS) Haptic Interface Market Share Comparison by By Device Type (2016-2032)
- Figure 26: Global Mobile Operating Systems (OS) Haptic Interface Market Share Comparison by By Application (2016-2032)
- Figure 27: North America Mobile Operating Systems (OS) Haptic Interface Market Revenue (US$ Mn) Market Share by By Componentin 2022
- Figure 28: North America Mobile Operating Systems (OS) Haptic Interface Market Attractiveness Analysis by By Component, 2016-2032
- Figure 29: North America Mobile Operating Systems (OS) Haptic Interface Market Revenue (US$ Mn) Market Share by By Operating Systemin 2022
- Figure 30: North America Mobile Operating Systems (OS) Haptic Interface Market Attractiveness Analysis by By Operating System, 2016-2032
- Figure 31: North America Mobile Operating Systems (OS) Haptic Interface Market Revenue (US$ Mn) Market Share by By Device Typein 2022
- Figure 32: North America Mobile Operating Systems (OS) Haptic Interface Market Attractiveness Analysis by By Device Type, 2016-2032
- Figure 33: North America Mobile Operating Systems (OS) Haptic Interface Market Revenue (US$ Mn) Market Share by By Applicationin 2022
- Figure 34: North America Mobile Operating Systems (OS) Haptic Interface Market Attractiveness Analysis by By Application, 2016-2032
- Figure 35: North America Mobile Operating Systems (OS) Haptic Interface Market Revenue (US$ Mn) Market Share by Country in 2022
- Figure 36: North America Mobile Operating Systems (OS) Haptic Interface Market Attractiveness Analysis by Country, 2016-2032
- Figure 37: North America Mobile Operating Systems (OS) Haptic Interface Market Revenue (US$ Mn) (2016-2032)
- Figure 38: North America Mobile Operating Systems (OS) Haptic Interface Market Revenue (US$ Mn) Comparison by Country (2016-2032)
- Figure 39: North America Mobile Operating Systems (OS) Haptic Interface Market Revenue (US$ Mn) Comparison by By Component (2016-2032)
- Figure 40: North America Mobile Operating Systems (OS) Haptic Interface Market Revenue (US$ Mn) Comparison by By Operating System (2016-2032)
- Figure 41: North America Mobile Operating Systems (OS) Haptic Interface Market Revenue (US$ Mn) Comparison by By Device Type (2016-2032)
- Figure 42: North America Mobile Operating Systems (OS) Haptic Interface Market Revenue (US$ Mn) Comparison by By Application (2016-2032)
- Figure 43: North America Mobile Operating Systems (OS) Haptic Interface Market Y-o-Y Growth Rate Comparison by Country (2016-2032)
- Figure 44: North America Mobile Operating Systems (OS) Haptic Interface Market Y-o-Y Growth Rate Comparison by By Component (2016-2032)
- Figure 45: North America Mobile Operating Systems (OS) Haptic Interface Market Y-o-Y Growth Rate Comparison by By Operating System (2016-2032)
- Figure 46: North America Mobile Operating Systems (OS) Haptic Interface Market Y-o-Y Growth Rate Comparison by By Device Type (2016-2032)
- Figure 47: North America Mobile Operating Systems (OS) Haptic Interface Market Y-o-Y Growth Rate Comparison by By Application (2016-2032)
- Figure 48: North America Mobile Operating Systems (OS) Haptic Interface Market Share Comparison by Country (2016-2032)
- Figure 49: North America Mobile Operating Systems (OS) Haptic Interface Market Share Comparison by By Component (2016-2032)
- Figure 50: North America Mobile Operating Systems (OS) Haptic Interface Market Share Comparison by By Operating System (2016-2032)
- Figure 51: North America Mobile Operating Systems (OS) Haptic Interface Market Share Comparison by By Device Type (2016-2032)
- Figure 52: North America Mobile Operating Systems (OS) Haptic Interface Market Share Comparison by By Application (2016-2032)
- Figure 53: Western Europe Mobile Operating Systems (OS) Haptic Interface Market Revenue (US$ Mn) Market Share by By Componentin 2022
- Figure 54: Western Europe Mobile Operating Systems (OS) Haptic Interface Market Attractiveness Analysis by By Component, 2016-2032
- Figure 55: Western Europe Mobile Operating Systems (OS) Haptic Interface Market Revenue (US$ Mn) Market Share by By Operating Systemin 2022
- Figure 56: Western Europe Mobile Operating Systems (OS) Haptic Interface Market Attractiveness Analysis by By Operating System, 2016-2032
- Figure 57: Western Europe Mobile Operating Systems (OS) Haptic Interface Market Revenue (US$ Mn) Market Share by By Device Typein 2022
- Figure 58: Western Europe Mobile Operating Systems (OS) Haptic Interface Market Attractiveness Analysis by By Device Type, 2016-2032
- Figure 59: Western Europe Mobile Operating Systems (OS) Haptic Interface Market Revenue (US$ Mn) Market Share by By Applicationin 2022
- Figure 60: Western Europe Mobile Operating Systems (OS) Haptic Interface Market Attractiveness Analysis by By Application, 2016-2032
- Figure 61: Western Europe Mobile Operating Systems (OS) Haptic Interface Market Revenue (US$ Mn) Market Share by Country in 2022
- Figure 62: Western Europe Mobile Operating Systems (OS) Haptic Interface Market Attractiveness Analysis by Country, 2016-2032
- Figure 63: Western Europe Mobile Operating Systems (OS) Haptic Interface Market Revenue (US$ Mn) (2016-2032)
- Figure 64: Western Europe Mobile Operating Systems (OS) Haptic Interface Market Revenue (US$ Mn) Comparison by Country (2016-2032)
- Figure 65: Western Europe Mobile Operating Systems (OS) Haptic Interface Market Revenue (US$ Mn) Comparison by By Component (2016-2032)
- Figure 66: Western Europe Mobile Operating Systems (OS) Haptic Interface Market Revenue (US$ Mn) Comparison by By Operating System (2016-2032)
- Figure 67: Western Europe Mobile Operating Systems (OS) Haptic Interface Market Revenue (US$ Mn) Comparison by By Device Type (2016-2032)
- Figure 68: Western Europe Mobile Operating Systems (OS) Haptic Interface Market Revenue (US$ Mn) Comparison by By Application (2016-2032)
- Figure 69: Western Europe Mobile Operating Systems (OS) Haptic Interface Market Y-o-Y Growth Rate Comparison by Country (2016-2032)
- Figure 70: Western Europe Mobile Operating Systems (OS) Haptic Interface Market Y-o-Y Growth Rate Comparison by By Component (2016-2032)
- Figure 71: Western Europe Mobile Operating Systems (OS) Haptic Interface Market Y-o-Y Growth Rate Comparison by By Operating System (2016-2032)
- Figure 72: Western Europe Mobile Operating Systems (OS) Haptic Interface Market Y-o-Y Growth Rate Comparison by By Device Type (2016-2032)
- Figure 73: Western Europe Mobile Operating Systems (OS) Haptic Interface Market Y-o-Y Growth Rate Comparison by By Application (2016-2032)
- Figure 74: Western Europe Mobile Operating Systems (OS) Haptic Interface Market Share Comparison by Country (2016-2032)
- Figure 75: Western Europe Mobile Operating Systems (OS) Haptic Interface Market Share Comparison by By Component (2016-2032)
- Figure 76: Western Europe Mobile Operating Systems (OS) Haptic Interface Market Share Comparison by By Operating System (2016-2032)
- Figure 77: Western Europe Mobile Operating Systems (OS) Haptic Interface Market Share Comparison by By Device Type (2016-2032)
- Figure 78: Western Europe Mobile Operating Systems (OS) Haptic Interface Market Share Comparison by By Application (2016-2032)
- Figure 79: Eastern Europe Mobile Operating Systems (OS) Haptic Interface Market Revenue (US$ Mn) Market Share by By Componentin 2022
- Figure 80: Eastern Europe Mobile Operating Systems (OS) Haptic Interface Market Attractiveness Analysis by By Component, 2016-2032
- Figure 81: Eastern Europe Mobile Operating Systems (OS) Haptic Interface Market Revenue (US$ Mn) Market Share by By Operating Systemin 2022
- Figure 82: Eastern Europe Mobile Operating Systems (OS) Haptic Interface Market Attractiveness Analysis by By Operating System, 2016-2032
- Figure 83: Eastern Europe Mobile Operating Systems (OS) Haptic Interface Market Revenue (US$ Mn) Market Share by By Device Typein 2022
- Figure 84: Eastern Europe Mobile Operating Systems (OS) Haptic Interface Market Attractiveness Analysis by By Device Type, 2016-2032
- Figure 85: Eastern Europe Mobile Operating Systems (OS) Haptic Interface Market Revenue (US$ Mn) Market Share by By Applicationin 2022
- Figure 86: Eastern Europe Mobile Operating Systems (OS) Haptic Interface Market Attractiveness Analysis by By Application, 2016-2032
- Figure 87: Eastern Europe Mobile Operating Systems (OS) Haptic Interface Market Revenue (US$ Mn) Market Share by Country in 2022
- Figure 88: Eastern Europe Mobile Operating Systems (OS) Haptic Interface Market Attractiveness Analysis by Country, 2016-2032
- Figure 89: Eastern Europe Mobile Operating Systems (OS) Haptic Interface Market Revenue (US$ Mn) (2016-2032)
- Figure 90: Eastern Europe Mobile Operating Systems (OS) Haptic Interface Market Revenue (US$ Mn) Comparison by Country (2016-2032)
- Figure 91: Eastern Europe Mobile Operating Systems (OS) Haptic Interface Market Revenue (US$ Mn) Comparison by By Component (2016-2032)
- Figure 92: Eastern Europe Mobile Operating Systems (OS) Haptic Interface Market Revenue (US$ Mn) Comparison by By Operating System (2016-2032)
- Figure 93: Eastern Europe Mobile Operating Systems (OS) Haptic Interface Market Revenue (US$ Mn) Comparison by By Device Type (2016-2032)
- Figure 94: Eastern Europe Mobile Operating Systems (OS) Haptic Interface Market Revenue (US$ Mn) Comparison by By Application (2016-2032)
- Figure 95: Eastern Europe Mobile Operating Systems (OS) Haptic Interface Market Y-o-Y Growth Rate Comparison by Country (2016-2032)
- Figure 96: Eastern Europe Mobile Operating Systems (OS) Haptic Interface Market Y-o-Y Growth Rate Comparison by By Component (2016-2032)
- Figure 97: Eastern Europe Mobile Operating Systems (OS) Haptic Interface Market Y-o-Y Growth Rate Comparison by By Operating System (2016-2032)
- Figure 98: Eastern Europe Mobile Operating Systems (OS) Haptic Interface Market Y-o-Y Growth Rate Comparison by By Device Type (2016-2032)
- Figure 99: Eastern Europe Mobile Operating Systems (OS) Haptic Interface Market Y-o-Y Growth Rate Comparison by By Application (2016-2032)
- Figure 100: Eastern Europe Mobile Operating Systems (OS) Haptic Interface Market Share Comparison by Country (2016-2032)
- Figure 101: Eastern Europe Mobile Operating Systems (OS) Haptic Interface Market Share Comparison by By Component (2016-2032)
- Figure 102: Eastern Europe Mobile Operating Systems (OS) Haptic Interface Market Share Comparison by By Operating System (2016-2032)
- Figure 103: Eastern Europe Mobile Operating Systems (OS) Haptic Interface Market Share Comparison by By Device Type (2016-2032)
- Figure 104: Eastern Europe Mobile Operating Systems (OS) Haptic Interface Market Share Comparison by By Application (2016-2032)
- Figure 105: APAC Mobile Operating Systems (OS) Haptic Interface Market Revenue (US$ Mn) Market Share by By Componentin 2022
- Figure 106: APAC Mobile Operating Systems (OS) Haptic Interface Market Attractiveness Analysis by By Component, 2016-2032
- Figure 107: APAC Mobile Operating Systems (OS) Haptic Interface Market Revenue (US$ Mn) Market Share by By Operating Systemin 2022
- Figure 108: APAC Mobile Operating Systems (OS) Haptic Interface Market Attractiveness Analysis by By Operating System, 2016-2032
- Figure 109: APAC Mobile Operating Systems (OS) Haptic Interface Market Revenue (US$ Mn) Market Share by By Device Typein 2022
- Figure 110: APAC Mobile Operating Systems (OS) Haptic Interface Market Attractiveness Analysis by By Device Type, 2016-2032
- Figure 111: APAC Mobile Operating Systems (OS) Haptic Interface Market Revenue (US$ Mn) Market Share by By Applicationin 2022
- Figure 112: APAC Mobile Operating Systems (OS) Haptic Interface Market Attractiveness Analysis by By Application, 2016-2032
- Figure 113: APAC Mobile Operating Systems (OS) Haptic Interface Market Revenue (US$ Mn) Market Share by Country in 2022
- Figure 114: APAC Mobile Operating Systems (OS) Haptic Interface Market Attractiveness Analysis by Country, 2016-2032
- Figure 115: APAC Mobile Operating Systems (OS) Haptic Interface Market Revenue (US$ Mn) (2016-2032)
- Figure 116: APAC Mobile Operating Systems (OS) Haptic Interface Market Revenue (US$ Mn) Comparison by Country (2016-2032)
- Figure 117: APAC Mobile Operating Systems (OS) Haptic Interface Market Revenue (US$ Mn) Comparison by By Component (2016-2032)
- Figure 118: APAC Mobile Operating Systems (OS) Haptic Interface Market Revenue (US$ Mn) Comparison by By Operating System (2016-2032)
- Figure 119: APAC Mobile Operating Systems (OS) Haptic Interface Market Revenue (US$ Mn) Comparison by By Device Type (2016-2032)
- Figure 120: APAC Mobile Operating Systems (OS) Haptic Interface Market Revenue (US$ Mn) Comparison by By Application (2016-2032)
- Figure 121: APAC Mobile Operating Systems (OS) Haptic Interface Market Y-o-Y Growth Rate Comparison by Country (2016-2032)
- Figure 122: APAC Mobile Operating Systems (OS) Haptic Interface Market Y-o-Y Growth Rate Comparison by By Component (2016-2032)
- Figure 123: APAC Mobile Operating Systems (OS) Haptic Interface Market Y-o-Y Growth Rate Comparison by By Operating System (2016-2032)
- Figure 124: APAC Mobile Operating Systems (OS) Haptic Interface Market Y-o-Y Growth Rate Comparison by By Device Type (2016-2032)
- Figure 125: APAC Mobile Operating Systems (OS) Haptic Interface Market Y-o-Y Growth Rate Comparison by By Application (2016-2032)
- Figure 126: APAC Mobile Operating Systems (OS) Haptic Interface Market Share Comparison by Country (2016-2032)
- Figure 127: APAC Mobile Operating Systems (OS) Haptic Interface Market Share Comparison by By Component (2016-2032)
- Figure 128: APAC Mobile Operating Systems (OS) Haptic Interface Market Share Comparison by By Operating System (2016-2032)
- Figure 129: APAC Mobile Operating Systems (OS) Haptic Interface Market Share Comparison by By Device Type (2016-2032)
- Figure 130: APAC Mobile Operating Systems (OS) Haptic Interface Market Share Comparison by By Application (2016-2032)
- Figure 131: Latin America Mobile Operating Systems (OS) Haptic Interface Market Revenue (US$ Mn) Market Share by By Componentin 2022
- Figure 132: Latin America Mobile Operating Systems (OS) Haptic Interface Market Attractiveness Analysis by By Component, 2016-2032
- Figure 133: Latin America Mobile Operating Systems (OS) Haptic Interface Market Revenue (US$ Mn) Market Share by By Operating Systemin 2022
- Figure 134: Latin America Mobile Operating Systems (OS) Haptic Interface Market Attractiveness Analysis by By Operating System, 2016-2032
- Figure 135: Latin America Mobile Operating Systems (OS) Haptic Interface Market Revenue (US$ Mn) Market Share by By Device Typein 2022
- Figure 136: Latin America Mobile Operating Systems (OS) Haptic Interface Market Attractiveness Analysis by By Device Type, 2016-2032
- Figure 137: Latin America Mobile Operating Systems (OS) Haptic Interface Market Revenue (US$ Mn) Market Share by By Applicationin 2022
- Figure 138: Latin America Mobile Operating Systems (OS) Haptic Interface Market Attractiveness Analysis by By Application, 2016-2032
- Figure 139: Latin America Mobile Operating Systems (OS) Haptic Interface Market Revenue (US$ Mn) Market Share by Country in 2022
- Figure 140: Latin America Mobile Operating Systems (OS) Haptic Interface Market Attractiveness Analysis by Country, 2016-2032
- Figure 141: Latin America Mobile Operating Systems (OS) Haptic Interface Market Revenue (US$ Mn) (2016-2032)
- Figure 142: Latin America Mobile Operating Systems (OS) Haptic Interface Market Revenue (US$ Mn) Comparison by Country (2016-2032)
- Figure 143: Latin America Mobile Operating Systems (OS) Haptic Interface Market Revenue (US$ Mn) Comparison by By Component (2016-2032)
- Figure 144: Latin America Mobile Operating Systems (OS) Haptic Interface Market Revenue (US$ Mn) Comparison by By Operating System (2016-2032)
- Figure 145: Latin America Mobile Operating Systems (OS) Haptic Interface Market Revenue (US$ Mn) Comparison by By Device Type (2016-2032)
- Figure 146: Latin America Mobile Operating Systems (OS) Haptic Interface Market Revenue (US$ Mn) Comparison by By Application (2016-2032)
- Figure 147: Latin America Mobile Operating Systems (OS) Haptic Interface Market Y-o-Y Growth Rate Comparison by Country (2016-2032)
- Figure 148: Latin America Mobile Operating Systems (OS) Haptic Interface Market Y-o-Y Growth Rate Comparison by By Component (2016-2032)
- Figure 149: Latin America Mobile Operating Systems (OS) Haptic Interface Market Y-o-Y Growth Rate Comparison by By Operating System (2016-2032)
- Figure 150: Latin America Mobile Operating Systems (OS) Haptic Interface Market Y-o-Y Growth Rate Comparison by By Device Type (2016-2032)
- Figure 151: Latin America Mobile Operating Systems (OS) Haptic Interface Market Y-o-Y Growth Rate Comparison by By Application (2016-2032)
- Figure 152: Latin America Mobile Operating Systems (OS) Haptic Interface Market Share Comparison by Country (2016-2032)
- Figure 153: Latin America Mobile Operating Systems (OS) Haptic Interface Market Share Comparison by By Component (2016-2032)
- Figure 154: Latin America Mobile Operating Systems (OS) Haptic Interface Market Share Comparison by By Operating System (2016-2032)
- Figure 155: Latin America Mobile Operating Systems (OS) Haptic Interface Market Share Comparison by By Device Type (2016-2032)
- Figure 156: Latin America Mobile Operating Systems (OS) Haptic Interface Market Share Comparison by By Application (2016-2032)
- Figure 157: Middle East & Africa Mobile Operating Systems (OS) Haptic Interface Market Revenue (US$ Mn) Market Share by By Componentin 2022
- Figure 158: Middle East & Africa Mobile Operating Systems (OS) Haptic Interface Market Attractiveness Analysis by By Component, 2016-2032
- Figure 159: Middle East & Africa Mobile Operating Systems (OS) Haptic Interface Market Revenue (US$ Mn) Market Share by By Operating Systemin 2022
- Figure 160: Middle East & Africa Mobile Operating Systems (OS) Haptic Interface Market Attractiveness Analysis by By Operating System, 2016-2032
- Figure 161: Middle East & Africa Mobile Operating Systems (OS) Haptic Interface Market Revenue (US$ Mn) Market Share by By Device Typein 2022
- Figure 162: Middle East & Africa Mobile Operating Systems (OS) Haptic Interface Market Attractiveness Analysis by By Device Type, 2016-2032
- Figure 163: Middle East & Africa Mobile Operating Systems (OS) Haptic Interface Market Revenue (US$ Mn) Market Share by By Applicationin 2022
- Figure 164: Middle East & Africa Mobile Operating Systems (OS) Haptic Interface Market Attractiveness Analysis by By Application, 2016-2032
- Figure 165: Middle East & Africa Mobile Operating Systems (OS) Haptic Interface Market Revenue (US$ Mn) Market Share by Country in 2022
- Figure 166: Middle East & Africa Mobile Operating Systems (OS) Haptic Interface Market Attractiveness Analysis by Country, 2016-2032
- Figure 167: Middle East & Africa Mobile Operating Systems (OS) Haptic Interface Market Revenue (US$ Mn) (2016-2032)
- Figure 168: Middle East & Africa Mobile Operating Systems (OS) Haptic Interface Market Revenue (US$ Mn) Comparison by Country (2016-2032)
- Figure 169: Middle East & Africa Mobile Operating Systems (OS) Haptic Interface Market Revenue (US$ Mn) Comparison by By Component (2016-2032)
- Figure 170: Middle East & Africa Mobile Operating Systems (OS) Haptic Interface Market Revenue (US$ Mn) Comparison by By Operating System (2016-2032)
- Figure 171: Middle East & Africa Mobile Operating Systems (OS) Haptic Interface Market Revenue (US$ Mn) Comparison by By Device Type (2016-2032)
- Figure 172: Middle East & Africa Mobile Operating Systems (OS) Haptic Interface Market Revenue (US$ Mn) Comparison by By Application (2016-2032)
- Figure 173: Middle East & Africa Mobile Operating Systems (OS) Haptic Interface Market Y-o-Y Growth Rate Comparison by Country (2016-2032)
- Figure 174: Middle East & Africa Mobile Operating Systems (OS) Haptic Interface Market Y-o-Y Growth Rate Comparison by By Component (2016-2032)
- Figure 175: Middle East & Africa Mobile Operating Systems (OS) Haptic Interface Market Y-o-Y Growth Rate Comparison by By Operating System (2016-2032)
- Figure 176: Middle East & Africa Mobile Operating Systems (OS) Haptic Interface Market Y-o-Y Growth Rate Comparison by By Device Type (2016-2032)
- Figure 177: Middle East & Africa Mobile Operating Systems (OS) Haptic Interface Market Y-o-Y Growth Rate Comparison by By Application (2016-2032)
- Figure 178: Middle East & Africa Mobile Operating Systems (OS) Haptic Interface Market Share Comparison by Country (2016-2032)
- Figure 179: Middle East & Africa Mobile Operating Systems (OS) Haptic Interface Market Share Comparison by By Component (2016-2032)
- Figure 180: Middle East & Africa Mobile Operating Systems (OS) Haptic Interface Market Share Comparison by By Operating System (2016-2032)
- Figure 181: Middle East & Africa Mobile Operating Systems (OS) Haptic Interface Market Share Comparison by By Device Type (2016-2032)
- Figure 182: Middle East & Africa Mobile Operating Systems (OS) Haptic Interface Market Share Comparison by By Application (2016-2032)
- List of Tables
- Table 1: Global Mobile Operating Systems (OS) Haptic Interface Market Comparison by By Component (2016-2032)
- Table 2: Global Mobile Operating Systems (OS) Haptic Interface Market Comparison by By Operating System (2016-2032)
- Table 3: Global Mobile Operating Systems (OS) Haptic Interface Market Comparison by By Device Type (2016-2032)
- Table 4: Global Mobile Operating Systems (OS) Haptic Interface Market Comparison by By Application (2016-2032)
- Table 5: Global Mobile Operating Systems (OS) Haptic Interface Market Revenue (US$ Mn) Comparison by Region (2016-2032)
- Table 6: Global Mobile Operating Systems (OS) Haptic Interface Market Revenue (US$ Mn) (2016-2032)
- Table 7: Global Mobile Operating Systems (OS) Haptic Interface Market Revenue (US$ Mn) Comparison by Region (2016-2032)
- Table 8: Global Mobile Operating Systems (OS) Haptic Interface Market Revenue (US$ Mn) Comparison by By Component (2016-2032)
- Table 9: Global Mobile Operating Systems (OS) Haptic Interface Market Revenue (US$ Mn) Comparison by By Operating System (2016-2032)
- Table 10: Global Mobile Operating Systems (OS) Haptic Interface Market Revenue (US$ Mn) Comparison by By Device Type (2016-2032)
- Table 11: Global Mobile Operating Systems (OS) Haptic Interface Market Revenue (US$ Mn) Comparison by By Application (2016-2032)
- Table 12: Global Mobile Operating Systems (OS) Haptic Interface Market Y-o-Y Growth Rate Comparison by Region (2016-2032)
- Table 13: Global Mobile Operating Systems (OS) Haptic Interface Market Y-o-Y Growth Rate Comparison by By Component (2016-2032)
- Table 14: Global Mobile Operating Systems (OS) Haptic Interface Market Y-o-Y Growth Rate Comparison by By Operating System (2016-2032)
- Table 15: Global Mobile Operating Systems (OS) Haptic Interface Market Y-o-Y Growth Rate Comparison by By Device Type (2016-2032)
- Table 16: Global Mobile Operating Systems (OS) Haptic Interface Market Y-o-Y Growth Rate Comparison by By Application (2016-2032)
- Table 17: Global Mobile Operating Systems (OS) Haptic Interface Market Share Comparison by Region (2016-2032)
- Table 18: Global Mobile Operating Systems (OS) Haptic Interface Market Share Comparison by By Component (2016-2032)
- Table 19: Global Mobile Operating Systems (OS) Haptic Interface Market Share Comparison by By Operating System (2016-2032)
- Table 20: Global Mobile Operating Systems (OS) Haptic Interface Market Share Comparison by By Device Type (2016-2032)
- Table 21: Global Mobile Operating Systems (OS) Haptic Interface Market Share Comparison by By Application (2016-2032)
- Table 22: North America Mobile Operating Systems (OS) Haptic Interface Market Comparison by By Operating System (2016-2032)
- Table 23: North America Mobile Operating Systems (OS) Haptic Interface Market Comparison by By Device Type (2016-2032)
- Table 24: North America Mobile Operating Systems (OS) Haptic Interface Market Comparison by By Application (2016-2032)
- Table 25: North America Mobile Operating Systems (OS) Haptic Interface Market Revenue (US$ Mn) Comparison by Country (2016-2032)
- Table 26: North America Mobile Operating Systems (OS) Haptic Interface Market Revenue (US$ Mn) (2016-2032)
- Table 27: North America Mobile Operating Systems (OS) Haptic Interface Market Revenue (US$ Mn) Comparison by Country (2016-2032)
- Table 28: North America Mobile Operating Systems (OS) Haptic Interface Market Revenue (US$ Mn) Comparison by By Component (2016-2032)
- Table 29: North America Mobile Operating Systems (OS) Haptic Interface Market Revenue (US$ Mn) Comparison by By Operating System (2016-2032)
- Table 30: North America Mobile Operating Systems (OS) Haptic Interface Market Revenue (US$ Mn) Comparison by By Device Type (2016-2032)
- Table 31: North America Mobile Operating Systems (OS) Haptic Interface Market Revenue (US$ Mn) Comparison by By Application (2016-2032)
- Table 32: North America Mobile Operating Systems (OS) Haptic Interface Market Y-o-Y Growth Rate Comparison by Country (2016-2032)
- Table 33: North America Mobile Operating Systems (OS) Haptic Interface Market Y-o-Y Growth Rate Comparison by By Component (2016-2032)
- Table 34: North America Mobile Operating Systems (OS) Haptic Interface Market Y-o-Y Growth Rate Comparison by By Operating System (2016-2032)
- Table 35: North America Mobile Operating Systems (OS) Haptic Interface Market Y-o-Y Growth Rate Comparison by By Device Type (2016-2032)
- Table 36: North America Mobile Operating Systems (OS) Haptic Interface Market Y-o-Y Growth Rate Comparison by By Application (2016-2032)
- Table 37: North America Mobile Operating Systems (OS) Haptic Interface Market Share Comparison by Country (2016-2032)
- Table 38: North America Mobile Operating Systems (OS) Haptic Interface Market Share Comparison by By Component (2016-2032)
- Table 39: North America Mobile Operating Systems (OS) Haptic Interface Market Share Comparison by By Operating System (2016-2032)
- Table 40: North America Mobile Operating Systems (OS) Haptic Interface Market Share Comparison by By Device Type (2016-2032)
- Table 41: North America Mobile Operating Systems (OS) Haptic Interface Market Share Comparison by By Application (2016-2032)
- Table 42: Western Europe Mobile Operating Systems (OS) Haptic Interface Market Comparison by By Component (2016-2032)
- Table 43: Western Europe Mobile Operating Systems (OS) Haptic Interface Market Comparison by By Operating System (2016-2032)
- Table 44: Western Europe Mobile Operating Systems (OS) Haptic Interface Market Comparison by By Device Type (2016-2032)
- Table 45: Western Europe Mobile Operating Systems (OS) Haptic Interface Market Comparison by By Application (2016-2032)
- Table 46: Western Europe Mobile Operating Systems (OS) Haptic Interface Market Revenue (US$ Mn) Comparison by Country (2016-2032)
- Table 47: Western Europe Mobile Operating Systems (OS) Haptic Interface Market Revenue (US$ Mn) (2016-2032)
- Table 48: Western Europe Mobile Operating Systems (OS) Haptic Interface Market Revenue (US$ Mn) Comparison by Country (2016-2032)
- Table 49: Western Europe Mobile Operating Systems (OS) Haptic Interface Market Revenue (US$ Mn) Comparison by By Component (2016-2032)
- Table 50: Western Europe Mobile Operating Systems (OS) Haptic Interface Market Revenue (US$ Mn) Comparison by By Operating System (2016-2032)
- Table 51: Western Europe Mobile Operating Systems (OS) Haptic Interface Market Revenue (US$ Mn) Comparison by By Device Type (2016-2032)
- Table 52: Western Europe Mobile Operating Systems (OS) Haptic Interface Market Revenue (US$ Mn) Comparison by By Application (2016-2032)
- Table 53: Western Europe Mobile Operating Systems (OS) Haptic Interface Market Y-o-Y Growth Rate Comparison by Country (2016-2032)
- Table 54: Western Europe Mobile Operating Systems (OS) Haptic Interface Market Y-o-Y Growth Rate Comparison by By Component (2016-2032)
- Table 55: Western Europe Mobile Operating Systems (OS) Haptic Interface Market Y-o-Y Growth Rate Comparison by By Operating System (2016-2032)
- Table 56: Western Europe Mobile Operating Systems (OS) Haptic Interface Market Y-o-Y Growth Rate Comparison by By Device Type (2016-2032)
- Table 57: Western Europe Mobile Operating Systems (OS) Haptic Interface Market Y-o-Y Growth Rate Comparison by By Application (2016-2032)
- Table 58: Western Europe Mobile Operating Systems (OS) Haptic Interface Market Share Comparison by Country (2016-2032)
- Table 59: Western Europe Mobile Operating Systems (OS) Haptic Interface Market Share Comparison by By Component (2016-2032)
- Table 60: Western Europe Mobile Operating Systems (OS) Haptic Interface Market Share Comparison by By Operating System (2016-2032)
- Table 61: Western Europe Mobile Operating Systems (OS) Haptic Interface Market Share Comparison by By Device Type (2016-2032)
- Table 62: Western Europe Mobile Operating Systems (OS) Haptic Interface Market Share Comparison by By Application (2016-2032)
- Table 63: Eastern Europe Mobile Operating Systems (OS) Haptic Interface Market Comparison by By Component (2016-2032)
- Table 64: Eastern Europe Mobile Operating Systems (OS) Haptic Interface Market Comparison by By Operating System (2016-2032)
- Table 65: Eastern Europe Mobile Operating Systems (OS) Haptic Interface Market Comparison by By Device Type (2016-2032)
- Table 66: Eastern Europe Mobile Operating Systems (OS) Haptic Interface Market Comparison by By Application (2016-2032)
- Table 67: Eastern Europe Mobile Operating Systems (OS) Haptic Interface Market Revenue (US$ Mn) Comparison by Country (2016-2032)
- Table 68: Eastern Europe Mobile Operating Systems (OS) Haptic Interface Market Revenue (US$ Mn) (2016-2032)
- Table 69: Eastern Europe Mobile Operating Systems (OS) Haptic Interface Market Revenue (US$ Mn) Comparison by Country (2016-2032)
- Table 70: Eastern Europe Mobile Operating Systems (OS) Haptic Interface Market Revenue (US$ Mn) Comparison by By Component (2016-2032)
- Table 71: Eastern Europe Mobile Operating Systems (OS) Haptic Interface Market Revenue (US$ Mn) Comparison by By Operating System (2016-2032)
- Table 72: Eastern Europe Mobile Operating Systems (OS) Haptic Interface Market Revenue (US$ Mn) Comparison by By Device Type (2016-2032)
- Table 73: Eastern Europe Mobile Operating Systems (OS) Haptic Interface Market Revenue (US$ Mn) Comparison by By Application (2016-2032)
- Table 74: Eastern Europe Mobile Operating Systems (OS) Haptic Interface Market Y-o-Y Growth Rate Comparison by Country (2016-2032)
- Table 75: Eastern Europe Mobile Operating Systems (OS) Haptic Interface Market Y-o-Y Growth Rate Comparison by By Component (2016-2032)
- Table 76: Eastern Europe Mobile Operating Systems (OS) Haptic Interface Market Y-o-Y Growth Rate Comparison by By Operating System (2016-2032)
- Table 77: Eastern Europe Mobile Operating Systems (OS) Haptic Interface Market Y-o-Y Growth Rate Comparison by By Device Type (2016-2032)
- Table 78: Eastern Europe Mobile Operating Systems (OS) Haptic Interface Market Y-o-Y Growth Rate Comparison by By Application (2016-2032)
- Table 79: Eastern Europe Mobile Operating Systems (OS) Haptic Interface Market Share Comparison by Country (2016-2032)
- Table 80: Eastern Europe Mobile Operating Systems (OS) Haptic Interface Market Share Comparison by By Component (2016-2032)
- Table 81: Eastern Europe Mobile Operating Systems (OS) Haptic Interface Market Share Comparison by By Operating System (2016-2032)
- Table 82: Eastern Europe Mobile Operating Systems (OS) Haptic Interface Market Share Comparison by By Device Type (2016-2032)
- Table 83: Eastern Europe Mobile Operating Systems (OS) Haptic Interface Market Share Comparison by By Application (2016-2032)
- Table 84: APAC Mobile Operating Systems (OS) Haptic Interface Market Comparison by By Component (2016-2032)
- Table 85: APAC Mobile Operating Systems (OS) Haptic Interface Market Comparison by By Operating System (2016-2032)
- Table 86: APAC Mobile Operating Systems (OS) Haptic Interface Market Comparison by By Device Type (2016-2032)
- Table 87: APAC Mobile Operating Systems (OS) Haptic Interface Market Comparison by By Application (2016-2032)
- Table 88: APAC Mobile Operating Systems (OS) Haptic Interface Market Revenue (US$ Mn) Comparison by Country (2016-2032)
- Table 89: APAC Mobile Operating Systems (OS) Haptic Interface Market Revenue (US$ Mn) (2016-2032)
- Table 90: APAC Mobile Operating Systems (OS) Haptic Interface Market Revenue (US$ Mn) Comparison by Country (2016-2032)
- Table 91: APAC Mobile Operating Systems (OS) Haptic Interface Market Revenue (US$ Mn) Comparison by By Component (2016-2032)
- Table 92: APAC Mobile Operating Systems (OS) Haptic Interface Market Revenue (US$ Mn) Comparison by By Operating System (2016-2032)
- Table 93: APAC Mobile Operating Systems (OS) Haptic Interface Market Revenue (US$ Mn) Comparison by By Device Type (2016-2032)
- Table 94: APAC Mobile Operating Systems (OS) Haptic Interface Market Revenue (US$ Mn) Comparison by By Application (2016-2032)
- Table 95: APAC Mobile Operating Systems (OS) Haptic Interface Market Y-o-Y Growth Rate Comparison by Country (2016-2032)
- Table 96: APAC Mobile Operating Systems (OS) Haptic Interface Market Y-o-Y Growth Rate Comparison by By Component (2016-2032)
- Table 97: APAC Mobile Operating Systems (OS) Haptic Interface Market Y-o-Y Growth Rate Comparison by By Operating System (2016-2032)
- Table 98: APAC Mobile Operating Systems (OS) Haptic Interface Market Y-o-Y Growth Rate Comparison by By Device Type (2016-2032)
- Table 99: APAC Mobile Operating Systems (OS) Haptic Interface Market Y-o-Y Growth Rate Comparison by By Application (2016-2032)
- Table 100: APAC Mobile Operating Systems (OS) Haptic Interface Market Share Comparison by Country (2016-2032)
- Table 101: APAC Mobile Operating Systems (OS) Haptic Interface Market Share Comparison by By Component (2016-2032)
- Table 102: APAC Mobile Operating Systems (OS) Haptic Interface Market Share Comparison by By Operating System (2016-2032)
- Table 103: APAC Mobile Operating Systems (OS) Haptic Interface Market Share Comparison by By Device Type (2016-2032)
- Table 104: APAC Mobile Operating Systems (OS) Haptic Interface Market Share Comparison by By Application (2016-2032)
- Table 105: Latin America Mobile Operating Systems (OS) Haptic Interface Market Comparison by By Component (2016-2032)
- Table 106: Latin America Mobile Operating Systems (OS) Haptic Interface Market Comparison by By Operating System (2016-2032)
- Table 107: Latin America Mobile Operating Systems (OS) Haptic Interface Market Comparison by By Device Type (2016-2032)
- Table 108: Latin America Mobile Operating Systems (OS) Haptic Interface Market Comparison by By Application (2016-2032)
- Table 109: Latin America Mobile Operating Systems (OS) Haptic Interface Market Revenue (US$ Mn) Comparison by Country (2016-2032)
- Table 110: Latin America Mobile Operating Systems (OS) Haptic Interface Market Revenue (US$ Mn) (2016-2032)
- Table 111: Latin America Mobile Operating Systems (OS) Haptic Interface Market Revenue (US$ Mn) Comparison by Country (2016-2032)
- Table 112: Latin America Mobile Operating Systems (OS) Haptic Interface Market Revenue (US$ Mn) Comparison by By Component (2016-2032)
- Table 113: Latin America Mobile Operating Systems (OS) Haptic Interface Market Revenue (US$ Mn) Comparison by By Operating System (2016-2032)
- Table 114: Latin America Mobile Operating Systems (OS) Haptic Interface Market Revenue (US$ Mn) Comparison by By Device Type (2016-2032)
- Table 115: Latin America Mobile Operating Systems (OS) Haptic Interface Market Revenue (US$ Mn) Comparison by By Application (2016-2032)
- Table 116: Latin America Mobile Operating Systems (OS) Haptic Interface Market Y-o-Y Growth Rate Comparison by Country (2016-2032)
- Table 117: Latin America Mobile Operating Systems (OS) Haptic Interface Market Y-o-Y Growth Rate Comparison by By Component (2016-2032)
- Table 118: Latin America Mobile Operating Systems (OS) Haptic Interface Market Y-o-Y Growth Rate Comparison by By Operating System (2016-2032)
- Table 119: Latin America Mobile Operating Systems (OS) Haptic Interface Market Y-o-Y Growth Rate Comparison by By Device Type (2016-2032)
- Table 120: Latin America Mobile Operating Systems (OS) Haptic Interface Market Y-o-Y Growth Rate Comparison by By Application (2016-2032)
- Table 121: Latin America Mobile Operating Systems (OS) Haptic Interface Market Share Comparison by Country (2016-2032)
- Table 122: Latin America Mobile Operating Systems (OS) Haptic Interface Market Share Comparison by By Component (2016-2032)
- Table 123: Latin America Mobile Operating Systems (OS) Haptic Interface Market Share Comparison by By Operating System (2016-2032)
- Table 124: Latin America Mobile Operating Systems (OS) Haptic Interface Market Share Comparison by By Device Type (2016-2032)
- Table 125: Latin America Mobile Operating Systems (OS) Haptic Interface Market Share Comparison by By Application (2016-2032)
- Table 126: Middle East & Africa Mobile Operating Systems (OS) Haptic Interface Market Comparison by By Component (2016-2032)
- Table 127: Middle East & Africa Mobile Operating Systems (OS) Haptic Interface Market Comparison by By Operating System (2016-2032)
- Table 128: Middle East & Africa Mobile Operating Systems (OS) Haptic Interface Market Comparison by By Device Type (2016-2032)
- Table 129: Middle East & Africa Mobile Operating Systems (OS) Haptic Interface Market Comparison by By Application (2016-2032)
- Table 130: Middle East & Africa Mobile Operating Systems (OS) Haptic Interface Market Revenue (US$ Mn) Comparison by Country (2016-2032)
- Table 131: Middle East & Africa Mobile Operating Systems (OS) Haptic Interface Market Revenue (US$ Mn) (2016-2032)
- Table 132: Middle East & Africa Mobile Operating Systems (OS) Haptic Interface Market Revenue (US$ Mn) Comparison by Country (2016-2032)
- Table 133: Middle East & Africa Mobile Operating Systems (OS) Haptic Interface Market Revenue (US$ Mn) Comparison by By Component (2016-2032)
- Table 134: Middle East & Africa Mobile Operating Systems (OS) Haptic Interface Market Revenue (US$ Mn) Comparison by By Operating System (2016-2032)
- Table 135: Middle East & Africa Mobile Operating Systems (OS) Haptic Interface Market Revenue (US$ Mn) Comparison by By Device Type (2016-2032)
- Table 136: Middle East & Africa Mobile Operating Systems (OS) Haptic Interface Market Revenue (US$ Mn) Comparison by By Application (2016-2032)
- Table 137: Middle East & Africa Mobile Operating Systems (OS) Haptic Interface Market Y-o-Y Growth Rate Comparison by Country (2016-2032)
- Table 138: Middle East & Africa Mobile Operating Systems (OS) Haptic Interface Market Y-o-Y Growth Rate Comparison by By Component (2016-2032)
- Table 139: Middle East & Africa Mobile Operating Systems (OS) Haptic Interface Market Y-o-Y Growth Rate Comparison by By Operating System (2016-2032)
- Table 140: Middle East & Africa Mobile Operating Systems (OS) Haptic Interface Market Y-o-Y Growth Rate Comparison by By Device Type (2016-2032)
- Table 141: Middle East & Africa Mobile Operating Systems (OS) Haptic Interface Market Y-o-Y Growth Rate Comparison by By Application (2016-2032)
- Table 142: Middle East & Africa Mobile Operating Systems (OS) Haptic Interface Market Share Comparison by Country (2016-2032)
- Table 143: Middle East & Africa Mobile Operating Systems (OS) Haptic Interface Market Share Comparison by By Component (2016-2032)
- Table 144: Middle East & Africa Mobile Operating Systems (OS) Haptic Interface Market Share Comparison by By Operating System (2016-2032)
- Table 145: Middle East & Africa Mobile Operating Systems (OS) Haptic Interface Market Share Comparison by By Device Type (2016-2032)
- Table 146: Middle East & Africa Mobile Operating Systems (OS) Haptic Interface Market Share Comparison by By Application (2016-2032)
- 1. Executive Summary
-
- Apple Inc. (U.S.)
- Google LLC (U.S.)
- HAPTION U.S.)
- Immersion (U.S.)
- 3D Systems Inc. (U.S.)
- Nuance Communications Inc. (U.S.)
Our Clients


View Our Licence Options
