Mass Spectrometry Imaging Market By Type (MALDI, ESI, Other types), By Application (Proteomics, Clinical, Metabolomics), By Region And Companies - Industry Segment Outlook, Market Assessment, Competition Scenario, Trends, And Forecast 2024-2033
-
17674
-
August 2024
-
249
-


-
This report was compiled by Kalyani Khudsange Kalyani Khudsange is a Research Analyst at Prudour Pvt. Ltd. with 2.5 years of experience in market research and a strong technical background in Chemical Engineering and manufacturing. Correspondence Sr. Research Analyst Linkedin | Detailed Market research Methodology Our methodology involves a mix of primary research, including interviews with leading mental health experts, and secondary research from reputable medical journals and databases. View Detailed Methodology Page
-
Quick Navigation
Report Overview
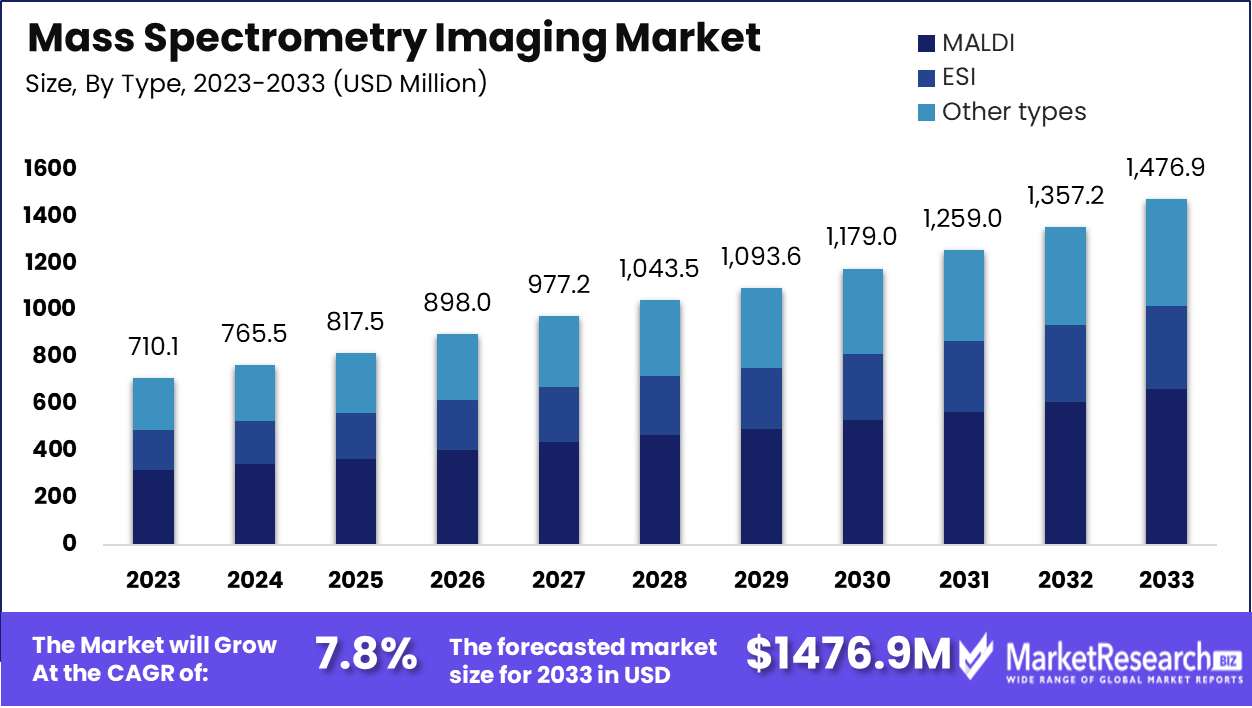
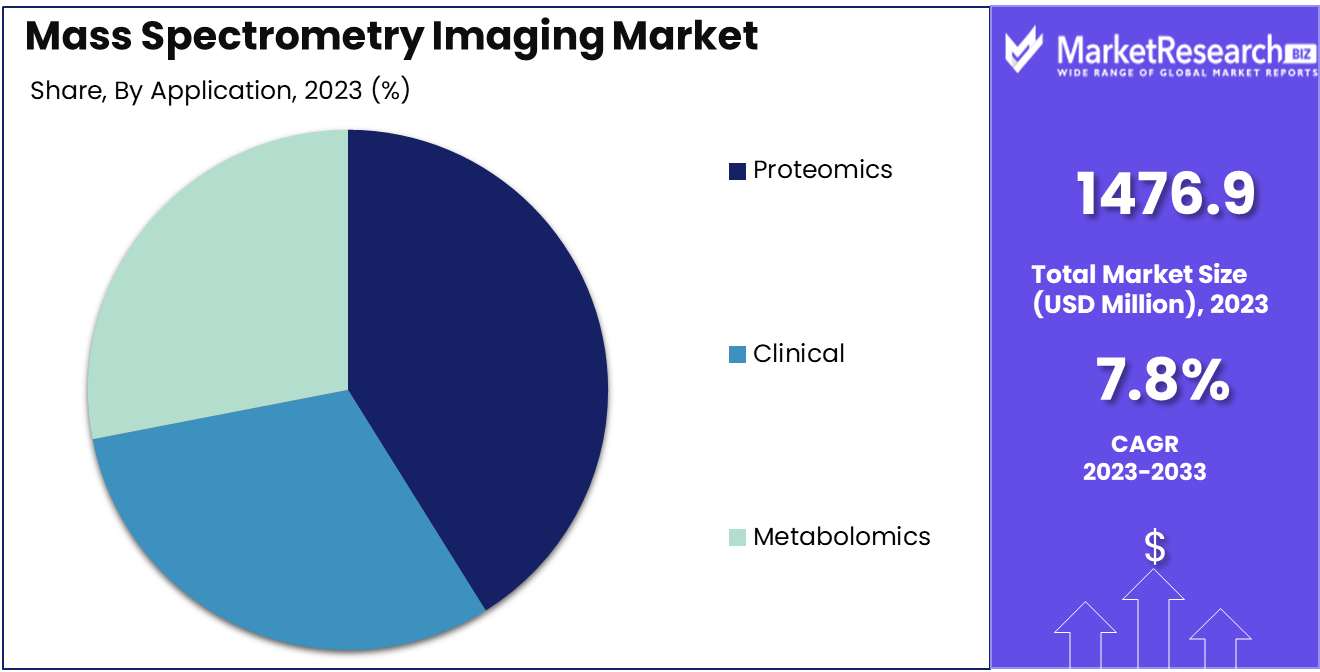
The Mass Spectrometry Imaging Market was valued at USD 710.1 million in 2023. It is expected to reach USD 1476.9 million by 2033, with a CAGR of 7.8% during the forecast period from 2024 to 2033.
The Mass Spectrometry Imaging Market refers to the segment focused on the development and application of advanced imaging techniques that combine mass spectrometry with molecular analysis. This market is driven by the demand for precise, high-resolution spatial distribution of molecules within biological tissues, enabling breakthroughs in drug development, biomarker discovery, and disease diagnosis.
The Mass Spectrometry Imaging (MSI) market is poised for substantial growth, driven by significant advancements in imaging techniques and expanding applications in drug development. The continuous evolution of MSI technologies has enhanced the precision and resolution of imaging, making it an indispensable tool in pharmaceutical research and development. These advancements are particularly critical in the early stages of drug discovery, where MSI enables detailed spatial mapping of molecular distributions within biological tissues. The ability to visualize drug-target interactions at the molecular level has not only accelerated the drug development process but also improved the accuracy of therapeutic interventions.
However, the rapid expansion of MSI applications is not without challenges. Data management remains a significant hurdle, as the complex datasets generated by advanced MSI techniques require sophisticated storage, processing, and analysis solutions. The need for robust data management systems is becoming increasingly apparent, particularly in large-scale studies where data integrity and accessibility are crucial. As the market continues to evolve, addressing these data management issues will be critical for sustaining growth and maximizing the potential of MSI technologies. In this context, companies that can integrate advanced data management solutions with their MSI offerings are likely to gain a competitive edge, positioning themselves as leaders in a rapidly expanding market.
This balanced viewpoint reflects both the opportunities and challenges within the MSI market, emphasizing the importance of innovation in both technology and data management.
Key Takeaways
- Market Growth: The Mass Spectrometry Imaging Market was valued at USD 710.1 million in 2023. It is expected to reach USD 1476.9 million by 2033, with a CAGR of 7.8% during the forecast period from 2024 to 2033.
- By Type: MALDI dominated the MSI Market by Type segment.
- By Application: Proteomics dominated the MSI market in 2023, driving significant growth.
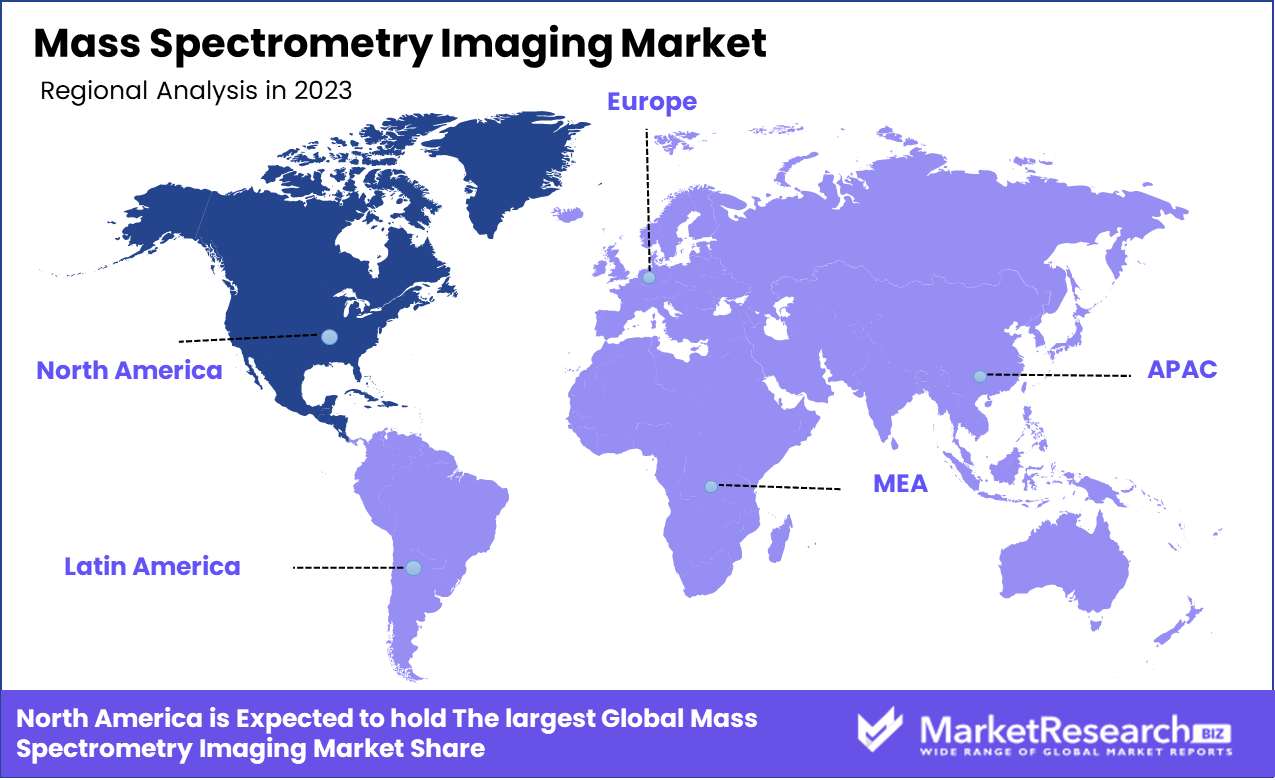
- Regional Dominance: North America dominates the Mass Spectrometry Imaging Market with a 38% largest share.
- Growth Opportunity: The global Mass Spectrometry Imaging market is set to benefit from technological advancements and expanding clinical applications
Driving factors
Growing Applications in Clinical Diagnostics: A Catalyst for Market Expansion
The increasing integration of mass spectrometry imaging (MSI) into clinical diagnostics is a pivotal factor driving market growth. MSI’s ability to provide detailed molecular images of tissues, organs, and other biological samples without the need for labeling makes it an indispensable tool in the early detection and diagnosis of various diseases, including cancer. The precision and accuracy of MSI in identifying biomarkers at the molecular level are leading to its widespread adoption in hospitals and diagnostic laboratories. This growing application in clinical settings not only enhances diagnostic accuracy but also reduces the time required for disease detection, thereby contributing significantly to the market’s expansion.
Increasing R&D Investments: Fueling Innovation and Technological Advancements
Rising investments in research and development are crucial in driving innovation within the Mass Spectrometry Imaging Market. These investments are facilitating the development of advanced MSI technologies with higher resolution, sensitivity, and speed, enabling more detailed molecular mapping. The influx of funding from both the public and private sectors is accelerating the pace of technological advancements, making MSI more accessible and effective in various applications. This surge in R&D spending is also fostering collaborations between academic institutions, research organizations, and industry players, leading to the commercialization of novel MSI techniques and expanding the market's potential.
Rising Demand for Personalized Medicine: A Key Driver for MSI Adoption
The increasing emphasis on personalized medicine is significantly boosting the demand for mass spectrometry imaging. MSI’s ability to analyze the molecular composition of tissues in great detail makes it a critical tool in the development of personalized treatment plans. As healthcare providers move towards tailored therapeutic approaches based on individual patient profiles, MSI is becoming essential for identifying specific biomarkers and understanding disease mechanisms at the molecular level. The push towards personalized medicine, driven by the need for more effective and targeted treatments, is therefore a major factor propelling the growth of the Mass Spectrometry Imaging Market.
Restraining Factors
Premium Product Pricing Limits Market Accessibility
The premium pricing associated with mass spectrometry imaging (MSI) devices acts as a significant restraining factor for the market, particularly in price-sensitive regions. The high cost of these advanced instruments makes them less accessible to smaller research institutions and laboratories with limited budgets, ultimately limiting their adoption. Despite the growing demand for high-resolution imaging and molecular analysis, the market's expansion is constrained by the need for substantial financial investment. This factor not only reduces the potential customer base but also slows the overall market penetration of MSI technologies. As a result, the growth of the MSI market is partially stifled by the inability of many potential users to justify or afford the high upfront costs associated with these premium products.
High Cost of Mass Spectrometry Devices Impedes Widespread Adoption
The high cost of mass spectrometry devices, which includes not only the initial purchase but also maintenance and operational expenses, is a critical restraining factor in the mass spectrometry imaging market. These costs can be prohibitive for many institutions, particularly in developing countries where research budgets are often more limited. The necessity of specialized infrastructure and trained personnel further compounds the financial burden, making it challenging for smaller laboratories and institutions to adopt this technology. The combined effect of these financial barriers is a slower rate of market growth, as the adoption of mass spectrometry imaging remains concentrated among well-funded research facilities and large pharmaceutical companies, rather than being widely adopted across the broader scientific community.
By Type Analysis
In 2023, MALDI dominated the MSI Market by Type segment.
In 2023, Matrix-Assisted Laser Desorption/Ionization (MALDI) held a dominant market position in the "By Type" segment of the Mass Spectrometry Imaging (MSI) Market. MALDI's dominance can be attributed to its widespread application in various fields, including proteomics, lipidomics, and biomarker discovery. MALDI offers high sensitivity and resolution, making it particularly valuable for analyzing large biomolecules like proteins and peptides. This technology has also benefited from continuous advancements, such as the development of MALDI-TOF (Time-of-Flight) systems, which have enhanced the speed and accuracy of mass spectrometry imaging.
Electrospray Ionization (ESI), another significant type in the market, is known for its ability to ionize large, polar molecules without fragmenting them, making it ideal for the analysis of complex mixtures. However, its usage is slightly more limited compared to MALDI due to its higher operational complexity.
Other types of mass spectrometry imaging technologies, though still relevant, have a smaller market share. These include Secondary Ion Mass Spectrometry (SIMS) and Desorption Electrospray Ionization (DESI), which cater to niche applications but have not reached the broader adoption levels of MALDI and ESI.
By Application Analysis
Proteomics dominated the MSI market in 2023, driving significant growth.
In 2023, Proteomics held a dominant market position in the Mass Spectrometry Imaging (MSI) Market, particularly within the Application segment. The growth in proteomics was driven by the increasing demand for in-depth protein analysis across various research domains, including drug discovery, biomarker identification, and personalized medicine. The ability of MSI to provide spatially resolved protein information without requiring labels or antibodies significantly contributed to its widespread adoption in proteomics. This trend is expected to continue as advancements in MSI technologies enhance sensitivity and throughput, further solidifying its role in proteomics research.
Clinical applications of MSI also experienced notable growth in 2023, driven by the rising need for precise tissue imaging in disease diagnosis and prognosis. The technique's ability to differentiate between healthy and diseased tissues at a molecular level has made it invaluable in clinical research and diagnostics, particularly in oncology and neurology.
Lastly, Metabolomics emerged as a significant application area for MSI, propelled by the growing interest in metabolic pathway analysis and its implications for understanding disease mechanisms and developing targeted therapies. As MSI techniques evolve, metabolomics is expected to gain further traction, contributing to the overall expansion of the MSI market.
Key Market Segments
By Type
- MALDI
- ESI
- Other types
By Application
- Proteomics
- Clinical
- Metabolomics
Growth Opportunity
Technological Advancements Driving Precision and Speed
The global Mass Spectrometry Imaging (MSI) market is poised for significant growth, driven by continuous technological advancements. Innovations in ionization techniques and high-resolution imaging are enhancing the accuracy and speed of MSI, making it a critical tool in various research fields. The integration of AI and machine learning in data analysis is also expected to streamline the interpretation of complex datasets, further broadening the application of MSI in proteomics, metabolomics, and lipidomics. These advancements are likely to attract increased investment in R&D, fostering a competitive market landscape.
Expanding Clinical Applications in Personalized Medicine
One of the most promising opportunities in the MSI market lies in its expanding clinical applications. The technology's ability to provide spatially resolved molecular information is proving invaluable in personalized medicine. MSI is increasingly being used to identify biomarkers for disease diagnosis and to guide targeted therapies, particularly in oncology. The growing adoption of MSI in clinical settings is expected to accelerate as healthcare providers recognize its potential to improve patient outcomes. This trend is anticipated to drive demand for MSI systems, leading to sustained market growth.
Latest Trends
High-Resolution Imaging: Precision and Detail in Focus
The Mass Spectrometry Imaging (MSI) market is expected to witness a significant shift towards high-resolution imaging capabilities. As pharmaceutical research, especially in drug discovery and biomarker identification, demands more precise and detailed analysis, the advancement of high-resolution MSI technologies is becoming crucial. The ability to map molecular distributions at the cellular and sub-cellular levels will enhance the accuracy of diagnostic procedures and the efficacy of targeted therapies. Companies that invest in improving the resolution of MSI instruments will likely see increased adoption in both research and clinical settings, driving market growth.
Regulatory and Safety Standards: Compliance Driving Innovation
The growing emphasis on regulatory and safety standards is another critical trend shaping the MSI market. As technology becomes more integral to pharmaceutical and clinical applications, there is a heightened focus on ensuring compliance with stringent regulatory guidelines. This includes meeting the standards set by bodies like the FDA and EMA, particularly regarding the use of MSI in drug development and patient diagnostics. The demand for compliant and certified MSI instruments is expected to rise, encouraging manufacturers to innovate and improve their technologies to meet these requirements. This trend not only fosters market growth but also elevates the credibility and reliability of MSI as a vital tool in the healthcare industry.
Regional Analysis
North America dominates the Mass Spectrometry Imaging Market with a 38% largest share.
The Mass Spectrometry Imaging Market exhibits diverse growth patterns across different regions, with North America leading the market due to its advanced healthcare infrastructure and significant investment in research and development. In 2023, North America accounted for approximately 38% of the global market share, driven by the presence of key industry players and the increasing adoption of mass spectrometry imaging techniques in the pharmaceutical and biotechnology sectors.
Europe follows closely, contributing around 28% to the market, supported by strong government initiatives and rising demand for advanced diagnostic tools. The Asia Pacific region is experiencing the fastest growth, with a compound annual growth rate (CAGR) of over 10%, fueled by the expansion of healthcare facilities and growing awareness of mass spectrometry imaging applications in emerging economies like China and India.
The Middle East & Africa and Latin America regions collectively hold a smaller market share, approximately 10%, primarily due to limited access to advanced technologies and lower healthcare spending. However, increasing investments in healthcare infrastructure in these regions are expected to spur market growth in the coming years. North America remains the dominant region, benefiting from robust R&D activities and a well-established pharmaceutical industry.
Key Regions and Countries
North America
- The US
- Canada
- Rest of North America
Europe
- Germany
- France
- The UK
- Spain
- Netherlands
- Russia
- Italy
- Rest of Europe
Asia-Pacific
- China
- Japan
- Singapore
- Thailand
- South Korea
- Vietnam
- India
- New Zealand
- Rest of Asia Pacific
Latin America
- Mexico
- Brazil
- Rest of Latin America
Middle East & Africa
- Saudi Arabia
- South Africa
- UAE
- Rest of the Middle East & Africa
Key Players Analysis
The global Mass Spectrometry Imaging (MSI) market is poised for significant advancements, driven by the strategic initiatives and technological innovations of leading companies such as Thermo Fisher Scientific Inc., Danaher Corporation, Shimadzu Corporation, Waters Corporation, Bruker Corporation, JEOL Ltd., and Analytik Jena AG.
Thermo Fisher Scientific Inc. continues to solidify its dominance through the development of highly sensitive and high-resolution mass spectrometers, catering to the growing demand for precise molecular imaging in clinical and research settings. Their focus on integrating artificial intelligence (AI) and machine learning (ML) in data analysis is expected to enhance the utility of MSI technologies.
Danaher Corporation is leveraging its expertise in life sciences and diagnostics to expand its mass spectrometry portfolio. The company’s emphasis on innovations in hardware and software integration is likely to streamline the workflow, making MSI more accessible across various applications, including biomarker discovery and drug development.
Shimadzu Corporation and Waters Corporation are expected to drive growth through their continuous investment in R&D and strategic collaborations. These companies are likely to introduce next-generation mass spectrometers with enhanced speed, sensitivity, and automation features, addressing the complex analytical needs of pharmaceutical and academic research institutions.
Bruker Corporation and JEOL Ltd. are anticipated to maintain their competitive edge by focusing on expanding their product lines and exploring new applications of MSI in proteomics, metabolomics, and spatial biology.
Analytik Jena AG is poised to capture a niche market segment by providing customized MSI solutions, particularly in environmental and food safety analysis. Their focus on user-friendly interfaces and comprehensive data management solutions is likely to attract a broader user base.
Market Key Players
- Thermo Fisher Scientific Inc.
- Danaher Corporation
- Shimadzu Corporation
- Waters Corporation
- Bruker Corporation
- JEOL Ltd.
- Analytik Jena AG
Recent Development
- In July 2024, Bruker Corporation launched the new rapifleX™ MALDI PharmaPulse® 2.1 system, which enhances mass spectrometry imaging capabilities for high-throughput screening in pharmaceutical research. This advancement is expected to significantly improve drug discovery processes.
- In June 2024, Thermo Fisher Scientific introduced the new Orbitrap IQ-X Tribrid Mass Spectrometer, designed to improve the resolution and speed of mass spectrometry imaging, particularly in clinical research applications. This innovation is aimed at advancing personalized medicine.
- In May 2024, Waters Corporation expanded its mass spectrometry imaging portfolio with the introduction of the SYNAPT XS High Definition Mass Spectrometry System. This system is tailored for complex sample analysis, offering enhanced sensitivity and specificity for biomedical research.
- In April 2024, Sciex launched the ZenoTOF 7600 system, a high-resolution mass spectrometer that incorporates new imaging techniques to provide better spatial resolution and depth profiling. This development is focused on improving tissue imaging in cancer research and other pathology studies.
Report Scope
Report Features Description Market Value (2023) USD 710.1 Million Forecast Revenue (2033) USD 1476.9 Million CAGR (2024-2032) 7.8% Base Year for Estimation 2023 Historic Period 2016-2023 Forecast Period 2024-2033 Report Coverage Revenue Forecast, Market Dynamics, COVID-19 Impact, Competitive Landscape, Recent Developments Segments Covered By Type (MALDI, ESI, Other types), By Application (Proteomics, Clinical, Metabolomics) Regional Analysis North America - The US, Canada, Rest of North America, Europe - Germany, France, The UK, Spain, Italy, Russia, Netherlands, Rest of Europe, Asia-Pacific - China, Japan, South Korea, India, New Zealand, Singapore, Thailand, Vietnam, Rest of Asia Pacific, Latin America - Brazil, Mexico, Rest of Latin America, Middle East & Africa - South Africa, Saudi Arabia, UAE, Rest of Middle East & Africa Competitive Landscape Thermo Fisher Scientific Inc., Danaher Corporation, Shimadzu Corporation, Waters Corporation, Bruker Corporation, JEOL Ltd., Analytik Jena AG Customization Scope Customization for segments, region/country-level will be provided. Moreover, additional customization can be done based on the requirements. Purchase Options We have three licenses to opt for Single User License, Multi-User License (Up to 5 Users), Corporate Use License (Unlimited User and Printable PDF) -
- 1. Executive Summary
- 1.1. Definition
- 1.2. Taxonomy
- 1.3. Research Scope
- 1.4. Key Analysis
- 1.5. Key Findings by Major Segments
- 1.6. Top strategies by Major Players
- 2. Global Mass Spectrometry Imaging Market Overview
- 2.1. Mass Spectrometry Imaging Market Dynamics
- 2.1.1. Drivers
- 2.1.2. Opportunities
- 2.1.3. Restraints
- 2.1.4. Challenges
- 2.2. Macro-economic Factors
- 2.3. Regulatory Framework
- 2.4. Market Investment Feasibility Index
- 2.5. PEST Analysis
- 2.6. PORTER’S Five Force Analysis
- 2.7. Drivers & Restraints Impact Analysis
- 2.8. Industry Chain Analysis
- 2.9. Cost Structure Analysis
- 2.10. Marketing Strategy
- 2.11. Russia-Ukraine War Impact Analysis
- 2.12. Opportunity Map Analysis
- 2.13. Market Competition Scenario Analysis
- 2.14. Product Life Cycle Analysis
- 2.15. Opportunity Orbits
- 2.16. Manufacturer Intensity Map
- 2.17. Major Companies sales by Value & Volume
- 2.1. Mass Spectrometry Imaging Market Dynamics
- 3. Global Mass Spectrometry Imaging Market Analysis, Opportunity and Forecast, 2016-2032
- 3.1. Global Mass Spectrometry Imaging Market Analysis, 2016-2021
- 3.2. Global Mass Spectrometry Imaging Market Opportunity and Forecast, 2023-2032
- 3.3. Global Mass Spectrometry Imaging Market Analysis, Opportunity and Forecast, By Type, 2016-2032
- 3.3.1. Global Mass Spectrometry Imaging Market Analysis by Type: Introduction
- 3.3.2. Market Size Absolute $ Opportunity Analysis and Forecast, By Type, 2016-2032
- 3.3.3. MALDI
- 3.3.4. ESI
- 3.3.5. Other types
- 3.4. Global Mass Spectrometry Imaging Market Analysis, Opportunity and Forecast, By Application, 2016-2032
- 3.4.1. Global Mass Spectrometry Imaging Market Analysis by Application: Introduction
- 3.4.2. Market Size Absolute $ Opportunity Analysis and Forecast, By Application, 2016-2032
- 3.4.3. Proteomics
- 3.4.4. Clinical
- 3.4.5. Metabolomics
- 4. North America Mass Spectrometry Imaging Market Analysis, Opportunity and Forecast, 2016-2032
- 4.1. North America Mass Spectrometry Imaging Market Analysis, 2016-2021
- 4.2. North America Mass Spectrometry Imaging Market Opportunity and Forecast, 2023-2032
- 4.3. North America Mass Spectrometry Imaging Market Analysis, Opportunity and Forecast, By Type, 2016-2032
- 4.3.1. North America Mass Spectrometry Imaging Market Analysis by Type: Introduction
- 4.3.2. Market Size Absolute $ Opportunity Analysis and Forecast, By Type, 2016-2032
- 4.3.3. MALDI
- 4.3.4. ESI
- 4.3.5. Other types
- 4.4. North America Mass Spectrometry Imaging Market Analysis, Opportunity and Forecast, By Application, 2016-2032
- 4.4.1. North America Mass Spectrometry Imaging Market Analysis by Application: Introduction
- 4.4.2. Market Size Absolute $ Opportunity Analysis and Forecast, By Application, 2016-2032
- 4.4.3. Proteomics
- 4.4.4. Clinical
- 4.4.5. Metabolomics
- 4.5. North America Mass Spectrometry Imaging Market Analysis, Opportunity and Forecast, By Country , 2016-2032
- 4.5.1. North America Mass Spectrometry Imaging Market Analysis by Country : Introduction
- 4.5.2. Market Size Absolute $ Opportunity Analysis and Forecast, Country , 2016-2032
- 4.5.2.1. The US
- 4.5.2.2. Canada
- 4.5.2.3. Mexico
- 5. Western Europe Mass Spectrometry Imaging Market Analysis, Opportunity and Forecast, 2016-2032
- 5.1. Western Europe Mass Spectrometry Imaging Market Analysis, 2016-2021
- 5.2. Western Europe Mass Spectrometry Imaging Market Opportunity and Forecast, 2023-2032
- 5.3. Western Europe Mass Spectrometry Imaging Market Analysis, Opportunity and Forecast, By Type, 2016-2032
- 5.3.1. Western Europe Mass Spectrometry Imaging Market Analysis by Type: Introduction
- 5.3.2. Market Size Absolute $ Opportunity Analysis and Forecast, By Type, 2016-2032
- 5.3.3. MALDI
- 5.3.4. ESI
- 5.3.5. Other types
- 5.4. Western Europe Mass Spectrometry Imaging Market Analysis, Opportunity and Forecast, By Application, 2016-2032
- 5.4.1. Western Europe Mass Spectrometry Imaging Market Analysis by Application: Introduction
- 5.4.2. Market Size Absolute $ Opportunity Analysis and Forecast, By Application, 2016-2032
- 5.4.3. Proteomics
- 5.4.4. Clinical
- 5.4.5. Metabolomics
- 5.5. Western Europe Mass Spectrometry Imaging Market Analysis, Opportunity and Forecast, By Country , 2016-2032
- 5.5.1. Western Europe Mass Spectrometry Imaging Market Analysis by Country : Introduction
- 5.5.2. Market Size Absolute $ Opportunity Analysis and Forecast, Country , 2016-2032
- 5.5.2.1. Germany
- 5.5.2.2. France
- 5.5.2.3. The UK
- 5.5.2.4. Spain
- 5.5.2.5. Italy
- 5.5.2.6. Portugal
- 5.5.2.7. Ireland
- 5.5.2.8. Austria
- 5.5.2.9. Switzerland
- 5.5.2.10. Benelux
- 5.5.2.11. Nordic
- 5.5.2.12. Rest of Western Europe
- 6. Eastern Europe Mass Spectrometry Imaging Market Analysis, Opportunity and Forecast, 2016-2032
- 6.1. Eastern Europe Mass Spectrometry Imaging Market Analysis, 2016-2021
- 6.2. Eastern Europe Mass Spectrometry Imaging Market Opportunity and Forecast, 2023-2032
- 6.3. Eastern Europe Mass Spectrometry Imaging Market Analysis, Opportunity and Forecast, By Type, 2016-2032
- 6.3.1. Eastern Europe Mass Spectrometry Imaging Market Analysis by Type: Introduction
- 6.3.2. Market Size Absolute $ Opportunity Analysis and Forecast, By Type, 2016-2032
- 6.3.3. MALDI
- 6.3.4. ESI
- 6.3.5. Other types
- 6.4. Eastern Europe Mass Spectrometry Imaging Market Analysis, Opportunity and Forecast, By Application, 2016-2032
- 6.4.1. Eastern Europe Mass Spectrometry Imaging Market Analysis by Application: Introduction
- 6.4.2. Market Size Absolute $ Opportunity Analysis and Forecast, By Application, 2016-2032
- 6.4.3. Proteomics
- 6.4.4. Clinical
- 6.4.5. Metabolomics
- 6.5. Eastern Europe Mass Spectrometry Imaging Market Analysis, Opportunity and Forecast, By Country , 2016-2032
- 6.5.1. Eastern Europe Mass Spectrometry Imaging Market Analysis by Country : Introduction
- 6.5.2. Market Size Absolute $ Opportunity Analysis and Forecast, Country , 2016-2032
- 6.5.2.1. Russia
- 6.5.2.2. Poland
- 6.5.2.3. The Czech Republic
- 6.5.2.4. Greece
- 6.5.2.5. Rest of Eastern Europe
- 7. APAC Mass Spectrometry Imaging Market Analysis, Opportunity and Forecast, 2016-2032
- 7.1. APAC Mass Spectrometry Imaging Market Analysis, 2016-2021
- 7.2. APAC Mass Spectrometry Imaging Market Opportunity and Forecast, 2023-2032
- 7.3. APAC Mass Spectrometry Imaging Market Analysis, Opportunity and Forecast, By Type, 2016-2032
- 7.3.1. APAC Mass Spectrometry Imaging Market Analysis by Type: Introduction
- 7.3.2. Market Size Absolute $ Opportunity Analysis and Forecast, By Type, 2016-2032
- 7.3.3. MALDI
- 7.3.4. ESI
- 7.3.5. Other types
- 7.4. APAC Mass Spectrometry Imaging Market Analysis, Opportunity and Forecast, By Application, 2016-2032
- 7.4.1. APAC Mass Spectrometry Imaging Market Analysis by Application: Introduction
- 7.4.2. Market Size Absolute $ Opportunity Analysis and Forecast, By Application, 2016-2032
- 7.4.3. Proteomics
- 7.4.4. Clinical
- 7.4.5. Metabolomics
- 7.5. APAC Mass Spectrometry Imaging Market Analysis, Opportunity and Forecast, By Country , 2016-2032
- 7.5.1. APAC Mass Spectrometry Imaging Market Analysis by Country : Introduction
- 7.5.2. Market Size Absolute $ Opportunity Analysis and Forecast, Country , 2016-2032
- 7.5.2.1. China
- 7.5.2.2. Japan
- 7.5.2.3. South Korea
- 7.5.2.4. India
- 7.5.2.5. Australia & New Zeland
- 7.5.2.6. Indonesia
- 7.5.2.7. Malaysia
- 7.5.2.8. Philippines
- 7.5.2.9. Singapore
- 7.5.2.10. Thailand
- 7.5.2.11. Vietnam
- 7.5.2.12. Rest of APAC
- 8. Latin America Mass Spectrometry Imaging Market Analysis, Opportunity and Forecast, 2016-2032
- 8.1. Latin America Mass Spectrometry Imaging Market Analysis, 2016-2021
- 8.2. Latin America Mass Spectrometry Imaging Market Opportunity and Forecast, 2023-2032
- 8.3. Latin America Mass Spectrometry Imaging Market Analysis, Opportunity and Forecast, By Type, 2016-2032
- 8.3.1. Latin America Mass Spectrometry Imaging Market Analysis by Type: Introduction
- 8.3.2. Market Size Absolute $ Opportunity Analysis and Forecast, By Type, 2016-2032
- 8.3.3. MALDI
- 8.3.4. ESI
- 8.3.5. Other types
- 8.4. Latin America Mass Spectrometry Imaging Market Analysis, Opportunity and Forecast, By Application, 2016-2032
- 8.4.1. Latin America Mass Spectrometry Imaging Market Analysis by Application: Introduction
- 8.4.2. Market Size Absolute $ Opportunity Analysis and Forecast, By Application, 2016-2032
- 8.4.3. Proteomics
- 8.4.4. Clinical
- 8.4.5. Metabolomics
- 8.5. Latin America Mass Spectrometry Imaging Market Analysis, Opportunity and Forecast, By Country , 2016-2032
- 8.5.1. Latin America Mass Spectrometry Imaging Market Analysis by Country : Introduction
- 8.5.2. Market Size Absolute $ Opportunity Analysis and Forecast, Country , 2016-2032
- 8.5.2.1. Brazil
- 8.5.2.2. Colombia
- 8.5.2.3. Chile
- 8.5.2.4. Argentina
- 8.5.2.5. Costa Rica
- 8.5.2.6. Rest of Latin America
- 9. Middle East & Africa Mass Spectrometry Imaging Market Analysis, Opportunity and Forecast, 2016-2032
- 9.1. Middle East & Africa Mass Spectrometry Imaging Market Analysis, 2016-2021
- 9.2. Middle East & Africa Mass Spectrometry Imaging Market Opportunity and Forecast, 2023-2032
- 9.3. Middle East & Africa Mass Spectrometry Imaging Market Analysis, Opportunity and Forecast, By Type, 2016-2032
- 9.3.1. Middle East & Africa Mass Spectrometry Imaging Market Analysis by Type: Introduction
- 9.3.2. Market Size Absolute $ Opportunity Analysis and Forecast, By Type, 2016-2032
- 9.3.3. MALDI
- 9.3.4. ESI
- 9.3.5. Other types
- 9.4. Middle East & Africa Mass Spectrometry Imaging Market Analysis, Opportunity and Forecast, By Application, 2016-2032
- 9.4.1. Middle East & Africa Mass Spectrometry Imaging Market Analysis by Application: Introduction
- 9.4.2. Market Size Absolute $ Opportunity Analysis and Forecast, By Application, 2016-2032
- 9.4.3. Proteomics
- 9.4.4. Clinical
- 9.4.5. Metabolomics
- 9.5. Middle East & Africa Mass Spectrometry Imaging Market Analysis, Opportunity and Forecast, By Country , 2016-2032
- 9.5.1. Middle East & Africa Mass Spectrometry Imaging Market Analysis by Country : Introduction
- 9.5.2. Market Size Absolute $ Opportunity Analysis and Forecast, Country , 2016-2032
- 9.5.2.1. Algeria
- 9.5.2.2. Egypt
- 9.5.2.3. Israel
- 9.5.2.4. Kuwait
- 9.5.2.5. Nigeria
- 9.5.2.6. Saudi Arabia
- 9.5.2.7. South Africa
- 9.5.2.8. Turkey
- 9.5.2.9. The UAE
- 9.5.2.10. Rest of MEA
- 10. Global Mass Spectrometry Imaging Market Analysis, Opportunity and Forecast, By Region , 2016-2032
- 10.1. Global Mass Spectrometry Imaging Market Analysis by Region : Introduction
- 10.2. Market Size Absolute $ Opportunity Analysis and Forecast, By Region , 2016-2032
- 10.2.1. North America
- 10.2.2. Western Europe
- 10.2.3. Eastern Europe
- 10.2.4. APAC
- 10.2.5. Latin America
- 10.2.6. Middle East & Africa
- 11. Global Mass Spectrometry Imaging Market Competitive Landscape, Market Share Analysis, and Company Profiles
- 11.1. Market Share Analysis
- 11.2. Company Profiles
- 11.3. Thermo Fisher Scientific Inc.
- 11.3.1. Company Overview
- 11.3.2. Financial Highlights
- 11.3.3. Product Portfolio
- 11.3.4. SWOT Analysis
- 11.3.5. Key Strategies and Developments
- 11.4. Danaher Corporation
- 11.4.1. Company Overview
- 11.4.2. Financial Highlights
- 11.4.3. Product Portfolio
- 11.4.4. SWOT Analysis
- 11.4.5. Key Strategies and Developments
- 11.5. Shimadzu Corporation
- 11.5.1. Company Overview
- 11.5.2. Financial Highlights
- 11.5.3. Product Portfolio
- 11.5.4. SWOT Analysis
- 11.5.5. Key Strategies and Developments
- 11.6. Waters Corporation
- 11.6.1. Company Overview
- 11.6.2. Financial Highlights
- 11.6.3. Product Portfolio
- 11.6.4. SWOT Analysis
- 11.6.5. Key Strategies and Developments
- 11.7. Bruker Corporation
- 11.7.1. Company Overview
- 11.7.2. Financial Highlights
- 11.7.3. Product Portfolio
- 11.7.4. SWOT Analysis
- 11.7.5. Key Strategies and Developments
- 11.8. JEOL Ltd.
- 11.8.1. Company Overview
- 11.8.2. Financial Highlights
- 11.8.3. Product Portfolio
- 11.8.4. SWOT Analysis
- 11.8.5. Key Strategies and Developments
- 11.9. Analytik Jena AG
- 11.9.1. Company Overview
- 11.9.2. Financial Highlights
- 11.9.3. Product Portfolio
- 11.9.4. SWOT Analysis
- 11.9.5. Key Strategies and Developments
- 11.13.1. Company Overview
- 11.13.2. Financial Highlights
- 11.13.3. Product Portfolio
- 11.13.4. SWOT Analysis
- 11.13.5. Key Strategies and Developments
- 12. Assumptions and Acronyms
- 13. Research Methodology
- 14. Contact
"
- List of Figures
- "
- Figure 1: Global Mass Spectrometry Imaging Market Revenue (US$ Mn) Market Share by Type in 2022
- Figure 2: Global Mass Spectrometry Imaging Market Market Attractiveness Analysis by Type, 2016-2032
- Figure 3: Global Mass Spectrometry Imaging Market Revenue (US$ Mn) Market Share by Applicationin 2022
- Figure 4: Global Mass Spectrometry Imaging Market Market Attractiveness Analysis by Application, 2016-2032
- Figure 5: Global Mass Spectrometry Imaging Market Revenue (US$ Mn) Market Share by Region in 2022
- Figure 6: Global Mass Spectrometry Imaging Market Market Attractiveness Analysis by Region, 2016-2032
- Figure 7: Global Mass Spectrometry Imaging Market Market Revenue (US$ Mn) (2016-2032)
- Figure 8: Global Mass Spectrometry Imaging Market Market Revenue (US$ Mn) Comparison by Region (2016-2032)
- Figure 9: Global Mass Spectrometry Imaging Market Market Revenue (US$ Mn) Comparison by Type (2016-2032)
- Figure 10: Global Mass Spectrometry Imaging Market Market Revenue (US$ Mn) Comparison by Application (2016-2032)
- Figure 11: Global Mass Spectrometry Imaging Market Market Y-o-Y Growth Rate Comparison by Region (2016-2032)
- Figure 12: Global Mass Spectrometry Imaging Market Market Y-o-Y Growth Rate Comparison by Type (2016-2032)
- Figure 13: Global Mass Spectrometry Imaging Market Market Y-o-Y Growth Rate Comparison by Application (2016-2032)
- Figure 14: Global Mass Spectrometry Imaging Market Market Share Comparison by Region (2016-2032)
- Figure 15: Global Mass Spectrometry Imaging Market Market Share Comparison by Type (2016-2032)
- Figure 16: Global Mass Spectrometry Imaging Market Market Share Comparison by Application (2016-2032)
- Figure 17: North America Mass Spectrometry Imaging Market Revenue (US$ Mn) Market Share by Typein 2022
- Figure 18: North America Mass Spectrometry Imaging Market Market Attractiveness Analysis by Type, 2016-2032
- Figure 19: North America Mass Spectrometry Imaging Market Revenue (US$ Mn) Market Share by Applicationin 2022
- Figure 20: North America Mass Spectrometry Imaging Market Market Attractiveness Analysis by Application, 2016-2032
- Figure 21: North America Mass Spectrometry Imaging Market Revenue (US$ Mn) Market Share by Country in 2022
- Figure 22: North America Mass Spectrometry Imaging Market Market Attractiveness Analysis by Country, 2016-2032
- Figure 23: North America Mass Spectrometry Imaging Market Market Revenue (US$ Mn) (2016-2032)
- Figure 24: North America Mass Spectrometry Imaging Market Market Revenue (US$ Mn) Comparison by Country (2016-2032)
- Figure 25: North America Mass Spectrometry Imaging Market Market Revenue (US$ Mn) Comparison by Type (2016-2032)
- Figure 26: North America Mass Spectrometry Imaging Market Market Revenue (US$ Mn) Comparison by Application (2016-2032)
- Figure 27: North America Mass Spectrometry Imaging Market Market Y-o-Y Growth Rate Comparison by Country (2016-2032)
- Figure 28: North America Mass Spectrometry Imaging Market Market Y-o-Y Growth Rate Comparison by Type (2016-2032)
- Figure 29: North America Mass Spectrometry Imaging Market Market Y-o-Y Growth Rate Comparison by Application (2016-2032)
- Figure 30: North America Mass Spectrometry Imaging Market Market Share Comparison by Country (2016-2032)
- Figure 31: North America Mass Spectrometry Imaging Market Market Share Comparison by Type (2016-2032)
- Figure 32: North America Mass Spectrometry Imaging Market Market Share Comparison by Application (2016-2032)
- Figure 33: Western Europe Mass Spectrometry Imaging Market Revenue (US$ Mn) Market Share by Typein 2022
- Figure 34: Western Europe Mass Spectrometry Imaging Market Market Attractiveness Analysis by Type, 2016-2032
- Figure 35: Western Europe Mass Spectrometry Imaging Market Revenue (US$ Mn) Market Share by Applicationin 2022
- Figure 36: Western Europe Mass Spectrometry Imaging Market Market Attractiveness Analysis by Application, 2016-2032
- Figure 37: Western Europe Mass Spectrometry Imaging Market Revenue (US$ Mn) Market Share by Country in 2022
- Figure 38: Western Europe Mass Spectrometry Imaging Market Market Attractiveness Analysis by Country, 2016-2032
- Figure 39: Western Europe Mass Spectrometry Imaging Market Market Revenue (US$ Mn) (2016-2032)
- Figure 40: Western Europe Mass Spectrometry Imaging Market Market Revenue (US$ Mn) Comparison by Country (2016-2032)
- Figure 41: Western Europe Mass Spectrometry Imaging Market Market Revenue (US$ Mn) Comparison by Type (2016-2032)
- Figure 42: Western Europe Mass Spectrometry Imaging Market Market Revenue (US$ Mn) Comparison by Application (2016-2032)
- Figure 43: Western Europe Mass Spectrometry Imaging Market Market Y-o-Y Growth Rate Comparison by Country (2016-2032)
- Figure 44: Western Europe Mass Spectrometry Imaging Market Market Y-o-Y Growth Rate Comparison by Type (2016-2032)
- Figure 45: Western Europe Mass Spectrometry Imaging Market Market Y-o-Y Growth Rate Comparison by Application (2016-2032)
- Figure 46: Western Europe Mass Spectrometry Imaging Market Market Share Comparison by Country (2016-2032)
- Figure 47: Western Europe Mass Spectrometry Imaging Market Market Share Comparison by Type (2016-2032)
- Figure 48: Western Europe Mass Spectrometry Imaging Market Market Share Comparison by Application (2016-2032)
- Figure 49: Eastern Europe Mass Spectrometry Imaging Market Revenue (US$ Mn) Market Share by Typein 2022
- Figure 50: Eastern Europe Mass Spectrometry Imaging Market Market Attractiveness Analysis by Type, 2016-2032
- Figure 51: Eastern Europe Mass Spectrometry Imaging Market Revenue (US$ Mn) Market Share by Applicationin 2022
- Figure 52: Eastern Europe Mass Spectrometry Imaging Market Market Attractiveness Analysis by Application, 2016-2032
- Figure 53: Eastern Europe Mass Spectrometry Imaging Market Revenue (US$ Mn) Market Share by Country in 2022
- Figure 54: Eastern Europe Mass Spectrometry Imaging Market Market Attractiveness Analysis by Country, 2016-2032
- Figure 55: Eastern Europe Mass Spectrometry Imaging Market Market Revenue (US$ Mn) (2016-2032)
- Figure 56: Eastern Europe Mass Spectrometry Imaging Market Market Revenue (US$ Mn) Comparison by Country (2016-2032)
- Figure 57: Eastern Europe Mass Spectrometry Imaging Market Market Revenue (US$ Mn) Comparison by Type (2016-2032)
- Figure 58: Eastern Europe Mass Spectrometry Imaging Market Market Revenue (US$ Mn) Comparison by Application (2016-2032)
- Figure 59: Eastern Europe Mass Spectrometry Imaging Market Market Y-o-Y Growth Rate Comparison by Country (2016-2032)
- Figure 60: Eastern Europe Mass Spectrometry Imaging Market Market Y-o-Y Growth Rate Comparison by Type (2016-2032)
- Figure 61: Eastern Europe Mass Spectrometry Imaging Market Market Y-o-Y Growth Rate Comparison by Application (2016-2032)
- Figure 62: Eastern Europe Mass Spectrometry Imaging Market Market Share Comparison by Country (2016-2032)
- Figure 63: Eastern Europe Mass Spectrometry Imaging Market Market Share Comparison by Type (2016-2032)
- Figure 64: Eastern Europe Mass Spectrometry Imaging Market Market Share Comparison by Application (2016-2032)
- Figure 65: APAC Mass Spectrometry Imaging Market Revenue (US$ Mn) Market Share by Typein 2022
- Figure 66: APAC Mass Spectrometry Imaging Market Market Attractiveness Analysis by Type, 2016-2032
- Figure 67: APAC Mass Spectrometry Imaging Market Revenue (US$ Mn) Market Share by Applicationin 2022
- Figure 68: APAC Mass Spectrometry Imaging Market Market Attractiveness Analysis by Application, 2016-2032
- Figure 69: APAC Mass Spectrometry Imaging Market Revenue (US$ Mn) Market Share by Country in 2022
- Figure 70: APAC Mass Spectrometry Imaging Market Market Attractiveness Analysis by Country, 2016-2032
- Figure 71: APAC Mass Spectrometry Imaging Market Market Revenue (US$ Mn) (2016-2032)
- Figure 72: APAC Mass Spectrometry Imaging Market Market Revenue (US$ Mn) Comparison by Country (2016-2032)
- Figure 73: APAC Mass Spectrometry Imaging Market Market Revenue (US$ Mn) Comparison by Type (2016-2032)
- Figure 74: APAC Mass Spectrometry Imaging Market Market Revenue (US$ Mn) Comparison by Application (2016-2032)
- Figure 75: APAC Mass Spectrometry Imaging Market Market Y-o-Y Growth Rate Comparison by Country (2016-2032)
- Figure 76: APAC Mass Spectrometry Imaging Market Market Y-o-Y Growth Rate Comparison by Type (2016-2032)
- Figure 77: APAC Mass Spectrometry Imaging Market Market Y-o-Y Growth Rate Comparison by Application (2016-2032)
- Figure 78: APAC Mass Spectrometry Imaging Market Market Share Comparison by Country (2016-2032)
- Figure 79: APAC Mass Spectrometry Imaging Market Market Share Comparison by Type (2016-2032)
- Figure 80: APAC Mass Spectrometry Imaging Market Market Share Comparison by Application (2016-2032)
- Figure 81: Latin America Mass Spectrometry Imaging Market Revenue (US$ Mn) Market Share by Typein 2022
- Figure 82: Latin America Mass Spectrometry Imaging Market Market Attractiveness Analysis by Type, 2016-2032
- Figure 83: Latin America Mass Spectrometry Imaging Market Revenue (US$ Mn) Market Share by Applicationin 2022
- Figure 84: Latin America Mass Spectrometry Imaging Market Market Attractiveness Analysis by Application, 2016-2032
- Figure 85: Latin America Mass Spectrometry Imaging Market Revenue (US$ Mn) Market Share by Country in 2022
- Figure 86: Latin America Mass Spectrometry Imaging Market Market Attractiveness Analysis by Country, 2016-2032
- Figure 87: Latin America Mass Spectrometry Imaging Market Market Revenue (US$ Mn) (2016-2032)
- Figure 88: Latin America Mass Spectrometry Imaging Market Market Revenue (US$ Mn) Comparison by Country (2016-2032)
- Figure 89: Latin America Mass Spectrometry Imaging Market Market Revenue (US$ Mn) Comparison by Type (2016-2032)
- Figure 90: Latin America Mass Spectrometry Imaging Market Market Revenue (US$ Mn) Comparison by Application (2016-2032)
- Figure 91: Latin America Mass Spectrometry Imaging Market Market Y-o-Y Growth Rate Comparison by Country (2016-2032)
- Figure 92: Latin America Mass Spectrometry Imaging Market Market Y-o-Y Growth Rate Comparison by Type (2016-2032)
- Figure 93: Latin America Mass Spectrometry Imaging Market Market Y-o-Y Growth Rate Comparison by Application (2016-2032)
- Figure 94: Latin America Mass Spectrometry Imaging Market Market Share Comparison by Country (2016-2032)
- Figure 95: Latin America Mass Spectrometry Imaging Market Market Share Comparison by Type (2016-2032)
- Figure 96: Latin America Mass Spectrometry Imaging Market Market Share Comparison by Application (2016-2032)
- Figure 97: Middle East & Africa Mass Spectrometry Imaging Market Revenue (US$ Mn) Market Share by Typein 2022
- Figure 98: Middle East & Africa Mass Spectrometry Imaging Market Market Attractiveness Analysis by Type, 2016-2032
- Figure 99: Middle East & Africa Mass Spectrometry Imaging Market Revenue (US$ Mn) Market Share by Applicationin 2022
- Figure 100: Middle East & Africa Mass Spectrometry Imaging Market Market Attractiveness Analysis by Application, 2016-2032
- Figure 101: Middle East & Africa Mass Spectrometry Imaging Market Revenue (US$ Mn) Market Share by Country in 2022
- Figure 102: Middle East & Africa Mass Spectrometry Imaging Market Market Attractiveness Analysis by Country, 2016-2032
- Figure 103: Middle East & Africa Mass Spectrometry Imaging Market Market Revenue (US$ Mn) (2016-2032)
- Figure 104: Middle East & Africa Mass Spectrometry Imaging Market Market Revenue (US$ Mn) Comparison by Country (2016-2032)
- Figure 105: Middle East & Africa Mass Spectrometry Imaging Market Market Revenue (US$ Mn) Comparison by Type (2016-2032)
- Figure 106: Middle East & Africa Mass Spectrometry Imaging Market Market Revenue (US$ Mn) Comparison by Application (2016-2032)
- Figure 107: Middle East & Africa Mass Spectrometry Imaging Market Market Y-o-Y Growth Rate Comparison by Country (2016-2032)
- Figure 108: Middle East & Africa Mass Spectrometry Imaging Market Market Y-o-Y Growth Rate Comparison by Type (2016-2032)
- Figure 109: Middle East & Africa Mass Spectrometry Imaging Market Market Y-o-Y Growth Rate Comparison by Application (2016-2032)
- Figure 110: Middle East & Africa Mass Spectrometry Imaging Market Market Share Comparison by Country (2016-2032)
- Figure 111: Middle East & Africa Mass Spectrometry Imaging Market Market Share Comparison by Type (2016-2032)
- Figure 112: Middle East & Africa Mass Spectrometry Imaging Market Market Share Comparison by Application (2016-2032)
"
- List of Tables
- "
- Table 1: Global Mass Spectrometry Imaging Market Market Comparison by Type (2016-2032)
- Table 2: Global Mass Spectrometry Imaging Market Market Comparison by Application (2016-2032)
- Table 3: Global Mass Spectrometry Imaging Market Revenue (US$ Mn) Comparison by Region (2016-2032)
- Table 4: Global Mass Spectrometry Imaging Market Market Revenue (US$ Mn) (2016-2032)
- Table 5: Global Mass Spectrometry Imaging Market Market Revenue (US$ Mn) Comparison by Region (2016-2032)
- Table 6: Global Mass Spectrometry Imaging Market Market Revenue (US$ Mn) Comparison by Type (2016-2032)
- Table 7: Global Mass Spectrometry Imaging Market Market Revenue (US$ Mn) Comparison by Application (2016-2032)
- Table 8: Global Mass Spectrometry Imaging Market Market Y-o-Y Growth Rate Comparison by Region (2016-2032)
- Table 9: Global Mass Spectrometry Imaging Market Market Y-o-Y Growth Rate Comparison by Type (2016-2032)
- Table 10: Global Mass Spectrometry Imaging Market Market Y-o-Y Growth Rate Comparison by Application (2016-2032)
- Table 11: Global Mass Spectrometry Imaging Market Market Share Comparison by Region (2016-2032)
- Table 12: Global Mass Spectrometry Imaging Market Market Share Comparison by Type (2016-2032)
- Table 13: Global Mass Spectrometry Imaging Market Market Share Comparison by Application (2016-2032)
- Table 14: North America Mass Spectrometry Imaging Market Market Comparison by Application (2016-2032)
- Table 15: North America Mass Spectrometry Imaging Market Revenue (US$ Mn) Comparison by Country (2016-2032)
- Table 16: North America Mass Spectrometry Imaging Market Market Revenue (US$ Mn) (2016-2032)
- Table 17: North America Mass Spectrometry Imaging Market Market Revenue (US$ Mn) Comparison by Country (2016-2032)
- Table 18: North America Mass Spectrometry Imaging Market Market Revenue (US$ Mn) Comparison by Type (2016-2032)
- Table 19: North America Mass Spectrometry Imaging Market Market Revenue (US$ Mn) Comparison by Application (2016-2032)
- Table 20: North America Mass Spectrometry Imaging Market Market Y-o-Y Growth Rate Comparison by Country (2016-2032)
- Table 21: North America Mass Spectrometry Imaging Market Market Y-o-Y Growth Rate Comparison by Type (2016-2032)
- Table 22: North America Mass Spectrometry Imaging Market Market Y-o-Y Growth Rate Comparison by Application (2016-2032)
- Table 23: North America Mass Spectrometry Imaging Market Market Share Comparison by Country (2016-2032)
- Table 24: North America Mass Spectrometry Imaging Market Market Share Comparison by Type (2016-2032)
- Table 25: North America Mass Spectrometry Imaging Market Market Share Comparison by Application (2016-2032)
- Table 26: Western Europe Mass Spectrometry Imaging Market Market Comparison by Type (2016-2032)
- Table 27: Western Europe Mass Spectrometry Imaging Market Market Comparison by Application (2016-2032)
- Table 28: Western Europe Mass Spectrometry Imaging Market Revenue (US$ Mn) Comparison by Country (2016-2032)
- Table 29: Western Europe Mass Spectrometry Imaging Market Market Revenue (US$ Mn) (2016-2032)
- Table 30: Western Europe Mass Spectrometry Imaging Market Market Revenue (US$ Mn) Comparison by Country (2016-2032)
- Table 31: Western Europe Mass Spectrometry Imaging Market Market Revenue (US$ Mn) Comparison by Type (2016-2032)
- Table 32: Western Europe Mass Spectrometry Imaging Market Market Revenue (US$ Mn) Comparison by Application (2016-2032)
- Table 33: Western Europe Mass Spectrometry Imaging Market Market Y-o-Y Growth Rate Comparison by Country (2016-2032)
- Table 34: Western Europe Mass Spectrometry Imaging Market Market Y-o-Y Growth Rate Comparison by Type (2016-2032)
- Table 35: Western Europe Mass Spectrometry Imaging Market Market Y-o-Y Growth Rate Comparison by Application (2016-2032)
- Table 36: Western Europe Mass Spectrometry Imaging Market Market Share Comparison by Country (2016-2032)
- Table 37: Western Europe Mass Spectrometry Imaging Market Market Share Comparison by Type (2016-2032)
- Table 38: Western Europe Mass Spectrometry Imaging Market Market Share Comparison by Application (2016-2032)
- Table 39: Eastern Europe Mass Spectrometry Imaging Market Market Comparison by Type (2016-2032)
- Table 40: Eastern Europe Mass Spectrometry Imaging Market Market Comparison by Application (2016-2032)
- Table 41: Eastern Europe Mass Spectrometry Imaging Market Revenue (US$ Mn) Comparison by Country (2016-2032)
- Table 42: Eastern Europe Mass Spectrometry Imaging Market Market Revenue (US$ Mn) (2016-2032)
- Table 43: Eastern Europe Mass Spectrometry Imaging Market Market Revenue (US$ Mn) Comparison by Country (2016-2032)
- Table 44: Eastern Europe Mass Spectrometry Imaging Market Market Revenue (US$ Mn) Comparison by Type (2016-2032)
- Table 45: Eastern Europe Mass Spectrometry Imaging Market Market Revenue (US$ Mn) Comparison by Application (2016-2032)
- Table 46: Eastern Europe Mass Spectrometry Imaging Market Market Y-o-Y Growth Rate Comparison by Country (2016-2032)
- Table 47: Eastern Europe Mass Spectrometry Imaging Market Market Y-o-Y Growth Rate Comparison by Type (2016-2032)
- Table 48: Eastern Europe Mass Spectrometry Imaging Market Market Y-o-Y Growth Rate Comparison by Application (2016-2032)
- Table 49: Eastern Europe Mass Spectrometry Imaging Market Market Share Comparison by Country (2016-2032)
- Table 50: Eastern Europe Mass Spectrometry Imaging Market Market Share Comparison by Type (2016-2032)
- Table 51: Eastern Europe Mass Spectrometry Imaging Market Market Share Comparison by Application (2016-2032)
- Table 52: APAC Mass Spectrometry Imaging Market Market Comparison by Type (2016-2032)
- Table 53: APAC Mass Spectrometry Imaging Market Market Comparison by Application (2016-2032)
- Table 54: APAC Mass Spectrometry Imaging Market Revenue (US$ Mn) Comparison by Country (2016-2032)
- Table 55: APAC Mass Spectrometry Imaging Market Market Revenue (US$ Mn) (2016-2032)
- Table 56: APAC Mass Spectrometry Imaging Market Market Revenue (US$ Mn) Comparison by Country (2016-2032)
- Table 57: APAC Mass Spectrometry Imaging Market Market Revenue (US$ Mn) Comparison by Type (2016-2032)
- Table 58: APAC Mass Spectrometry Imaging Market Market Revenue (US$ Mn) Comparison by Application (2016-2032)
- Table 59: APAC Mass Spectrometry Imaging Market Market Y-o-Y Growth Rate Comparison by Country (2016-2032)
- Table 60: APAC Mass Spectrometry Imaging Market Market Y-o-Y Growth Rate Comparison by Type (2016-2032)
- Table 61: APAC Mass Spectrometry Imaging Market Market Y-o-Y Growth Rate Comparison by Application (2016-2032)
- Table 62: APAC Mass Spectrometry Imaging Market Market Share Comparison by Country (2016-2032)
- Table 63: APAC Mass Spectrometry Imaging Market Market Share Comparison by Type (2016-2032)
- Table 64: APAC Mass Spectrometry Imaging Market Market Share Comparison by Application (2016-2032)
- Table 65: Latin America Mass Spectrometry Imaging Market Market Comparison by Type (2016-2032)
- Table 66: Latin America Mass Spectrometry Imaging Market Market Comparison by Application (2016-2032)
- Table 67: Latin America Mass Spectrometry Imaging Market Revenue (US$ Mn) Comparison by Country (2016-2032)
- Table 68: Latin America Mass Spectrometry Imaging Market Market Revenue (US$ Mn) (2016-2032)
- Table 69: Latin America Mass Spectrometry Imaging Market Market Revenue (US$ Mn) Comparison by Country (2016-2032)
- Table 70: Latin America Mass Spectrometry Imaging Market Market Revenue (US$ Mn) Comparison by Type (2016-2032)
- Table 71: Latin America Mass Spectrometry Imaging Market Market Revenue (US$ Mn) Comparison by Application (2016-2032)
- Table 72: Latin America Mass Spectrometry Imaging Market Market Y-o-Y Growth Rate Comparison by Country (2016-2032)
- Table 73: Latin America Mass Spectrometry Imaging Market Market Y-o-Y Growth Rate Comparison by Type (2016-2032)
- Table 74: Latin America Mass Spectrometry Imaging Market Market Y-o-Y Growth Rate Comparison by Application (2016-2032)
- Table 75: Latin America Mass Spectrometry Imaging Market Market Share Comparison by Country (2016-2032)
- Table 76: Latin America Mass Spectrometry Imaging Market Market Share Comparison by Type (2016-2032)
- Table 77: Latin America Mass Spectrometry Imaging Market Market Share Comparison by Application (2016-2032)
- Table 78: Middle East & Africa Mass Spectrometry Imaging Market Market Comparison by Type (2016-2032)
- Table 79: Middle East & Africa Mass Spectrometry Imaging Market Market Comparison by Application (2016-2032)
- Table 80: Middle East & Africa Mass Spectrometry Imaging Market Revenue (US$ Mn) Comparison by Country (2016-2032)
- Table 81: Middle East & Africa Mass Spectrometry Imaging Market Market Revenue (US$ Mn) (2016-2032)
- Table 82: Middle East & Africa Mass Spectrometry Imaging Market Market Revenue (US$ Mn) Comparison by Country (2016-2032)
- Table 83: Middle East & Africa Mass Spectrometry Imaging Market Market Revenue (US$ Mn) Comparison by Type (2016-2032)
- Table 84: Middle East & Africa Mass Spectrometry Imaging Market Market Revenue (US$ Mn) Comparison by Application (2016-2032)
- Table 85: Middle East & Africa Mass Spectrometry Imaging Market Market Y-o-Y Growth Rate Comparison by Country (2016-2032)
- Table 86: Middle East & Africa Mass Spectrometry Imaging Market Market Y-o-Y Growth Rate Comparison by Type (2016-2032)
- Table 87: Middle East & Africa Mass Spectrometry Imaging Market Market Y-o-Y Growth Rate Comparison by Application (2016-2032)
- Table 88: Middle East & Africa Mass Spectrometry Imaging Market Market Share Comparison by Country (2016-2032)
- Table 89: Middle East & Africa Mass Spectrometry Imaging Market Market Share Comparison by Type (2016-2032)
- Table 90: Middle East & Africa Mass Spectrometry Imaging Market Market Share Comparison by Application (2016-2032)
- 1. Executive Summary
-
- Thermo Fisher Scientific Inc.
- Danaher Corporation
- Shimadzu Corporation
- Waters Corporation
- Bruker Corporation
- JEOL Ltd.
- Analytik Jena AG
Our Clients


View Our Licence Options
