
Lab On Chip Market Report By Product (Reagents & Consumables, Software, IV Needles), By Technology (Microfluidics, Microarrays, Immunoassay, Tissue Biochip, Others), By Application (Clinical Diagnostics, Point-of-Care Testing (POCT), Drug Discovery and Development, Genomics and Proteomics, Environmental Monitoring, Food and Beverage Testing, Others), By End User, By Region and Companies - Industry Segment Outlook, Market Assessment, Competition Scenario, Trends and Forecast 2024-2033
-
46111
-
May 2024
-
290
-


-
This report was compiled by Vishwa Gaul Vishwa is an experienced market research and consulting professional with over 8 years of expertise in the ICT industry, contributing to over 700 reports across telecommunications, software, hardware, and digital solutions. Correspondence Team Lead- ICT Linkedin | Detailed Market research Methodology Our methodology involves a mix of primary research, including interviews with leading mental health experts, and secondary research from reputable medical journals and databases. View Detailed Methodology Page
-
Quick Navigation
Report Overview
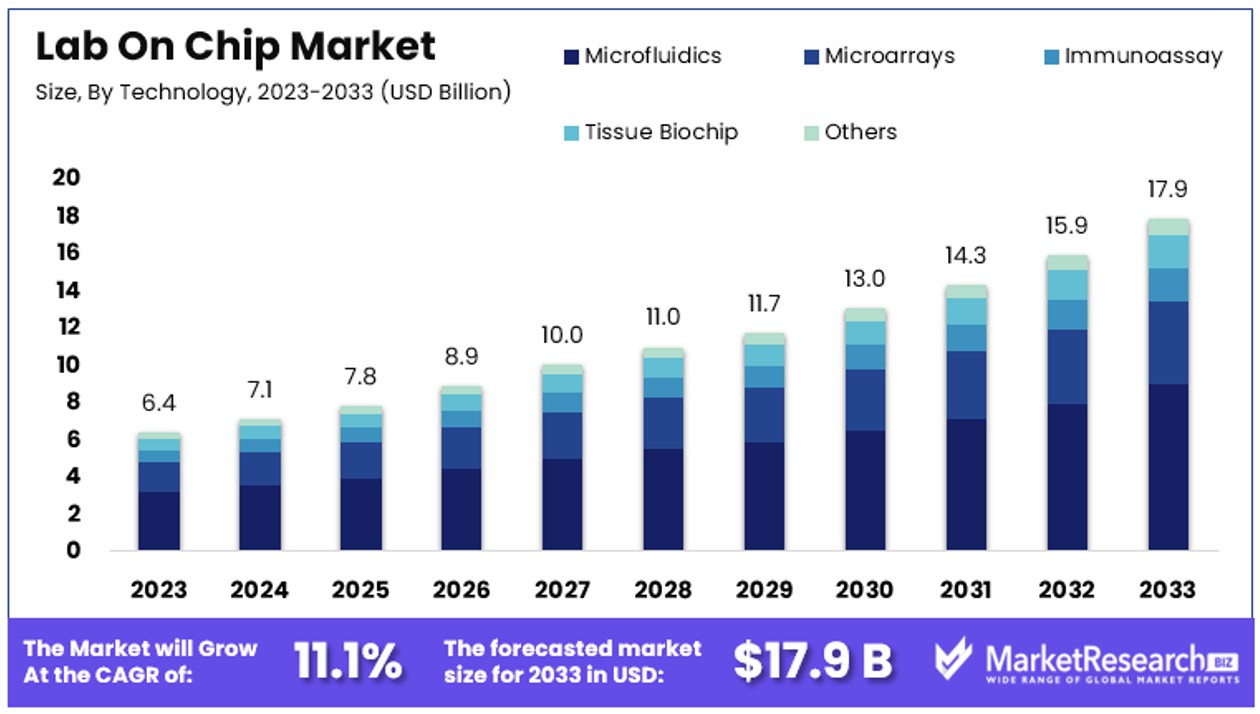
The Global Lab On Chip Market size is expected to be worth around USD 17.9 Billion by 2033, from USD 6.4 Billion in 2023, growing at a CAGR of 11.1% during the forecast period from 2024 to 2033.
The Lab On Chip Market is at the forefront of the miniaturization trend in analytical technologies. These devices integrate one or several laboratory functions on a single chip-sized platform, enabling diagnostics and research at reduced costs and with high efficiency.
Primarily driven by the healthcare and pharmaceutical sectors, these chips are pivotal in personalized medicine, point-of-care testing, and environmental monitoring. The technology's rapid data processing and reduced reagent use appeal to businesses aiming to innovate and streamline operations. For leaders in various industries, understanding this market is key to leveraging compact, cost-effective solutions for complex analytical challenges.
The Lab-on-Chip (LOC) Market is experiencing robust growth, driven by advancements in healthcare and pharmaceutical research. LOC technology, which integrates laboratory functions on a single chip, is revolutionizing diagnostics and drug discovery. The increasing prevalence of chronic diseases further propels the demand for LOC devices.
In the United States, approximately 45% of the population, or 133 million Americans, suffer from at least one chronic disease. Chronic diseases are responsible for seven out of 10 deaths, causing more than 1.7 million deaths annually. Heart disease, cancer, stroke, chronic obstructive pulmonary disease, and diabetes are the leading culprits, accounting for over two-thirds of all deaths. The rise in these chronic conditions underscores the need for efficient diagnostic tools, making LOC devices indispensable in modern healthcare.
The pharmaceutical industry also plays a significant role in the LOC market. Around 90% of all drugs sold globally are small molecules, highlighting the importance of small-molecule drug discovery. LOC technology facilitates high-throughput screening and precise analysis, streamlining the drug development process and reducing time-to-market for new therapies.
Moreover, the integration of LOC devices in point-of-care testing enhances patient outcomes by enabling rapid and accurate diagnostics. This capability is crucial in managing chronic diseases, where timely intervention can significantly improve quality of life.
Overall, the Lab-on-Chip Market is poised for significant expansion, driven by the growing need for advanced diagnostic tools and efficient drug discovery methods. The increasing prevalence of chronic diseases and the critical role of small-molecule drugs further bolster the demand for LOC technology, making it a vital component of the future of healthcare.
Key Takeaways
- Market Value: The Global Lab On Chip (LoC) Market is projected to reach approximately USD 17.9 Billion by 2033, experiencing substantial growth from USD 6.4 Billion in 2023. This growth is fueled by a robust CAGR of 11.1% during the forecast period spanning from 2024 to 2033.
- Product Analysis: Reagents & Consumables dominate the market, playing a pivotal role in conducting tests and experiments using LoC devices.
- Technology Analysis: Microfluidics leads the technology segment, facilitating precise handling of small fluid volumes and enabling complex biochemical functions.
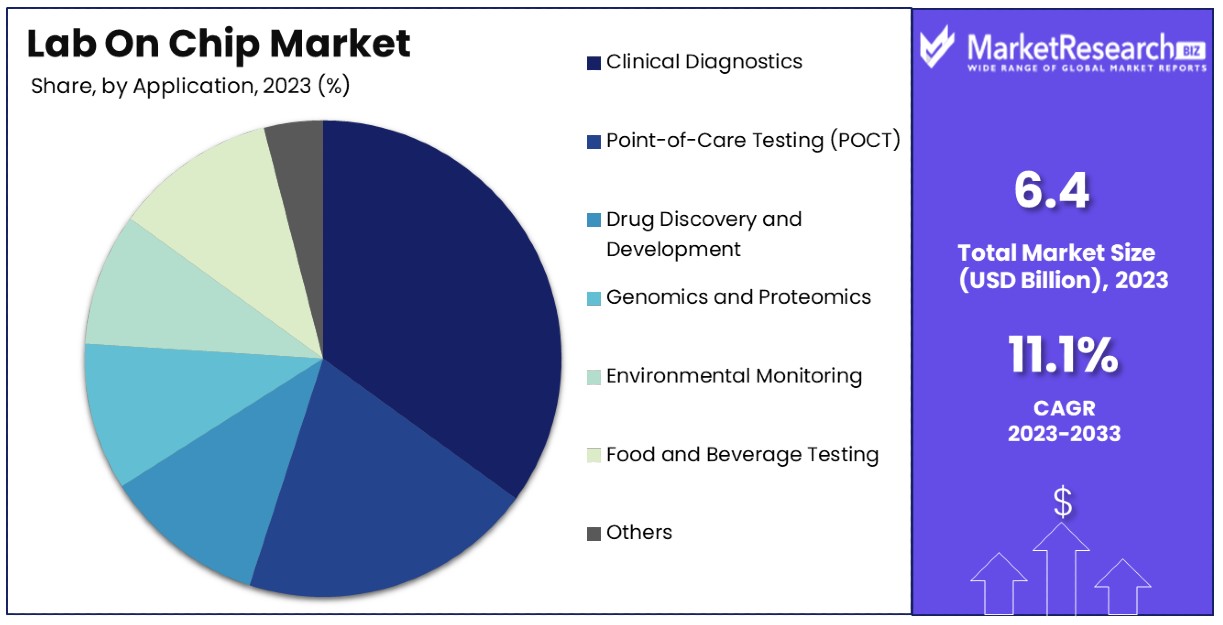
- Application Analysis: Clinical Diagnostics commands the largest share, driven by the need for swift and efficient disease detection and management. Point-of-Care Testing (POCT) follows closely, addressing the demand for on-site diagnostic solutions, particularly in remote and resource-limited settings.
- End User Analysis: Hospitals and Clinics emerge as the primary users of LoC devices, emphasizing the critical need for rapid and accurate diagnostic tools in patient care settings.
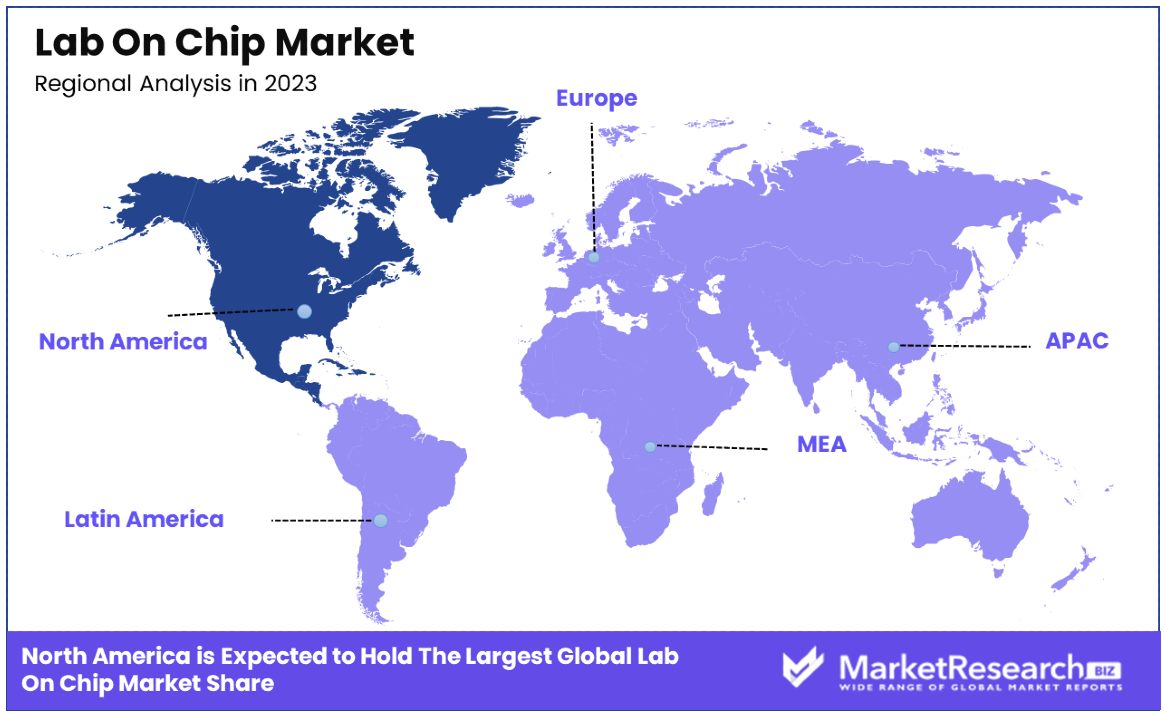
- North America dominates the global LoC market with a substantial 43.8% market share, reflecting the region's emphasis on healthcare innovation and technological advancements.
- Europe follows closely behind, holding approximately 27.2% of the market share, highlighting the widespread adoption of LoC technology across various sectors.
- Analyst Viewpoint: Analysts anticipate robust growth in the Lab On Chip market, driven by escalating demand for rapid and accurate diagnostic solutions, particularly in clinical settings. The dominance of Microfluidics underscores the technology's pivotal role, while the expanding applications across healthcare and research sectors signal promising opportunities for market players.
Driving Factors
Increasing Demand for Point-of-Care Testing Drives Market Growth
The escalating demand for point-of-care (PoC) testing significantly propels the growth of the Lab on Chip (LoC) market. PoC testing's appeal lies in its ability to deliver immediate diagnostic results, which is crucial in settings like hospitals, clinics, and remote areas. LoC devices, leveraging their miniaturization and portability, are instrumental in this context. They allow complex analyses with reduced sample sizes and expedite the diagnostic process.
Statistically, the global point-of-care diagnostics market is projected to grow at a CAGR of approximately 9.4% from 2020 to 2027, indicating a rising trajectory that LoC devices are well-positioned to capitalize on. Companies such as Abbott and Cepheid are at the forefront, having developed rapid molecular diagnostic systems that can detect diseases like COVID-19 and influenza swiftly. This advancement not only enhances healthcare responsiveness but also broadens the applicability of LoC devices in various medical settings.
Advancements in Microfluidics and Nanotechnology Drives Market Growth
The Lab on Chip market is increasingly driven by advancements in microfluidics and nanotechnology. These technological enhancements facilitate the development of LoC devices that integrate multiple functions onto a single chip, which is pivotal for conducting sophisticated biochemical reactions and assays efficiently. By manipulating small volumes of fluids with precision, these devices minimize errors and enhance analytical capabilities.
Notably, the microfluidics market is expected to reach USD 44 billion by 2027, growing at a CAGR of 17.5%. Companies like Danaher and Agilent Technologies are leveraging these advancements to innovate and enhance their LoC offerings. The synergy between microfluidics and nanotechnology not only boosts the performance of LoC devices but also extends their applications across various scientific and medical fields, thereby amplifying their impact on the market.
Rising Adoption in Drug Discovery and Development Drives Market Growth
LoC devices are becoming increasingly prevalent in the pharmaceutical sector, especially in the realms of drug discovery and development. These devices offer substantial benefits by enabling high-throughput screening, precise cell culturing, and effective analysis of drug candidates. Such capabilities facilitate faster and more cost-effective pharmaceutical development processes.
The global drug discovery market itself is anticipated to grow to USD 71 billion by 2025, advancing at a CAGR of 8.2%. Leading pharmaceutical companies like Merck and Pfizer are integrating LoC technologies into their research and development frameworks, collaborating with technology providers to enhance their drug pipelines. This integration underscores the critical role of LoC devices in modern pharmaceutical research, where speed and efficiency are paramount. Additionally, the convergence of LoC technology with pharmaceutical needs not only accelerates the drug development cycle but also enhances the overall productivity of the industry.
Restraining Factors
Regulatory Challenges and Approval Processes Restrains Market Growth
Regulatory hurdles significantly impede the Lab on Chip (LoC) market's expansion. The stringent requirements imposed by regulatory bodies, such as the FDA, are designed to ensure the safety and efficacy of LoC devices, especially those used in diagnostics and healthcare. The approval process often involves extensive clinical validation and adherence to rigorous quality standards, which can be both time-consuming and costly.
This complexity can delay the introduction of innovative LoC technologies into the market, limiting the speed at which new products can reach end-users and curtailing the adoption rate of new technologies. For instance, the FDA’s comprehensive regulatory framework for LoC-based in vitro diagnostic devices (IVDs) necessitates detailed clinical trials and data submissions, thereby slowing down the commercialization process and increasing the cost of development.
Standardization and Integration Challenges Restrains Market Growth
The growth of the Lab on Chip (LoC) market is also restricted by standardization and integration issues. The lack of uniform standards across various LoC platforms can lead to significant challenges in integrating these devices with existing laboratory infrastructure, such as electronic health record (EHR) systems and other diagnostic equipment.
Compatibility issues, stemming from diverse data formats and communication protocols, exacerbate these integration challenges, impeding the seamless operation of LoC devices within established clinical workflows. For example, disparities in interfacing requirements can prevent effective data exchange and communication between LoC devices and other medical systems, leading to operational inefficiencies and limiting their broader adoption in healthcare settings. These interoperability challenges can deter healthcare providers from implementing new technologies, thus restraining market growth.
Product Analysis
Reagents & Consumables dominate with a significant percentage due to their essential role in conducting tests and experiments.
The "By Product" segment of the Lab on Chip (LoC) market is broadly categorized into Reagents & Consumables, Software, and IV Needles. Among these, Reagents & Consumables emerge as the dominant sub-segment. This predominance can be attributed to the recurring need for these materials in various diagnostic and analytical procedures that utilize LoC devices. Reagents and consumables are integral to the functionality of LoC systems, as they are required for each test and must be replaced or replenished regularly. This ongoing demand ensures a steady revenue stream for manufacturers and contributes significantly to the segment’s growth.
Software, another vital sub-segment, plays a critical role in the operation of LoC devices by providing necessary analytics, data management, and operational protocols. Though not as frequently replaced as reagents, the sophistication and customization of software are crucial for the advancement and integration of LoC technologies into broader clinical and research settings.
IV Needles, used less frequently in the context of LoC devices, still hold importance for applications involving direct patient interaction, such as drug delivery and blood sampling. Although a smaller part of the market, their role in specific therapeutic applications contributes to the overall growth of the segment.
Technology Analysis
Microfluidics leads with a substantial market share due to its precision and efficiency in handling small fluid volumes.
In the "By Technology" segment, Microfluidics, Microarrays, Immunoassay, Tissue Biochip, and Others are the key sub-segments. Microfluidics is the leading technology in the LoC market, credited with enabling precise control and manipulation of small volumes of fluids on a micro-scale level. This technology's capability to perform complex biochemical functions efficiently makes it indispensable for the development of innovative LoC devices. The growth of microfluidics is driven by its wide applications across various fields, including medical diagnostics, pharmaceutical research, and environmental testing, reflecting its versatility and high demand.
Microarrays and Immunoassays are also significant contributors to this segment. Microarrays allow the simultaneous analysis of multiple biological samples, while immunoassays are critical for detecting specific proteins and antigens in disease diagnosis. Both technologies complement the functionality of microfluidics by enhancing the analytical capabilities of LoC devices.
Tissue Biochips and other emerging technologies, although smaller in market share, are vital for specific applications such as tissue engineering and personalized medicine. Their development represents the ongoing innovation within the LoC technology space, contributing to the overall expansion and diversity of market offerings.
Application Analysis
Clinical Diagnostics commands the largest share due to its critical role in healthcare and disease management.
The Application segment of the LoC market is extensive, encompassing Clinical Diagnostics, Point-of-Care Testing (POCT), Drug Discovery and Development, Genomics and Proteomics, Environmental Monitoring, Food and Beverage Testing, and Others. Clinical Diagnostics stands out as the dominant sub-segment, primarily because LoC devices are extensively used to detect and manage various diseases swiftly and efficiently. The demand for faster diagnostic solutions in clinical settings drives substantial investment and research in this area, reinforcing its market dominance.
POCT follows as a significant application due to the growing demand for on-site diagnostic testing without the need for centralized laboratory facilities. This application is particularly beneficial in remote and resource-limited settings, underscoring its importance in global health contexts.
Drug Discovery and Development, along with Genomics and Proteomics, are also prominent applications of LoC technology, facilitating quicker and more cost-effective research processes. These applications are critical in speeding up the development of new drugs and understanding genetic markers in diseases, contributing significantly to the scientific and medical advancements in the healthcare sector.
End User Analysis
Hospitals and Clinics are the primary users, driven by the need for rapid diagnostic tools in patient care.
In the "End User" segment, Hospitals and Clinics, Diagnostic Laboratories, Pharmaceutical and Biotechnology Companies, Research Institutes and Universities, and Others make up the market. Hospitals and Clinics are the predominant users of LoC devices, reflecting the critical need for rapid, accurate diagnostic and monitoring tools in patient care settings. The integration of LoC devices in these settings not only enhances the efficiency of diagnostic processes but also improves patient outcomes by enabling faster decision-making.
Diagnostic Laboratories also represent a significant portion of the market, utilizing LoC devices for a wide range of tests and analyses. The collaboration between laboratories and device manufacturers often leads to innovations in testing capabilities and efficiencies.
Pharmaceutical and Biotechnology Companies, along with Research Institutes and Universities, use LoC devices extensively for research and development purposes. Their role in advancing the applications and effectiveness of LoC technology is crucial for the continuous growth and evolution of this market segment.
Key Market Segments
By Product
- Reagents & Consumables
- Software
- IV Needles
By Technology
- Microfluidics
- Microarrays
- Immunoassay
- Tissue Biochip
- Others
By Application
- Clinical Diagnostics
- Point-of-Care Testing (POCT)
- Drug Discovery and Development
- Genomics and Proteomics
- Environmental Monitoring
- Food and Beverage Testing
- Others
By End User
- Hospitals and Clinics
- Diagnostic Laboratories
- Pharmaceutical and Biotechnology Companies
- Research Institutes and Universities
- Others
Growth Opportunities
Wearable and Implantable LoC Devices Offer Growth Opportunity
The intersection of Lab on Chip (LoC) technology with wearable and implantable devices presents significant growth opportunities in the medical field, particularly in the domains of continuous monitoring and personalized healthcare. These innovative LoC devices are designed to seamlessly integrate into daily life, where they can constantly monitor health parameters, analyze bodily fluids, and track biomarkers.
This capability enables more precise disease management and treatment adjustments in real time, vastly improving patient outcomes. Companies like Proteus Digital Health and Profusa are at the forefront, creating ingestible and implantable sensors that offer continuous insight into patient health, thereby paving the way for a new era of medical technology that is both proactive and preventative. The ongoing advancements and increasing acceptance of these devices signal a promising growth trajectory within the healthcare sector.
Organ-on-Chip and Tissue Engineering Applications Offer Growth Opportunity
LoC technology is catalyzing transformative developments in organ-on-chip and tissue engineering applications, areas with profound implications for drug discovery, toxicology testing, and regenerative medicine. These applications utilize LoC platforms to replicate human organ systems on microchips, providing a dynamic environment where biological reactions and drug interactions can be observed more accurately and cost-effectively than in traditional experimental setups.
This innovation not only enhances the efficiency of pharmaceutical research but also reduces the reliance on animal testing, aligning with ethical research practices. Companies like Emulate, Inc. and Tara Biosystems are leading this charge, leveraging their expertise to advance the capabilities of organ-on-chip technologies. The potential for these technologies to revolutionize multiple facets of healthcare and pharmaceutical industries underscores their importance as a key driver of market growth in the coming years.
Trending Factors
Microfluidics and Lab-on-a-Chip Integration Are Trending Factors
The synergy between microfluidics technology and Lab on Chip (LoC) devices is currently a significant trend in the market, driving advancements in the field. Microfluidics integration enhances LoC devices by enabling precise fluid handling, sample preparation, and complex analysis within miniaturized systems. This collaboration leads to the development of fully automated analytical systems that not only reduce the need for manual intervention but also improve the accuracy and reliability of results.
Companies like Dolomite Bio and Micronit Microtechnologies are spearheading innovations in this area, providing cutting-edge solutions that cater to diverse scientific and medical applications. The demand for these integrated systems is increasing as they enable more comprehensive and efficient testing capabilities, making them highly attractive for a variety of end-users including research labs, diagnostic centers, and pharmaceutical companies.
Automation and Artificial Intelligence (AI) Integration Are Trending Factors
The integration of automation and artificial intelligence (AI) with Lab on Chip (LoC) devices is another prominent trend shaping the market. Automation enhances the efficiency of LoC devices by streamlining processes and reducing human error, while AI contributes advanced data analysis capabilities. AI algorithms applied to LoC data facilitate pattern recognition, predictive modeling, and real-time decision support, which are crucial for improving diagnostic accuracy and optimizing treatment strategies.
Companies like Roche and Beckman Coulter are exploring AI-powered LoC solutions to leverage these benefits in diagnostic and laboratory applications. The convergence of AI with LoC technologies not only enhances operational efficiencies but also paves the way for innovations in personalized medicine, making it a key factor in the trending growth and adoption of LoC technologies.
Regional Analysis
North America Dominates with 43.8% Market Share
North America's commanding 43.8% share of the Lab on Chip (LoC) market is driven by several key factors. The region boasts advanced healthcare infrastructure and a strong focus on research and innovation, which facilitate the rapid adoption of new technologies like LoC. Moreover, the presence of major pharmaceutical and biotechnology firms, along with top-tier universities and research institutions, contributes to vigorous development and utilization of LoC devices. High healthcare spending and supportive government policies also play crucial roles in fostering an environment conducive to growth in this sector.
The dynamics within North America are characterized by a robust demand for innovative healthcare solutions and a significant emphasis on personalized medicine. These factors are amplified by the region's regulatory landscape, which while stringent, often leads to early adoption of advanced technologies once they are approved. The integration of digital technology in healthcare, particularly in the U.S. and Canada, further bolsters the market for sophisticated devices like those offered in the LoC domain.
Regional Market Share and Growth:
- Europe: Europe holds approximately 27.2% of the global LoC market. The region's growth is supported by its strong healthcare systems, widespread acceptance of advanced technologies, and substantial investments in healthcare research.
- Asia Pacific: Asia Pacific is rapidly growing with a market share of 19.1%. This growth is driven by rising healthcare expenditures, growing patient populations, and increasing investments in healthcare infrastructure.
- Middle East & Africa: Holding a smaller share of 5.1%, the Middle East & Africa region is gradually adopting advanced medical technologies amidst improving healthcare infrastructure and increasing economic diversification efforts.
- Latin America: With a market share of 4.8%, Latin America is experiencing moderate growth due to increasing healthcare access and growing public health awareness, though it faces challenges like economic variability and underdeveloped healthcare systems.
Key Regions and Countries
- North America
- The US
- Canada
- Mexico
- Western Europe
- Germany
- France
- The UK
- Spain
- Italy
- Portugal
- Ireland
- Austria
- Switzerland
- Benelux
- Nordic
- Rest of Western Europe
- Eastern Europe
- Russia
- Poland
- The Czech Republic
- Greece
- Rest of Eastern Europe
- APAC
- China
- Japan
- South Korea
- India
- Australia & New Zealand
- Indonesia
- Malaysia
- Philippines
- Singapore
- Thailand
- Vietnam
- Rest of APAC
- Latin America
- Brazil
- Colombia
- Chile
- Argentina
- Costa Rica
- Rest of Latin America
- Middle East & Africa
- Algeria
- Egypt
- Israel
- Kuwait
- Nigeria
- Saudi Arabia
- South Africa
- Turkey
- United Arab Emirates
- Rest of MEA
Key Players Analysis
In the Lab On Chip market, several key players dominate due to their innovative contributions, strategic expansions, and deep market penetration. Leading the charge, Danaher Corporation and Thermo Fisher Scientific Inc. stand out for their comprehensive range of lab-on-a-chip solutions that cater to a variety of applications, including clinical diagnostics and genetic testing. These companies leverage extensive R&D resources and global distribution networks to maintain their market leadership.
Abbott Laboratories and F. Hoffmann-La Roche Ag focus on the clinical and health segments, delivering high-precision diagnostic chips that are integral to modern medical practices. Their products are particularly influential in streamlining workflows in medical laboratories and enhancing patient care through faster and more accurate diagnostics.
Bio-Rad Laboratories Inc., Agilent Technologies Inc., and PerkinElmer Inc. are notable for their strong focus on research and development. They provide advanced microfluidic devices that support complex analytical processes in pharmaceutical research, environmental testing, and academic research. These companies’ commitment to innovation fosters continual improvements in chip technology and assay integration.
Emerging players like Tara Biosystems and Fluidigm Corporation contribute specialized expertise in specific niches such as organ-on-chip and single-cell analysis, respectively. These companies are pivotal in driving forward the applications of lab-on-a-chip technologies in high-growth areas like drug development and cellular biology.
IDEX Corporation and Illumina Inc., though differing in their core areas, enrich the market with unique technological enhancements—IDEX in fluidic management and Illumina in genomics. Their technologies enable more efficient sample processing and data throughput, increasing the overall utility of lab-on-chip devices.
Overall, the strategic positioning of these companies emphasizes not only their technological prowess but also their ability to adapt to the evolving demands of healthcare, research, and biotechnological applications, solidifying their influence in the lab-on-chip market.
Market Key Players
- Danaher Corporation
- Abbott Laboratories
- Bio-Rad Laboratories Inc.
- Thermo Fisher Scientific Inc.
- Illumina Inc.
- Tara Biosystems
- IDEX Corporation
- F. Hoffmann-La Roche Ag
- Agilent Technologies Inc.
- PerkinElmer Inc.
- Fluidigm Corporation
Recent Developments
- On February 2024, Saankhya Labs, a subsidiary of Tejas Networks, announced that the Ministry of Electronics and Information Technology, Government of India (MeitY) has approved its application under the Government of India's Semiconductor Design Linked Incentive (DLI) scheme for the development of a System-on-Chip (SoC) for 5G telecom infrastructure equipment.
- On February 2024, a paper was published in the journal Lab on a Chip, where a NIST-led working group laid out their case for why standards will help the field of organ-on-a-chip systems grow.
- On March 2024, NIST reported that they are leading a working group to develop a set of guidelines and standards for organ-on-a-chip systems, which includes researchers from industry, academia, and other government agencies from around the world.
Report Scope
Report Features Description Market Value (2023) USD 6.4 Billion Forecast Revenue (2033) USD 17.9 Billion CAGR (2024-2033) 11.1% Base Year for Estimation 2023 Historic Period 2018-2023 Forecast Period 2024-2033 Report Coverage Revenue Forecast, Market Dynamics, Competitive Landscape, Recent Developments Segments Covered By Product (Reagents & Consumables, Software, IV Needles), By Technology (Microfluidics, Microarrays, Immunoassay, Tissue Biochip, Others), By Application (Clinical Diagnostics, Point-of-Care Testing (POCT), Drug Discovery and Development, Genomics and Proteomics, Environmental Monitoring, Food and Beverage Testing, Others), By End User (Hospitals and Clinics, Diagnostic Laboratories, Pharmaceutical and Biotechnology Companies, Research Institutes and Universities, Others) Regional Analysis North America - The US, Canada, & Mexico; Western Europe - Germany, France, The UK, Spain, Italy, Portugal, Ireland, Austria, Switzerland, Benelux, Nordic, & Rest of Western Europe; Eastern Europe - Russia, Poland, The Czech Republic, Greece, & Rest of Eastern Europe; APAC - China, Japan, South Korea, India, Australia & New Zealand, Indonesia, Malaysia, Philippines, Singapore, Thailand, Vietnam, & Rest of APAC; Latin America - Brazil, Colombia, Chile, Argentina, Costa Rica, & Rest of Latin America; Middle East & Africa - Algeria, Egypt, Israel, Kuwait, Nigeria, Saudi Arabia, South Africa, Turkey, United Arab Emirates, & Rest of MEA Competitive Landscape Danaher Corporation, Abbott Laboratories, Bio-Rad Laboratories Inc., Thermo Fisher Scientific Inc., Illumina Inc., Tara Biosystems, IDEX Corporation, F. Hoffmann-La Roche Ag, Agilent Technologies Inc., PerkinElmer Inc., Fluidigm Corporation Customization Scope Customization for segments, region/country-level will be provided. Moreover, additional customization can be done based on the requirements. Purchase Options We have three licenses to opt for: Single User License, Multi-User License (Up to 5 Users), Corporate Use License (Unlimited User and Printable PDF) -
- 1. Executive Summary
- 1.1. Definition
- 1.2. Taxonomy
- 1.3. Research Scope
- 1.4. Key Analysis
- 1.5. Key Findings by Major Segments
- 1.6. Top strategies by Major Players
- 2. Global Lab On Chip Market Overview
- 2.1. Lab On Chip Market Dynamics
- 2.1.1. Drivers
- 2.1.2. Opportunities
- 2.1.3. Restraints
- 2.1.4. Challenges
- 2.2. Macro-economic Factors
- 2.3. Regulatory Framework
- 2.4. Market Investment Feasibility Index
- 2.5. PEST Analysis
- 2.6. PORTER’S Five Force Analysis
- 2.7. Drivers & Restraints Impact Analysis
- 2.8. Industry Chain Analysis
- 2.9. Cost Structure Analysis
- 2.10. Marketing Strategy
- 2.11. Russia-Ukraine War Impact Analysis
- 2.12. Opportunity Map Analysis
- 2.13. Market Competition Scenario Analysis
- 2.14. Product Life Cycle Analysis
- 2.15. Opportunity Orbits
- 2.16. Manufacturer Intensity Map
- 2.17. Major Companies sales by Value & Volume
- 2.1. Lab On Chip Market Dynamics
- 3. Global Lab On Chip Market Analysis, Opportunity and Forecast, 2016-2032
- 3.1. Global Lab On Chip Market Analysis, 2016-2021
- 3.2. Global Lab On Chip Market Opportunity and Forecast, 2023-2032
- 3.3. Global Lab On Chip Market Analysis, Opportunity and Forecast, By Product, 2016-2032
- 3.3.1. Global Lab On Chip Market Analysis by Product: Introduction
- 3.3.2. Market Size Absolute $ Opportunity Analysis and Forecast, By Product, 2016-2032
- 3.3.3. Reagents & Consumables
- 3.3.4. Software
- 3.3.5. IV Needles
- 3.4. Global Lab On Chip Market Analysis, Opportunity and Forecast, By Technology, 2016-2032
- 3.4.1. Global Lab On Chip Market Analysis by Technology: Introduction
- 3.4.2. Market Size Absolute $ Opportunity Analysis and Forecast, By Technology, 2016-2032
- 3.4.3. Microfluidics
- 3.4.4. Microarrays
- 3.4.5. Immunoassay
- 3.4.6. Tissue Biochip
- 3.4.7. Others
- 3.5. Global Lab On Chip Market Analysis, Opportunity and Forecast, By Application, 2016-2032
- 3.5.1. Global Lab On Chip Market Analysis by Application: Introduction
- 3.5.2. Market Size Absolute $ Opportunity Analysis and Forecast, By Application, 2016-2032
- 3.5.3. Clinical Diagnostics
- 3.5.4. Point-of-Care Testing (POCT)
- 3.5.5. Drug Discovery and Development
- 3.5.6. Genomics and Proteomics
- 3.5.7. Environmental Monitoring
- 3.5.8. Food and Beverage Testing
- 3.5.9. Others
- 3.6. Global Lab On Chip Market Analysis, Opportunity and Forecast, By End User, 2016-2032
- 3.6.1. Global Lab On Chip Market Analysis by End User: Introduction
- 3.6.2. Market Size Absolute $ Opportunity Analysis and Forecast, By End User, 2016-2032
- 3.6.3. Hospitals and Clinics
- 3.6.4. Diagnostic Laboratories
- 3.6.5. Pharmaceutical and Biotechnology Companies
- 3.6.6. Research Institutes and Universities
- 3.6.7. Others
- 4. North America Lab On Chip Market Analysis, Opportunity and Forecast, 2016-2032
- 4.1. North America Lab On Chip Market Analysis, 2016-2021
- 4.2. North America Lab On Chip Market Opportunity and Forecast, 2023-2032
- 4.3. North America Lab On Chip Market Analysis, Opportunity and Forecast, By Product, 2016-2032
- 4.3.1. North America Lab On Chip Market Analysis by Product: Introduction
- 4.3.2. Market Size Absolute $ Opportunity Analysis and Forecast, By Product, 2016-2032
- 4.3.3. Reagents & Consumables
- 4.3.4. Software
- 4.3.5. IV Needles
- 4.4. North America Lab On Chip Market Analysis, Opportunity and Forecast, By Technology, 2016-2032
- 4.4.1. North America Lab On Chip Market Analysis by Technology: Introduction
- 4.4.2. Market Size Absolute $ Opportunity Analysis and Forecast, By Technology, 2016-2032
- 4.4.3. Microfluidics
- 4.4.4. Microarrays
- 4.4.5. Immunoassay
- 4.4.6. Tissue Biochip
- 4.4.7. Others
- 4.5. North America Lab On Chip Market Analysis, Opportunity and Forecast, By Application, 2016-2032
- 4.5.1. North America Lab On Chip Market Analysis by Application: Introduction
- 4.5.2. Market Size Absolute $ Opportunity Analysis and Forecast, By Application, 2016-2032
- 4.5.3. Clinical Diagnostics
- 4.5.4. Point-of-Care Testing (POCT)
- 4.5.5. Drug Discovery and Development
- 4.5.6. Genomics and Proteomics
- 4.5.7. Environmental Monitoring
- 4.5.8. Food and Beverage Testing
- 4.5.9. Others
- 4.6. North America Lab On Chip Market Analysis, Opportunity and Forecast, By End User, 2016-2032
- 4.6.1. North America Lab On Chip Market Analysis by End User: Introduction
- 4.6.2. Market Size Absolute $ Opportunity Analysis and Forecast, By End User, 2016-2032
- 4.6.3. Hospitals and Clinics
- 4.6.4. Diagnostic Laboratories
- 4.6.5. Pharmaceutical and Biotechnology Companies
- 4.6.6. Research Institutes and Universities
- 4.6.7. Others
- 4.7. North America Lab On Chip Market Analysis, Opportunity and Forecast, By Country , 2016-2032
- 4.7.1. North America Lab On Chip Market Analysis by Country : Introduction
- 4.7.2. Market Size Absolute $ Opportunity Analysis and Forecast, Country , 2016-2032
- 4.7.2.1. The US
- 4.7.2.2. Canada
- 4.7.2.3. Mexico
- 5. Western Europe Lab On Chip Market Analysis, Opportunity and Forecast, 2016-2032
- 5.1. Western Europe Lab On Chip Market Analysis, 2016-2021
- 5.2. Western Europe Lab On Chip Market Opportunity and Forecast, 2023-2032
- 5.3. Western Europe Lab On Chip Market Analysis, Opportunity and Forecast, By Product, 2016-2032
- 5.3.1. Western Europe Lab On Chip Market Analysis by Product: Introduction
- 5.3.2. Market Size Absolute $ Opportunity Analysis and Forecast, By Product, 2016-2032
- 5.3.3. Reagents & Consumables
- 5.3.4. Software
- 5.3.5. IV Needles
- 5.4. Western Europe Lab On Chip Market Analysis, Opportunity and Forecast, By Technology, 2016-2032
- 5.4.1. Western Europe Lab On Chip Market Analysis by Technology: Introduction
- 5.4.2. Market Size Absolute $ Opportunity Analysis and Forecast, By Technology, 2016-2032
- 5.4.3. Microfluidics
- 5.4.4. Microarrays
- 5.4.5. Immunoassay
- 5.4.6. Tissue Biochip
- 5.4.7. Others
- 5.5. Western Europe Lab On Chip Market Analysis, Opportunity and Forecast, By Application, 2016-2032
- 5.5.1. Western Europe Lab On Chip Market Analysis by Application: Introduction
- 5.5.2. Market Size Absolute $ Opportunity Analysis and Forecast, By Application, 2016-2032
- 5.5.3. Clinical Diagnostics
- 5.5.4. Point-of-Care Testing (POCT)
- 5.5.5. Drug Discovery and Development
- 5.5.6. Genomics and Proteomics
- 5.5.7. Environmental Monitoring
- 5.5.8. Food and Beverage Testing
- 5.5.9. Others
- 5.6. Western Europe Lab On Chip Market Analysis, Opportunity and Forecast, By End User, 2016-2032
- 5.6.1. Western Europe Lab On Chip Market Analysis by End User: Introduction
- 5.6.2. Market Size Absolute $ Opportunity Analysis and Forecast, By End User, 2016-2032
- 5.6.3. Hospitals and Clinics
- 5.6.4. Diagnostic Laboratories
- 5.6.5. Pharmaceutical and Biotechnology Companies
- 5.6.6. Research Institutes and Universities
- 5.6.7. Others
- 5.7. Western Europe Lab On Chip Market Analysis, Opportunity and Forecast, By Country , 2016-2032
- 5.7.1. Western Europe Lab On Chip Market Analysis by Country : Introduction
- 5.7.2. Market Size Absolute $ Opportunity Analysis and Forecast, Country , 2016-2032
- 5.7.2.1. Germany
- 5.7.2.2. France
- 5.7.2.3. The UK
- 5.7.2.4. Spain
- 5.7.2.5. Italy
- 5.7.2.6. Portugal
- 5.7.2.7. Ireland
- 5.7.2.8. Austria
- 5.7.2.9. Switzerland
- 5.7.2.10. Benelux
- 5.7.2.11. Nordic
- 5.7.2.12. Rest of Western Europe
- 6. Eastern Europe Lab On Chip Market Analysis, Opportunity and Forecast, 2016-2032
- 6.1. Eastern Europe Lab On Chip Market Analysis, 2016-2021
- 6.2. Eastern Europe Lab On Chip Market Opportunity and Forecast, 2023-2032
- 6.3. Eastern Europe Lab On Chip Market Analysis, Opportunity and Forecast, By Product, 2016-2032
- 6.3.1. Eastern Europe Lab On Chip Market Analysis by Product: Introduction
- 6.3.2. Market Size Absolute $ Opportunity Analysis and Forecast, By Product, 2016-2032
- 6.3.3. Reagents & Consumables
- 6.3.4. Software
- 6.3.5. IV Needles
- 6.4. Eastern Europe Lab On Chip Market Analysis, Opportunity and Forecast, By Technology, 2016-2032
- 6.4.1. Eastern Europe Lab On Chip Market Analysis by Technology: Introduction
- 6.4.2. Market Size Absolute $ Opportunity Analysis and Forecast, By Technology, 2016-2032
- 6.4.3. Microfluidics
- 6.4.4. Microarrays
- 6.4.5. Immunoassay
- 6.4.6. Tissue Biochip
- 6.4.7. Others
- 6.5. Eastern Europe Lab On Chip Market Analysis, Opportunity and Forecast, By Application, 2016-2032
- 6.5.1. Eastern Europe Lab On Chip Market Analysis by Application: Introduction
- 6.5.2. Market Size Absolute $ Opportunity Analysis and Forecast, By Application, 2016-2032
- 6.5.3. Clinical Diagnostics
- 6.5.4. Point-of-Care Testing (POCT)
- 6.5.5. Drug Discovery and Development
- 6.5.6. Genomics and Proteomics
- 6.5.7. Environmental Monitoring
- 6.5.8. Food and Beverage Testing
- 6.5.9. Others
- 6.6. Eastern Europe Lab On Chip Market Analysis, Opportunity and Forecast, By End User, 2016-2032
- 6.6.1. Eastern Europe Lab On Chip Market Analysis by End User: Introduction
- 6.6.2. Market Size Absolute $ Opportunity Analysis and Forecast, By End User, 2016-2032
- 6.6.3. Hospitals and Clinics
- 6.6.4. Diagnostic Laboratories
- 6.6.5. Pharmaceutical and Biotechnology Companies
- 6.6.6. Research Institutes and Universities
- 6.6.7. Others
- 6.7. Eastern Europe Lab On Chip Market Analysis, Opportunity and Forecast, By Country , 2016-2032
- 6.7.1. Eastern Europe Lab On Chip Market Analysis by Country : Introduction
- 6.7.2. Market Size Absolute $ Opportunity Analysis and Forecast, Country , 2016-2032
- 6.7.2.1. Russia
- 6.7.2.2. Poland
- 6.7.2.3. The Czech Republic
- 6.7.2.4. Greece
- 6.7.2.5. Rest of Eastern Europe
- 7. APAC Lab On Chip Market Analysis, Opportunity and Forecast, 2016-2032
- 7.1. APAC Lab On Chip Market Analysis, 2016-2021
- 7.2. APAC Lab On Chip Market Opportunity and Forecast, 2023-2032
- 7.3. APAC Lab On Chip Market Analysis, Opportunity and Forecast, By Product, 2016-2032
- 7.3.1. APAC Lab On Chip Market Analysis by Product: Introduction
- 7.3.2. Market Size Absolute $ Opportunity Analysis and Forecast, By Product, 2016-2032
- 7.3.3. Reagents & Consumables
- 7.3.4. Software
- 7.3.5. IV Needles
- 7.4. APAC Lab On Chip Market Analysis, Opportunity and Forecast, By Technology, 2016-2032
- 7.4.1. APAC Lab On Chip Market Analysis by Technology: Introduction
- 7.4.2. Market Size Absolute $ Opportunity Analysis and Forecast, By Technology, 2016-2032
- 7.4.3. Microfluidics
- 7.4.4. Microarrays
- 7.4.5. Immunoassay
- 7.4.6. Tissue Biochip
- 7.4.7. Others
- 7.5. APAC Lab On Chip Market Analysis, Opportunity and Forecast, By Application, 2016-2032
- 7.5.1. APAC Lab On Chip Market Analysis by Application: Introduction
- 7.5.2. Market Size Absolute $ Opportunity Analysis and Forecast, By Application, 2016-2032
- 7.5.3. Clinical Diagnostics
- 7.5.4. Point-of-Care Testing (POCT)
- 7.5.5. Drug Discovery and Development
- 7.5.6. Genomics and Proteomics
- 7.5.7. Environmental Monitoring
- 7.5.8. Food and Beverage Testing
- 7.5.9. Others
- 7.6. APAC Lab On Chip Market Analysis, Opportunity and Forecast, By End User, 2016-2032
- 7.6.1. APAC Lab On Chip Market Analysis by End User: Introduction
- 7.6.2. Market Size Absolute $ Opportunity Analysis and Forecast, By End User, 2016-2032
- 7.6.3. Hospitals and Clinics
- 7.6.4. Diagnostic Laboratories
- 7.6.5. Pharmaceutical and Biotechnology Companies
- 7.6.6. Research Institutes and Universities
- 7.6.7. Others
- 7.7. APAC Lab On Chip Market Analysis, Opportunity and Forecast, By Country , 2016-2032
- 7.7.1. APAC Lab On Chip Market Analysis by Country : Introduction
- 7.7.2. Market Size Absolute $ Opportunity Analysis and Forecast, Country , 2016-2032
- 7.7.2.1. China
- 7.7.2.2. Japan
- 7.7.2.3. South Korea
- 7.7.2.4. India
- 7.7.2.5. Australia & New Zeland
- 7.7.2.6. Indonesia
- 7.7.2.7. Malaysia
- 7.7.2.8. Philippines
- 7.7.2.9. Singapore
- 7.7.2.10. Thailand
- 7.7.2.11. Vietnam
- 7.7.2.12. Rest of APAC
- 8. Latin America Lab On Chip Market Analysis, Opportunity and Forecast, 2016-2032
- 8.1. Latin America Lab On Chip Market Analysis, 2016-2021
- 8.2. Latin America Lab On Chip Market Opportunity and Forecast, 2023-2032
- 8.3. Latin America Lab On Chip Market Analysis, Opportunity and Forecast, By Product, 2016-2032
- 8.3.1. Latin America Lab On Chip Market Analysis by Product: Introduction
- 8.3.2. Market Size Absolute $ Opportunity Analysis and Forecast, By Product, 2016-2032
- 8.3.3. Reagents & Consumables
- 8.3.4. Software
- 8.3.5. IV Needles
- 8.4. Latin America Lab On Chip Market Analysis, Opportunity and Forecast, By Technology, 2016-2032
- 8.4.1. Latin America Lab On Chip Market Analysis by Technology: Introduction
- 8.4.2. Market Size Absolute $ Opportunity Analysis and Forecast, By Technology, 2016-2032
- 8.4.3. Microfluidics
- 8.4.4. Microarrays
- 8.4.5. Immunoassay
- 8.4.6. Tissue Biochip
- 8.4.7. Others
- 8.5. Latin America Lab On Chip Market Analysis, Opportunity and Forecast, By Application, 2016-2032
- 8.5.1. Latin America Lab On Chip Market Analysis by Application: Introduction
- 8.5.2. Market Size Absolute $ Opportunity Analysis and Forecast, By Application, 2016-2032
- 8.5.3. Clinical Diagnostics
- 8.5.4. Point-of-Care Testing (POCT)
- 8.5.5. Drug Discovery and Development
- 8.5.6. Genomics and Proteomics
- 8.5.7. Environmental Monitoring
- 8.5.8. Food and Beverage Testing
- 8.5.9. Others
- 8.6. Latin America Lab On Chip Market Analysis, Opportunity and Forecast, By End User, 2016-2032
- 8.6.1. Latin America Lab On Chip Market Analysis by End User: Introduction
- 8.6.2. Market Size Absolute $ Opportunity Analysis and Forecast, By End User, 2016-2032
- 8.6.3. Hospitals and Clinics
- 8.6.4. Diagnostic Laboratories
- 8.6.5. Pharmaceutical and Biotechnology Companies
- 8.6.6. Research Institutes and Universities
- 8.6.7. Others
- 8.7. Latin America Lab On Chip Market Analysis, Opportunity and Forecast, By Country , 2016-2032
- 8.7.1. Latin America Lab On Chip Market Analysis by Country : Introduction
- 8.7.2. Market Size Absolute $ Opportunity Analysis and Forecast, Country , 2016-2032
- 8.7.2.1. Brazil
- 8.7.2.2. Colombia
- 8.7.2.3. Chile
- 8.7.2.4. Argentina
- 8.7.2.5. Costa Rica
- 8.7.2.6. Rest of Latin America
- 9. Middle East & Africa Lab On Chip Market Analysis, Opportunity and Forecast, 2016-2032
- 9.1. Middle East & Africa Lab On Chip Market Analysis, 2016-2021
- 9.2. Middle East & Africa Lab On Chip Market Opportunity and Forecast, 2023-2032
- 9.3. Middle East & Africa Lab On Chip Market Analysis, Opportunity and Forecast, By Product, 2016-2032
- 9.3.1. Middle East & Africa Lab On Chip Market Analysis by Product: Introduction
- 9.3.2. Market Size Absolute $ Opportunity Analysis and Forecast, By Product, 2016-2032
- 9.3.3. Reagents & Consumables
- 9.3.4. Software
- 9.3.5. IV Needles
- 9.4. Middle East & Africa Lab On Chip Market Analysis, Opportunity and Forecast, By Technology, 2016-2032
- 9.4.1. Middle East & Africa Lab On Chip Market Analysis by Technology: Introduction
- 9.4.2. Market Size Absolute $ Opportunity Analysis and Forecast, By Technology, 2016-2032
- 9.4.3. Microfluidics
- 9.4.4. Microarrays
- 9.4.5. Immunoassay
- 9.4.6. Tissue Biochip
- 9.4.7. Others
- 9.5. Middle East & Africa Lab On Chip Market Analysis, Opportunity and Forecast, By Application, 2016-2032
- 9.5.1. Middle East & Africa Lab On Chip Market Analysis by Application: Introduction
- 9.5.2. Market Size Absolute $ Opportunity Analysis and Forecast, By Application, 2016-2032
- 9.5.3. Clinical Diagnostics
- 9.5.4. Point-of-Care Testing (POCT)
- 9.5.5. Drug Discovery and Development
- 9.5.6. Genomics and Proteomics
- 9.5.7. Environmental Monitoring
- 9.5.8. Food and Beverage Testing
- 9.5.9. Others
- 9.6. Middle East & Africa Lab On Chip Market Analysis, Opportunity and Forecast, By End User, 2016-2032
- 9.6.1. Middle East & Africa Lab On Chip Market Analysis by End User: Introduction
- 9.6.2. Market Size Absolute $ Opportunity Analysis and Forecast, By End User, 2016-2032
- 9.6.3. Hospitals and Clinics
- 9.6.4. Diagnostic Laboratories
- 9.6.5. Pharmaceutical and Biotechnology Companies
- 9.6.6. Research Institutes and Universities
- 9.6.7. Others
- 9.7. Middle East & Africa Lab On Chip Market Analysis, Opportunity and Forecast, By Country , 2016-2032
- 9.7.1. Middle East & Africa Lab On Chip Market Analysis by Country : Introduction
- 9.7.2. Market Size Absolute $ Opportunity Analysis and Forecast, Country , 2016-2032
- 9.7.2.1. Algeria
- 9.7.2.2. Egypt
- 9.7.2.3. Israel
- 9.7.2.4. Kuwait
- 9.7.2.5. Nigeria
- 9.7.2.6. Saudi Arabia
- 9.7.2.7. South Africa
- 9.7.2.8. Turkey
- 9.7.2.9. The UAE
- 9.7.2.10. Rest of MEA
- 10. Global Lab On Chip Market Analysis, Opportunity and Forecast, By Region , 2016-2032
- 10.1. Global Lab On Chip Market Analysis by Region : Introduction
- 10.2. Market Size Absolute $ Opportunity Analysis and Forecast, By Region , 2016-2032
- 10.2.1. North America
- 10.2.2. Western Europe
- 10.2.3. Eastern Europe
- 10.2.4. APAC
- 10.2.5. Latin America
- 10.2.6. Middle East & Africa
- 11. Global Lab On Chip Market Competitive Landscape, Market Share Analysis, and Company Profiles
- 11.1. Market Share Analysis
- 11.2. Company Profiles
- 11.3. Danaher Corporation
- 11.3.1. Company Overview
- 11.3.2. Financial Highlights
- 11.3.3. Product Portfolio
- 11.3.4. SWOT Analysis
- 11.3.5. Key Strategies and Developments
- 11.4. Abbott Laboratories
- 11.4.1. Company Overview
- 11.4.2. Financial Highlights
- 11.4.3. Product Portfolio
- 11.4.4. SWOT Analysis
- 11.4.5. Key Strategies and Developments
- 11.5. Bio-Rad Laboratories Inc.
- 11.5.1. Company Overview
- 11.5.2. Financial Highlights
- 11.5.3. Product Portfolio
- 11.5.4. SWOT Analysis
- 11.5.5. Key Strategies and Developments
- 11.6. Thermo Fisher Scientific Inc.
- 11.6.1. Company Overview
- 11.6.2. Financial Highlights
- 11.6.3. Product Portfolio
- 11.6.4. SWOT Analysis
- 11.6.5. Key Strategies and Developments
- 11.7. Illumina Inc.
- 11.7.1. Company Overview
- 11.7.2. Financial Highlights
- 11.7.3. Product Portfolio
- 11.7.4. SWOT Analysis
- 11.7.5. Key Strategies and Developments
- 11.8. Tara Biosystems
- 11.8.1. Company Overview
- 11.8.2. Financial Highlights
- 11.8.3. Product Portfolio
- 11.8.4. SWOT Analysis
- 11.8.5. Key Strategies and Developments
- 11.9. IDEX Corporation
- 11.9.1. Company Overview
- 11.9.2. Financial Highlights
- 11.9.3. Product Portfolio
- 11.9.4. SWOT Analysis
- 11.9.5. Key Strategies and Developments
- 11.10. F. Hoffmann-La Roche Ag
- 11.10.1. Company Overview
- 11.10.2. Financial Highlights
- 11.10.3. Product Portfolio
- 11.10.4. SWOT Analysis
- 11.10.5. Key Strategies and Developments
- 11.11. Agilent Technologies Inc.
- 11.11.1. Company Overview
- 11.11.2. Financial Highlights
- 11.11.3. Product Portfolio
- 11.11.4. SWOT Analysis
- 11.11.5. Key Strategies and Developments
- 11.12. PerkinElmer Inc.
- 11.12.1. Company Overview
- 11.12.2. Financial Highlights
- 11.12.3. Product Portfolio
- 11.12.4. SWOT Analysis
- 11.12.5. Key Strategies and Developments
- 11.13.1. Company Overview
- 11.13.2. Financial Highlights
- 11.13.3. Product Portfolio
- 11.13.4. SWOT Analysis
- 11.13.5. Key Strategies and Developments
- 11.14. Fluidigm Corporation
- 11.14.1. Company Overview
- 11.14.2. Financial Highlights
- 11.14.3. Product Portfolio
- 11.14.4. SWOT Analysis
- 11.14.5. Key Strategies and Developments
- 12. Assumptions and Acronyms
- 13. Research Methodology
- 14. Contact
- List of Figures
- Figure 1: Global Lab On Chip Market Revenue (US$ Mn) Market Share by Product in 2022
- Figure 2: Global Lab On Chip Market Attractiveness Analysis by Product, 2016-2032
- Figure 3: Global Lab On Chip Market Revenue (US$ Mn) Market Share by Technologyin 2022
- Figure 4: Global Lab On Chip Market Attractiveness Analysis by Technology, 2016-2032
- Figure 5: Global Lab On Chip Market Revenue (US$ Mn) Market Share by Applicationin 2022
- Figure 6: Global Lab On Chip Market Attractiveness Analysis by Application, 2016-2032
- Figure 7: Global Lab On Chip Market Revenue (US$ Mn) Market Share by End Userin 2022
- Figure 8: Global Lab On Chip Market Attractiveness Analysis by End User, 2016-2032
- Figure 9: Global Lab On Chip Market Revenue (US$ Mn) Market Share by Region in 2022
- Figure 10: Global Lab On Chip Market Attractiveness Analysis by Region, 2016-2032
- Figure 11: Global Lab On Chip Market Revenue (US$ Mn) (2016-2032)
- Figure 12: Global Lab On Chip Market Revenue (US$ Mn) Comparison by Region (2016-2032)
- Figure 13: Global Lab On Chip Market Revenue (US$ Mn) Comparison by Product (2016-2032)
- Figure 14: Global Lab On Chip Market Revenue (US$ Mn) Comparison by Technology (2016-2032)
- Figure 15: Global Lab On Chip Market Revenue (US$ Mn) Comparison by Application (2016-2032)
- Figure 16: Global Lab On Chip Market Revenue (US$ Mn) Comparison by End User (2016-2032)
- Figure 17: Global Lab On Chip Market Y-o-Y Growth Rate Comparison by Region (2016-2032)
- Figure 18: Global Lab On Chip Market Y-o-Y Growth Rate Comparison by Product (2016-2032)
- Figure 19: Global Lab On Chip Market Y-o-Y Growth Rate Comparison by Technology (2016-2032)
- Figure 20: Global Lab On Chip Market Y-o-Y Growth Rate Comparison by Application (2016-2032)
- Figure 21: Global Lab On Chip Market Y-o-Y Growth Rate Comparison by End User (2016-2032)
- Figure 22: Global Lab On Chip Market Share Comparison by Region (2016-2032)
- Figure 23: Global Lab On Chip Market Share Comparison by Product (2016-2032)
- Figure 24: Global Lab On Chip Market Share Comparison by Technology (2016-2032)
- Figure 25: Global Lab On Chip Market Share Comparison by Application (2016-2032)
- Figure 26: Global Lab On Chip Market Share Comparison by End User (2016-2032)
- Figure 27: North America Lab On Chip Market Revenue (US$ Mn) Market Share by Productin 2022
- Figure 28: North America Lab On Chip Market Attractiveness Analysis by Product, 2016-2032
- Figure 29: North America Lab On Chip Market Revenue (US$ Mn) Market Share by Technologyin 2022
- Figure 30: North America Lab On Chip Market Attractiveness Analysis by Technology, 2016-2032
- Figure 31: North America Lab On Chip Market Revenue (US$ Mn) Market Share by Applicationin 2022
- Figure 32: North America Lab On Chip Market Attractiveness Analysis by Application, 2016-2032
- Figure 33: North America Lab On Chip Market Revenue (US$ Mn) Market Share by End Userin 2022
- Figure 34: North America Lab On Chip Market Attractiveness Analysis by End User, 2016-2032
- Figure 35: North America Lab On Chip Market Revenue (US$ Mn) Market Share by Country in 2022
- Figure 36: North America Lab On Chip Market Attractiveness Analysis by Country, 2016-2032
- Figure 37: North America Lab On Chip Market Revenue (US$ Mn) (2016-2032)
- Figure 38: North America Lab On Chip Market Revenue (US$ Mn) Comparison by Country (2016-2032)
- Figure 39: North America Lab On Chip Market Revenue (US$ Mn) Comparison by Product (2016-2032)
- Figure 40: North America Lab On Chip Market Revenue (US$ Mn) Comparison by Technology (2016-2032)
- Figure 41: North America Lab On Chip Market Revenue (US$ Mn) Comparison by Application (2016-2032)
- Figure 42: North America Lab On Chip Market Revenue (US$ Mn) Comparison by End User (2016-2032)
- Figure 43: North America Lab On Chip Market Y-o-Y Growth Rate Comparison by Country (2016-2032)
- Figure 44: North America Lab On Chip Market Y-o-Y Growth Rate Comparison by Product (2016-2032)
- Figure 45: North America Lab On Chip Market Y-o-Y Growth Rate Comparison by Technology (2016-2032)
- Figure 46: North America Lab On Chip Market Y-o-Y Growth Rate Comparison by Application (2016-2032)
- Figure 47: North America Lab On Chip Market Y-o-Y Growth Rate Comparison by End User (2016-2032)
- Figure 48: North America Lab On Chip Market Share Comparison by Country (2016-2032)
- Figure 49: North America Lab On Chip Market Share Comparison by Product (2016-2032)
- Figure 50: North America Lab On Chip Market Share Comparison by Technology (2016-2032)
- Figure 51: North America Lab On Chip Market Share Comparison by Application (2016-2032)
- Figure 52: North America Lab On Chip Market Share Comparison by End User (2016-2032)
- Figure 53: Western Europe Lab On Chip Market Revenue (US$ Mn) Market Share by Productin 2022
- Figure 54: Western Europe Lab On Chip Market Attractiveness Analysis by Product, 2016-2032
- Figure 55: Western Europe Lab On Chip Market Revenue (US$ Mn) Market Share by Technologyin 2022
- Figure 56: Western Europe Lab On Chip Market Attractiveness Analysis by Technology, 2016-2032
- Figure 57: Western Europe Lab On Chip Market Revenue (US$ Mn) Market Share by Applicationin 2022
- Figure 58: Western Europe Lab On Chip Market Attractiveness Analysis by Application, 2016-2032
- Figure 59: Western Europe Lab On Chip Market Revenue (US$ Mn) Market Share by End Userin 2022
- Figure 60: Western Europe Lab On Chip Market Attractiveness Analysis by End User, 2016-2032
- Figure 61: Western Europe Lab On Chip Market Revenue (US$ Mn) Market Share by Country in 2022
- Figure 62: Western Europe Lab On Chip Market Attractiveness Analysis by Country, 2016-2032
- Figure 63: Western Europe Lab On Chip Market Revenue (US$ Mn) (2016-2032)
- Figure 64: Western Europe Lab On Chip Market Revenue (US$ Mn) Comparison by Country (2016-2032)
- Figure 65: Western Europe Lab On Chip Market Revenue (US$ Mn) Comparison by Product (2016-2032)
- Figure 66: Western Europe Lab On Chip Market Revenue (US$ Mn) Comparison by Technology (2016-2032)
- Figure 67: Western Europe Lab On Chip Market Revenue (US$ Mn) Comparison by Application (2016-2032)
- Figure 68: Western Europe Lab On Chip Market Revenue (US$ Mn) Comparison by End User (2016-2032)
- Figure 69: Western Europe Lab On Chip Market Y-o-Y Growth Rate Comparison by Country (2016-2032)
- Figure 70: Western Europe Lab On Chip Market Y-o-Y Growth Rate Comparison by Product (2016-2032)
- Figure 71: Western Europe Lab On Chip Market Y-o-Y Growth Rate Comparison by Technology (2016-2032)
- Figure 72: Western Europe Lab On Chip Market Y-o-Y Growth Rate Comparison by Application (2016-2032)
- Figure 73: Western Europe Lab On Chip Market Y-o-Y Growth Rate Comparison by End User (2016-2032)
- Figure 74: Western Europe Lab On Chip Market Share Comparison by Country (2016-2032)
- Figure 75: Western Europe Lab On Chip Market Share Comparison by Product (2016-2032)
- Figure 76: Western Europe Lab On Chip Market Share Comparison by Technology (2016-2032)
- Figure 77: Western Europe Lab On Chip Market Share Comparison by Application (2016-2032)
- Figure 78: Western Europe Lab On Chip Market Share Comparison by End User (2016-2032)
- Figure 79: Eastern Europe Lab On Chip Market Revenue (US$ Mn) Market Share by Productin 2022
- Figure 80: Eastern Europe Lab On Chip Market Attractiveness Analysis by Product, 2016-2032
- Figure 81: Eastern Europe Lab On Chip Market Revenue (US$ Mn) Market Share by Technologyin 2022
- Figure 82: Eastern Europe Lab On Chip Market Attractiveness Analysis by Technology, 2016-2032
- Figure 83: Eastern Europe Lab On Chip Market Revenue (US$ Mn) Market Share by Applicationin 2022
- Figure 84: Eastern Europe Lab On Chip Market Attractiveness Analysis by Application, 2016-2032
- Figure 85: Eastern Europe Lab On Chip Market Revenue (US$ Mn) Market Share by End Userin 2022
- Figure 86: Eastern Europe Lab On Chip Market Attractiveness Analysis by End User, 2016-2032
- Figure 87: Eastern Europe Lab On Chip Market Revenue (US$ Mn) Market Share by Country in 2022
- Figure 88: Eastern Europe Lab On Chip Market Attractiveness Analysis by Country, 2016-2032
- Figure 89: Eastern Europe Lab On Chip Market Revenue (US$ Mn) (2016-2032)
- Figure 90: Eastern Europe Lab On Chip Market Revenue (US$ Mn) Comparison by Country (2016-2032)
- Figure 91: Eastern Europe Lab On Chip Market Revenue (US$ Mn) Comparison by Product (2016-2032)
- Figure 92: Eastern Europe Lab On Chip Market Revenue (US$ Mn) Comparison by Technology (2016-2032)
- Figure 93: Eastern Europe Lab On Chip Market Revenue (US$ Mn) Comparison by Application (2016-2032)
- Figure 94: Eastern Europe Lab On Chip Market Revenue (US$ Mn) Comparison by End User (2016-2032)
- Figure 95: Eastern Europe Lab On Chip Market Y-o-Y Growth Rate Comparison by Country (2016-2032)
- Figure 96: Eastern Europe Lab On Chip Market Y-o-Y Growth Rate Comparison by Product (2016-2032)
- Figure 97: Eastern Europe Lab On Chip Market Y-o-Y Growth Rate Comparison by Technology (2016-2032)
- Figure 98: Eastern Europe Lab On Chip Market Y-o-Y Growth Rate Comparison by Application (2016-2032)
- Figure 99: Eastern Europe Lab On Chip Market Y-o-Y Growth Rate Comparison by End User (2016-2032)
- Figure 100: Eastern Europe Lab On Chip Market Share Comparison by Country (2016-2032)
- Figure 101: Eastern Europe Lab On Chip Market Share Comparison by Product (2016-2032)
- Figure 102: Eastern Europe Lab On Chip Market Share Comparison by Technology (2016-2032)
- Figure 103: Eastern Europe Lab On Chip Market Share Comparison by Application (2016-2032)
- Figure 104: Eastern Europe Lab On Chip Market Share Comparison by End User (2016-2032)
- Figure 105: APAC Lab On Chip Market Revenue (US$ Mn) Market Share by Productin 2022
- Figure 106: APAC Lab On Chip Market Attractiveness Analysis by Product, 2016-2032
- Figure 107: APAC Lab On Chip Market Revenue (US$ Mn) Market Share by Technologyin 2022
- Figure 108: APAC Lab On Chip Market Attractiveness Analysis by Technology, 2016-2032
- Figure 109: APAC Lab On Chip Market Revenue (US$ Mn) Market Share by Applicationin 2022
- Figure 110: APAC Lab On Chip Market Attractiveness Analysis by Application, 2016-2032
- Figure 111: APAC Lab On Chip Market Revenue (US$ Mn) Market Share by End Userin 2022
- Figure 112: APAC Lab On Chip Market Attractiveness Analysis by End User, 2016-2032
- Figure 113: APAC Lab On Chip Market Revenue (US$ Mn) Market Share by Country in 2022
- Figure 114: APAC Lab On Chip Market Attractiveness Analysis by Country, 2016-2032
- Figure 115: APAC Lab On Chip Market Revenue (US$ Mn) (2016-2032)
- Figure 116: APAC Lab On Chip Market Revenue (US$ Mn) Comparison by Country (2016-2032)
- Figure 117: APAC Lab On Chip Market Revenue (US$ Mn) Comparison by Product (2016-2032)
- Figure 118: APAC Lab On Chip Market Revenue (US$ Mn) Comparison by Technology (2016-2032)
- Figure 119: APAC Lab On Chip Market Revenue (US$ Mn) Comparison by Application (2016-2032)
- Figure 120: APAC Lab On Chip Market Revenue (US$ Mn) Comparison by End User (2016-2032)
- Figure 121: APAC Lab On Chip Market Y-o-Y Growth Rate Comparison by Country (2016-2032)
- Figure 122: APAC Lab On Chip Market Y-o-Y Growth Rate Comparison by Product (2016-2032)
- Figure 123: APAC Lab On Chip Market Y-o-Y Growth Rate Comparison by Technology (2016-2032)
- Figure 124: APAC Lab On Chip Market Y-o-Y Growth Rate Comparison by Application (2016-2032)
- Figure 125: APAC Lab On Chip Market Y-o-Y Growth Rate Comparison by End User (2016-2032)
- Figure 126: APAC Lab On Chip Market Share Comparison by Country (2016-2032)
- Figure 127: APAC Lab On Chip Market Share Comparison by Product (2016-2032)
- Figure 128: APAC Lab On Chip Market Share Comparison by Technology (2016-2032)
- Figure 129: APAC Lab On Chip Market Share Comparison by Application (2016-2032)
- Figure 130: APAC Lab On Chip Market Share Comparison by End User (2016-2032)
- Figure 131: Latin America Lab On Chip Market Revenue (US$ Mn) Market Share by Productin 2022
- Figure 132: Latin America Lab On Chip Market Attractiveness Analysis by Product, 2016-2032
- Figure 133: Latin America Lab On Chip Market Revenue (US$ Mn) Market Share by Technologyin 2022
- Figure 134: Latin America Lab On Chip Market Attractiveness Analysis by Technology, 2016-2032
- Figure 135: Latin America Lab On Chip Market Revenue (US$ Mn) Market Share by Applicationin 2022
- Figure 136: Latin America Lab On Chip Market Attractiveness Analysis by Application, 2016-2032
- Figure 137: Latin America Lab On Chip Market Revenue (US$ Mn) Market Share by End Userin 2022
- Figure 138: Latin America Lab On Chip Market Attractiveness Analysis by End User, 2016-2032
- Figure 139: Latin America Lab On Chip Market Revenue (US$ Mn) Market Share by Country in 2022
- Figure 140: Latin America Lab On Chip Market Attractiveness Analysis by Country, 2016-2032
- Figure 141: Latin America Lab On Chip Market Revenue (US$ Mn) (2016-2032)
- Figure 142: Latin America Lab On Chip Market Revenue (US$ Mn) Comparison by Country (2016-2032)
- Figure 143: Latin America Lab On Chip Market Revenue (US$ Mn) Comparison by Product (2016-2032)
- Figure 144: Latin America Lab On Chip Market Revenue (US$ Mn) Comparison by Technology (2016-2032)
- Figure 145: Latin America Lab On Chip Market Revenue (US$ Mn) Comparison by Application (2016-2032)
- Figure 146: Latin America Lab On Chip Market Revenue (US$ Mn) Comparison by End User (2016-2032)
- Figure 147: Latin America Lab On Chip Market Y-o-Y Growth Rate Comparison by Country (2016-2032)
- Figure 148: Latin America Lab On Chip Market Y-o-Y Growth Rate Comparison by Product (2016-2032)
- Figure 149: Latin America Lab On Chip Market Y-o-Y Growth Rate Comparison by Technology (2016-2032)
- Figure 150: Latin America Lab On Chip Market Y-o-Y Growth Rate Comparison by Application (2016-2032)
- Figure 151: Latin America Lab On Chip Market Y-o-Y Growth Rate Comparison by End User (2016-2032)
- Figure 152: Latin America Lab On Chip Market Share Comparison by Country (2016-2032)
- Figure 153: Latin America Lab On Chip Market Share Comparison by Product (2016-2032)
- Figure 154: Latin America Lab On Chip Market Share Comparison by Technology (2016-2032)
- Figure 155: Latin America Lab On Chip Market Share Comparison by Application (2016-2032)
- Figure 156: Latin America Lab On Chip Market Share Comparison by End User (2016-2032)
- Figure 157: Middle East & Africa Lab On Chip Market Revenue (US$ Mn) Market Share by Productin 2022
- Figure 158: Middle East & Africa Lab On Chip Market Attractiveness Analysis by Product, 2016-2032
- Figure 159: Middle East & Africa Lab On Chip Market Revenue (US$ Mn) Market Share by Technologyin 2022
- Figure 160: Middle East & Africa Lab On Chip Market Attractiveness Analysis by Technology, 2016-2032
- Figure 161: Middle East & Africa Lab On Chip Market Revenue (US$ Mn) Market Share by Applicationin 2022
- Figure 162: Middle East & Africa Lab On Chip Market Attractiveness Analysis by Application, 2016-2032
- Figure 163: Middle East & Africa Lab On Chip Market Revenue (US$ Mn) Market Share by End Userin 2022
- Figure 164: Middle East & Africa Lab On Chip Market Attractiveness Analysis by End User, 2016-2032
- Figure 165: Middle East & Africa Lab On Chip Market Revenue (US$ Mn) Market Share by Country in 2022
- Figure 166: Middle East & Africa Lab On Chip Market Attractiveness Analysis by Country, 2016-2032
- Figure 167: Middle East & Africa Lab On Chip Market Revenue (US$ Mn) (2016-2032)
- Figure 168: Middle East & Africa Lab On Chip Market Revenue (US$ Mn) Comparison by Country (2016-2032)
- Figure 169: Middle East & Africa Lab On Chip Market Revenue (US$ Mn) Comparison by Product (2016-2032)
- Figure 170: Middle East & Africa Lab On Chip Market Revenue (US$ Mn) Comparison by Technology (2016-2032)
- Figure 171: Middle East & Africa Lab On Chip Market Revenue (US$ Mn) Comparison by Application (2016-2032)
- Figure 172: Middle East & Africa Lab On Chip Market Revenue (US$ Mn) Comparison by End User (2016-2032)
- Figure 173: Middle East & Africa Lab On Chip Market Y-o-Y Growth Rate Comparison by Country (2016-2032)
- Figure 174: Middle East & Africa Lab On Chip Market Y-o-Y Growth Rate Comparison by Product (2016-2032)
- Figure 175: Middle East & Africa Lab On Chip Market Y-o-Y Growth Rate Comparison by Technology (2016-2032)
- Figure 176: Middle East & Africa Lab On Chip Market Y-o-Y Growth Rate Comparison by Application (2016-2032)
- Figure 177: Middle East & Africa Lab On Chip Market Y-o-Y Growth Rate Comparison by End User (2016-2032)
- Figure 178: Middle East & Africa Lab On Chip Market Share Comparison by Country (2016-2032)
- Figure 179: Middle East & Africa Lab On Chip Market Share Comparison by Product (2016-2032)
- Figure 180: Middle East & Africa Lab On Chip Market Share Comparison by Technology (2016-2032)
- Figure 181: Middle East & Africa Lab On Chip Market Share Comparison by Application (2016-2032)
- Figure 182: Middle East & Africa Lab On Chip Market Share Comparison by End User (2016-2032)
- List of Tables
- Table 1: Global Lab On Chip Market Comparison by Product (2016-2032)
- Table 2: Global Lab On Chip Market Comparison by Technology (2016-2032)
- Table 3: Global Lab On Chip Market Comparison by Application (2016-2032)
- Table 4: Global Lab On Chip Market Comparison by End User (2016-2032)
- Table 5: Global Lab On Chip Market Revenue (US$ Mn) Comparison by Region (2016-2032)
- Table 6: Global Lab On Chip Market Revenue (US$ Mn) (2016-2032)
- Table 7: Global Lab On Chip Market Revenue (US$ Mn) Comparison by Region (2016-2032)
- Table 8: Global Lab On Chip Market Revenue (US$ Mn) Comparison by Product (2016-2032)
- Table 9: Global Lab On Chip Market Revenue (US$ Mn) Comparison by Technology (2016-2032)
- Table 10: Global Lab On Chip Market Revenue (US$ Mn) Comparison by Application (2016-2032)
- Table 11: Global Lab On Chip Market Revenue (US$ Mn) Comparison by End User (2016-2032)
- Table 12: Global Lab On Chip Market Y-o-Y Growth Rate Comparison by Region (2016-2032)
- Table 13: Global Lab On Chip Market Y-o-Y Growth Rate Comparison by Product (2016-2032)
- Table 14: Global Lab On Chip Market Y-o-Y Growth Rate Comparison by Technology (2016-2032)
- Table 15: Global Lab On Chip Market Y-o-Y Growth Rate Comparison by Application (2016-2032)
- Table 16: Global Lab On Chip Market Y-o-Y Growth Rate Comparison by End User (2016-2032)
- Table 17: Global Lab On Chip Market Share Comparison by Region (2016-2032)
- Table 18: Global Lab On Chip Market Share Comparison by Product (2016-2032)
- Table 19: Global Lab On Chip Market Share Comparison by Technology (2016-2032)
- Table 20: Global Lab On Chip Market Share Comparison by Application (2016-2032)
- Table 21: Global Lab On Chip Market Share Comparison by End User (2016-2032)
- Table 22: North America Lab On Chip Market Comparison by Technology (2016-2032)
- Table 23: North America Lab On Chip Market Comparison by Application (2016-2032)
- Table 24: North America Lab On Chip Market Comparison by End User (2016-2032)
- Table 25: North America Lab On Chip Market Revenue (US$ Mn) Comparison by Country (2016-2032)
- Table 26: North America Lab On Chip Market Revenue (US$ Mn) (2016-2032)
- Table 27: North America Lab On Chip Market Revenue (US$ Mn) Comparison by Country (2016-2032)
- Table 28: North America Lab On Chip Market Revenue (US$ Mn) Comparison by Product (2016-2032)
- Table 29: North America Lab On Chip Market Revenue (US$ Mn) Comparison by Technology (2016-2032)
- Table 30: North America Lab On Chip Market Revenue (US$ Mn) Comparison by Application (2016-2032)
- Table 31: North America Lab On Chip Market Revenue (US$ Mn) Comparison by End User (2016-2032)
- Table 32: North America Lab On Chip Market Y-o-Y Growth Rate Comparison by Country (2016-2032)
- Table 33: North America Lab On Chip Market Y-o-Y Growth Rate Comparison by Product (2016-2032)
- Table 34: North America Lab On Chip Market Y-o-Y Growth Rate Comparison by Technology (2016-2032)
- Table 35: North America Lab On Chip Market Y-o-Y Growth Rate Comparison by Application (2016-2032)
- Table 36: North America Lab On Chip Market Y-o-Y Growth Rate Comparison by End User (2016-2032)
- Table 37: North America Lab On Chip Market Share Comparison by Country (2016-2032)
- Table 38: North America Lab On Chip Market Share Comparison by Product (2016-2032)
- Table 39: North America Lab On Chip Market Share Comparison by Technology (2016-2032)
- Table 40: North America Lab On Chip Market Share Comparison by Application (2016-2032)
- Table 41: North America Lab On Chip Market Share Comparison by End User (2016-2032)
- Table 42: Western Europe Lab On Chip Market Comparison by Product (2016-2032)
- Table 43: Western Europe Lab On Chip Market Comparison by Technology (2016-2032)
- Table 44: Western Europe Lab On Chip Market Comparison by Application (2016-2032)
- Table 45: Western Europe Lab On Chip Market Comparison by End User (2016-2032)
- Table 46: Western Europe Lab On Chip Market Revenue (US$ Mn) Comparison by Country (2016-2032)
- Table 47: Western Europe Lab On Chip Market Revenue (US$ Mn) (2016-2032)
- Table 48: Western Europe Lab On Chip Market Revenue (US$ Mn) Comparison by Country (2016-2032)
- Table 49: Western Europe Lab On Chip Market Revenue (US$ Mn) Comparison by Product (2016-2032)
- Table 50: Western Europe Lab On Chip Market Revenue (US$ Mn) Comparison by Technology (2016-2032)
- Table 51: Western Europe Lab On Chip Market Revenue (US$ Mn) Comparison by Application (2016-2032)
- Table 52: Western Europe Lab On Chip Market Revenue (US$ Mn) Comparison by End User (2016-2032)
- Table 53: Western Europe Lab On Chip Market Y-o-Y Growth Rate Comparison by Country (2016-2032)
- Table 54: Western Europe Lab On Chip Market Y-o-Y Growth Rate Comparison by Product (2016-2032)
- Table 55: Western Europe Lab On Chip Market Y-o-Y Growth Rate Comparison by Technology (2016-2032)
- Table 56: Western Europe Lab On Chip Market Y-o-Y Growth Rate Comparison by Application (2016-2032)
- Table 57: Western Europe Lab On Chip Market Y-o-Y Growth Rate Comparison by End User (2016-2032)
- Table 58: Western Europe Lab On Chip Market Share Comparison by Country (2016-2032)
- Table 59: Western Europe Lab On Chip Market Share Comparison by Product (2016-2032)
- Table 60: Western Europe Lab On Chip Market Share Comparison by Technology (2016-2032)
- Table 61: Western Europe Lab On Chip Market Share Comparison by Application (2016-2032)
- Table 62: Western Europe Lab On Chip Market Share Comparison by End User (2016-2032)
- Table 63: Eastern Europe Lab On Chip Market Comparison by Product (2016-2032)
- Table 64: Eastern Europe Lab On Chip Market Comparison by Technology (2016-2032)
- Table 65: Eastern Europe Lab On Chip Market Comparison by Application (2016-2032)
- Table 66: Eastern Europe Lab On Chip Market Comparison by End User (2016-2032)
- Table 67: Eastern Europe Lab On Chip Market Revenue (US$ Mn) Comparison by Country (2016-2032)
- Table 68: Eastern Europe Lab On Chip Market Revenue (US$ Mn) (2016-2032)
- Table 69: Eastern Europe Lab On Chip Market Revenue (US$ Mn) Comparison by Country (2016-2032)
- Table 70: Eastern Europe Lab On Chip Market Revenue (US$ Mn) Comparison by Product (2016-2032)
- Table 71: Eastern Europe Lab On Chip Market Revenue (US$ Mn) Comparison by Technology (2016-2032)
- Table 72: Eastern Europe Lab On Chip Market Revenue (US$ Mn) Comparison by Application (2016-2032)
- Table 73: Eastern Europe Lab On Chip Market Revenue (US$ Mn) Comparison by End User (2016-2032)
- Table 74: Eastern Europe Lab On Chip Market Y-o-Y Growth Rate Comparison by Country (2016-2032)
- Table 75: Eastern Europe Lab On Chip Market Y-o-Y Growth Rate Comparison by Product (2016-2032)
- Table 76: Eastern Europe Lab On Chip Market Y-o-Y Growth Rate Comparison by Technology (2016-2032)
- Table 77: Eastern Europe Lab On Chip Market Y-o-Y Growth Rate Comparison by Application (2016-2032)
- Table 78: Eastern Europe Lab On Chip Market Y-o-Y Growth Rate Comparison by End User (2016-2032)
- Table 79: Eastern Europe Lab On Chip Market Share Comparison by Country (2016-2032)
- Table 80: Eastern Europe Lab On Chip Market Share Comparison by Product (2016-2032)
- Table 81: Eastern Europe Lab On Chip Market Share Comparison by Technology (2016-2032)
- Table 82: Eastern Europe Lab On Chip Market Share Comparison by Application (2016-2032)
- Table 83: Eastern Europe Lab On Chip Market Share Comparison by End User (2016-2032)
- Table 84: APAC Lab On Chip Market Comparison by Product (2016-2032)
- Table 85: APAC Lab On Chip Market Comparison by Technology (2016-2032)
- Table 86: APAC Lab On Chip Market Comparison by Application (2016-2032)
- Table 87: APAC Lab On Chip Market Comparison by End User (2016-2032)
- Table 88: APAC Lab On Chip Market Revenue (US$ Mn) Comparison by Country (2016-2032)
- Table 89: APAC Lab On Chip Market Revenue (US$ Mn) (2016-2032)
- Table 90: APAC Lab On Chip Market Revenue (US$ Mn) Comparison by Country (2016-2032)
- Table 91: APAC Lab On Chip Market Revenue (US$ Mn) Comparison by Product (2016-2032)
- Table 92: APAC Lab On Chip Market Revenue (US$ Mn) Comparison by Technology (2016-2032)
- Table 93: APAC Lab On Chip Market Revenue (US$ Mn) Comparison by Application (2016-2032)
- Table 94: APAC Lab On Chip Market Revenue (US$ Mn) Comparison by End User (2016-2032)
- Table 95: APAC Lab On Chip Market Y-o-Y Growth Rate Comparison by Country (2016-2032)
- Table 96: APAC Lab On Chip Market Y-o-Y Growth Rate Comparison by Product (2016-2032)
- Table 97: APAC Lab On Chip Market Y-o-Y Growth Rate Comparison by Technology (2016-2032)
- Table 98: APAC Lab On Chip Market Y-o-Y Growth Rate Comparison by Application (2016-2032)
- Table 99: APAC Lab On Chip Market Y-o-Y Growth Rate Comparison by End User (2016-2032)
- Table 100: APAC Lab On Chip Market Share Comparison by Country (2016-2032)
- Table 101: APAC Lab On Chip Market Share Comparison by Product (2016-2032)
- Table 102: APAC Lab On Chip Market Share Comparison by Technology (2016-2032)
- Table 103: APAC Lab On Chip Market Share Comparison by Application (2016-2032)
- Table 104: APAC Lab On Chip Market Share Comparison by End User (2016-2032)
- Table 105: Latin America Lab On Chip Market Comparison by Product (2016-2032)
- Table 106: Latin America Lab On Chip Market Comparison by Technology (2016-2032)
- Table 107: Latin America Lab On Chip Market Comparison by Application (2016-2032)
- Table 108: Latin America Lab On Chip Market Comparison by End User (2016-2032)
- Table 109: Latin America Lab On Chip Market Revenue (US$ Mn) Comparison by Country (2016-2032)
- Table 110: Latin America Lab On Chip Market Revenue (US$ Mn) (2016-2032)
- Table 111: Latin America Lab On Chip Market Revenue (US$ Mn) Comparison by Country (2016-2032)
- Table 112: Latin America Lab On Chip Market Revenue (US$ Mn) Comparison by Product (2016-2032)
- Table 113: Latin America Lab On Chip Market Revenue (US$ Mn) Comparison by Technology (2016-2032)
- Table 114: Latin America Lab On Chip Market Revenue (US$ Mn) Comparison by Application (2016-2032)
- Table 115: Latin America Lab On Chip Market Revenue (US$ Mn) Comparison by End User (2016-2032)
- Table 116: Latin America Lab On Chip Market Y-o-Y Growth Rate Comparison by Country (2016-2032)
- Table 117: Latin America Lab On Chip Market Y-o-Y Growth Rate Comparison by Product (2016-2032)
- Table 118: Latin America Lab On Chip Market Y-o-Y Growth Rate Comparison by Technology (2016-2032)
- Table 119: Latin America Lab On Chip Market Y-o-Y Growth Rate Comparison by Application (2016-2032)
- Table 120: Latin America Lab On Chip Market Y-o-Y Growth Rate Comparison by End User (2016-2032)
- Table 121: Latin America Lab On Chip Market Share Comparison by Country (2016-2032)
- Table 122: Latin America Lab On Chip Market Share Comparison by Product (2016-2032)
- Table 123: Latin America Lab On Chip Market Share Comparison by Technology (2016-2032)
- Table 124: Latin America Lab On Chip Market Share Comparison by Application (2016-2032)
- Table 125: Latin America Lab On Chip Market Share Comparison by End User (2016-2032)
- Table 126: Middle East & Africa Lab On Chip Market Comparison by Product (2016-2032)
- Table 127: Middle East & Africa Lab On Chip Market Comparison by Technology (2016-2032)
- Table 128: Middle East & Africa Lab On Chip Market Comparison by Application (2016-2032)
- Table 129: Middle East & Africa Lab On Chip Market Comparison by End User (2016-2032)
- Table 130: Middle East & Africa Lab On Chip Market Revenue (US$ Mn) Comparison by Country (2016-2032)
- Table 131: Middle East & Africa Lab On Chip Market Revenue (US$ Mn) (2016-2032)
- Table 132: Middle East & Africa Lab On Chip Market Revenue (US$ Mn) Comparison by Country (2016-2032)
- Table 133: Middle East & Africa Lab On Chip Market Revenue (US$ Mn) Comparison by Product (2016-2032)
- Table 134: Middle East & Africa Lab On Chip Market Revenue (US$ Mn) Comparison by Technology (2016-2032)
- Table 135: Middle East & Africa Lab On Chip Market Revenue (US$ Mn) Comparison by Application (2016-2032)
- Table 136: Middle East & Africa Lab On Chip Market Revenue (US$ Mn) Comparison by End User (2016-2032)
- Table 137: Middle East & Africa Lab On Chip Market Y-o-Y Growth Rate Comparison by Country (2016-2032)
- Table 138: Middle East & Africa Lab On Chip Market Y-o-Y Growth Rate Comparison by Product (2016-2032)
- Table 139: Middle East & Africa Lab On Chip Market Y-o-Y Growth Rate Comparison by Technology (2016-2032)
- Table 140: Middle East & Africa Lab On Chip Market Y-o-Y Growth Rate Comparison by Application (2016-2032)
- Table 141: Middle East & Africa Lab On Chip Market Y-o-Y Growth Rate Comparison by End User (2016-2032)
- Table 142: Middle East & Africa Lab On Chip Market Share Comparison by Country (2016-2032)
- Table 143: Middle East & Africa Lab On Chip Market Share Comparison by Product (2016-2032)
- Table 144: Middle East & Africa Lab On Chip Market Share Comparison by Technology (2016-2032)
- Table 145: Middle East & Africa Lab On Chip Market Share Comparison by Application (2016-2032)
- Table 146: Middle East & Africa Lab On Chip Market Share Comparison by End User (2016-2032)
- 1. Executive Summary
-
- Danaher Corporation
- Abbott Laboratories
- Bio-Rad Laboratories Inc.
- Thermo Fisher Scientific Inc.
- Illumina Inc.
- Tara Biosystems
- IDEX Corporation
- F. Hoffmann-La Roche Ag
- Agilent Technologies Inc.
- PerkinElmer Inc.
- Fluidigm Corporation
Our Clients


View Our Licence Options
