
Iot Solutions Market By Solution Type (Data Management, Network Management, Device Management), By Deployment Mode (Cloud Based, On-Premises), By End-Use Industry (Manufacturing, Automotive, Energy & Utilities, Retail, Healthcare, Other), By Region And Companies - Industry Segment Outlook, Market Assessment, Competition Scenario, Trends, And Forecast 2023-2032
-
22694
-
May 2023
-
175
-


-
This report was compiled by Vishwa Gaul Vishwa is an experienced market research and consulting professional with over 8 years of expertise in the ICT industry, contributing to over 700 reports across telecommunications, software, hardware, and digital solutions. Correspondence Team Lead- ICT Linkedin | Detailed Market research Methodology Our methodology involves a mix of primary research, including interviews with leading mental health experts, and secondary research from reputable medical journals and databases. View Detailed Methodology Page
-
Quick Navigation
Report Overview
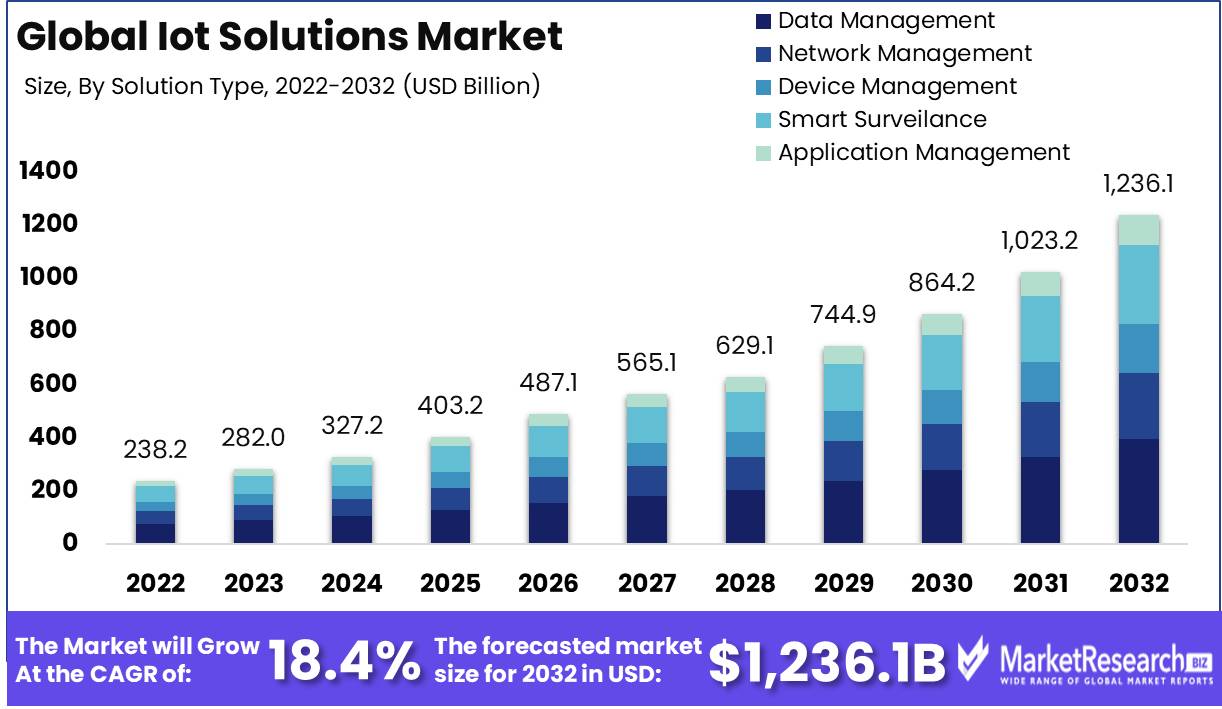
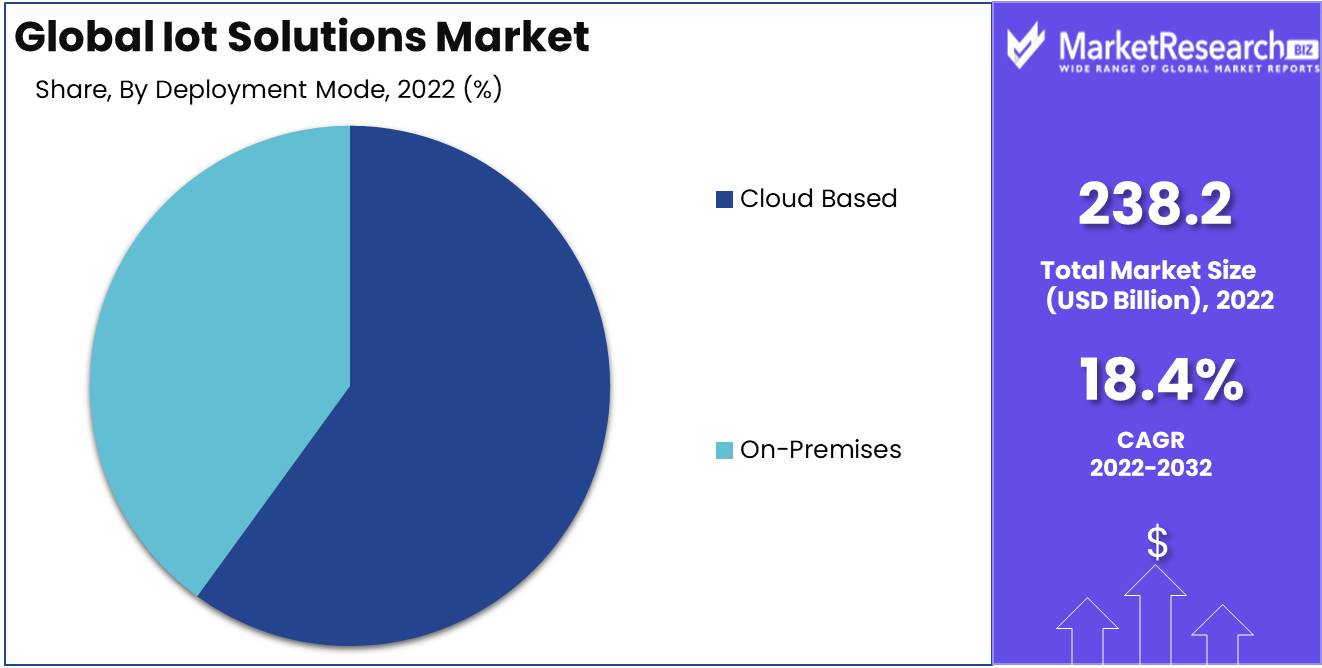
Iot Solutions Market size is expected to be worth around USD 1,236.1 Bn by 2032 from USD 238.2 Bn in 2022, growing at a CAGR of 18.4% during the forecast period from 2023 to 2032.
The Internet of Things (IoT) has revolutionized our living and working environments. It has transformed commonplace objects into intelligent devices capable of communicating and interacting with one another, thereby establishing a network of interconnected devices. This network has spawned the IoT solutions market, which offers a variety of products and services to assist individuals and businesses in harnessing the potential of IoT. IoT solutions are the technologies, tools, and services that allow for the connection and communication between devices, sensors, machinery, and humans. The primary objective of these solutions is to facilitate data collection, analysis, and automation, thereby enhancing productivity, efficiency, and decision-making.
The significance and benefits of Internet of Things solutions cannot be overstated. They have the potential to revolutionize industries, enhance quality of life, and stimulate economic growth. Iot Solutions Market enable enterprises to obtain valuable insights into their operations, consumer behavior, and market trends by connecting devices and generating vast amounts of data. This data-driven strategy facilitates improved decision-making, enhanced efficiency, and increased creativity.
The IoT solutions market has witnessed numerous noteworthy innovations. One such innovation is the creation of smart homes in which multiple devices and appliances can be connected and remotely controlled. This technology has the potential to transform how we interact with our residences, rendering them more energy-efficient, secure, and convenient.
The use of IoT solutions in healthcare is a further innovative development. Connected devices, such as wearable fitness trackers, glucose monitors, and remote patient monitoring systems, enable healthcare professionals to monitor the health of patients in real time and provide individualized care. This technology has the potential to improve patient outcomes, lower healthcare costs, and enhance the quality of healthcare services as a whole.
Iot Solutions Market Market has attracted significant investments from both established businesses and entrepreneurs. To obtain a competitive advantage, numerous businesses are integrating IoT technologies into their products and services. Automobile manufacturers are integrating IoT solutions into their vehicles to enable remote diagnostics, predictive maintenance, and connected car services, among other features."
Driving factors
Connected Technologies and Intelligent Devices
Undoubtedly, the Internet of Things (IoT) is transforming how we live, work, and interact with the world. Increasing adoption of connected devices and intelligent technologies is one of the primary forces propelling this transformation. Not only are these devices and technologies making our lives more convenient, but they are also paving the way for a future in which every aspect of our lives will be seamlessly interconnected. Connected devices, including smartphones, smart televisions, wearable devices, and even domestic appliances, have become an integral part of our daily existence. As a result of the development of IoT, these devices can now communicate and interact with one another, forming a connected ecosystem. This ecosystem allows individuals, businesses, and industries to capitalize on the vast potential of data-driven decision making, automation, and connectivity.
Sensor and Interconnect Technologies
The rapid expansion of Iot Solutions Market is also fueled by the development of sensor and connectivity technologies. Sensors play a crucial role in the Internet of Things because they acquire and transmit real-time data. From temperature and humidity sensors to GPS trackers and motion sensors, these technologies allow us to collect valuable information about the physical world and base our decisions on this information. The IoT ecosystem is supported by wireless connectivity technologies such as Wi-Fi, Bluetooth, RFID, and cellular networks.
Decision Making and Automation Based on Data
The IoT is driving this data revolution, as data has become the essence of modern enterprises. With the increasing interconnectivity of devices and the ability to collect real-time data on an unprecedented scale, data-driven decision making has emerged as a crucial success factor. The IoT solutions market is experiencing an increase in demand for analytics and data management platforms that can assist businesses in making sense of the immense quantities of data they acquire. Another area where the Internet of Things is having a significant impact is automation. Businesses can automate repetitive tasks, reduce human error, and improve operational efficiency by connecting devices and allowing them to communicate and share data.
Increasing Applications Across Sectors
IoT solutions are no longer restricted to a handful of industries. From agriculture and healthcare to transportation and retail, the IoT is permeating every industry. Connected devices and IoT solutions are revolutionizing patient care and monitoring in the healthcare industry. Intelligent devices can monitor vital signs, remind patients to take medications, and facilitate remote consultations with medical professionals. Iot Solutions Market assist producers in optimizing agricultural yields, conserving resources, and monitoring livestock. Connected sensors can provide real-time data on soil conditions, weather patterns, and animal health, allowing producers to make decisions based on data and maximize their productivity.
Restraining Factors
security and confidentiality issues
With the rapid expansion of the Internet of Things (IoT) solutions market, in which numerous devices are interconnected and communicate, certain restraining factors must be considered. Concerns regarding security and privacy that arise from the deployment of IoT solutions are among the most important factors.
As IoT solutions necessitate the collection and exchange of immense quantities of data, including sensitive and personal information, ensuring the security and confidentiality of this data becomes crucial. Unauthorized access, data intrusions, and cyberattacks are among the potential security hazards. Invulnerabilities in IoT devices or networks can be exploited by hackers and malicious actors, leading to the potential compromise of personal information, corporate data, and even critical infrastructure.
Interoperability difficulties
Interoperability is an additional limiting factor that must be addressed when discussing Iot Solutions Market. As a result of the proliferation of IoT devices and platforms, ensuring communication and compatibility between disparate systems is crucial for their efficient operation.
Interoperability refers to the capacity of diverse devices, networks, and applications to communicate and exchange data. Nevertheless, attaining interoperability within the IoT ecosystem can be difficult due to the diverse protocols, standards, and technologies employed by various manufacturers and service providers.
scalability and complexity
When it comes to the implementation of Iot Solutions Market, scalability is a significant challenge. As the IoT market continues to expand, organizations must ensure that their systems can scale to accommodate growing volumes of connected devices and data.
The shear complexity and diversity of internet things (iot) implementations creates prospective scalability challenges. IoT solutions frequently involve the incorporation of multiple devices, data sources, and platforms, necessitating a scalable infrastructure to meet the ever-increasing demands. Without adequate scalability measures, organizations may struggle to effectively manage and process data, resulting in performance issues and operational limitations.
statutory and regulatory requirements
In the world of IoT solutions, regulatory and compliance requirements are crucial. Governments and regulatory entities are increasingly enforcing regulations to ensure privacy, data protection, and ethical use of IoT devices as IoT technologies become integral to numerous industries.
Noncompliance with these regulations may result in legal penalties, reputational harm, and loss of consumer confidence. Consequently, it is crucial for organizations to maintain an awareness of the legal and regulatory frameworks that govern IoT deployments in their respective industries and geographies.
Lack of standard procedures
Lack of standardized protocols and communication frameworks is one of the most significant obstacles to interoperability and widespread adoption in the IoT solutions market. Due to the fact that numerous purveyors and manufacturers are developing IoT devices and platforms using their own proprietary protocols, the lack of uniformity creates obstacles for seamless integration and collaboration.
Solution Type Analysis
The IoT solutions market is experiencing significant growth, and within this market, the Data Management Segment is dominating. This segment focuses on storing, processing, and analyzing the vast amounts of data generated by IoT devices. The increasing adoption of IoT solutions in various industries is driving the demand for effective data management systems.
Consumer trends and behaviors also contribute to the dominance of the Data Management Segment. Consumers are increasingly relying on IoT devices and generating vast amounts of data. To make sense of this data and derive valuable insights, there is a growing demand for advanced data management solutions. Consumers see the potential benefits of analyzing IoT data and are willing to invest in the necessary infrastructure.
Deployment Mode Analysis
In the realm of IoT solutions, the Cloud Based Segment is dominating the market. This segment involves deploying IoT solutions on cloud platforms, allowing for flexibility, scalability, and easy integration. The cloud-based approach has revolutionized the way organizations implement IoT solutions by providing numerous benefits.
Consumer trends and behaviors also shape the dominance of the Cloud Based Segment. Consumers are increasingly relying on cloud-based services in their everyday lives, such as cloud storage and streaming platforms. This reliance has translated into a preference for cloud-based Iot Solutions Market, where consumers can access and control their IoT devices from anywhere.
End-Use Industry Analysis
In the field of IoT solutions, the Healthcare Segment stands out as the dominant market player. Advancements in healthcare technology and the increasing reliance on IoT devices have propelled the growth of this segment. IoT solutions in healthcare aim to improve patient outcomes, enhance healthcare delivery, and optimize clinical processes.
Consumer trends and behaviors also contribute to the dominance of the Healthcare Segment. Patients are increasingly interested in taking control of their health and well-being through wearable devices and home healthcare solutions. The ability to monitor vital signs, track medication adherence, and receive personalized healthcare recommendations has resonated with consumers, driving the demand for IoT solutions in healthcare.
Key Market Segments
By Solution Type
- Data Management
- Network Management
- Device Management
- Smart Surveilance
- Application Management
By Deployment Mode
- Cloud Based
- On-Premises
By End-Use Industry
- Manufacturing
- Automotive
- Energy & Utilities
- Retail
- Healthcare
- Other End-Use Industry
Growth Opportunity
IoT Platforms and Solutions Development
Innovative IoT platform and solution development is at the vanguard of the market's growth potential. As businesses embrace digital transformation, they need solutions that are adaptable and scalable and can incorporate seamlessly with their existing infrastructure. By investing in R&D, businesses can promote innovation in the Internet of Things (IoT) space and develop cutting-edge technologies that cater to the specific requirements of various industries.
Infrastructure Development to Support Expansion
Expanding into emerging markets with infrastructure development represents a significant growth opportunity. India, China, and Brazil are among the developing nations experiencing accelerated urbanization and technological development. With governments investing significantly in infrastructure development, these markets offer IoT solution providers an immense opportunity. By capitalizing on this opportunity and tailoring their products to the specific needs of these markets, businesses can establish a solid foothold and tap into previously untapped consumer bases.
IoT Solution Provider Collaboration
Collaboration with industry-specific IoT solution providers is essential for businesses seeking to capitalize on the market's growth potential. Different industries, including healthcare, agriculture, and manufacturing, face unique challenges and have specific needs that necessitate specialized IoT solutions. By partnering with providers with expertise in these specific domains, businesses can create comprehensive solutions that address industry-specific pain points. This partnership also enables them to leverage the existing networks and customer relationships of their partners, thereby creating significant growth opportunities.
Utilization of AI and Edge Computing
Adoption of peripheral computing and artificial intelligence (AI) represents a market-altering growth opportunity for IoT solutions. Traditional cloud computing architectures have limitations in terms of latency, bandwidth, and data security due to the exponential growth of connected devices and the vast quantity of data produced. periphery computing, which entails data processing at the network's periphery, enables real-time insights and quicker decision-making. By embedding AI algorithms into edge devices, businesses can leverage the power of machine learning and predictive analytics to extract meaningful insights from the enormous quantities of data generated by IoT devices.
Latest Trends
Smart manufacturing and supply chain management
IIoT has emerged as a game-changer in the landscape of manufacturing and supply chains. The incorporation of Internet of Things (IoT) technologies and devices into industrial processes has enabled manufacturers to optimize operations, reduce costs, and improve overall efficiency. By leveraging the IIoT's real-time data and insights, businesses are able to monitor equipment performance, identify areas for enhancement, and proactively resolve issues, resulting in increased productivity.
Home Automation and Smart Devices
In recent years, the demand for IoT-enabled home automation and smart devices has increased exponentially. This trend is attributable to the growing demand for convenience, comfort, and energy efficiency in contemporary homes. IoT has transformed the way we interact with our homes, from voice-activated virtual assistants to voice-controlled thermostats and lighting systems. Not only do these devices improve our daily lives, but they also reduce our energy consumption and carbon footprints.
Precision Farming in Agriculture
IoT solutions have been adopted by the agricultural sector in order to resolve critical issues such as food security and resource optimization. IoT-enabled precision agriculture enables producers to remotely monitor crop conditions, soil moisture levels, and weather patterns. Farmers can make informed decisions regarding irrigation, fertilization, and pest control by accumulating and analyzing real-time data from IoT sensors installed throughout their properties. These precision agricultural techniques result in increased crop yields, decreased resource waste, and enhanced sustainability.
Remote Patient Monitoring in Healthcare
IoT has ushered in a new era in healthcare, enabling remote patient monitoring for both physicians and patients. Connected medical devices, wearable sensors, and telehealth applications allow healthcare professionals to remotely monitor patients' vital signs, detect abnormalities, and intervene as needed. This technology facilitates proactive and individualized healthcare, prevents hospital readmissions, and enhances patient outcomes. In addition, IoT solutions in healthcare support the geriatric by granting them a greater sense of independence and peace of mind.
Adoption of 5G Connectivity
5G connectivity will transform the IoT landscape by addressing the need for faster data transmission speeds, decreased latency, and increased device connectivity. This next-generation wireless technology unleashes the true potential of the Internet of Things by facilitating unprecedented levels of advanced applications such as autonomous vehicles, smart cities, and industrial automation. With 5G, it is anticipated that Iot Solutions Market will experience unprecedented growth.
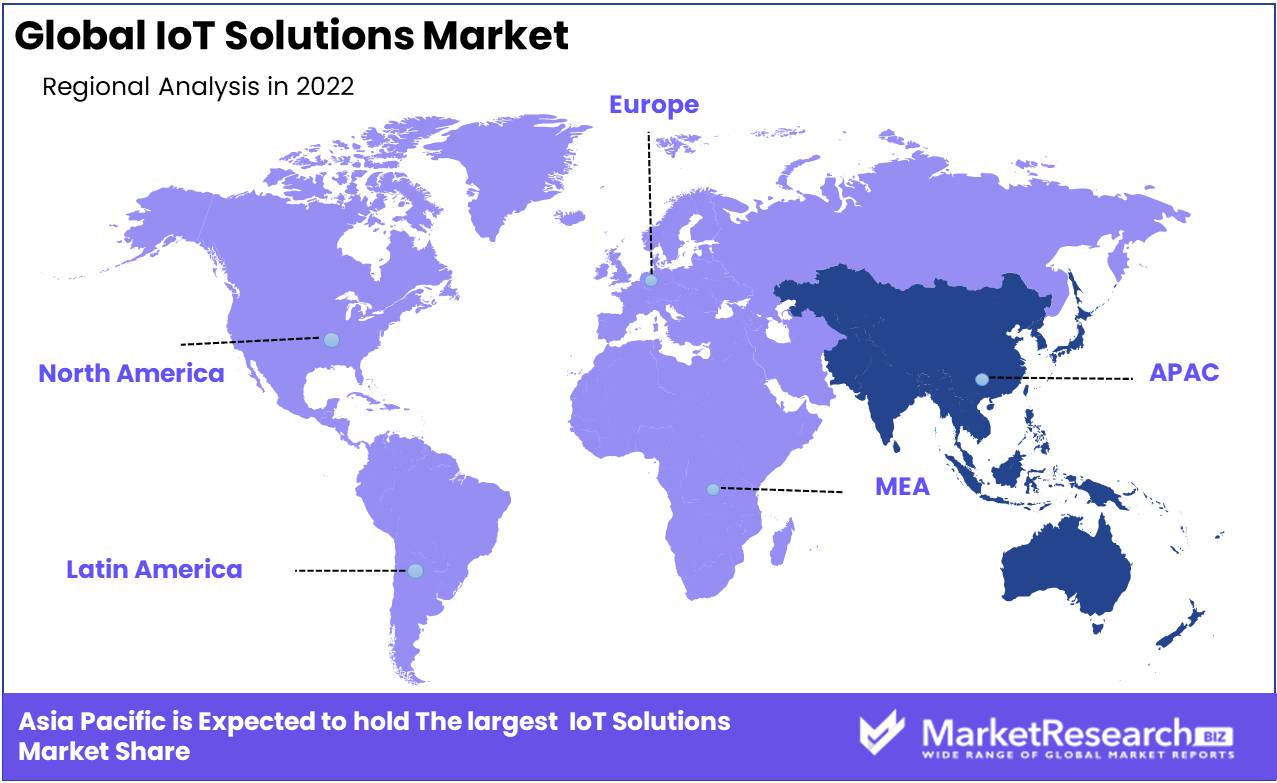
Regional Analysis
IoT (Internet of Things) Solutions Market Dominates Asia-Pacific Region. Internet of Things (IoT) has emerged as a game-changer in today's tech-driven society, revolutionizing the way we live, work, and interact. The seamless connectivity of devices, data, and people has paved the way for a future that is both intelligent and efficient. As companies throughout the world leverage the power of IoT, it becomes essential to comprehend the regional landscape and the dominant actors in this swiftly evolving market.
In Iot Solutions Market, Asia-Pacific has emerged as a formidable competitor. It is not surprising that Asia-Pacific is at the vanguard of this digital revolution, given its large and diverse population, technological advancements, and government initiatives fostering digital transformation.
Its enormous consumer base is one of the primary factors for Asia-Pacific's dominance in the IoT solutions market. This region, which contains more than half of the world's population, offers a vast market for Internet of Things products and services. As Asia-Pacific nations continue to experience robust economic growth, the demand for innovative IoT solutions is on the rise.
Due to technological advances, the Asia-Pacific region has an advantage in the IoT solutions market. Countries in this region invest significantly in R&D, nurturing innovation and fostering an environment conducive to IoT expansion. By concentrating on artificial intelligence, cloud computing, and big data analytics, Asia-Pacific nations are well-positioned to provide cutting-edge Internet of Things (IoT) solutions to satisfy the evolving needs of businesses and consumers.
Key Regions and Countries
North America
- US
- Canada
- Mexico
Western Europe
- Germany
- France
- The UK
- Spain
- Italy
- Portugal
- Ireland
- Austria
- Switzerland
- Benelux
- Nordic
- Rest of Western Europe
Eastern Europe
- Russia
- Poland
- The Czech Republic
- Greece
- Rest of Eastern Europe
APAC
- China
- Japan
- South Korea
- India
- Australia & New Zealand
- Indonesia
- Malaysia
- Philippines
- Singapore
- Thailand
- Vietnam
- Rest of APAC
Latin America
- Brazil
- Colombia
- Chile
- Argentina
- Costa Rica
- Rest of Latin America
Middle East & Africa
- Algeria
- Egypt
- Israel
- Kuwait
- Nigeria
- Saudi Arabia
- South Africa
- Turkey
- United Arab Emirates
- Rest of MEA
Key Players Analysis
The French multinational corporation Thales Group is renowned for its competence in security solutions. Thales Group provides end-to-end solutions that assure the confidentiality, integrity, and availability of data and devices, with a strong emphasis on IoT security. Their superior encryption technologies and communication protocols give them a competitive edge in the IoT security market.
Maven Systems Private Limited, based in Pune, India, specializes in the development of customized IoT solutions for a variety of industries. Their area of expertise is utilizing the potential of IoT to tackle complex problems in fields such as energy management, industrial automation, and smart cities. Maven Systems' innovative approach and commitment to excellence have earned them a prominent position in Iot Solutions Market.
SAP SE, a German multinational software corporation, provides businesses with intelligent solutions using its comprehensive IoT platform, SAP Leonardo. SAP SE enables businesses to obtain greater insight and make data-driven decisions by integrating sensor data, business data, and machine learning capabilities. Their comprehensive approach to IoT solutions positions them as a market leader.
Cloudera Inc., a market leader in big data analytics and machine learning, provides an IoT platform that enables organizations to exploit the enormous quantities of data generated by connected devices. Their platform, Cloudera Enterprise, allows for real-time data processing and analysis, which facilitates predictive maintenance, anomaly detection, and enhanced operational efficiency. Cloudera Inc.'s big data expertise distinguishes them in the IoT solutions market.
Accenture, a multinational professional services firm, assists organizations in capitalizing on the IoT's potential to promote digital transformation. Accenture enables businesses to achieve enhanced operational efficiency, improved customer experiences, and accelerated growth by deploying scalable and innovative solutions. Their comprehensive portfolio of IoT services positions them as a market leader.
Tego Inc., situated in the United States, specializes in offering asset management solutions enabled by Internet of Things technologies. Their expertise resides in the incorporation of high-memory, high-security, and high-performance processors into assets, allowing for real-time tracking, monitoring, and data collection. In industries such as healthcare, aerospace, and logistics, Tego Inc.'s innovative approach to asset management has garnered acclaim.
Top Key Players in Iot Solutions Market
- Thales Group
- Maven Systems Private Limited
- SAP SE
- Cloudera Inc.
- Accenture
- Tego Inc.
- Accton Technology Corporation International
- Symboticware Inc.
- ALE International
- Aspen Technology Inc.
- Zebra Technologies Corp.
- AT&T Intellectual Property
- Datamatics Global Services Limited
- Google LLC
- EX Capital
- Samsara Inc.
- Awair Inc.
- Tata Communications
- IBM
- Amazon Web Services Inc.
- Microsoft
- Oracle
- Huawei Technologies Co. Ltd.
- Cisco Systems Inc.
Recent Development
- In 2023, AWS IoT Greengrass 2 Enables seamless development and deployment of IoT solutions. Provides exceptional flexibility and efficiency for businesses.
- In 2023, Microsoft Azure IoT Hub Provides an integrated ecosystem for connecting, managing, and securing IoT devices. Promises to redefine the way organizations leverage the potential of IoT.
- In 2023, Google Cloud IoT Core Provides a comprehensive suite of tools for seamless device connectivity, centralized management, and robust security measures. Empowers organizations to harness the transformative potential of IoT.
Report Scope:
Report Features Description Market Value (2022) USD 238.2 Bn Forecast Revenue (2032) USD 1,236.1 Bn CAGR (2023-2032) 18.4% Base Year for Estimation 2022 Historic Period 2016-2022 Forecast Period 2023-2032 Report Coverage Revenue Forecast, Market Dynamics, COVID-19 Impact, Competitive Landscape, Recent Developments Segments Covered By Solution Type (Data Management, Network Management, Device Management, Smart Surveilance, Application Management)
By Deployment Mode (Cloud Based, On-Premises)
By End-Use Industry (Manufacturing, Automotive, Energy & Utilities, Retail, Healthcare, Other End-Use IndustryRegional Analysis North America – The US, Canada, & Mexico; Western Europe – Germany, France, The UK, Spain, Italy, Portugal, Ireland, Austria, Switzerland, Benelux, Nordic, & Rest of Western Europe; Eastern Europe – Russia, Poland, The Czech Republic, Greece, & Rest of Eastern Europe; APAC – China, Japan, South Korea, India, Australia & New Zealand, Indonesia, Malaysia, Philippines, Singapore, Thailand, Vietnam, & Rest of APAC; Latin America – Brazil, Colombia, Chile, Argentina, Costa Rica, & Rest of Latin America; Middle East & Africa – Algeria, Egypt, Israel, Kuwait, Nigeria, Saudi Arabia, South Africa, Turkey, United Arab Emirates, & Rest of MEA Competitive Landscape Thales Group, Maven Systems Private Limited, SAP SE, Cloudera Inc., Accenture, Tego Inc., Accton Technology Corporation International, Symboticware Inc., ALE International, Aspen Technology Inc., Zebra Technologies Corp., AT&T Intellectual Property, Datamatics Global Services Limited, Google LLC, EX Capital, Samsara Inc., Awair Inc., Tata Communications, IBM, Amazon Web Services Inc., Microsoft, Oracle, Huawei Technologies Co. Ltd., and Cisco Systems Inc. Customization Scope Customization for segments, region/country-level will be provided. Moreover, additional customization can be done based on the requirements. Purchase Options We have three licenses to opt for: Single User License, Multi-User License (Up to 5 Users), Corporate Use License (Unlimited User and Printable PDF) -
- 1. Executive Summary
- 1.1. Definition
- 1.2. Taxonomy
- 1.3. Research Scope
- 1.4. Key Analysis
- 1.5. Key Findings by Major Segments
- 1.6. Top strategies by Major Players
- 2. Global Iot Solutions Market Overview
- 2.1. Iot Solutions Market Dynamics
- 2.1.1. Drivers
- 2.1.2. Opportunities
- 2.1.3. Restraints
- 2.1.4. Challenges
- 2.2. Macro-economic Factors
- 2.3. Regulatory Framework
- 2.4. Market Investment Feasibility Index
- 2.5. PEST Analysis
- 2.6. PORTER’S Five Force Analysis
- 2.7. Drivers & Restraints Impact Analysis
- 2.8. Industry Chain Analysis
- 2.9. Cost Structure Analysis
- 2.10. Marketing Strategy
- 2.11. Russia-Ukraine War Impact Analysis
- 2.12. Opportunity Map Analysis
- 2.13. Market Competition Scenario Analysis
- 2.14. Product Life Cycle Analysis
- 2.15. Opportunity Orbits
- 2.16. Manufacturer Intensity Map
- 2.17. Major Companies sales by Value & Volume
- 2.1. Iot Solutions Market Dynamics
- 3. Global Iot Solutions Market Analysis, Opportunity and Forecast, 2016-2032
- 3.1. Global Iot Solutions Market Analysis, 2016-2021
- 3.2. Global Iot Solutions Market Opportunity and Forecast, 2023-2032
- 3.3. Global Iot Solutions Market Analysis, Opportunity and Forecast, By By Solution Type, 2016-2032
- 3.3.1. Global Iot Solutions Market Analysis by By Solution Type: Introduction
- 3.3.2. Market Size Absolute $ Opportunity Analysis and Forecast, By By Solution Type, 2016-2032
- 3.3.3. Data Management
- 3.3.4. Network Management
- 3.3.5. Device Management
- 3.3.6. Smart Surveilance
- 3.3.7. Application Management
- 3.4. Global Iot Solutions Market Analysis, Opportunity and Forecast, By By Deployment Mode, 2016-2032
- 3.4.1. Global Iot Solutions Market Analysis by By Deployment Mode: Introduction
- 3.4.2. Market Size Absolute $ Opportunity Analysis and Forecast, By By Deployment Mode, 2016-2032
- 3.4.3. Cloud Based
- 3.4.4. On-Premises
- 3.5. Global Iot Solutions Market Analysis, Opportunity and Forecast, By By End-Use Industry, 2016-2032
- 3.5.1. Global Iot Solutions Market Analysis by By End-Use Industry: Introduction
- 3.5.2. Market Size Absolute $ Opportunity Analysis and Forecast, By By End-Use Industry, 2016-2032
- 3.5.3. Manufacturing
- 3.5.4. Automotive
- 3.5.5. Energy & Utilities
- 3.5.6. Retail
- 3.5.7. Healthcare
- 3.5.8. Other End-Use Industry
- 4. North America Iot Solutions Market Analysis, Opportunity and Forecast, 2016-2032
- 4.1. North America Iot Solutions Market Analysis, 2016-2021
- 4.2. North America Iot Solutions Market Opportunity and Forecast, 2023-2032
- 4.3. North America Iot Solutions Market Analysis, Opportunity and Forecast, By By Solution Type, 2016-2032
- 4.3.1. North America Iot Solutions Market Analysis by By Solution Type: Introduction
- 4.3.2. Market Size Absolute $ Opportunity Analysis and Forecast, By By Solution Type, 2016-2032
- 4.3.3. Data Management
- 4.3.4. Network Management
- 4.3.5. Device Management
- 4.3.6. Smart Surveilance
- 4.3.7. Application Management
- 4.4. North America Iot Solutions Market Analysis, Opportunity and Forecast, By By Deployment Mode, 2016-2032
- 4.4.1. North America Iot Solutions Market Analysis by By Deployment Mode: Introduction
- 4.4.2. Market Size Absolute $ Opportunity Analysis and Forecast, By By Deployment Mode, 2016-2032
- 4.4.3. Cloud Based
- 4.4.4. On-Premises
- 4.5. North America Iot Solutions Market Analysis, Opportunity and Forecast, By By End-Use Industry, 2016-2032
- 4.5.1. North America Iot Solutions Market Analysis by By End-Use Industry: Introduction
- 4.5.2. Market Size Absolute $ Opportunity Analysis and Forecast, By By End-Use Industry, 2016-2032
- 4.5.3. Manufacturing
- 4.5.4. Automotive
- 4.5.5. Energy & Utilities
- 4.5.6. Retail
- 4.5.7. Healthcare
- 4.5.8. Other End-Use Industry
- 4.6. North America Iot Solutions Market Analysis, Opportunity and Forecast, By Country , 2016-2032
- 4.6.1. North America Iot Solutions Market Analysis by Country : Introduction
- 4.6.2. Market Size Absolute $ Opportunity Analysis and Forecast, Country , 2016-2032
- 4.6.2.1. The US
- 4.6.2.2. Canada
- 4.6.2.3. Mexico
- 5. Western Europe Iot Solutions Market Analysis, Opportunity and Forecast, 2016-2032
- 5.1. Western Europe Iot Solutions Market Analysis, 2016-2021
- 5.2. Western Europe Iot Solutions Market Opportunity and Forecast, 2023-2032
- 5.3. Western Europe Iot Solutions Market Analysis, Opportunity and Forecast, By By Solution Type, 2016-2032
- 5.3.1. Western Europe Iot Solutions Market Analysis by By Solution Type: Introduction
- 5.3.2. Market Size Absolute $ Opportunity Analysis and Forecast, By By Solution Type, 2016-2032
- 5.3.3. Data Management
- 5.3.4. Network Management
- 5.3.5. Device Management
- 5.3.6. Smart Surveilance
- 5.3.7. Application Management
- 5.4. Western Europe Iot Solutions Market Analysis, Opportunity and Forecast, By By Deployment Mode, 2016-2032
- 5.4.1. Western Europe Iot Solutions Market Analysis by By Deployment Mode: Introduction
- 5.4.2. Market Size Absolute $ Opportunity Analysis and Forecast, By By Deployment Mode, 2016-2032
- 5.4.3. Cloud Based
- 5.4.4. On-Premises
- 5.5. Western Europe Iot Solutions Market Analysis, Opportunity and Forecast, By By End-Use Industry, 2016-2032
- 5.5.1. Western Europe Iot Solutions Market Analysis by By End-Use Industry: Introduction
- 5.5.2. Market Size Absolute $ Opportunity Analysis and Forecast, By By End-Use Industry, 2016-2032
- 5.5.3. Manufacturing
- 5.5.4. Automotive
- 5.5.5. Energy & Utilities
- 5.5.6. Retail
- 5.5.7. Healthcare
- 5.5.8. Other End-Use Industry
- 5.6. Western Europe Iot Solutions Market Analysis, Opportunity and Forecast, By Country , 2016-2032
- 5.6.1. Western Europe Iot Solutions Market Analysis by Country : Introduction
- 5.6.2. Market Size Absolute $ Opportunity Analysis and Forecast, Country , 2016-2032
- 5.6.2.1. Germany
- 5.6.2.2. France
- 5.6.2.3. The UK
- 5.6.2.4. Spain
- 5.6.2.5. Italy
- 5.6.2.6. Portugal
- 5.6.2.7. Ireland
- 5.6.2.8. Austria
- 5.6.2.9. Switzerland
- 5.6.2.10. Benelux
- 5.6.2.11. Nordic
- 5.6.2.12. Rest of Western Europe
- 6. Eastern Europe Iot Solutions Market Analysis, Opportunity and Forecast, 2016-2032
- 6.1. Eastern Europe Iot Solutions Market Analysis, 2016-2021
- 6.2. Eastern Europe Iot Solutions Market Opportunity and Forecast, 2023-2032
- 6.3. Eastern Europe Iot Solutions Market Analysis, Opportunity and Forecast, By By Solution Type, 2016-2032
- 6.3.1. Eastern Europe Iot Solutions Market Analysis by By Solution Type: Introduction
- 6.3.2. Market Size Absolute $ Opportunity Analysis and Forecast, By By Solution Type, 2016-2032
- 6.3.3. Data Management
- 6.3.4. Network Management
- 6.3.5. Device Management
- 6.3.6. Smart Surveilance
- 6.3.7. Application Management
- 6.4. Eastern Europe Iot Solutions Market Analysis, Opportunity and Forecast, By By Deployment Mode, 2016-2032
- 6.4.1. Eastern Europe Iot Solutions Market Analysis by By Deployment Mode: Introduction
- 6.4.2. Market Size Absolute $ Opportunity Analysis and Forecast, By By Deployment Mode, 2016-2032
- 6.4.3. Cloud Based
- 6.4.4. On-Premises
- 6.5. Eastern Europe Iot Solutions Market Analysis, Opportunity and Forecast, By By End-Use Industry, 2016-2032
- 6.5.1. Eastern Europe Iot Solutions Market Analysis by By End-Use Industry: Introduction
- 6.5.2. Market Size Absolute $ Opportunity Analysis and Forecast, By By End-Use Industry, 2016-2032
- 6.5.3. Manufacturing
- 6.5.4. Automotive
- 6.5.5. Energy & Utilities
- 6.5.6. Retail
- 6.5.7. Healthcare
- 6.5.8. Other End-Use Industry
- 6.6. Eastern Europe Iot Solutions Market Analysis, Opportunity and Forecast, By Country , 2016-2032
- 6.6.1. Eastern Europe Iot Solutions Market Analysis by Country : Introduction
- 6.6.2. Market Size Absolute $ Opportunity Analysis and Forecast, Country , 2016-2032
- 6.6.2.1. Russia
- 6.6.2.2. Poland
- 6.6.2.3. The Czech Republic
- 6.6.2.4. Greece
- 6.6.2.5. Rest of Eastern Europe
- 7. APAC Iot Solutions Market Analysis, Opportunity and Forecast, 2016-2032
- 7.1. APAC Iot Solutions Market Analysis, 2016-2021
- 7.2. APAC Iot Solutions Market Opportunity and Forecast, 2023-2032
- 7.3. APAC Iot Solutions Market Analysis, Opportunity and Forecast, By By Solution Type, 2016-2032
- 7.3.1. APAC Iot Solutions Market Analysis by By Solution Type: Introduction
- 7.3.2. Market Size Absolute $ Opportunity Analysis and Forecast, By By Solution Type, 2016-2032
- 7.3.3. Data Management
- 7.3.4. Network Management
- 7.3.5. Device Management
- 7.3.6. Smart Surveilance
- 7.3.7. Application Management
- 7.4. APAC Iot Solutions Market Analysis, Opportunity and Forecast, By By Deployment Mode, 2016-2032
- 7.4.1. APAC Iot Solutions Market Analysis by By Deployment Mode: Introduction
- 7.4.2. Market Size Absolute $ Opportunity Analysis and Forecast, By By Deployment Mode, 2016-2032
- 7.4.3. Cloud Based
- 7.4.4. On-Premises
- 7.5. APAC Iot Solutions Market Analysis, Opportunity and Forecast, By By End-Use Industry, 2016-2032
- 7.5.1. APAC Iot Solutions Market Analysis by By End-Use Industry: Introduction
- 7.5.2. Market Size Absolute $ Opportunity Analysis and Forecast, By By End-Use Industry, 2016-2032
- 7.5.3. Manufacturing
- 7.5.4. Automotive
- 7.5.5. Energy & Utilities
- 7.5.6. Retail
- 7.5.7. Healthcare
- 7.5.8. Other End-Use Industry
- 7.6. APAC Iot Solutions Market Analysis, Opportunity and Forecast, By Country , 2016-2032
- 7.6.1. APAC Iot Solutions Market Analysis by Country : Introduction
- 7.6.2. Market Size Absolute $ Opportunity Analysis and Forecast, Country , 2016-2032
- 7.6.2.1. China
- 7.6.2.2. Japan
- 7.6.2.3. South Korea
- 7.6.2.4. India
- 7.6.2.5. Australia & New Zeland
- 7.6.2.6. Indonesia
- 7.6.2.7. Malaysia
- 7.6.2.8. Philippines
- 7.6.2.9. Singapore
- 7.6.2.10. Thailand
- 7.6.2.11. Vietnam
- 7.6.2.12. Rest of APAC
- 8. Latin America Iot Solutions Market Analysis, Opportunity and Forecast, 2016-2032
- 8.1. Latin America Iot Solutions Market Analysis, 2016-2021
- 8.2. Latin America Iot Solutions Market Opportunity and Forecast, 2023-2032
- 8.3. Latin America Iot Solutions Market Analysis, Opportunity and Forecast, By By Solution Type, 2016-2032
- 8.3.1. Latin America Iot Solutions Market Analysis by By Solution Type: Introduction
- 8.3.2. Market Size Absolute $ Opportunity Analysis and Forecast, By By Solution Type, 2016-2032
- 8.3.3. Data Management
- 8.3.4. Network Management
- 8.3.5. Device Management
- 8.3.6. Smart Surveilance
- 8.3.7. Application Management
- 8.4. Latin America Iot Solutions Market Analysis, Opportunity and Forecast, By By Deployment Mode, 2016-2032
- 8.4.1. Latin America Iot Solutions Market Analysis by By Deployment Mode: Introduction
- 8.4.2. Market Size Absolute $ Opportunity Analysis and Forecast, By By Deployment Mode, 2016-2032
- 8.4.3. Cloud Based
- 8.4.4. On-Premises
- 8.5. Latin America Iot Solutions Market Analysis, Opportunity and Forecast, By By End-Use Industry, 2016-2032
- 8.5.1. Latin America Iot Solutions Market Analysis by By End-Use Industry: Introduction
- 8.5.2. Market Size Absolute $ Opportunity Analysis and Forecast, By By End-Use Industry, 2016-2032
- 8.5.3. Manufacturing
- 8.5.4. Automotive
- 8.5.5. Energy & Utilities
- 8.5.6. Retail
- 8.5.7. Healthcare
- 8.5.8. Other End-Use Industry
- 8.6. Latin America Iot Solutions Market Analysis, Opportunity and Forecast, By Country , 2016-2032
- 8.6.1. Latin America Iot Solutions Market Analysis by Country : Introduction
- 8.6.2. Market Size Absolute $ Opportunity Analysis and Forecast, Country , 2016-2032
- 8.6.2.1. Brazil
- 8.6.2.2. Colombia
- 8.6.2.3. Chile
- 8.6.2.4. Argentina
- 8.6.2.5. Costa Rica
- 8.6.2.6. Rest of Latin America
- 9. Middle East & Africa Iot Solutions Market Analysis, Opportunity and Forecast, 2016-2032
- 9.1. Middle East & Africa Iot Solutions Market Analysis, 2016-2021
- 9.2. Middle East & Africa Iot Solutions Market Opportunity and Forecast, 2023-2032
- 9.3. Middle East & Africa Iot Solutions Market Analysis, Opportunity and Forecast, By By Solution Type, 2016-2032
- 9.3.1. Middle East & Africa Iot Solutions Market Analysis by By Solution Type: Introduction
- 9.3.2. Market Size Absolute $ Opportunity Analysis and Forecast, By By Solution Type, 2016-2032
- 9.3.3. Data Management
- 9.3.4. Network Management
- 9.3.5. Device Management
- 9.3.6. Smart Surveilance
- 9.3.7. Application Management
- 9.4. Middle East & Africa Iot Solutions Market Analysis, Opportunity and Forecast, By By Deployment Mode, 2016-2032
- 9.4.1. Middle East & Africa Iot Solutions Market Analysis by By Deployment Mode: Introduction
- 9.4.2. Market Size Absolute $ Opportunity Analysis and Forecast, By By Deployment Mode, 2016-2032
- 9.4.3. Cloud Based
- 9.4.4. On-Premises
- 9.5. Middle East & Africa Iot Solutions Market Analysis, Opportunity and Forecast, By By End-Use Industry, 2016-2032
- 9.5.1. Middle East & Africa Iot Solutions Market Analysis by By End-Use Industry: Introduction
- 9.5.2. Market Size Absolute $ Opportunity Analysis and Forecast, By By End-Use Industry, 2016-2032
- 9.5.3. Manufacturing
- 9.5.4. Automotive
- 9.5.5. Energy & Utilities
- 9.5.6. Retail
- 9.5.7. Healthcare
- 9.5.8. Other End-Use Industry
- 9.6. Middle East & Africa Iot Solutions Market Analysis, Opportunity and Forecast, By Country , 2016-2032
- 9.6.1. Middle East & Africa Iot Solutions Market Analysis by Country : Introduction
- 9.6.2. Market Size Absolute $ Opportunity Analysis and Forecast, Country , 2016-2032
- 9.6.2.1. Algeria
- 9.6.2.2. Egypt
- 9.6.2.3. Israel
- 9.6.2.4. Kuwait
- 9.6.2.5. Nigeria
- 9.6.2.6. Saudi Arabia
- 9.6.2.7. South Africa
- 9.6.2.8. Turkey
- 9.6.2.9. The UAE
- 9.6.2.10. Rest of MEA
- 10. Global Iot Solutions Market Analysis, Opportunity and Forecast, By Region , 2016-2032
- 10.1. Global Iot Solutions Market Analysis by Region : Introduction
- 10.2. Market Size Absolute $ Opportunity Analysis and Forecast, By Region , 2016-2032
- 10.2.1. North America
- 10.2.2. Western Europe
- 10.2.3. Eastern Europe
- 10.2.4. APAC
- 10.2.5. Latin America
- 10.2.6. Middle East & Africa
- 11. Global Iot Solutions Market Competitive Landscape, Market Share Analysis, and Company Profiles
- 11.1. Market Share Analysis
- 11.2. Company Profiles
- 11.3. Thales Group
- 11.3.1. Company Overview
- 11.3.2. Financial Highlights
- 11.3.3. Product Portfolio
- 11.3.4. SWOT Analysis
- 11.3.5. Key Strategies and Developments
- 11.4. Maven Systems Private Limited
- 11.4.1. Company Overview
- 11.4.2. Financial Highlights
- 11.4.3. Product Portfolio
- 11.4.4. SWOT Analysis
- 11.4.5. Key Strategies and Developments
- 11.5. SAP SE
- 11.5.1. Company Overview
- 11.5.2. Financial Highlights
- 11.5.3. Product Portfolio
- 11.5.4. SWOT Analysis
- 11.5.5. Key Strategies and Developments
- 11.6. Cloudera Inc.
- 11.6.1. Company Overview
- 11.6.2. Financial Highlights
- 11.6.3. Product Portfolio
- 11.6.4. SWOT Analysis
- 11.6.5. Key Strategies and Developments
- 11.7. Accenture
- 11.7.1. Company Overview
- 11.7.2. Financial Highlights
- 11.7.3. Product Portfolio
- 11.7.4. SWOT Analysis
- 11.7.5. Key Strategies and Developments
- 11.8. Tego Inc.
- 11.8.1. Company Overview
- 11.8.2. Financial Highlights
- 11.8.3. Product Portfolio
- 11.8.4. SWOT Analysis
- 11.8.5. Key Strategies and Developments
- 11.9. Accton Technology Corporation International
- 11.9.1. Company Overview
- 11.9.2. Financial Highlights
- 11.9.3. Product Portfolio
- 11.9.4. SWOT Analysis
- 11.9.5. Key Strategies and Developments
- 11.10. Symboticware Inc.
- 11.10.1. Company Overview
- 11.10.2. Financial Highlights
- 11.10.3. Product Portfolio
- 11.10.4. SWOT Analysis
- 11.10.5. Key Strategies and Developments
- 11.11. ALE International
- 11.11.1. Company Overview
- 11.11.2. Financial Highlights
- 11.11.3. Product Portfolio
- 11.11.4. SWOT Analysis
- 11.11.5. Key Strategies and Developments
- 11.12. Aspen Technology Inc.
- 11.12.1. Company Overview
- 11.12.2. Financial Highlights
- 11.12.3. Product Portfolio
- 11.12.4. SWOT Analysis
- 11.12.5. Key Strategies and Developments
- 11.13. Zebra Technologies Corp.
- 11.13.1. Company Overview
- 11.13.2. Financial Highlights
- 11.13.3. Product Portfolio
- 11.13.4. SWOT Analysis
- 11.13.5. Key Strategies and Developments
- 11.14. AT&T Intellectual Property
- 11.14.1. Company Overview
- 11.14.2. Financial Highlights
- 11.14.3. Product Portfolio
- 11.14.4. SWOT Analysis
- 11.14.5. Key Strategies and Developments
- 11.15. Datamatics Global Services Limited
- 11.15.1. Company Overview
- 11.15.2. Financial Highlights
- 11.15.3. Product Portfolio
- 11.15.4. SWOT Analysis
- 11.15.5. Key Strategies and Developments
- 11.16. Google LLC
- 11.16.1. Company Overview
- 11.16.2. Financial Highlights
- 11.16.3. Product Portfolio
- 11.16.4. SWOT Analysis
- 11.16.5. Key Strategies and Developments
- 11.17. EX Capital
- 11.17.1. Company Overview
- 11.17.2. Financial Highlights
- 11.17.3. Product Portfolio
- 11.17.4. SWOT Analysis
- 11.17.5. Key Strategies and Developments
- 11.18. Samsara Inc.
- 11.18.1. Company Overview
- 11.18.2. Financial Highlights
- 11.18.3. Product Portfolio
- 11.18.4. SWOT Analysis
- 11.18.5. Key Strategies and Developments
- 11.19. Awair Inc.
- 11.19.1. Company Overview
- 11.19.2. Financial Highlights
- 11.19.3. Product Portfolio
- 11.19.4. SWOT Analysis
- 11.19.5. Key Strategies and Developments
- 11.20. Tata Communications
- 11.20.1. Company Overview
- 11.20.2. Financial Highlights
- 11.20.3. Product Portfolio
- 11.20.4. SWOT Analysis
- 11.20.5. Key Strategies and Developments
- 11.21. IBM
- 11.21.1. Company Overview
- 11.21.2. Financial Highlights
- 11.21.3. Product Portfolio
- 11.21.4. SWOT Analysis
- 11.21.5. Key Strategies and Developments
- 11.22. Amazon Web Services Inc.
- 11.22.1. Company Overview
- 11.22.2. Financial Highlights
- 11.22.3. Product Portfolio
- 11.22.4. SWOT Analysis
- 11.22.5. Key Strategies and Developments
- 12. Assumptions and Acronyms
- 13. Research Methodology
- 14. Contact
- List of Figures
- Figure 1: Global Iot Solutions Market Revenue (US$ Mn) Market Share by By Solution Type in 2022
- Figure 2: Global Iot Solutions Market Attractiveness Analysis by By Solution Type, 2016-2032
- Figure 3: Global Iot Solutions Market Revenue (US$ Mn) Market Share by By Deployment Modein 2022
- Figure 4: Global Iot Solutions Market Attractiveness Analysis by By Deployment Mode, 2016-2032
- Figure 5: Global Iot Solutions Market Revenue (US$ Mn) Market Share by By End-Use Industryin 2022
- Figure 6: Global Iot Solutions Market Attractiveness Analysis by By End-Use Industry, 2016-2032
- Figure 7: Global Iot Solutions Market Revenue (US$ Mn) Market Share by Region in 2022
- Figure 8: Global Iot Solutions Market Attractiveness Analysis by Region, 2016-2032
- Figure 9: Global Iot Solutions Market Revenue (US$ Mn) (2016-2032)
- Figure 10: Global Iot Solutions Market Revenue (US$ Mn) Comparison by Region (2016-2032)
- Figure 11: Global Iot Solutions Market Revenue (US$ Mn) Comparison by By Solution Type (2016-2032)
- Figure 12: Global Iot Solutions Market Revenue (US$ Mn) Comparison by By Deployment Mode (2016-2032)
- Figure 13: Global Iot Solutions Market Revenue (US$ Mn) Comparison by By End-Use Industry (2016-2032)
- Figure 14: Global Iot Solutions Market Y-o-Y Growth Rate Comparison by Region (2016-2032)
- Figure 15: Global Iot Solutions Market Y-o-Y Growth Rate Comparison by By Solution Type (2016-2032)
- Figure 16: Global Iot Solutions Market Y-o-Y Growth Rate Comparison by By Deployment Mode (2016-2032)
- Figure 17: Global Iot Solutions Market Y-o-Y Growth Rate Comparison by By End-Use Industry (2016-2032)
- Figure 18: Global Iot Solutions Market Share Comparison by Region (2016-2032)
- Figure 19: Global Iot Solutions Market Share Comparison by By Solution Type (2016-2032)
- Figure 20: Global Iot Solutions Market Share Comparison by By Deployment Mode (2016-2032)
- Figure 21: Global Iot Solutions Market Share Comparison by By End-Use Industry (2016-2032)
- Figure 22: North America Iot Solutions Market Revenue (US$ Mn) Market Share by By Solution Typein 2022
- Figure 23: North America Iot Solutions Market Attractiveness Analysis by By Solution Type, 2016-2032
- Figure 24: North America Iot Solutions Market Revenue (US$ Mn) Market Share by By Deployment Modein 2022
- Figure 25: North America Iot Solutions Market Attractiveness Analysis by By Deployment Mode, 2016-2032
- Figure 26: North America Iot Solutions Market Revenue (US$ Mn) Market Share by By End-Use Industryin 2022
- Figure 27: North America Iot Solutions Market Attractiveness Analysis by By End-Use Industry, 2016-2032
- Figure 28: North America Iot Solutions Market Revenue (US$ Mn) Market Share by Country in 2022
- Figure 29: North America Iot Solutions Market Attractiveness Analysis by Country, 2016-2032
- Figure 30: North America Iot Solutions Market Revenue (US$ Mn) (2016-2032)
- Figure 31: North America Iot Solutions Market Revenue (US$ Mn) Comparison by Country (2016-2032)
- Figure 32: North America Iot Solutions Market Revenue (US$ Mn) Comparison by By Solution Type (2016-2032)
- Figure 33: North America Iot Solutions Market Revenue (US$ Mn) Comparison by By Deployment Mode (2016-2032)
- Figure 34: North America Iot Solutions Market Revenue (US$ Mn) Comparison by By End-Use Industry (2016-2032)
- Figure 35: North America Iot Solutions Market Y-o-Y Growth Rate Comparison by Country (2016-2032)
- Figure 36: North America Iot Solutions Market Y-o-Y Growth Rate Comparison by By Solution Type (2016-2032)
- Figure 37: North America Iot Solutions Market Y-o-Y Growth Rate Comparison by By Deployment Mode (2016-2032)
- Figure 38: North America Iot Solutions Market Y-o-Y Growth Rate Comparison by By End-Use Industry (2016-2032)
- Figure 39: North America Iot Solutions Market Share Comparison by Country (2016-2032)
- Figure 40: North America Iot Solutions Market Share Comparison by By Solution Type (2016-2032)
- Figure 41: North America Iot Solutions Market Share Comparison by By Deployment Mode (2016-2032)
- Figure 42: North America Iot Solutions Market Share Comparison by By End-Use Industry (2016-2032)
- Figure 43: Western Europe Iot Solutions Market Revenue (US$ Mn) Market Share by By Solution Typein 2022
- Figure 44: Western Europe Iot Solutions Market Attractiveness Analysis by By Solution Type, 2016-2032
- Figure 45: Western Europe Iot Solutions Market Revenue (US$ Mn) Market Share by By Deployment Modein 2022
- Figure 46: Western Europe Iot Solutions Market Attractiveness Analysis by By Deployment Mode, 2016-2032
- Figure 47: Western Europe Iot Solutions Market Revenue (US$ Mn) Market Share by By End-Use Industryin 2022
- Figure 48: Western Europe Iot Solutions Market Attractiveness Analysis by By End-Use Industry, 2016-2032
- Figure 49: Western Europe Iot Solutions Market Revenue (US$ Mn) Market Share by Country in 2022
- Figure 50: Western Europe Iot Solutions Market Attractiveness Analysis by Country, 2016-2032
- Figure 51: Western Europe Iot Solutions Market Revenue (US$ Mn) (2016-2032)
- Figure 52: Western Europe Iot Solutions Market Revenue (US$ Mn) Comparison by Country (2016-2032)
- Figure 53: Western Europe Iot Solutions Market Revenue (US$ Mn) Comparison by By Solution Type (2016-2032)
- Figure 54: Western Europe Iot Solutions Market Revenue (US$ Mn) Comparison by By Deployment Mode (2016-2032)
- Figure 55: Western Europe Iot Solutions Market Revenue (US$ Mn) Comparison by By End-Use Industry (2016-2032)
- Figure 56: Western Europe Iot Solutions Market Y-o-Y Growth Rate Comparison by Country (2016-2032)
- Figure 57: Western Europe Iot Solutions Market Y-o-Y Growth Rate Comparison by By Solution Type (2016-2032)
- Figure 58: Western Europe Iot Solutions Market Y-o-Y Growth Rate Comparison by By Deployment Mode (2016-2032)
- Figure 59: Western Europe Iot Solutions Market Y-o-Y Growth Rate Comparison by By End-Use Industry (2016-2032)
- Figure 60: Western Europe Iot Solutions Market Share Comparison by Country (2016-2032)
- Figure 61: Western Europe Iot Solutions Market Share Comparison by By Solution Type (2016-2032)
- Figure 62: Western Europe Iot Solutions Market Share Comparison by By Deployment Mode (2016-2032)
- Figure 63: Western Europe Iot Solutions Market Share Comparison by By End-Use Industry (2016-2032)
- Figure 64: Eastern Europe Iot Solutions Market Revenue (US$ Mn) Market Share by By Solution Typein 2022
- Figure 65: Eastern Europe Iot Solutions Market Attractiveness Analysis by By Solution Type, 2016-2032
- Figure 66: Eastern Europe Iot Solutions Market Revenue (US$ Mn) Market Share by By Deployment Modein 2022
- Figure 67: Eastern Europe Iot Solutions Market Attractiveness Analysis by By Deployment Mode, 2016-2032
- Figure 68: Eastern Europe Iot Solutions Market Revenue (US$ Mn) Market Share by By End-Use Industryin 2022
- Figure 69: Eastern Europe Iot Solutions Market Attractiveness Analysis by By End-Use Industry, 2016-2032
- Figure 70: Eastern Europe Iot Solutions Market Revenue (US$ Mn) Market Share by Country in 2022
- Figure 71: Eastern Europe Iot Solutions Market Attractiveness Analysis by Country, 2016-2032
- Figure 72: Eastern Europe Iot Solutions Market Revenue (US$ Mn) (2016-2032)
- Figure 73: Eastern Europe Iot Solutions Market Revenue (US$ Mn) Comparison by Country (2016-2032)
- Figure 74: Eastern Europe Iot Solutions Market Revenue (US$ Mn) Comparison by By Solution Type (2016-2032)
- Figure 75: Eastern Europe Iot Solutions Market Revenue (US$ Mn) Comparison by By Deployment Mode (2016-2032)
- Figure 76: Eastern Europe Iot Solutions Market Revenue (US$ Mn) Comparison by By End-Use Industry (2016-2032)
- Figure 77: Eastern Europe Iot Solutions Market Y-o-Y Growth Rate Comparison by Country (2016-2032)
- Figure 78: Eastern Europe Iot Solutions Market Y-o-Y Growth Rate Comparison by By Solution Type (2016-2032)
- Figure 79: Eastern Europe Iot Solutions Market Y-o-Y Growth Rate Comparison by By Deployment Mode (2016-2032)
- Figure 80: Eastern Europe Iot Solutions Market Y-o-Y Growth Rate Comparison by By End-Use Industry (2016-2032)
- Figure 81: Eastern Europe Iot Solutions Market Share Comparison by Country (2016-2032)
- Figure 82: Eastern Europe Iot Solutions Market Share Comparison by By Solution Type (2016-2032)
- Figure 83: Eastern Europe Iot Solutions Market Share Comparison by By Deployment Mode (2016-2032)
- Figure 84: Eastern Europe Iot Solutions Market Share Comparison by By End-Use Industry (2016-2032)
- Figure 85: APAC Iot Solutions Market Revenue (US$ Mn) Market Share by By Solution Typein 2022
- Figure 86: APAC Iot Solutions Market Attractiveness Analysis by By Solution Type, 2016-2032
- Figure 87: APAC Iot Solutions Market Revenue (US$ Mn) Market Share by By Deployment Modein 2022
- Figure 88: APAC Iot Solutions Market Attractiveness Analysis by By Deployment Mode, 2016-2032
- Figure 89: APAC Iot Solutions Market Revenue (US$ Mn) Market Share by By End-Use Industryin 2022
- Figure 90: APAC Iot Solutions Market Attractiveness Analysis by By End-Use Industry, 2016-2032
- Figure 91: APAC Iot Solutions Market Revenue (US$ Mn) Market Share by Country in 2022
- Figure 92: APAC Iot Solutions Market Attractiveness Analysis by Country, 2016-2032
- Figure 93: APAC Iot Solutions Market Revenue (US$ Mn) (2016-2032)
- Figure 94: APAC Iot Solutions Market Revenue (US$ Mn) Comparison by Country (2016-2032)
- Figure 95: APAC Iot Solutions Market Revenue (US$ Mn) Comparison by By Solution Type (2016-2032)
- Figure 96: APAC Iot Solutions Market Revenue (US$ Mn) Comparison by By Deployment Mode (2016-2032)
- Figure 97: APAC Iot Solutions Market Revenue (US$ Mn) Comparison by By End-Use Industry (2016-2032)
- Figure 98: APAC Iot Solutions Market Y-o-Y Growth Rate Comparison by Country (2016-2032)
- Figure 99: APAC Iot Solutions Market Y-o-Y Growth Rate Comparison by By Solution Type (2016-2032)
- Figure 100: APAC Iot Solutions Market Y-o-Y Growth Rate Comparison by By Deployment Mode (2016-2032)
- Figure 101: APAC Iot Solutions Market Y-o-Y Growth Rate Comparison by By End-Use Industry (2016-2032)
- Figure 102: APAC Iot Solutions Market Share Comparison by Country (2016-2032)
- Figure 103: APAC Iot Solutions Market Share Comparison by By Solution Type (2016-2032)
- Figure 104: APAC Iot Solutions Market Share Comparison by By Deployment Mode (2016-2032)
- Figure 105: APAC Iot Solutions Market Share Comparison by By End-Use Industry (2016-2032)
- Figure 106: Latin America Iot Solutions Market Revenue (US$ Mn) Market Share by By Solution Typein 2022
- Figure 107: Latin America Iot Solutions Market Attractiveness Analysis by By Solution Type, 2016-2032
- Figure 108: Latin America Iot Solutions Market Revenue (US$ Mn) Market Share by By Deployment Modein 2022
- Figure 109: Latin America Iot Solutions Market Attractiveness Analysis by By Deployment Mode, 2016-2032
- Figure 110: Latin America Iot Solutions Market Revenue (US$ Mn) Market Share by By End-Use Industryin 2022
- Figure 111: Latin America Iot Solutions Market Attractiveness Analysis by By End-Use Industry, 2016-2032
- Figure 112: Latin America Iot Solutions Market Revenue (US$ Mn) Market Share by Country in 2022
- Figure 113: Latin America Iot Solutions Market Attractiveness Analysis by Country, 2016-2032
- Figure 114: Latin America Iot Solutions Market Revenue (US$ Mn) (2016-2032)
- Figure 115: Latin America Iot Solutions Market Revenue (US$ Mn) Comparison by Country (2016-2032)
- Figure 116: Latin America Iot Solutions Market Revenue (US$ Mn) Comparison by By Solution Type (2016-2032)
- Figure 117: Latin America Iot Solutions Market Revenue (US$ Mn) Comparison by By Deployment Mode (2016-2032)
- Figure 118: Latin America Iot Solutions Market Revenue (US$ Mn) Comparison by By End-Use Industry (2016-2032)
- Figure 119: Latin America Iot Solutions Market Y-o-Y Growth Rate Comparison by Country (2016-2032)
- Figure 120: Latin America Iot Solutions Market Y-o-Y Growth Rate Comparison by By Solution Type (2016-2032)
- Figure 121: Latin America Iot Solutions Market Y-o-Y Growth Rate Comparison by By Deployment Mode (2016-2032)
- Figure 122: Latin America Iot Solutions Market Y-o-Y Growth Rate Comparison by By End-Use Industry (2016-2032)
- Figure 123: Latin America Iot Solutions Market Share Comparison by Country (2016-2032)
- Figure 124: Latin America Iot Solutions Market Share Comparison by By Solution Type (2016-2032)
- Figure 125: Latin America Iot Solutions Market Share Comparison by By Deployment Mode (2016-2032)
- Figure 126: Latin America Iot Solutions Market Share Comparison by By End-Use Industry (2016-2032)
- Figure 127: Middle East & Africa Iot Solutions Market Revenue (US$ Mn) Market Share by By Solution Typein 2022
- Figure 128: Middle East & Africa Iot Solutions Market Attractiveness Analysis by By Solution Type, 2016-2032
- Figure 129: Middle East & Africa Iot Solutions Market Revenue (US$ Mn) Market Share by By Deployment Modein 2022
- Figure 130: Middle East & Africa Iot Solutions Market Attractiveness Analysis by By Deployment Mode, 2016-2032
- Figure 131: Middle East & Africa Iot Solutions Market Revenue (US$ Mn) Market Share by By End-Use Industryin 2022
- Figure 132: Middle East & Africa Iot Solutions Market Attractiveness Analysis by By End-Use Industry, 2016-2032
- Figure 133: Middle East & Africa Iot Solutions Market Revenue (US$ Mn) Market Share by Country in 2022
- Figure 134: Middle East & Africa Iot Solutions Market Attractiveness Analysis by Country, 2016-2032
- Figure 135: Middle East & Africa Iot Solutions Market Revenue (US$ Mn) (2016-2032)
- Figure 136: Middle East & Africa Iot Solutions Market Revenue (US$ Mn) Comparison by Country (2016-2032)
- Figure 137: Middle East & Africa Iot Solutions Market Revenue (US$ Mn) Comparison by By Solution Type (2016-2032)
- Figure 138: Middle East & Africa Iot Solutions Market Revenue (US$ Mn) Comparison by By Deployment Mode (2016-2032)
- Figure 139: Middle East & Africa Iot Solutions Market Revenue (US$ Mn) Comparison by By End-Use Industry (2016-2032)
- Figure 140: Middle East & Africa Iot Solutions Market Y-o-Y Growth Rate Comparison by Country (2016-2032)
- Figure 141: Middle East & Africa Iot Solutions Market Y-o-Y Growth Rate Comparison by By Solution Type (2016-2032)
- Figure 142: Middle East & Africa Iot Solutions Market Y-o-Y Growth Rate Comparison by By Deployment Mode (2016-2032)
- Figure 143: Middle East & Africa Iot Solutions Market Y-o-Y Growth Rate Comparison by By End-Use Industry (2016-2032)
- Figure 144: Middle East & Africa Iot Solutions Market Share Comparison by Country (2016-2032)
- Figure 145: Middle East & Africa Iot Solutions Market Share Comparison by By Solution Type (2016-2032)
- Figure 146: Middle East & Africa Iot Solutions Market Share Comparison by By Deployment Mode (2016-2032)
- Figure 147: Middle East & Africa Iot Solutions Market Share Comparison by By End-Use Industry (2016-2032)
- List of Tables
- Table 1: Global Iot Solutions Market Comparison by By Solution Type (2016-2032)
- Table 2: Global Iot Solutions Market Comparison by By Deployment Mode (2016-2032)
- Table 3: Global Iot Solutions Market Comparison by By End-Use Industry (2016-2032)
- Table 4: Global Iot Solutions Market Revenue (US$ Mn) Comparison by Region (2016-2032)
- Table 5: Global Iot Solutions Market Revenue (US$ Mn) (2016-2032)
- Table 6: Global Iot Solutions Market Revenue (US$ Mn) Comparison by Region (2016-2032)
- Table 7: Global Iot Solutions Market Revenue (US$ Mn) Comparison by By Solution Type (2016-2032)
- Table 8: Global Iot Solutions Market Revenue (US$ Mn) Comparison by By Deployment Mode (2016-2032)
- Table 9: Global Iot Solutions Market Revenue (US$ Mn) Comparison by By End-Use Industry (2016-2032)
- Table 10: Global Iot Solutions Market Y-o-Y Growth Rate Comparison by Region (2016-2032)
- Table 11: Global Iot Solutions Market Y-o-Y Growth Rate Comparison by By Solution Type (2016-2032)
- Table 12: Global Iot Solutions Market Y-o-Y Growth Rate Comparison by By Deployment Mode (2016-2032)
- Table 13: Global Iot Solutions Market Y-o-Y Growth Rate Comparison by By End-Use Industry (2016-2032)
- Table 14: Global Iot Solutions Market Share Comparison by Region (2016-2032)
- Table 15: Global Iot Solutions Market Share Comparison by By Solution Type (2016-2032)
- Table 16: Global Iot Solutions Market Share Comparison by By Deployment Mode (2016-2032)
- Table 17: Global Iot Solutions Market Share Comparison by By End-Use Industry (2016-2032)
- Table 18: North America Iot Solutions Market Comparison by By Deployment Mode (2016-2032)
- Table 19: North America Iot Solutions Market Comparison by By End-Use Industry (2016-2032)
- Table 20: North America Iot Solutions Market Revenue (US$ Mn) Comparison by Country (2016-2032)
- Table 21: North America Iot Solutions Market Revenue (US$ Mn) (2016-2032)
- Table 22: North America Iot Solutions Market Revenue (US$ Mn) Comparison by Country (2016-2032)
- Table 23: North America Iot Solutions Market Revenue (US$ Mn) Comparison by By Solution Type (2016-2032)
- Table 24: North America Iot Solutions Market Revenue (US$ Mn) Comparison by By Deployment Mode (2016-2032)
- Table 25: North America Iot Solutions Market Revenue (US$ Mn) Comparison by By End-Use Industry (2016-2032)
- Table 26: North America Iot Solutions Market Y-o-Y Growth Rate Comparison by Country (2016-2032)
- Table 27: North America Iot Solutions Market Y-o-Y Growth Rate Comparison by By Solution Type (2016-2032)
- Table 28: North America Iot Solutions Market Y-o-Y Growth Rate Comparison by By Deployment Mode (2016-2032)
- Table 29: North America Iot Solutions Market Y-o-Y Growth Rate Comparison by By End-Use Industry (2016-2032)
- Table 30: North America Iot Solutions Market Share Comparison by Country (2016-2032)
- Table 31: North America Iot Solutions Market Share Comparison by By Solution Type (2016-2032)
- Table 32: North America Iot Solutions Market Share Comparison by By Deployment Mode (2016-2032)
- Table 33: North America Iot Solutions Market Share Comparison by By End-Use Industry (2016-2032)
- Table 34: Western Europe Iot Solutions Market Comparison by By Solution Type (2016-2032)
- Table 35: Western Europe Iot Solutions Market Comparison by By Deployment Mode (2016-2032)
- Table 36: Western Europe Iot Solutions Market Comparison by By End-Use Industry (2016-2032)
- Table 37: Western Europe Iot Solutions Market Revenue (US$ Mn) Comparison by Country (2016-2032)
- Table 38: Western Europe Iot Solutions Market Revenue (US$ Mn) (2016-2032)
- Table 39: Western Europe Iot Solutions Market Revenue (US$ Mn) Comparison by Country (2016-2032)
- Table 40: Western Europe Iot Solutions Market Revenue (US$ Mn) Comparison by By Solution Type (2016-2032)
- Table 41: Western Europe Iot Solutions Market Revenue (US$ Mn) Comparison by By Deployment Mode (2016-2032)
- Table 42: Western Europe Iot Solutions Market Revenue (US$ Mn) Comparison by By End-Use Industry (2016-2032)
- Table 43: Western Europe Iot Solutions Market Y-o-Y Growth Rate Comparison by Country (2016-2032)
- Table 44: Western Europe Iot Solutions Market Y-o-Y Growth Rate Comparison by By Solution Type (2016-2032)
- Table 45: Western Europe Iot Solutions Market Y-o-Y Growth Rate Comparison by By Deployment Mode (2016-2032)
- Table 46: Western Europe Iot Solutions Market Y-o-Y Growth Rate Comparison by By End-Use Industry (2016-2032)
- Table 47: Western Europe Iot Solutions Market Share Comparison by Country (2016-2032)
- Table 48: Western Europe Iot Solutions Market Share Comparison by By Solution Type (2016-2032)
- Table 49: Western Europe Iot Solutions Market Share Comparison by By Deployment Mode (2016-2032)
- Table 50: Western Europe Iot Solutions Market Share Comparison by By End-Use Industry (2016-2032)
- Table 51: Eastern Europe Iot Solutions Market Comparison by By Solution Type (2016-2032)
- Table 52: Eastern Europe Iot Solutions Market Comparison by By Deployment Mode (2016-2032)
- Table 53: Eastern Europe Iot Solutions Market Comparison by By End-Use Industry (2016-2032)
- Table 54: Eastern Europe Iot Solutions Market Revenue (US$ Mn) Comparison by Country (2016-2032)
- Table 55: Eastern Europe Iot Solutions Market Revenue (US$ Mn) (2016-2032)
- Table 56: Eastern Europe Iot Solutions Market Revenue (US$ Mn) Comparison by Country (2016-2032)
- Table 57: Eastern Europe Iot Solutions Market Revenue (US$ Mn) Comparison by By Solution Type (2016-2032)
- Table 58: Eastern Europe Iot Solutions Market Revenue (US$ Mn) Comparison by By Deployment Mode (2016-2032)
- Table 59: Eastern Europe Iot Solutions Market Revenue (US$ Mn) Comparison by By End-Use Industry (2016-2032)
- Table 60: Eastern Europe Iot Solutions Market Y-o-Y Growth Rate Comparison by Country (2016-2032)
- Table 61: Eastern Europe Iot Solutions Market Y-o-Y Growth Rate Comparison by By Solution Type (2016-2032)
- Table 62: Eastern Europe Iot Solutions Market Y-o-Y Growth Rate Comparison by By Deployment Mode (2016-2032)
- Table 63: Eastern Europe Iot Solutions Market Y-o-Y Growth Rate Comparison by By End-Use Industry (2016-2032)
- Table 64: Eastern Europe Iot Solutions Market Share Comparison by Country (2016-2032)
- Table 65: Eastern Europe Iot Solutions Market Share Comparison by By Solution Type (2016-2032)
- Table 66: Eastern Europe Iot Solutions Market Share Comparison by By Deployment Mode (2016-2032)
- Table 67: Eastern Europe Iot Solutions Market Share Comparison by By End-Use Industry (2016-2032)
- Table 68: APAC Iot Solutions Market Comparison by By Solution Type (2016-2032)
- Table 69: APAC Iot Solutions Market Comparison by By Deployment Mode (2016-2032)
- Table 70: APAC Iot Solutions Market Comparison by By End-Use Industry (2016-2032)
- Table 71: APAC Iot Solutions Market Revenue (US$ Mn) Comparison by Country (2016-2032)
- Table 72: APAC Iot Solutions Market Revenue (US$ Mn) (2016-2032)
- Table 73: APAC Iot Solutions Market Revenue (US$ Mn) Comparison by Country (2016-2032)
- Table 74: APAC Iot Solutions Market Revenue (US$ Mn) Comparison by By Solution Type (2016-2032)
- Table 75: APAC Iot Solutions Market Revenue (US$ Mn) Comparison by By Deployment Mode (2016-2032)
- Table 76: APAC Iot Solutions Market Revenue (US$ Mn) Comparison by By End-Use Industry (2016-2032)
- Table 77: APAC Iot Solutions Market Y-o-Y Growth Rate Comparison by Country (2016-2032)
- Table 78: APAC Iot Solutions Market Y-o-Y Growth Rate Comparison by By Solution Type (2016-2032)
- Table 79: APAC Iot Solutions Market Y-o-Y Growth Rate Comparison by By Deployment Mode (2016-2032)
- Table 80: APAC Iot Solutions Market Y-o-Y Growth Rate Comparison by By End-Use Industry (2016-2032)
- Table 81: APAC Iot Solutions Market Share Comparison by Country (2016-2032)
- Table 82: APAC Iot Solutions Market Share Comparison by By Solution Type (2016-2032)
- Table 83: APAC Iot Solutions Market Share Comparison by By Deployment Mode (2016-2032)
- Table 84: APAC Iot Solutions Market Share Comparison by By End-Use Industry (2016-2032)
- Table 85: Latin America Iot Solutions Market Comparison by By Solution Type (2016-2032)
- Table 86: Latin America Iot Solutions Market Comparison by By Deployment Mode (2016-2032)
- Table 87: Latin America Iot Solutions Market Comparison by By End-Use Industry (2016-2032)
- Table 88: Latin America Iot Solutions Market Revenue (US$ Mn) Comparison by Country (2016-2032)
- Table 89: Latin America Iot Solutions Market Revenue (US$ Mn) (2016-2032)
- Table 90: Latin America Iot Solutions Market Revenue (US$ Mn) Comparison by Country (2016-2032)
- Table 91: Latin America Iot Solutions Market Revenue (US$ Mn) Comparison by By Solution Type (2016-2032)
- Table 92: Latin America Iot Solutions Market Revenue (US$ Mn) Comparison by By Deployment Mode (2016-2032)
- Table 93: Latin America Iot Solutions Market Revenue (US$ Mn) Comparison by By End-Use Industry (2016-2032)
- Table 94: Latin America Iot Solutions Market Y-o-Y Growth Rate Comparison by Country (2016-2032)
- Table 95: Latin America Iot Solutions Market Y-o-Y Growth Rate Comparison by By Solution Type (2016-2032)
- Table 96: Latin America Iot Solutions Market Y-o-Y Growth Rate Comparison by By Deployment Mode (2016-2032)
- Table 97: Latin America Iot Solutions Market Y-o-Y Growth Rate Comparison by By End-Use Industry (2016-2032)
- Table 98: Latin America Iot Solutions Market Share Comparison by Country (2016-2032)
- Table 99: Latin America Iot Solutions Market Share Comparison by By Solution Type (2016-2032)
- Table 100: Latin America Iot Solutions Market Share Comparison by By Deployment Mode (2016-2032)
- Table 101: Latin America Iot Solutions Market Share Comparison by By End-Use Industry (2016-2032)
- Table 102: Middle East & Africa Iot Solutions Market Comparison by By Solution Type (2016-2032)
- Table 103: Middle East & Africa Iot Solutions Market Comparison by By Deployment Mode (2016-2032)
- Table 104: Middle East & Africa Iot Solutions Market Comparison by By End-Use Industry (2016-2032)
- Table 105: Middle East & Africa Iot Solutions Market Revenue (US$ Mn) Comparison by Country (2016-2032)
- Table 106: Middle East & Africa Iot Solutions Market Revenue (US$ Mn) (2016-2032)
- Table 107: Middle East & Africa Iot Solutions Market Revenue (US$ Mn) Comparison by Country (2016-2032)
- Table 108: Middle East & Africa Iot Solutions Market Revenue (US$ Mn) Comparison by By Solution Type (2016-2032)
- Table 109: Middle East & Africa Iot Solutions Market Revenue (US$ Mn) Comparison by By Deployment Mode (2016-2032)
- Table 110: Middle East & Africa Iot Solutions Market Revenue (US$ Mn) Comparison by By End-Use Industry (2016-2032)
- Table 111: Middle East & Africa Iot Solutions Market Y-o-Y Growth Rate Comparison by Country (2016-2032)
- Table 112: Middle East & Africa Iot Solutions Market Y-o-Y Growth Rate Comparison by By Solution Type (2016-2032)
- Table 113: Middle East & Africa Iot Solutions Market Y-o-Y Growth Rate Comparison by By Deployment Mode (2016-2032)
- Table 114: Middle East & Africa Iot Solutions Market Y-o-Y Growth Rate Comparison by By End-Use Industry (2016-2032)
- Table 115: Middle East & Africa Iot Solutions Market Share Comparison by Country (2016-2032)
- Table 116: Middle East & Africa Iot Solutions Market Share Comparison by By Solution Type (2016-2032)
- Table 117: Middle East & Africa Iot Solutions Market Share Comparison by By Deployment Mode (2016-2032)
- Table 118: Middle East & Africa Iot Solutions Market Share Comparison by By End-Use Industry (2016-2032)
- 1. Executive Summary
-
- Thales Group
- Maven Systems Private Limited
- SAP SE
- Cloudera Inc.
- Accenture
- Tego Inc.
- Accton Technology Corporation International
- Symboticware Inc.
- ALE International
- Aspen Technology Inc.
- Zebra Technologies Corp.
- AT&T Intellectual Property
- Datamatics Global Services Limited
- Google LLC
- EX Capital
- Samsara Inc.
- Awair Inc.
- Tata Communications
- IBM
- Amazon Web Services Inc.
- Microsoft
- Oracle
- Huawei Technologies Co. Ltd.
- Cisco Systems Inc.
Our Clients


View Our Licence Options
