
IoT in Smart Cities Market By Offering (Solutions, Services), By Application (Smart Transportation , Smart Building, Smart Utilities, Smart Citizen Services, Smart Healthcare, Public Safety), By Region And Companies - Industry Segment Outlook, Market Assessment, Competition Scenario, Trends, And Forecast 2024-2033
-
51130
-
Sept 2024
-
270
-


-
This report was compiled by Vishwa Gaul Vishwa is an experienced market research and consulting professional with over 8 years of expertise in the ICT industry, contributing to over 700 reports across telecommunications, software, hardware, and digital solutions. Correspondence Team Lead- ICT Linkedin | Detailed Market research Methodology Our methodology involves a mix of primary research, including interviews with leading mental health experts, and secondary research from reputable medical journals and databases. View Detailed Methodology Page
-
Quick Navigation
Report Overview
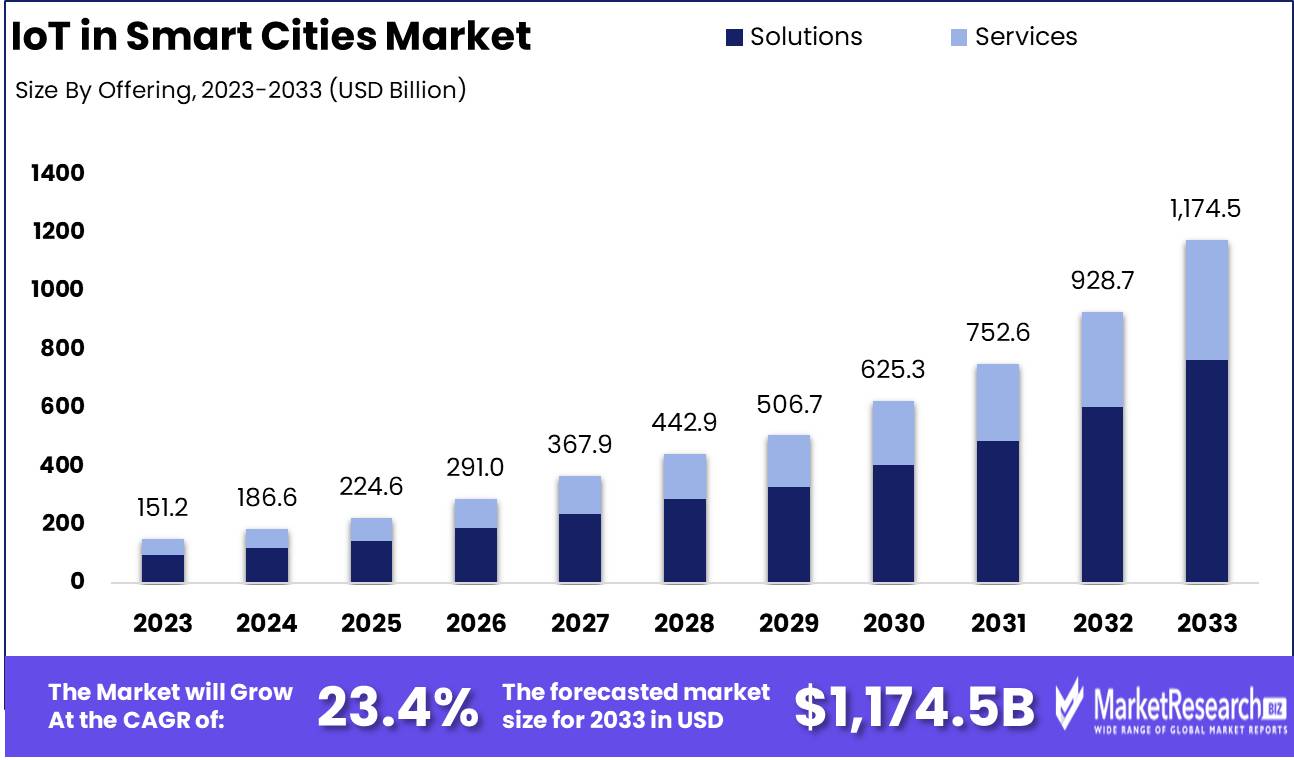
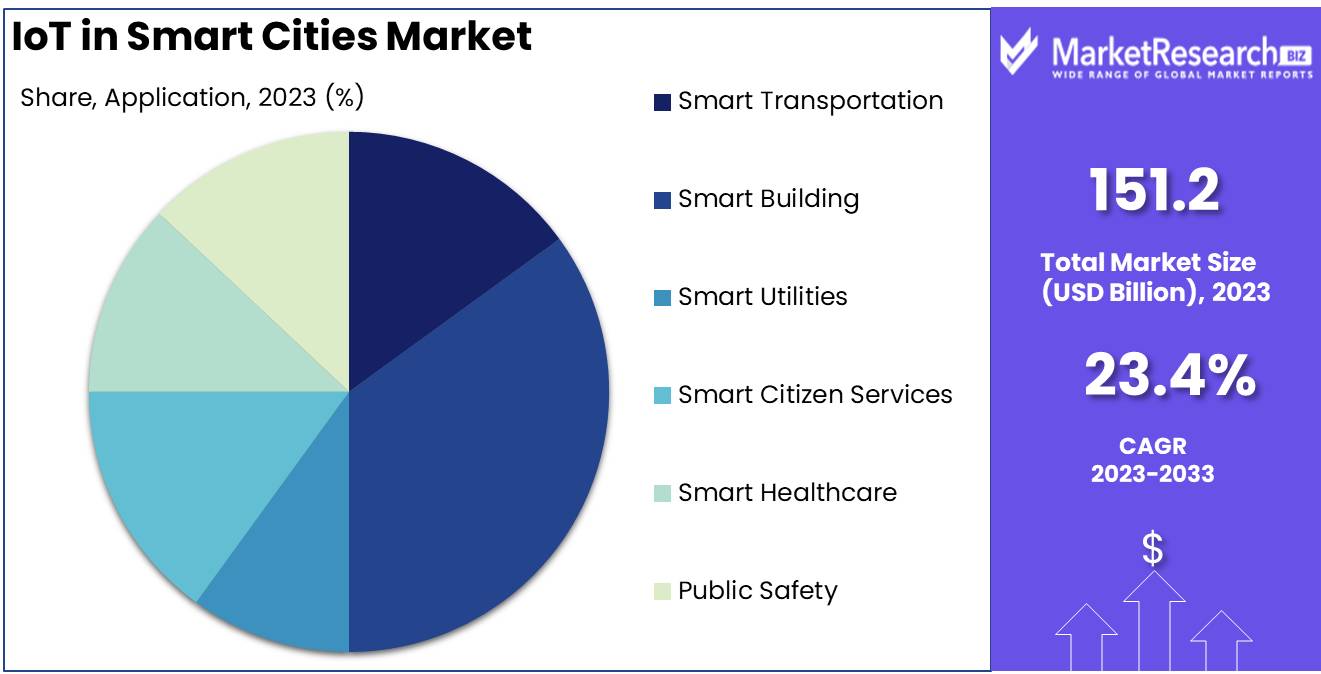
The Global IoT in Smart Cities Market was valued at USD 151.2 Billion in 2023. It is expected to reach USD 1,174.5 Billion by 2033, with a Compound annual growth rate (CAGR) of 23.4% during the forecast period from 2024 to 2033.
The IoT in Smart Cities market focuses on the integration of Internet of Things (IoT) technologies within urban environments to enhance infrastructure, improve public services, and optimize city management. By leveraging connected devices, sensors, and data analytics, cities can achieve smarter energy distribution, traffic management, waste management, and public safety. This market is driven by the growing need for sustainable urban development, increased efficiency, and enhanced quality of life for residents. Key players include technology firms, infrastructure providers, and governments, all working to create intelligent ecosystems that drive economic growth and respond to the challenges of rapid urbanization.
The IoT in Smart Cities market is undergoing rapid transformation, driven by increased urbanization and the need for sustainable, efficient infrastructure management. As cities grapple with the challenges of population growth, climate change, and resource constraints, IoT technologies are playing a pivotal role in enhancing urban services. IoT enables real-time monitoring and management of critical infrastructure, from traffic systems and energy grids to public safety and environmental monitoring, creating smarter, more resilient cities. Companies are capitalizing on this trend by expanding their smart city portfolios, offering solutions that integrate IoT with AI, machine learning, and cloud-based analytics to optimize city operations.
Recent developments highlight the growing investment in smart city technologies. For instance, AT&T’s expansion of its smart city program to 100 U.S. cities, supported by a $28 million investment, showcases the rising demand for IoT-driven infrastructure monitoring and sustainability initiatives. Tech Mahindra's partnership with TANESCO in Tanzania illustrates the potential for IoT in power grid management, while Siemens' acquisition of Wattsense strengthens its capabilities in smart building management. Additionally, the deployment of 250 million smart meters in India and Cisco's strategic acquisitions reflect the global momentum toward IoT-enabled urban infrastructure.
These initiatives underscore a critical shift towards smart infrastructure and intelligent transportation systems, which leverage IoT to enhance mobility, reduce energy consumption, and improve urban living standards. Looking ahead, the integration of IoT in urban environments will continue to drive innovation, offering new avenues for public-private collaboration and the development of scalable, sustainable smart city ecosystems.
Key Takeaways
- Market Growth: The IoT in Smart Cities market size is projected to grow from USD 151.2 billion in 2023 to USD 1,174.5 billion by 2033, with a robust CAGR of 23.4% over the forecast period.
- By Offering: The Solutions segment dominated the IoT in Smart Cities market with over 65% share in 2023, driven by the demand for integrated urban management systems.
- By Application: Smart Buildings held over 35% market share in 2023, propelled by investments in energy-efficient infrastructure and IoT-enabled building management systems.
- Restraining Factor: Data security and privacy concerns remain a significant challenge, impeding widespread IoT adoption in smart cities.
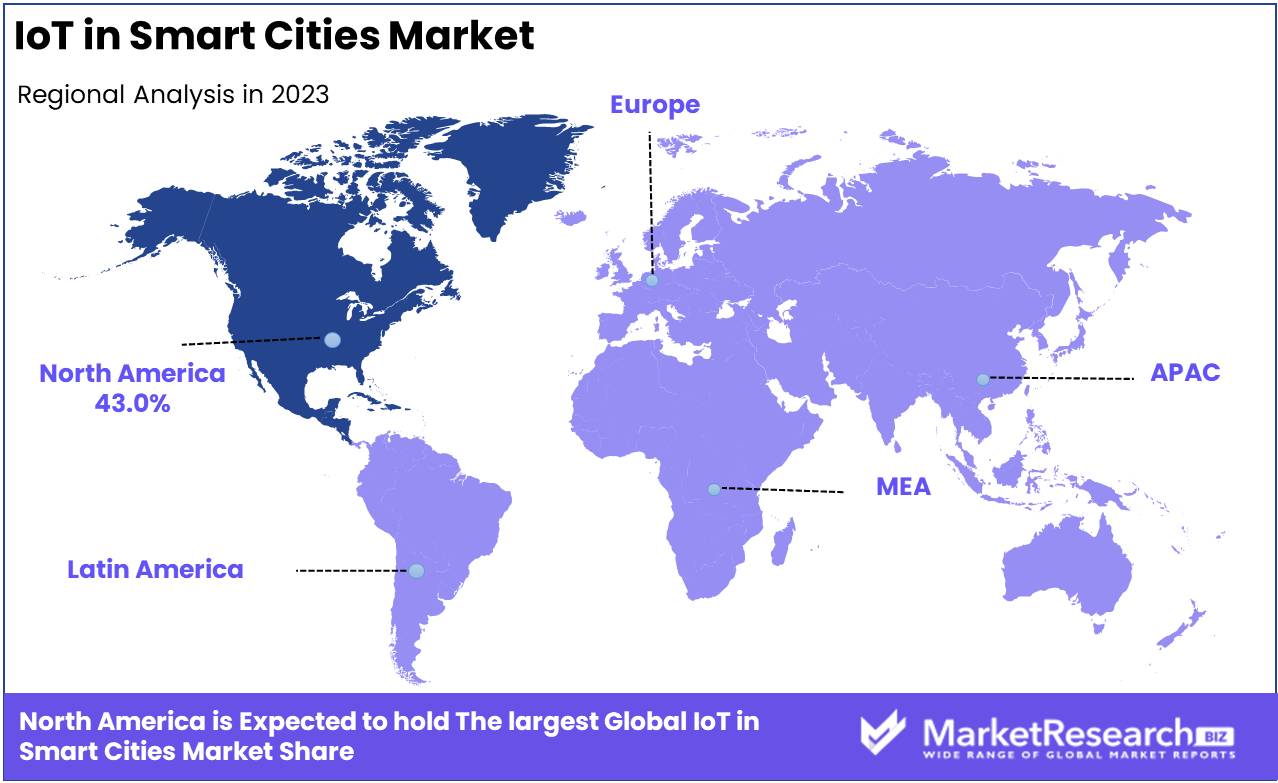
- Regional Growth: North America's 43% market share is driven by government initiatives and strong investment in IoT infrastructure, positioning it as the leader in smart city development.
- Growth Opportunity: The rapid adoption of 5G and AI-driven IoT technologies in smart city infrastructure offers significant growth potential, especially in real-time data management and intelligent mobility solutions.
Driving factors
Real-Time Data Collection Drives Smarter, More Efficient City Planning
The deployment of IoT devices, including sensors and cameras, across urban environments has significantly accelerated the growth of smart cities. These devices collect real-time data on traffic flow, energy consumption, air quality, and waste management, offering city planners critical insights to optimize operations. For instance, in Barcelona, IoT-driven systems have helped reduce water consumption by 25% and energy usage by 30% by monitoring environmental conditions in real-time.
This real-time data collection enables predictive analytics, allowing cities to preemptively address issues like power outages or waste overflow, significantly improving urban efficiency. By integrating data from multiple sources, cities can allocate resources dynamically, reduce operational costs, and improve citizens’ quality of life. Additionally, this constant stream of information feeds back into broader urban planning efforts, helping authorities design more sustainable and resilient infrastructures.
The interplay between real-time data collection and emerging AI-powered analytics tools is particularly noteworthy. Cities can not only respond in real time but also make data-driven decisions that support long-term growth, enhancing the overall scalability of smart city initiatives. As more cities adopt IoT infrastructure, the demand for integrated platforms to manage and analyze these massive data sets is likely to grow, further expanding the market.
Intelligent Transportation Systems (ITS) Improve Urban Mobility and Reduce Congestion
The implementation of IoT in intelligent transportation systems (ITS) represents one of the most transformative applications for smart cities. By providing real-time data on traffic conditions, public transport availability, and commuter behavior, ITS allows city authorities to optimize traffic management strategies. For example, cities like Singapore and Los Angeles have employed IoT-enabled ITS to reduce congestion by over 15% through adaptive traffic signals and smart routing algorithms.
These systems also contribute to the efficiency of public transport networks, helping reduce wait times and improve service reliability. In turn, they promote the use of public transport, leading to a reduction in private vehicle usage and emissions a crucial factor in meeting environmental targets.
The real-time integration of multiple IoT-enabled components, such as autonomous vehicles, smart traffic lights, and predictive maintenance systems, creates a seamless transportation network that is not only efficient but also adaptable to the dynamic needs of urban populations. This interconnectivity drives demand for IoT solutions across the transportation sector, positioning ITS as a key pillar of smart city growth. As urbanization increases and the focus on sustainable mobility grows, investments in ITS are expected to rise, directly fueling market expansion.
Restraining Factors
Data Security and Privacy Concerns: A Critical Barrier to Trust and Adoption
The proliferation of IoT devices in smart cities raises significant data security and privacy concerns that directly impact market growth. Smart city initiatives rely on the continuous flow of vast amounts of data, from traffic patterns and energy consumption to public safety and healthcare information. However, the interconnectivity of IoT devices creates a larger attack surface for cyber threats, increasing the risk of data breaches, hacking, and unauthorized access to sensitive information. According to research, cyberattacks targeting smart city infrastructure and IoT networks are expected to rise by 50% annually by 2025, underscoring the importance of robust security protocols.
Without the implementation of strong cybersecurity measures and compliance with stringent data protection laws, such as the EU's General Data Protection Regulation (GDPR) or the California Consumer Privacy Act (CCPA), citizens are likely to resist the widespread adoption of IoT technologies. Public trust is a crucial enabler for the success of smart cities, and any perceived or actual threat to data privacy could slow the deployment of new projects or limit their scale. Consequently, smart city developers and IoT vendors must integrate end-to-end encryption, data anonymization, and secure authentication mechanisms to minimize risks and build consumer confidence.
Legislative and Regulatory Challenges: A Complex Roadblock to Smart City Innovation
The regulatory environment surrounding smart cities presents another substantial obstacle to market growth. The deployment of IoT technologies within urban environments demands the navigation of a complex web of local, national, and international regulations. Policymakers face the challenge of crafting legislation that fosters innovation while addressing concerns around data privacy, cybersecurity, and public safety. According to a 2023 report, approximately 70% of cities have encountered regulatory hurdles that delayed smart city projects, highlighting the pervasiveness of this issue.
Smart cities must adhere to a range of laws that govern everything from data ownership to the deployment of 5G networks, which serve as the backbone of IoT infrastructure. Inconsistent regulations across regions can exacerbate these challenges, leading to delays in project approvals and cross-border collaboration. For example, a smart city initiative in the U.S. may face different compliance requirements than a similar project in the European Union, creating bottlenecks for international IoT vendors.
By Offering Analysis
Solutions Segment Dominated the IoT in Smart Cities Market in 2023, Holding Over 65% Largest Market Share
In 2023, Solutions held a dominant market position in the 'By Offering' segment of the IoT in Smart Cities Market, capturing more than a 65% share. This dominance can be attributed to the growing demand for integrated and scalable IoT solutions that support urban infrastructure, enhance public services, and streamline city operations. Smart city initiatives across major urban centers have increasingly focused on leveraging IoT solutions to optimize utilities, transportation systems, waste management, and energy consumption, further driving the adoption of these solutions.
Solutions within this segment encompass a broad range of technologies such as smart sensors, data analytics platforms, and advanced connectivity systems, all aimed at addressing the complexities of urban management. The ability of IoT solutions to provide real-time data, predictive analytics, and automation has been pivotal in helping city planners and government agencies make informed decisions, improve resource efficiency, and reduce operational costs.
Conversely, Services accounted for the remaining market share, reflecting steady growth driven by the increasing need for implementation, integration, and maintenance support for IoT systems. Services are critical for ensuring that IoT solutions are effectively deployed and optimized over time, particularly as cities scale their digital infrastructure. With IoT becoming an integral part of smart city ecosystems, demand for consulting, system integration, and managed services is expected to rise, offering ongoing opportunities for service providers to contribute to long-term project success.
By Application Analysis
Smart Building Segment Dominates IoT in Smart Cities Market with Over 35% Market Share in 2023
In 2023, Smart Building held a dominant market position in the "By Application" segment of the IoT in Smart Cities market, capturing more than a 35% share. This significant share is driven by growing investments in energy-efficient infrastructure, demand for intelligent building management systems, and the integration of IoT technologies to optimize energy use, security, and facility management. Smart buildings are becoming critical to reducing operational costs and enhancing the sustainability profile of urban environments, further strengthening their market position.
The Smart Transportation segment also represented a significant portion of the market, propelled by the increasing adoption of IoT-enabled traffic management systems, connected vehicle technologies, and public transport optimization solutions. The integration of IoT solutions in transportation enhances mobility, reduces congestion, and improves safety—key goals for the expansion of smart city infrastructure.
Smart Utilities followed closely, as IoT applications in utilities, such as smart grids, water management systems, and waste management, continue to gain traction. The demand for more sustainable and efficient resource utilization in urban settings has driven the adoption of IoT to optimize utilities’ operations, reduce waste, and monitor consumption patterns in real time.
Smart Citizen Services, including e-governance platforms and IoT-powered public services like waste management, parking, and lighting, are also playing an increasingly important role. These solutions aim to improve quality of life by enhancing service delivery and providing real-time access to city services.
Smart Healthcare is emerging as a pivotal application within the smart cities framework. IoT-powered health monitoring systems, telemedicine platforms, and smart hospital infrastructure are helping to bridge gaps in healthcare delivery, especially in densely populated urban areas. The ability to manage healthcare resources efficiently and provide remote care services makes IoT an essential component of future urban healthcare strategies.
Lastly, Public Safety remains a critical focus area for IoT in smart cities. IoT applications in surveillance systems, emergency response networks, and disaster management tools are driving the adoption of smart technologies in this segment. Real-time data collection and analysis help authorities improve response times, prevent crime, and ensure the safety of urban residents.
Key Market Segments
By Offering
- Solutions
- Services
By Application
- Smart Transportation
- Smart Building
- Smart Utilities
- Smart Citizen Services
- Smart Healthcare
- Public Safety
Growth Opportunity
Rising Adoption of Connected Technologies
The integration of IoT, AI, cloud computing, and data analytics is transforming urban environments into smarter, more efficient ecosystems. These technologies enable real-time monitoring, predictive analytics, and seamless connectivity, making cities more responsive to the needs of their citizens. The advent of 5G and Narrowband IoT (NB-IoT) is expected to further accelerate this growth by enhancing communication between devices and improving the efficiency of smart city applications. For example, the integration of AI-driven traffic management systems and IoT-enabled public safety solutions are likely to see widespread adoption, improving city governance and operational efficiency.
Increase in Smart City Initiatives Worldwide
Governments globally are increasingly investing in smart city projects, recognizing the potential of IoT to address urban challenges such as traffic congestion, energy consumption, and public safety. India’s Smart Cities Mission, launched with a $7.51 billion investment in 2016, exemplifies the global push toward modernizing urban infrastructure. Similarly, the U.S. government’s $165 million investment in smart city technologies underscores the importance of these initiatives in driving market growth. These investments, coupled with ongoing efforts to enhance legacy infrastructure, will likely propel the global IoT in smart cities market forward in 2024.
Latest Trends
5G Connectivity
The rollout of 5G technology is a transformative force in the development of smart cities, providing faster data transmission speeds and significantly lower latency. This enhanced connectivity supports a vast network of IoT devices, facilitating real-time data sharing between sensors, vehicles, and infrastructure. By improving the performance of critical applications such as traffic management, public safety systems, and energy distribution, 5G is enabling smarter decision-making and more responsive city services. For example, cities using AI-powered traffic monitoring systems can adjust traffic signals dynamically to reduce congestion and improve fuel efficiency, all made possible by the seamless integration of IoT and 5G.
Intelligent Mobility
Smart cities are increasingly embracing intelligent mobility solutions, with a focus on connected and autonomous vehicles (CAVs). IoT technologies allow CAVs to gather and share real-time data, improving traffic flow, reducing congestion, and enhancing road safety. By utilizing IoT-based communication between vehicles and infrastructure, smart cities are better equipped to manage urban mobility challenges. For instance, autonomous shuttles that communicate with traffic systems can minimize delays and ensure safer, more efficient transportation. This trend is expected to accelerate in 2024 as cities prioritize reducing carbon emissions and enhancing transportation systems.
Regional Analysis
North America Leads the IoT in Smart Cities Market with 43.0% Largest Share
The IoT in Smart Cities market is experiencing substantial growth worldwide, driven by increasing urbanization, government initiatives, and the rise of smart solutions. In North America, the market leads with 43.0% of the global share, attributed to early adoption of IoT technologies, extensive investments in smart city solutions, and the strong presence of major tech companies. The U.S. spearheads this growth, with cities like New York, San Francisco, and Chicago deploying IoT-driven smart infrastructure, while Canada contributes through smart city initiatives in Toronto and Vancouver.
In Europe, countries such as Germany, France, and the UK are leading the smart cities industry, bolstered by supportive government policies and the European Union’s smart city programs. Germany stands out with its focus on Industry 4.0 and smart urban mobility, while France and the UK prioritize energy efficiency and sustainability through advanced IoT technologies. Other nations, including Spain and Italy, are also enhancing their product portfolios to integrate smart city solutions into urban planning.
The Asia-Pacific region is seeing rapid expansion in the IoT in smart cities market, with China, Japan, and South Korea emerging as key players. China's large-scale urbanization and smart city programs are significant contributors, while Japan and South Korea leverage IoT to address urban planning, energy management, and transportation challenges. India is also gaining traction with government-backed initiatives like the Smart Cities Mission. Australia and Singapore stand out for their advanced smart city frameworks, focusing on sustainability and citizen engagement.
In Latin America, Brazil and Mexico are leading the region's IoT adoption, supported by rising investments in urban infrastructure and government efforts to enhance public services and mobility. Brazil focuses on improving urban infrastructure, while Mexico emphasizes smart mobility and public safety. Other countries in the region are gradually incorporating smart solutions but at a slower pace.
In the Middle East & Africa (MEA), countries like Saudi Arabia, the UAE, and South Africa are driving growth in the smart cities industry. Saudi Arabia's Vision 2030 and initiatives such as NEOM are major catalysts, while the UAE is heavily investing in IoT infrastructure to transform cities like Dubai and Abu Dhabi. South Africa leads the continent in smart city efforts, although infrastructure challenges continue to hinder broader adoption across the region.
Key Regions and Countries
By North America
- The US
- Canada
By Europe
- Germany
- France
- The UK
- Spain
- Italy
- Rest of Europe
By Asia Pacific
- China
- Japan
- South Korea
- India
- Australia
- Singapore
- Rest of Asia Pacific
By Latin America
- Brazil
- Mexico
- Rest of Latin America
By Middle East & Africa
- South Africa
- Saudi Arabia
- UAE
- Rest of MEA
Key Players Analysis
Competitive Landscape of Key Players in the Global IoT in Smart Cities Market (2024)
In 2024, the global IoT in Smart Cities market remains highly competitive, with key players leveraging advanced technologies to capture significant market share. IBM, Cisco, and Intel lead the charge in IoT infrastructure development, offering robust platforms that enhance urban connectivity, data management, and cybersecurity. Microsoft and Tech Mahindra are strong competitors, focusing on cloud-based IoT solutions to support smart city services and AI-driven analytics.
Huawei and Siemens stand out with their expansive global reach and expertise in integrating IoT into smart city frameworks, particularly in urban mobility and energy management. Similarly, Bosch, Honeywell, and Schneider Electric are prominent for their contributions to smart buildings and IoT-enabled energy-efficient solutions, vital in addressing growing concerns around urban sustainability.
Specialized players such as ARM, PTC, and Sierra Wireless provide crucial IoT components and platforms that drive innovation across sectors like transportation and utilities. Meanwhile, companies like Quantela and Hitachi focus on smart city analytics, offering solutions to optimize city operations and citizen services.
Emerging players like AppyWay, Optibus, and Enevo are revolutionizing urban mobility and waste management through IoT-enabled smart applications. Additionally, Verizon, Deutsche Telekom, and Confidex play a pivotal role in enhancing IoT connectivity and infrastructure through telecommunications and RFID technologies.
As IoT continues to transform urban landscapes, the competitive dynamics in the smart cities market are driven by innovation, strategic partnerships, and the deployment of scalable solutions across regions. This ensures the market's sustained growth in the coming years.
Market Key Players
- IBM Corporation
- Cisco systems inc.
- Intel
- Huawei Technologies co., ltd.
- Microsoft
- Tech Mahindra
- Siemens
- Honeywell international inc.
- Bosch
- PTC
- Schneider Electric
- ARM
- Quantela
- Hitachi
- Sierra Wireless
- Youon
- SAP
- Optibus
- Enevo
- Signify
- FlamencoTech
- AppyWay
- Deutsche Telekom
- Confidex
- Verizon
- AGT International
- Takadu
Recent Development
- In September 2023, AT&T expanded its smart cities program to include 100 cities and counties across the U.S. The program delivers IoT solutions for infrastructure monitoring, traffic management, public safety, and sustainability. AT&T has invested over $28 million to date in smart city initiatives, further enhancing its role in urban digital transformation.
- Tech Mahindra partnered with TANESCO in Tanzania to drive digital transformation through IoT and GIS technologies, focusing on power grid management. This 2023 initiative enhances smart infrastructure scalability, aiming to optimize energy distribution and grid efficiency in the region.
- In 2023, Siemens bolstered its smart city portfolio by acquiring Wattsense, a startup providing IoT solutions for small to mid-sized buildings. This acquisition strengthens Siemens’ capabilities in smart building management, expanding its reach into the mid-market segment of urban infrastructure.
Report Scope
Report Features Description Market Value (2023) USD 151.2 Bn Forecast Revenue (2033) USD 1,174.5 Bn CAGR (2024-2032) 23.4% Base Year for Estimation 2023 Historic Period 2016-2023 Forecast Period 2024-2033 Report Coverage Revenue Forecast, Market Dynamics, COVID-19 Impact, Competitive Landscape, Recent Developments Segments Covered By Offering (Solutions, Services), By Application (Smart Transportation , Smart Building, Smart Utilities, Smart Citizen Services, Smart Healthcare, Public Safety) Regional Analysis North America - The US, Canada, Rest of North America, Europe - Germany, France, The UK, Spain, Italy, Russia, Netherlands, Rest of Europe, Asia-Pacific - China, Japan, South Korea, India, New Zealand, Singapore, Thailand, Vietnam, Rest of Asia Pacific, Latin America - Brazil, Mexico, Rest of Latin America, Middle East & Africa - South Africa, Saudi Arabia, UAE, Rest of Middle East & Africa Competitive Landscape IBM, Cisco systems inc., Intel, Huawei Technologies co., ltd., Microsoft, Tech Mahindra, Siemens, Honeywell international inc., Bosch, PTC, Schneider Electric, ARM, Quantela, Hitachi, Sierra Wireless, Youon, SAP, Optibus, Enevo, Signify, FlamencoTech, AppyWay, Deutsche Telekom, Confidex, Verizon, AGT International, Takadu Customization Scope Customization for segments, region/country-level will be provided. Moreover, additional customization can be done based on the requirements. Purchase Options We have three licenses to opt for Single User License, Multi-User License (Up to 5 Users), Corporate Use License (Unlimited User and Printable PDF) -
- 1. Executive Summary
- 1.1. Definition
- 1.2. Taxonomy
- 1.3. Research Scope
- 1.4. Key Analysis
- 1.5. Key Findings by Major Segments
- 1.6. Top strategies by Major Players
- 2. Global IoT in Smart Cities Market Overview
- 2.1. IoT in Smart Cities Market Dynamics
- 2.1.1. Drivers
- 2.1.2. Opportunities
- 2.1.3. Restraints
- 2.1.4. Challenges
- 2.2. Macro-economic Factors
- 2.3. Regulatory Framework
- 2.4. Market Investment Feasibility Index
- 2.5. PEST Analysis
- 2.6. PORTER’S Five Force Analysis
- 2.7. Drivers & Restraints Impact Analysis
- 2.8. Industry Chain Analysis
- 2.9. Cost Structure Analysis
- 2.10. Marketing Strategy
- 2.11. Russia-Ukraine War Impact Analysis
- 2.12. Opportunity Map Analysis
- 2.13. Market Competition Scenario Analysis
- 2.14. Product Life Cycle Analysis
- 2.15. Opportunity Orbits
- 2.16. Manufacturer Intensity Map
- 2.17. Major Companies sales by Value & Volume
- 2.1. IoT in Smart Cities Market Dynamics
- 3. Global IoT in Smart Cities Market Analysis, Opportunity and Forecast, 2016-2032
- 3.1. Global IoT in Smart Cities Market Analysis, 2016-2021
- 3.2. Global IoT in Smart Cities Market Opportunity and Forecast, 2023-2032
- 3.3. Global IoT in Smart Cities Market Analysis, Opportunity and Forecast, By By Offering, 2016-2032
- 3.3.1. Global IoT in Smart Cities Market Analysis by By Offering: Introduction
- 3.3.2. Market Size Absolute $ Opportunity Analysis and Forecast, By By Offering, 2016-2032
- 3.3.3. Solutions
- 3.3.4. Services
- 3.4. Global IoT in Smart Cities Market Analysis, Opportunity and Forecast, By By Application, 2016-2032
- 3.4.1. Global IoT in Smart Cities Market Analysis by By Application: Introduction
- 3.4.2. Market Size Absolute $ Opportunity Analysis and Forecast, By By Application, 2016-2032
- 3.4.3. Smart Transportation
- 3.4.4. Smart Building
- 3.4.5. Smart Utilities
- 3.4.6. Smart Citizen Services
- 3.4.7. Smart Healthcare
- 3.4.8. Public Safety
- 4. North America IoT in Smart Cities Market Analysis, Opportunity and Forecast, 2016-2032
- 4.1. North America IoT in Smart Cities Market Analysis, 2016-2021
- 4.2. North America IoT in Smart Cities Market Opportunity and Forecast, 2023-2032
- 4.3. North America IoT in Smart Cities Market Analysis, Opportunity and Forecast, By By Offering, 2016-2032
- 4.3.1. North America IoT in Smart Cities Market Analysis by By Offering: Introduction
- 4.3.2. Market Size Absolute $ Opportunity Analysis and Forecast, By By Offering, 2016-2032
- 4.3.3. Solutions
- 4.3.4. Services
- 4.4. North America IoT in Smart Cities Market Analysis, Opportunity and Forecast, By By Application, 2016-2032
- 4.4.1. North America IoT in Smart Cities Market Analysis by By Application: Introduction
- 4.4.2. Market Size Absolute $ Opportunity Analysis and Forecast, By By Application, 2016-2032
- 4.4.3. Smart Transportation
- 4.4.4. Smart Building
- 4.4.5. Smart Utilities
- 4.4.6. Smart Citizen Services
- 4.4.7. Smart Healthcare
- 4.4.8. Public Safety
- 4.5. North America IoT in Smart Cities Market Analysis, Opportunity and Forecast, By Country , 2016-2032
- 4.5.1. North America IoT in Smart Cities Market Analysis by Country : Introduction
- 4.5.2. Market Size Absolute $ Opportunity Analysis and Forecast, Country , 2016-2032
- 4.5.2.1. The US
- 4.5.2.2. Canada
- 4.5.2.3. Mexico
- 5. Western Europe IoT in Smart Cities Market Analysis, Opportunity and Forecast, 2016-2032
- 5.1. Western Europe IoT in Smart Cities Market Analysis, 2016-2021
- 5.2. Western Europe IoT in Smart Cities Market Opportunity and Forecast, 2023-2032
- 5.3. Western Europe IoT in Smart Cities Market Analysis, Opportunity and Forecast, By By Offering, 2016-2032
- 5.3.1. Western Europe IoT in Smart Cities Market Analysis by By Offering: Introduction
- 5.3.2. Market Size Absolute $ Opportunity Analysis and Forecast, By By Offering, 2016-2032
- 5.3.3. Solutions
- 5.3.4. Services
- 5.4. Western Europe IoT in Smart Cities Market Analysis, Opportunity and Forecast, By By Application, 2016-2032
- 5.4.1. Western Europe IoT in Smart Cities Market Analysis by By Application: Introduction
- 5.4.2. Market Size Absolute $ Opportunity Analysis and Forecast, By By Application, 2016-2032
- 5.4.3. Smart Transportation
- 5.4.4. Smart Building
- 5.4.5. Smart Utilities
- 5.4.6. Smart Citizen Services
- 5.4.7. Smart Healthcare
- 5.4.8. Public Safety
- 5.5. Western Europe IoT in Smart Cities Market Analysis, Opportunity and Forecast, By Country , 2016-2032
- 5.5.1. Western Europe IoT in Smart Cities Market Analysis by Country : Introduction
- 5.5.2. Market Size Absolute $ Opportunity Analysis and Forecast, Country , 2016-2032
- 5.5.2.1. Germany
- 5.5.2.2. France
- 5.5.2.3. The UK
- 5.5.2.4. Spain
- 5.5.2.5. Italy
- 5.5.2.6. Portugal
- 5.5.2.7. Ireland
- 5.5.2.8. Austria
- 5.5.2.9. Switzerland
- 5.5.2.10. Benelux
- 5.5.2.11. Nordic
- 5.5.2.12. Rest of Western Europe
- 6. Eastern Europe IoT in Smart Cities Market Analysis, Opportunity and Forecast, 2016-2032
- 6.1. Eastern Europe IoT in Smart Cities Market Analysis, 2016-2021
- 6.2. Eastern Europe IoT in Smart Cities Market Opportunity and Forecast, 2023-2032
- 6.3. Eastern Europe IoT in Smart Cities Market Analysis, Opportunity and Forecast, By By Offering, 2016-2032
- 6.3.1. Eastern Europe IoT in Smart Cities Market Analysis by By Offering: Introduction
- 6.3.2. Market Size Absolute $ Opportunity Analysis and Forecast, By By Offering, 2016-2032
- 6.3.3. Solutions
- 6.3.4. Services
- 6.4. Eastern Europe IoT in Smart Cities Market Analysis, Opportunity and Forecast, By By Application, 2016-2032
- 6.4.1. Eastern Europe IoT in Smart Cities Market Analysis by By Application: Introduction
- 6.4.2. Market Size Absolute $ Opportunity Analysis and Forecast, By By Application, 2016-2032
- 6.4.3. Smart Transportation
- 6.4.4. Smart Building
- 6.4.5. Smart Utilities
- 6.4.6. Smart Citizen Services
- 6.4.7. Smart Healthcare
- 6.4.8. Public Safety
- 6.5. Eastern Europe IoT in Smart Cities Market Analysis, Opportunity and Forecast, By Country , 2016-2032
- 6.5.1. Eastern Europe IoT in Smart Cities Market Analysis by Country : Introduction
- 6.5.2. Market Size Absolute $ Opportunity Analysis and Forecast, Country , 2016-2032
- 6.5.2.1. Russia
- 6.5.2.2. Poland
- 6.5.2.3. The Czech Republic
- 6.5.2.4. Greece
- 6.5.2.5. Rest of Eastern Europe
- 7. APAC IoT in Smart Cities Market Analysis, Opportunity and Forecast, 2016-2032
- 7.1. APAC IoT in Smart Cities Market Analysis, 2016-2021
- 7.2. APAC IoT in Smart Cities Market Opportunity and Forecast, 2023-2032
- 7.3. APAC IoT in Smart Cities Market Analysis, Opportunity and Forecast, By By Offering, 2016-2032
- 7.3.1. APAC IoT in Smart Cities Market Analysis by By Offering: Introduction
- 7.3.2. Market Size Absolute $ Opportunity Analysis and Forecast, By By Offering, 2016-2032
- 7.3.3. Solutions
- 7.3.4. Services
- 7.4. APAC IoT in Smart Cities Market Analysis, Opportunity and Forecast, By By Application, 2016-2032
- 7.4.1. APAC IoT in Smart Cities Market Analysis by By Application: Introduction
- 7.4.2. Market Size Absolute $ Opportunity Analysis and Forecast, By By Application, 2016-2032
- 7.4.3. Smart Transportation
- 7.4.4. Smart Building
- 7.4.5. Smart Utilities
- 7.4.6. Smart Citizen Services
- 7.4.7. Smart Healthcare
- 7.4.8. Public Safety
- 7.5. APAC IoT in Smart Cities Market Analysis, Opportunity and Forecast, By Country , 2016-2032
- 7.5.1. APAC IoT in Smart Cities Market Analysis by Country : Introduction
- 7.5.2. Market Size Absolute $ Opportunity Analysis and Forecast, Country , 2016-2032
- 7.5.2.1. China
- 7.5.2.2. Japan
- 7.5.2.3. South Korea
- 7.5.2.4. India
- 7.5.2.5. Australia & New Zeland
- 7.5.2.6. Indonesia
- 7.5.2.7. Malaysia
- 7.5.2.8. Philippines
- 7.5.2.9. Singapore
- 7.5.2.10. Thailand
- 7.5.2.11. Vietnam
- 7.5.2.12. Rest of APAC
- 8. Latin America IoT in Smart Cities Market Analysis, Opportunity and Forecast, 2016-2032
- 8.1. Latin America IoT in Smart Cities Market Analysis, 2016-2021
- 8.2. Latin America IoT in Smart Cities Market Opportunity and Forecast, 2023-2032
- 8.3. Latin America IoT in Smart Cities Market Analysis, Opportunity and Forecast, By By Offering, 2016-2032
- 8.3.1. Latin America IoT in Smart Cities Market Analysis by By Offering: Introduction
- 8.3.2. Market Size Absolute $ Opportunity Analysis and Forecast, By By Offering, 2016-2032
- 8.3.3. Solutions
- 8.3.4. Services
- 8.4. Latin America IoT in Smart Cities Market Analysis, Opportunity and Forecast, By By Application, 2016-2032
- 8.4.1. Latin America IoT in Smart Cities Market Analysis by By Application: Introduction
- 8.4.2. Market Size Absolute $ Opportunity Analysis and Forecast, By By Application, 2016-2032
- 8.4.3. Smart Transportation
- 8.4.4. Smart Building
- 8.4.5. Smart Utilities
- 8.4.6. Smart Citizen Services
- 8.4.7. Smart Healthcare
- 8.4.8. Public Safety
- 8.5. Latin America IoT in Smart Cities Market Analysis, Opportunity and Forecast, By Country , 2016-2032
- 8.5.1. Latin America IoT in Smart Cities Market Analysis by Country : Introduction
- 8.5.2. Market Size Absolute $ Opportunity Analysis and Forecast, Country , 2016-2032
- 8.5.2.1. Brazil
- 8.5.2.2. Colombia
- 8.5.2.3. Chile
- 8.5.2.4. Argentina
- 8.5.2.5. Costa Rica
- 8.5.2.6. Rest of Latin America
- 9. Middle East & Africa IoT in Smart Cities Market Analysis, Opportunity and Forecast, 2016-2032
- 9.1. Middle East & Africa IoT in Smart Cities Market Analysis, 2016-2021
- 9.2. Middle East & Africa IoT in Smart Cities Market Opportunity and Forecast, 2023-2032
- 9.3. Middle East & Africa IoT in Smart Cities Market Analysis, Opportunity and Forecast, By By Offering, 2016-2032
- 9.3.1. Middle East & Africa IoT in Smart Cities Market Analysis by By Offering: Introduction
- 9.3.2. Market Size Absolute $ Opportunity Analysis and Forecast, By By Offering, 2016-2032
- 9.3.3. Solutions
- 9.3.4. Services
- 9.4. Middle East & Africa IoT in Smart Cities Market Analysis, Opportunity and Forecast, By By Application, 2016-2032
- 9.4.1. Middle East & Africa IoT in Smart Cities Market Analysis by By Application: Introduction
- 9.4.2. Market Size Absolute $ Opportunity Analysis and Forecast, By By Application, 2016-2032
- 9.4.3. Smart Transportation
- 9.4.4. Smart Building
- 9.4.5. Smart Utilities
- 9.4.6. Smart Citizen Services
- 9.4.7. Smart Healthcare
- 9.4.8. Public Safety
- 9.5. Middle East & Africa IoT in Smart Cities Market Analysis, Opportunity and Forecast, By Country , 2016-2032
- 9.5.1. Middle East & Africa IoT in Smart Cities Market Analysis by Country : Introduction
- 9.5.2. Market Size Absolute $ Opportunity Analysis and Forecast, Country , 2016-2032
- 9.5.2.1. Algeria
- 9.5.2.2. Egypt
- 9.5.2.3. Israel
- 9.5.2.4. Kuwait
- 9.5.2.5. Nigeria
- 9.5.2.6. Saudi Arabia
- 9.5.2.7. South Africa
- 9.5.2.8. Turkey
- 9.5.2.9. The UAE
- 9.5.2.10. Rest of MEA
- 10. Global IoT in Smart Cities Market Analysis, Opportunity and Forecast, By Region , 2016-2032
- 10.1. Global IoT in Smart Cities Market Analysis by Region : Introduction
- 10.2. Market Size Absolute $ Opportunity Analysis and Forecast, By Region , 2016-2032
- 10.2.1. North America
- 10.2.2. Western Europe
- 10.2.3. Eastern Europe
- 10.2.4. APAC
- 10.2.5. Latin America
- 10.2.6. Middle East & Africa
- 11. Global IoT in Smart Cities Market Competitive Landscape, Market Share Analysis, and Company Profiles
- 11.1. Market Share Analysis
- 11.2. Company Profiles
- 11.3. IBM Corporation
- 11.3.1. Company Overview
- 11.3.2. Financial Highlights
- 11.3.3. Product Portfolio
- 11.3.4. SWOT Analysis
- 11.3.5. Key Strategies and Developments
- 11.4. Cisco systems inc.
- 11.4.1. Company Overview
- 11.4.2. Financial Highlights
- 11.4.3. Product Portfolio
- 11.4.4. SWOT Analysis
- 11.4.5. Key Strategies and Developments
- 11.5. Intel
- 11.5.1. Company Overview
- 11.5.2. Financial Highlights
- 11.5.3. Product Portfolio
- 11.5.4. SWOT Analysis
- 11.5.5. Key Strategies and Developments
- 11.6. Huawei Technologies co., ltd.
- 11.6.1. Company Overview
- 11.6.2. Financial Highlights
- 11.6.3. Product Portfolio
- 11.6.4. SWOT Analysis
- 11.6.5. Key Strategies and Developments
- 11.7. Microsoft
- 11.7.1. Company Overview
- 11.7.2. Financial Highlights
- 11.7.3. Product Portfolio
- 11.7.4. SWOT Analysis
- 11.7.5. Key Strategies and Developments
- 11.8. Tech Mahindra
- 11.8.1. Company Overview
- 11.8.2. Financial Highlights
- 11.8.3. Product Portfolio
- 11.8.4. SWOT Analysis
- 11.8.5. Key Strategies and Developments
- 11.9. Siemens
- 11.9.1. Company Overview
- 11.9.2. Financial Highlights
- 11.9.3. Product Portfolio
- 11.9.4. SWOT Analysis
- 11.9.5. Key Strategies and Developments
- 11.10. Honeywell international inc.
- 11.10.1. Company Overview
- 11.10.2. Financial Highlights
- 11.10.3. Product Portfolio
- 11.10.4. SWOT Analysis
- 11.10.5. Key Strategies and Developments
- 11.11. Bosch
- 11.11.1. Company Overview
- 11.11.2. Financial Highlights
- 11.11.3. Product Portfolio
- 11.11.4. SWOT Analysis
- 11.11.5. Key Strategies and Developments
- 11.12. PTC
- 11.12.1. Company Overview
- 11.12.2. Financial Highlights
- 11.12.3. Product Portfolio
- 11.12.4. SWOT Analysis
- 11.12.5. Key Strategies and Developments
- 11.13.1. Company Overview
- 11.13.2. Financial Highlights
- 11.13.3. Product Portfolio
- 11.13.4. SWOT Analysis
- 11.13.5. Key Strategies and Developments
- 11.14. Schneider Electric
- 11.14.1. Company Overview
- 11.14.2. Financial Highlights
- 11.14.3. Product Portfolio
- 11.14.4. SWOT Analysis
- 11.14.5. Key Strategies and Developments
- 11.15. Quantela
- 11.15.1. Company Overview
- 11.15.2. Financial Highlights
- 11.15.3. Product Portfolio
- 11.15.4. SWOT Analysis
- 11.15.5. Key Strategies and Developments
- 11.16. Hitachi
- 11.16.1. Company Overview
- 11.16.2. Financial Highlights
- 11.16.3. Product Portfolio
- 11.16.4. SWOT Analysis
- 11.16.5. Key Strategies and Developments
- 11.17. Sierra Wireless
- 11.17.1. Company Overview
- 11.17.2. Financial Highlights
- 11.17.3. Product Portfolio
- 11.17.4. SWOT Analysis
- 11.17.5. Key Strategies and Developments
- 11.18. Youon
- 11.18.1. Company Overview
- 11.18.2. Financial Highlights
- 11.18.3. Product Portfolio
- 11.18.4. SWOT Analysis
- 11.18.5. Key Strategies and Developments
- 11.19. SAP
- 11.19.1. Company Overview
- 11.19.2. Financial Highlights
- 11.19.3. Product Portfolio
- 11.19.4. SWOT Analysis
- 11.19.5. Key Strategies and Developments
- 11.20. Optibus
- 11.20.1. Company Overview
- 11.20.2. Financial Highlights
- 11.20.3. Product Portfolio
- 11.20.4. SWOT Analysis
- 11.20.5. Key Strategies and Developments
- 11.21. Enevo
- 11.21.1. Company Overview
- 11.21.2. Financial Highlights
- 11.21.3. Product Portfolio
- 11.21.4. SWOT Analysis
- 11.21.5. Key Strategies and Developments
- 11.22. Signify
- 11.22.1. Company Overview
- 11.22.2. Financial Highlights
- 11.22.3. Product Portfolio
- 11.22.4. SWOT Analysis
- 11.22.5. Key Strategies and Developments
- 12. Assumptions and Acronyms
- 13. Research Methodology
- 14. Contact
- List of Figures
- Figure 1: Global IoT in Smart Cities Market Revenue (US$ Mn) Market Share by By Offering in 2022
- Figure 2: Global IoT in Smart Cities Market Market Attractiveness Analysis by By Offering, 2016-2032
- Figure 3: Global IoT in Smart Cities Market Revenue (US$ Mn) Market Share by By Applicationin 2022
- Figure 4: Global IoT in Smart Cities Market Market Attractiveness Analysis by By Application, 2016-2032
- Figure 5: Global IoT in Smart Cities Market Revenue (US$ Mn) Market Share by Region in 2022
- Figure 6: Global IoT in Smart Cities Market Market Attractiveness Analysis by Region, 2016-2032
- Figure 7: Global IoT in Smart Cities Market Market Revenue (US$ Mn) (2016-2032)
- Figure 8: Global IoT in Smart Cities Market Market Revenue (US$ Mn) Comparison by Region (2016-2032)
- Figure 9: Global IoT in Smart Cities Market Market Revenue (US$ Mn) Comparison by By Offering (2016-2032)
- Figure 10: Global IoT in Smart Cities Market Market Revenue (US$ Mn) Comparison by By Application (2016-2032)
- Figure 11: Global IoT in Smart Cities Market Market Y-o-Y Growth Rate Comparison by Region (2016-2032)
- Figure 12: Global IoT in Smart Cities Market Market Y-o-Y Growth Rate Comparison by By Offering (2016-2032)
- Figure 13: Global IoT in Smart Cities Market Market Y-o-Y Growth Rate Comparison by By Application (2016-2032)
- Figure 14: Global IoT in Smart Cities Market Market Share Comparison by Region (2016-2032)
- Figure 15: Global IoT in Smart Cities Market Market Share Comparison by By Offering (2016-2032)
- Figure 16: Global IoT in Smart Cities Market Market Share Comparison by By Application (2016-2032)
- Figure 17: North America IoT in Smart Cities Market Revenue (US$ Mn) Market Share by By Offeringin 2022
- Figure 18: North America IoT in Smart Cities Market Market Attractiveness Analysis by By Offering, 2016-2032
- Figure 19: North America IoT in Smart Cities Market Revenue (US$ Mn) Market Share by By Applicationin 2022
- Figure 20: North America IoT in Smart Cities Market Market Attractiveness Analysis by By Application, 2016-2032
- Figure 21: North America IoT in Smart Cities Market Revenue (US$ Mn) Market Share by Country in 2022
- Figure 22: North America IoT in Smart Cities Market Market Attractiveness Analysis by Country, 2016-2032
- Figure 23: North America IoT in Smart Cities Market Market Revenue (US$ Mn) (2016-2032)
- Figure 24: North America IoT in Smart Cities Market Market Revenue (US$ Mn) Comparison by Country (2016-2032)
- Figure 25: North America IoT in Smart Cities Market Market Revenue (US$ Mn) Comparison by By Offering (2016-2032)
- Figure 26: North America IoT in Smart Cities Market Market Revenue (US$ Mn) Comparison by By Application (2016-2032)
- Figure 27: North America IoT in Smart Cities Market Market Y-o-Y Growth Rate Comparison by Country (2016-2032)
- Figure 28: North America IoT in Smart Cities Market Market Y-o-Y Growth Rate Comparison by By Offering (2016-2032)
- Figure 29: North America IoT in Smart Cities Market Market Y-o-Y Growth Rate Comparison by By Application (2016-2032)
- Figure 30: North America IoT in Smart Cities Market Market Share Comparison by Country (2016-2032)
- Figure 31: North America IoT in Smart Cities Market Market Share Comparison by By Offering (2016-2032)
- Figure 32: North America IoT in Smart Cities Market Market Share Comparison by By Application (2016-2032)
- Figure 33: Western Europe IoT in Smart Cities Market Revenue (US$ Mn) Market Share by By Offeringin 2022
- Figure 34: Western Europe IoT in Smart Cities Market Market Attractiveness Analysis by By Offering, 2016-2032
- Figure 35: Western Europe IoT in Smart Cities Market Revenue (US$ Mn) Market Share by By Applicationin 2022
- Figure 36: Western Europe IoT in Smart Cities Market Market Attractiveness Analysis by By Application, 2016-2032
- Figure 37: Western Europe IoT in Smart Cities Market Revenue (US$ Mn) Market Share by Country in 2022
- Figure 38: Western Europe IoT in Smart Cities Market Market Attractiveness Analysis by Country, 2016-2032
- Figure 39: Western Europe IoT in Smart Cities Market Market Revenue (US$ Mn) (2016-2032)
- Figure 40: Western Europe IoT in Smart Cities Market Market Revenue (US$ Mn) Comparison by Country (2016-2032)
- Figure 41: Western Europe IoT in Smart Cities Market Market Revenue (US$ Mn) Comparison by By Offering (2016-2032)
- Figure 42: Western Europe IoT in Smart Cities Market Market Revenue (US$ Mn) Comparison by By Application (2016-2032)
- Figure 43: Western Europe IoT in Smart Cities Market Market Y-o-Y Growth Rate Comparison by Country (2016-2032)
- Figure 44: Western Europe IoT in Smart Cities Market Market Y-o-Y Growth Rate Comparison by By Offering (2016-2032)
- Figure 45: Western Europe IoT in Smart Cities Market Market Y-o-Y Growth Rate Comparison by By Application (2016-2032)
- Figure 46: Western Europe IoT in Smart Cities Market Market Share Comparison by Country (2016-2032)
- Figure 47: Western Europe IoT in Smart Cities Market Market Share Comparison by By Offering (2016-2032)
- Figure 48: Western Europe IoT in Smart Cities Market Market Share Comparison by By Application (2016-2032)
- Figure 49: Eastern Europe IoT in Smart Cities Market Revenue (US$ Mn) Market Share by By Offeringin 2022
- Figure 50: Eastern Europe IoT in Smart Cities Market Market Attractiveness Analysis by By Offering, 2016-2032
- Figure 51: Eastern Europe IoT in Smart Cities Market Revenue (US$ Mn) Market Share by By Applicationin 2022
- Figure 52: Eastern Europe IoT in Smart Cities Market Market Attractiveness Analysis by By Application, 2016-2032
- Figure 53: Eastern Europe IoT in Smart Cities Market Revenue (US$ Mn) Market Share by Country in 2022
- Figure 54: Eastern Europe IoT in Smart Cities Market Market Attractiveness Analysis by Country, 2016-2032
- Figure 55: Eastern Europe IoT in Smart Cities Market Market Revenue (US$ Mn) (2016-2032)
- Figure 56: Eastern Europe IoT in Smart Cities Market Market Revenue (US$ Mn) Comparison by Country (2016-2032)
- Figure 57: Eastern Europe IoT in Smart Cities Market Market Revenue (US$ Mn) Comparison by By Offering (2016-2032)
- Figure 58: Eastern Europe IoT in Smart Cities Market Market Revenue (US$ Mn) Comparison by By Application (2016-2032)
- Figure 59: Eastern Europe IoT in Smart Cities Market Market Y-o-Y Growth Rate Comparison by Country (2016-2032)
- Figure 60: Eastern Europe IoT in Smart Cities Market Market Y-o-Y Growth Rate Comparison by By Offering (2016-2032)
- Figure 61: Eastern Europe IoT in Smart Cities Market Market Y-o-Y Growth Rate Comparison by By Application (2016-2032)
- Figure 62: Eastern Europe IoT in Smart Cities Market Market Share Comparison by Country (2016-2032)
- Figure 63: Eastern Europe IoT in Smart Cities Market Market Share Comparison by By Offering (2016-2032)
- Figure 64: Eastern Europe IoT in Smart Cities Market Market Share Comparison by By Application (2016-2032)
- Figure 65: APAC IoT in Smart Cities Market Revenue (US$ Mn) Market Share by By Offeringin 2022
- Figure 66: APAC IoT in Smart Cities Market Market Attractiveness Analysis by By Offering, 2016-2032
- Figure 67: APAC IoT in Smart Cities Market Revenue (US$ Mn) Market Share by By Applicationin 2022
- Figure 68: APAC IoT in Smart Cities Market Market Attractiveness Analysis by By Application, 2016-2032
- Figure 69: APAC IoT in Smart Cities Market Revenue (US$ Mn) Market Share by Country in 2022
- Figure 70: APAC IoT in Smart Cities Market Market Attractiveness Analysis by Country, 2016-2032
- Figure 71: APAC IoT in Smart Cities Market Market Revenue (US$ Mn) (2016-2032)
- Figure 72: APAC IoT in Smart Cities Market Market Revenue (US$ Mn) Comparison by Country (2016-2032)
- Figure 73: APAC IoT in Smart Cities Market Market Revenue (US$ Mn) Comparison by By Offering (2016-2032)
- Figure 74: APAC IoT in Smart Cities Market Market Revenue (US$ Mn) Comparison by By Application (2016-2032)
- Figure 75: APAC IoT in Smart Cities Market Market Y-o-Y Growth Rate Comparison by Country (2016-2032)
- Figure 76: APAC IoT in Smart Cities Market Market Y-o-Y Growth Rate Comparison by By Offering (2016-2032)
- Figure 77: APAC IoT in Smart Cities Market Market Y-o-Y Growth Rate Comparison by By Application (2016-2032)
- Figure 78: APAC IoT in Smart Cities Market Market Share Comparison by Country (2016-2032)
- Figure 79: APAC IoT in Smart Cities Market Market Share Comparison by By Offering (2016-2032)
- Figure 80: APAC IoT in Smart Cities Market Market Share Comparison by By Application (2016-2032)
- Figure 81: Latin America IoT in Smart Cities Market Revenue (US$ Mn) Market Share by By Offeringin 2022
- Figure 82: Latin America IoT in Smart Cities Market Market Attractiveness Analysis by By Offering, 2016-2032
- Figure 83: Latin America IoT in Smart Cities Market Revenue (US$ Mn) Market Share by By Applicationin 2022
- Figure 84: Latin America IoT in Smart Cities Market Market Attractiveness Analysis by By Application, 2016-2032
- Figure 85: Latin America IoT in Smart Cities Market Revenue (US$ Mn) Market Share by Country in 2022
- Figure 86: Latin America IoT in Smart Cities Market Market Attractiveness Analysis by Country, 2016-2032
- Figure 87: Latin America IoT in Smart Cities Market Market Revenue (US$ Mn) (2016-2032)
- Figure 88: Latin America IoT in Smart Cities Market Market Revenue (US$ Mn) Comparison by Country (2016-2032)
- Figure 89: Latin America IoT in Smart Cities Market Market Revenue (US$ Mn) Comparison by By Offering (2016-2032)
- Figure 90: Latin America IoT in Smart Cities Market Market Revenue (US$ Mn) Comparison by By Application (2016-2032)
- Figure 91: Latin America IoT in Smart Cities Market Market Y-o-Y Growth Rate Comparison by Country (2016-2032)
- Figure 92: Latin America IoT in Smart Cities Market Market Y-o-Y Growth Rate Comparison by By Offering (2016-2032)
- Figure 93: Latin America IoT in Smart Cities Market Market Y-o-Y Growth Rate Comparison by By Application (2016-2032)
- Figure 94: Latin America IoT in Smart Cities Market Market Share Comparison by Country (2016-2032)
- Figure 95: Latin America IoT in Smart Cities Market Market Share Comparison by By Offering (2016-2032)
- Figure 96: Latin America IoT in Smart Cities Market Market Share Comparison by By Application (2016-2032)
- Figure 97: Middle East & Africa IoT in Smart Cities Market Revenue (US$ Mn) Market Share by By Offeringin 2022
- Figure 98: Middle East & Africa IoT in Smart Cities Market Market Attractiveness Analysis by By Offering, 2016-2032
- Figure 99: Middle East & Africa IoT in Smart Cities Market Revenue (US$ Mn) Market Share by By Applicationin 2022
- Figure 100: Middle East & Africa IoT in Smart Cities Market Market Attractiveness Analysis by By Application, 2016-2032
- Figure 101: Middle East & Africa IoT in Smart Cities Market Revenue (US$ Mn) Market Share by Country in 2022
- Figure 102: Middle East & Africa IoT in Smart Cities Market Market Attractiveness Analysis by Country, 2016-2032
- Figure 103: Middle East & Africa IoT in Smart Cities Market Market Revenue (US$ Mn) (2016-2032)
- Figure 104: Middle East & Africa IoT in Smart Cities Market Market Revenue (US$ Mn) Comparison by Country (2016-2032)
- Figure 105: Middle East & Africa IoT in Smart Cities Market Market Revenue (US$ Mn) Comparison by By Offering (2016-2032)
- Figure 106: Middle East & Africa IoT in Smart Cities Market Market Revenue (US$ Mn) Comparison by By Application (2016-2032)
- Figure 107: Middle East & Africa IoT in Smart Cities Market Market Y-o-Y Growth Rate Comparison by Country (2016-2032)
- Figure 108: Middle East & Africa IoT in Smart Cities Market Market Y-o-Y Growth Rate Comparison by By Offering (2016-2032)
- Figure 109: Middle East & Africa IoT in Smart Cities Market Market Y-o-Y Growth Rate Comparison by By Application (2016-2032)
- Figure 110: Middle East & Africa IoT in Smart Cities Market Market Share Comparison by Country (2016-2032)
- Figure 111: Middle East & Africa IoT in Smart Cities Market Market Share Comparison by By Offering (2016-2032)
- Figure 112: Middle East & Africa IoT in Smart Cities Market Market Share Comparison by By Application (2016-2032)
List of Tables
- Table 1: Global IoT in Smart Cities Market Market Comparison by By Offering (2016-2032)
- Table 2: Global IoT in Smart Cities Market Market Comparison by By Application (2016-2032)
- Table 3: Global IoT in Smart Cities Market Revenue (US$ Mn) Comparison by Region (2016-2032)
- Table 4: Global IoT in Smart Cities Market Market Revenue (US$ Mn) (2016-2032)
- Table 5: Global IoT in Smart Cities Market Market Revenue (US$ Mn) Comparison by Region (2016-2032)
- Table 6: Global IoT in Smart Cities Market Market Revenue (US$ Mn) Comparison by By Offering (2016-2032)
- Table 7: Global IoT in Smart Cities Market Market Revenue (US$ Mn) Comparison by By Application (2016-2032)
- Table 8: Global IoT in Smart Cities Market Market Y-o-Y Growth Rate Comparison by Region (2016-2032)
- Table 9: Global IoT in Smart Cities Market Market Y-o-Y Growth Rate Comparison by By Offering (2016-2032)
- Table 10: Global IoT in Smart Cities Market Market Y-o-Y Growth Rate Comparison by By Application (2016-2032)
- Table 11: Global IoT in Smart Cities Market Market Share Comparison by Region (2016-2032)
- Table 12: Global IoT in Smart Cities Market Market Share Comparison by By Offering (2016-2032)
- Table 13: Global IoT in Smart Cities Market Market Share Comparison by By Application (2016-2032)
- Table 14: North America IoT in Smart Cities Market Market Comparison by By Application (2016-2032)
- Table 15: North America IoT in Smart Cities Market Revenue (US$ Mn) Comparison by Country (2016-2032)
- Table 16: North America IoT in Smart Cities Market Market Revenue (US$ Mn) (2016-2032)
- Table 17: North America IoT in Smart Cities Market Market Revenue (US$ Mn) Comparison by Country (2016-2032)
- Table 18: North America IoT in Smart Cities Market Market Revenue (US$ Mn) Comparison by By Offering (2016-2032)
- Table 19: North America IoT in Smart Cities Market Market Revenue (US$ Mn) Comparison by By Application (2016-2032)
- Table 20: North America IoT in Smart Cities Market Market Y-o-Y Growth Rate Comparison by Country (2016-2032)
- Table 21: North America IoT in Smart Cities Market Market Y-o-Y Growth Rate Comparison by By Offering (2016-2032)
- Table 22: North America IoT in Smart Cities Market Market Y-o-Y Growth Rate Comparison by By Application (2016-2032)
- Table 23: North America IoT in Smart Cities Market Market Share Comparison by Country (2016-2032)
- Table 24: North America IoT in Smart Cities Market Market Share Comparison by By Offering (2016-2032)
- Table 25: North America IoT in Smart Cities Market Market Share Comparison by By Application (2016-2032)
- Table 26: Western Europe IoT in Smart Cities Market Market Comparison by By Offering (2016-2032)
- Table 27: Western Europe IoT in Smart Cities Market Market Comparison by By Application (2016-2032)
- Table 28: Western Europe IoT in Smart Cities Market Revenue (US$ Mn) Comparison by Country (2016-2032)
- Table 29: Western Europe IoT in Smart Cities Market Market Revenue (US$ Mn) (2016-2032)
- Table 30: Western Europe IoT in Smart Cities Market Market Revenue (US$ Mn) Comparison by Country (2016-2032)
- Table 31: Western Europe IoT in Smart Cities Market Market Revenue (US$ Mn) Comparison by By Offering (2016-2032)
- Table 32: Western Europe IoT in Smart Cities Market Market Revenue (US$ Mn) Comparison by By Application (2016-2032)
- Table 33: Western Europe IoT in Smart Cities Market Market Y-o-Y Growth Rate Comparison by Country (2016-2032)
- Table 34: Western Europe IoT in Smart Cities Market Market Y-o-Y Growth Rate Comparison by By Offering (2016-2032)
- Table 35: Western Europe IoT in Smart Cities Market Market Y-o-Y Growth Rate Comparison by By Application (2016-2032)
- Table 36: Western Europe IoT in Smart Cities Market Market Share Comparison by Country (2016-2032)
- Table 37: Western Europe IoT in Smart Cities Market Market Share Comparison by By Offering (2016-2032)
- Table 38: Western Europe IoT in Smart Cities Market Market Share Comparison by By Application (2016-2032)
- Table 39: Eastern Europe IoT in Smart Cities Market Market Comparison by By Offering (2016-2032)
- Table 40: Eastern Europe IoT in Smart Cities Market Market Comparison by By Application (2016-2032)
- Table 41: Eastern Europe IoT in Smart Cities Market Revenue (US$ Mn) Comparison by Country (2016-2032)
- Table 42: Eastern Europe IoT in Smart Cities Market Market Revenue (US$ Mn) (2016-2032)
- Table 43: Eastern Europe IoT in Smart Cities Market Market Revenue (US$ Mn) Comparison by Country (2016-2032)
- Table 44: Eastern Europe IoT in Smart Cities Market Market Revenue (US$ Mn) Comparison by By Offering (2016-2032)
- Table 45: Eastern Europe IoT in Smart Cities Market Market Revenue (US$ Mn) Comparison by By Application (2016-2032)
- Table 46: Eastern Europe IoT in Smart Cities Market Market Y-o-Y Growth Rate Comparison by Country (2016-2032)
- Table 47: Eastern Europe IoT in Smart Cities Market Market Y-o-Y Growth Rate Comparison by By Offering (2016-2032)
- Table 48: Eastern Europe IoT in Smart Cities Market Market Y-o-Y Growth Rate Comparison by By Application (2016-2032)
- Table 49: Eastern Europe IoT in Smart Cities Market Market Share Comparison by Country (2016-2032)
- Table 50: Eastern Europe IoT in Smart Cities Market Market Share Comparison by By Offering (2016-2032)
- Table 51: Eastern Europe IoT in Smart Cities Market Market Share Comparison by By Application (2016-2032)
- Table 52: APAC IoT in Smart Cities Market Market Comparison by By Offering (2016-2032)
- Table 53: APAC IoT in Smart Cities Market Market Comparison by By Application (2016-2032)
- Table 54: APAC IoT in Smart Cities Market Revenue (US$ Mn) Comparison by Country (2016-2032)
- Table 55: APAC IoT in Smart Cities Market Market Revenue (US$ Mn) (2016-2032)
- Table 56: APAC IoT in Smart Cities Market Market Revenue (US$ Mn) Comparison by Country (2016-2032)
- Table 57: APAC IoT in Smart Cities Market Market Revenue (US$ Mn) Comparison by By Offering (2016-2032)
- Table 58: APAC IoT in Smart Cities Market Market Revenue (US$ Mn) Comparison by By Application (2016-2032)
- Table 59: APAC IoT in Smart Cities Market Market Y-o-Y Growth Rate Comparison by Country (2016-2032)
- Table 60: APAC IoT in Smart Cities Market Market Y-o-Y Growth Rate Comparison by By Offering (2016-2032)
- Table 61: APAC IoT in Smart Cities Market Market Y-o-Y Growth Rate Comparison by By Application (2016-2032)
- Table 62: APAC IoT in Smart Cities Market Market Share Comparison by Country (2016-2032)
- Table 63: APAC IoT in Smart Cities Market Market Share Comparison by By Offering (2016-2032)
- Table 64: APAC IoT in Smart Cities Market Market Share Comparison by By Application (2016-2032)
- Table 65: Latin America IoT in Smart Cities Market Market Comparison by By Offering (2016-2032)
- Table 66: Latin America IoT in Smart Cities Market Market Comparison by By Application (2016-2032)
- Table 67: Latin America IoT in Smart Cities Market Revenue (US$ Mn) Comparison by Country (2016-2032)
- Table 68: Latin America IoT in Smart Cities Market Market Revenue (US$ Mn) (2016-2032)
- Table 69: Latin America IoT in Smart Cities Market Market Revenue (US$ Mn) Comparison by Country (2016-2032)
- Table 70: Latin America IoT in Smart Cities Market Market Revenue (US$ Mn) Comparison by By Offering (2016-2032)
- Table 71: Latin America IoT in Smart Cities Market Market Revenue (US$ Mn) Comparison by By Application (2016-2032)
- Table 72: Latin America IoT in Smart Cities Market Market Y-o-Y Growth Rate Comparison by Country (2016-2032)
- Table 73: Latin America IoT in Smart Cities Market Market Y-o-Y Growth Rate Comparison by By Offering (2016-2032)
- Table 74: Latin America IoT in Smart Cities Market Market Y-o-Y Growth Rate Comparison by By Application (2016-2032)
- Table 75: Latin America IoT in Smart Cities Market Market Share Comparison by Country (2016-2032)
- Table 76: Latin America IoT in Smart Cities Market Market Share Comparison by By Offering (2016-2032)
- Table 77: Latin America IoT in Smart Cities Market Market Share Comparison by By Application (2016-2032)
- Table 78: Middle East & Africa IoT in Smart Cities Market Market Comparison by By Offering (2016-2032)
- Table 79: Middle East & Africa IoT in Smart Cities Market Market Comparison by By Application (2016-2032)
- Table 80: Middle East & Africa IoT in Smart Cities Market Revenue (US$ Mn) Comparison by Country (2016-2032)
- Table 81: Middle East & Africa IoT in Smart Cities Market Market Revenue (US$ Mn) (2016-2032)
- Table 82: Middle East & Africa IoT in Smart Cities Market Market Revenue (US$ Mn) Comparison by Country (2016-2032)
- Table 83: Middle East & Africa IoT in Smart Cities Market Market Revenue (US$ Mn) Comparison by By Offering (2016-2032)
- Table 84: Middle East & Africa IoT in Smart Cities Market Market Revenue (US$ Mn) Comparison by By Application (2016-2032)
- Table 85: Middle East & Africa IoT in Smart Cities Market Market Y-o-Y Growth Rate Comparison by Country (2016-2032)
- Table 86: Middle East & Africa IoT in Smart Cities Market Market Y-o-Y Growth Rate Comparison by By Offering (2016-2032)
- Table 87: Middle East & Africa IoT in Smart Cities Market Market Y-o-Y Growth Rate Comparison by By Application (2016-2032)
- Table 88: Middle East & Africa IoT in Smart Cities Market Market Share Comparison by Country (2016-2032)
- Table 89: Middle East & Africa IoT in Smart Cities Market Market Share Comparison by By Offering (2016-2032)
- Table 90: Middle East & Africa IoT in Smart Cities Market Market Share Comparison by By Application (2016-2032)
- 1. Executive Summary
-
- IBM Corporation
- Cisco systems inc.
- Intel
- Huawei Technologies co., ltd.
- Microsoft
- Tech Mahindra
- Siemens
- Honeywell international inc.
- Bosch
- PTC
- Schneider Electric
- ARM
- Quantela
- Hitachi
- Sierra Wireless
- Youon
- SAP
- Optibus
- Enevo
- Signify
- FlamencoTech
- AppyWay
- Deutsche Telekom
- Confidex
- Verizon
- AGT International
- Takadu
Our Clients


View Our Licence Options
