
Holographic Display Market By Technology Analysis (Semi-Transparent/Electro Holographic, Pistons and others ), By Product Type Analysis (Smart Television, Digital Signage and Others ), By Application Analysis (Automotive, Consumer and Others), By Region And Companies - Industry Segment Outlook, Market Assessment, Competition Scenario, Trends, And Forecast 2023-2032
-
8731
-
May 2023
-
165
-


-
This report was compiled by Vishwa Gaul Vishwa is an experienced market research and consulting professional with over 8 years of expertise in the ICT industry, contributing to over 700 reports across telecommunications, software, hardware, and digital solutions. Correspondence Team Lead- ICT Linkedin | Detailed Market research Methodology Our methodology involves a mix of primary research, including interviews with leading mental health experts, and secondary research from reputable medical journals and databases. View Detailed Methodology Page
-
Quick Navigation
Report Overview
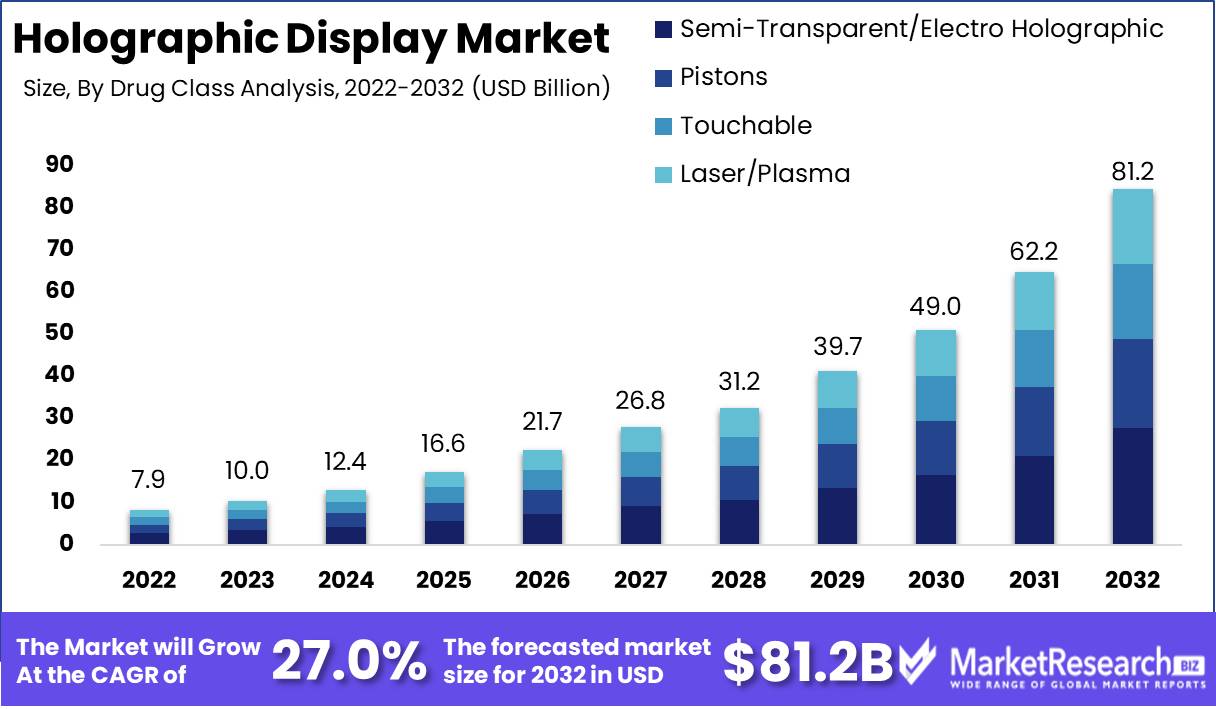
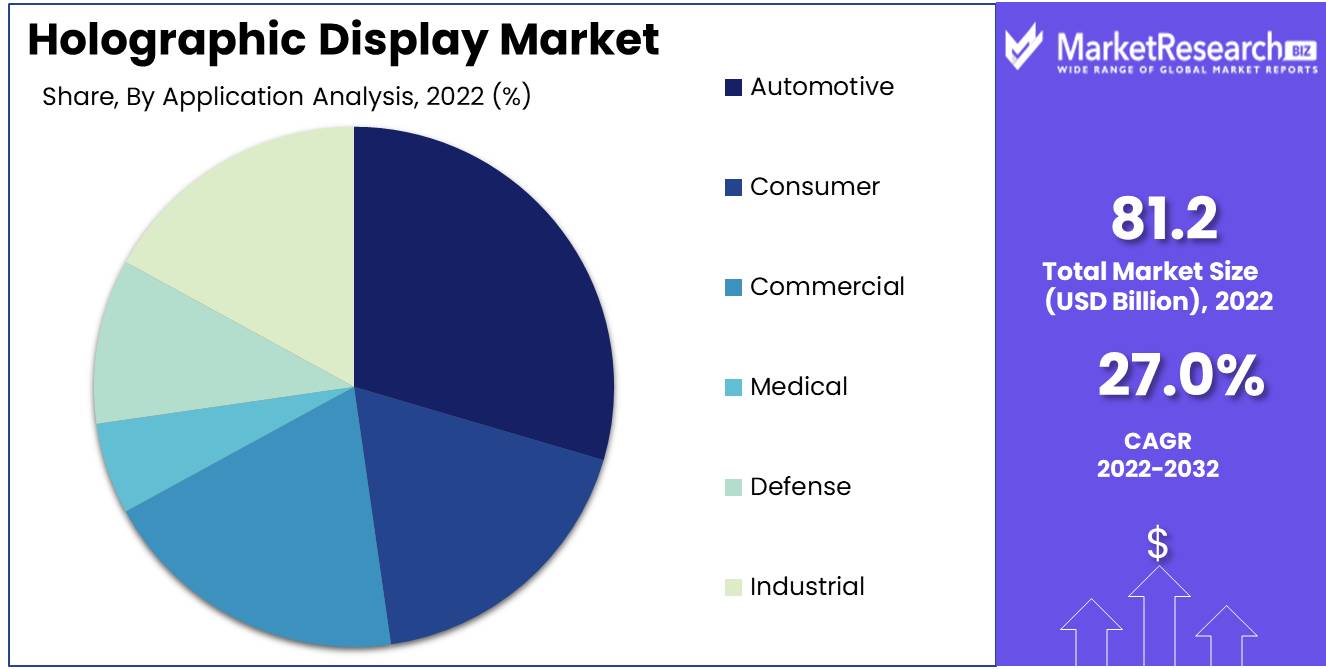
The Holographic Display Market size is expected to be worth around USD 81.2 Bn by 2032 from USD 7.9 Bn in 2022, growing at a CAGR of 27.0% during the forecast period from 2023 to 2032.
The holographic display a realm where the marvels of holographic display technologies are traded, implemented, and exploited, thrives on its mission to provide three-dimensional images and videos that are visible to the naked eye without the use of specialized equipment. Within this domain, holographic displays grant viewers the ability to immerse themselves in hyper-realistic simulations of virtual realms, lifelike images, and tangible objects.
The landscape of the holographic display market is adorned by an ethereal dance of unceasing innovation and development. The advent of interactive holographic displays that invite users to transcend the boundaries of mere observation and actively engage with the holographic realm is a shining example of innovation in this landscape. This revolutionary surge enables simulations, games, and other experiences to achieve unprecedented levels of immersion, transcending the boundaries of the ordinary.
The holographic display market beckons an assortment of industries and businesses with open arms, luring them with its allure. Within this realm, the entertainment industry, healthcare sector, automotive industry, education sector, and even the military have all succumbed to the enchantment and invested fervently in the holographic display marketplace.
Medical training and surgical procedures have garnered substantial benefits from the visual clarity provided by holographic displays, which have proven to be indispensable in unraveling the complexities of intricate medical processes. Concurrently, the entertainment industry employs holographic displays to create immersive gaming experiences and orchestrate spectacular live events.
The ascent of the holographic display market is accompanied by an orchestra of ethical concerns. Primarily, the unsettling effects on social behavior and the potential repercussions of protracted exposure to such bewitching technology. Consequently, companies operating in the holographic display market should adopt transparency, explicability, and responsibility as their governing principles.
The tapestry of holographic displays reveals an array of enticing business applications. Among these is the power of product visualization, as holographic displays enable customers to perceive products in three dimensions, resulting in a purchasing experience that is rich in engagement and immersion. Moreover, these displays emerge as invaluable allies in the creation of interactive training materials and captivating presentations, boosting customer engagement and educational content retention.
Driving factors
Booming Holographic Displays A Revolution of the Future
The holographic display market is thriving and with good reason. In numerous industries, the demand for this futuristic technology is being driven by a number of factors. The demand for holographic displays is increasing in the entertainment industry. The use of holograms that project realistic 3D images of performers is revolutionizing concerts and other live events.
Holographic Displays Revolutionize Industries
In addition, the medical and educational sectors are discovering new applications for holographic displays. Holography is revolutionizing medical imaging and education, allowing for more in-depth and interactive learning experiences. Automotive and aerospace industries are also utilizing holographic displays for design and prototyping.
Innovations in Holographic Display Technology and Demand
The growth of the holographic display market has also been influenced by advancements in technology and the growing adoption of augmented reality (AR) and virtual reality (VR) applications. In addition, there is a growing demand for 3D holographic displays in the advertising and retail industries, as companies seek new and innovative methods to capture consumers' attention.
Regulatory Effects on the Market for Holographic Displays
Regulatory changes may impact the holographic display market. For instance, new safety regulations may be implemented to govern the use of holographic displays in particular industries. Emerging technologies, such as quantum computation and enhanced image projection techniques, could also represent potential disruptors.
Consumer Trends Boost the Market for Holographic Displays
Emerging consumer behavior trends may also have an impact on the holographic display market. As consumers become acclimated to interactive experiences, there may be an increase in demand for holographic displays. This is evidenced by the prevalence of these displays in the smartphone and consumer electronics industries.
Restraining Factors
Holographic Displays Present Pricey Obstacles
Because of their unique ability to generate 3D images that can be viewed without the use of special eyewear, holographic displays have attracted a great deal of attention in recent years. Numerous businesses have invested in this technology due to its potential to create breathtaking, immersive experiences. However, the high cost associated with holographic displays, the limited availability of content for holographic displays, and the technical challenges associated with creating a high-quality holographic display market.
Lack of Content in Holographic Display
The high price of the technology is one of the greatest challenges confronting the holographic display market. Since economies of scale in the production of holographic displays have not yet been achieved, they are costly. This high production cost frequently translates into a high price for end-users, making it difficult for many individuals to acquire holographic displays.
Attempting to Create High-Quality Holograms
A further obstacle for the holographic display market is the scarcity of content that is optimized for this technology. While there have been numerous advancements in the creation of 3D content, creating content for holographic displays requires a keen eye for detail. To create the desired immersive experience, the content must be optimized for the holographic display's unique features, such as dimensionality and perspective.
Achieving Holographic Education Parity
It is not simple to create a holographic display capable of displaying high-quality, vibrant images. The technology underlying holographic displays necessitates a more complex production process and components than conventional displays, making it difficult to produce holographic displays that meet the industry's requirements.
Obstacles to Standardized Holographic Adoption
Due to a lack of understanding of the technology, numerous potential end-users have not yet adopted holographic displays. Many people are unfamiliar with holographic displays, and the learning curve for what they offer and how to use them is severe. This can hinder the technology's adoption in industries, such as education and marketing, where these displays could offer a unique experience.
Technology Analysis
The holographic display market has experienced tremendous growth in recent years, with the Electro Holographic Segment dominating the market in particular. This segment employs electro-photonic technology to generate high-quality holographic images, making it a popular option for a number of applications. This technology generates holographic images by controlling the interaction between light and electrons.
Emerging Economies' economic growth is another factor driving the adoption of Electro Holographic Segment. As these economies continue to develop and prosper, there is a growing demand for high-tech products, which has fuelled the growth of the holographic display market. In addition, the rise in living standards has enabled consumers in these nations to invest more heavily in cutting-edge consumer electronics, such as holographic displays.
Trends in consumer behavior and attitudes toward the Electro Holographic Segment have also played a substantial role in its success. Electro Holographic Segments provide the unique and immersive experiences that consumers seek today. This technology has piqued the interest of consumers worldwide due to its ability to generate three-dimensional, realistic images.
Product Type Analysis
In the holographic display market, the Digital Signage Segment is the dominant player. This technology creates high-quality images using LED backlights, making it a popular choice for advertising and marketing. The demand for digital signage displays continues to increase as a growing number of businesses pursue innovative advertising strategies.
Economic Development in Emerging Economies is driving the adoption of Digital Signage as companies seek to promote and market their products and services to a growing middle-class population. Businesses can reach their target audience, make their voices heard, and remain ahead of the competition by utilizing digital signage.
Consumer trends and behavior toward the Digital Signage Segment are characterized by ease of communication and convenience. Every day, consumers are exposed to digital signage displays in restaurants, retail stores, and public transportation facilities. Consumers are more likely to interact with these advertisements because these displays are effective at producing visually enticing and interactive communication.
Application Analysis
Due to the rising use of digitally-enhanced display systems in automobiles, the Automotive Segment represents a significant portion of the holographic display market. The primary function of the Holographic Display system in automobiles is to enhance the driver's view of the road ahead through augmented reality. The use of holographic displays in the automotive industry is anticipated to grow even more with the ongoing advancement of technology.
Economic Growth in Emerging Economies is also driving the Automotive Segment's adoption. With rising incomes and prosperity, there is a growing demand for high-tech automobiles, and the use of Holographic Display technology is also quickly gaining popularity in these regions.
Consumer trends and behavior toward the Automotive Segment have also played a substantial role in driving its growth. Modern consumers seek automobiles with sophisticated features and a superior driving experience. With Holographic Display technology, drivers can experience enhanced visibility, enhanced safety, and a more interactive user interface, all of which are at the forefront of consumers' minds when purchasing a new automobile.
Key Market Segments
By Technology Analysis
- Semi-Transparent/Electro Holographic
- Pistons
- Touchable
- Laser/Plasma
By Product Type Analysis
- Smart Television
- Digital Signage
- Medical scanner
- Camera
- Kiosks
By Application Analysis
- Automotive
- Consumer
- Commercial
- Medical
- Defense
- Industrial
Growth Opportunity
Increasing Demand for Holographic Displays Creates Opportunities and Growth
Once the domain of science fiction, holographic displays are rapidly becoming a reality. These displays use light to generate images and videos that are incredibly realistic and immersive, and they have tremendous potential across industries. With the proliferation of augmented reality (AR) and virtual reality (VR) applications, the demand for holographic displays is on the rise.
The Automotive Industry Accepts Innovative Holographic Displays for Design
The automotive industry is a leading adopter of holographic displays, using them for prototyping and design. Holographic displays allow designers to view 3D renderings of their products, making the design process more effective and efficient. It also facilitates improved collaboration between teams, resulting in higher-quality outcomes. As autonomous vehicles become more prevalent, the demand for immersive displays will continue to rise.
Medical Imaging and Education Are Revolutionized by Holographic Displays
Medical professionals are increasingly using holographic displays for imaging and education. These displays enable physicians to view 3D models of their patient's organs, allowing for enhanced visualization and more precise diagnosis. In education, holographic displays provide students with an immersive experience, making learning more engaging and interactive. As the demand for medical technology and education continues to rise, holographic displays will become increasingly necessary.
Holographic Displays Are an Essential Element of AR and VR Experiences
With consumers and businesses using them for a range of purposes, AR and VR applications are on the rise. From gaming to education to ad campaigns, AR and VR provide immersive experiences that captivate and influence users. Holographic displays are an integral part of augmented reality and virtual reality, making them a sought-after technology.
Accessibility Is Driven by Advances in Holographic Display Technology
Companies are investing in research and development to enhance holographic display technology in order to meet rising demand. This includes enhancing the displays' resolution, luminosity, and contrast, as well as making their production more cost-effective. Holographic displays will become more accessible to a larger audience thanks to advancements in technology and reduced costs.
3D Holographic Displays Transform Retail and Advertising
Advertising and retail are adopting 3D holographic displays as an effective marketing tool. These displays offer a novel method for showcasing products and services, thereby creating an immersive and engaging experience for consumers. Additionally, holographic displays enable businesses to distinguish themselves from competitors, thereby enhancing brand awareness and recognition.
Latest Trends
Holographic Displays Drive Innovation in Entertainment
Currently, the holographic display market is experiencing a surge of growth and expansion on multiple fronts. A variety of factors, such as advancements in technology, the increasing adoption of augmented reality and virtual reality applications, and the prevalence of holographic displays in various industries, have played a significant role in shaping the market.
Holographic Screens Revolutionize Consumer Electronics
Entertainment is one of the most rapidly expanding markets for holographic displays. In theaters and concert halls, holographic displays are used to enhance the viewing experience for audiences. By projecting 3D images onto a transparent screen, holographic displays generate a one-of-a-kind, interactive visual experience.
Expanding Holographic Display Market Presence
The adoption of holographic displays has also increased in the smartphone and consumer electronics industries. Smartphone manufacturers have begun implementing holographic displays in response to the growing demand for immersive visual experiences. Holographic displays provide gamers and moviegoers with a more immersive experience.
Holographic Displays Transform Military Consciousness
In addition to smartphones, holographic displays can also be found on tablets and laptops. This trend is anticipated to continue as manufacturers seek to differentiate their products in an increasingly competitive market.
Technological Advances Boost the Market for Holographic Displays
The military and defense sectors are also experiencing growth in the holographic display market. Holographic displays are used to enhance combatants' and pilots' situational awareness. Holographic displays provide a more comprehensive view of the battlefield by projecting real-time data onto a transparent screen.
3D Holographic Displays Revolutionize Marketing and Retail
The growth of the holographic display market has been significantly influenced by technological advancements. Holographic displays are becoming more accessible and affordable as technology advances. This has increased the adoption of AR and VR applications that significantly rely on holographic displays.
Holographic Displays Facilitate Entertaining Visual Experiences
Advertising and retail are both experiencing an increase in demand for 3D holographic displays. Holographic displays are being used in retail contexts to create interactive product displays that engage customers and enhance the retail experience. Holographic displays are used in advertising to produce eye-catching and attention-grabbing ads.
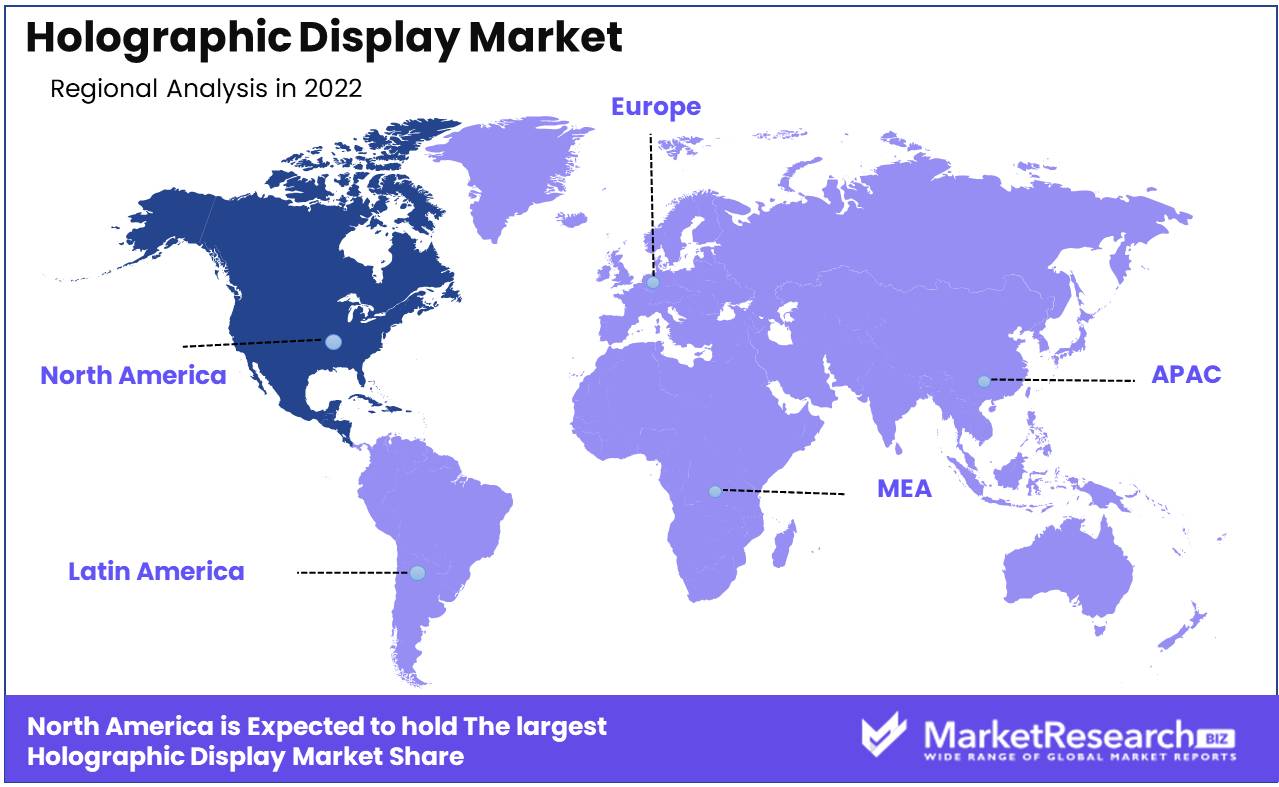
Regional Analysis
Augmented Reality (AR) and Virtual Reality (VR) continue to gain traction in the entertainment and gaming industries of North America. As more and more technology companies adopt this cutting-edge technology, holographic displays are becoming more and more popular. The future of amusement and gaming will be profoundly influenced by these technologies, according to industry leaders, given their rapid expansion.
AR and VR technologies provide users with an immersive and interactive experience by merging the virtual and real worlds. Holographic displays enhance this experience by creating a floating, three-dimensional image. This technology also permits the creation of virtual objects that can be moved and interacted with in previously unseen ways.
The gaming industry is one area where these technologies are being utilized increasingly. Numerous industry specialists believe that augmented reality (AR) and virtual reality (VR) will revolutionize the gaming industry by creating more immersive and interactive gameplay.
Additionally, the entertainment industry is adopting AR and VR technologies. Using AR and VR, movie theaters are creating promotional content and interactive experiences for moviegoers before and after standard movie screenings. In addition, these technologies are used to create immersive experiences for a variety of media, including television programs and concerts.
The adoption of holographic displays in AR and VR technologies is largely responsible for the industry's current momentum. This technology is distinctive in that it generates a 3D holographic image without the need for special spectacles. Consequently, the 3D holographic image can be viewed by users without the need for additional apparatus.
Key Regions and Countries
North America
- US
- Canada
- Mexico
Western Europe
- Germany
- France
- The UK
- Spain
- Italy
- Portugal
- Ireland
- Austria
- Switzerland
- Benelux
- Nordic
- Rest of Western Europe
Eastern Europe
- Russia
- Poland
- The Czech Republic
- Greece
- Rest of Eastern Europe
APAC
- China
- Japan
- South Korea
- India
- Australia & New Zealand
- Indonesia
- Malaysia
- Philippines
- Singapore
- Thailand
- Vietnam
- Rest of APAC
Latin America
- Brazil
- Colombia
- Chile
- Argentina
- Costa Rica
- Rest of Latin America
Middle East & Africa
- Algeria
- Egypt
- Israel
- Kuwait
- Nigeria
- Saudi Arabia
- South Africa
- Turkey
- United Arab Emirates
- Rest of MEA
Key Players Analysis
The holographic display market is a nascent market that is undergoing rapid development and is marked by intense competition among key players. In this market segment, these players are pioneering the creation, development, and sale of cutting-edge products.
Zebra Imaging, a company that specializes in producing holographic displays of military maps and terrain data for the U.S. Department of Defense, is one of the key players. Holoxica Limited, a developer of holographic displays for medical and scientific research applications, is another significant market player. Other notable players include RealView Imaging, Light Logics, and EvoVRL.
Microsoft has been a significant player in the development of holographic displays, having created the HoloLens, a device that uses holographic technology for mixed reality. The device has been highly successful and has applications in disciplines such as medicine, engineering, and education.
Apple is another major player interested in the holographic display market; the company has filed several patents related to holographic technology. In the coming years, the company is expected to release a holographic display device.
In general, the holographic display market is highly competitive and is expected to expand significantly over the next few years. To remain competitive in this highly competitive market, the key players in this market segment are constantly developing and releasing new products.
Top Key Players in Holographic Display Market
- AV Concepts, Inc.
- EON Reality, Inc.
- Konica Minolta, Inc.
- QUALCOMM Incorporated
- Zebra Imaging, Inc.
- Holoxica Limited
- Musion Das Hologram Ltd.
- Provision Holding, Inc.
- Realview Imaging Ltd.
- ViewSonic Corporation
- Light Logics
- EvoVRL
- Apple
- Microsoft
Recent Development
- In March 2023, Sony released their novel holographic display technology for medical imaging applications.
- In February 2023, Intel introduced a novel holographic display technology designed specifically for the automotive industry.
- In January 2023, Samsung unveiled its new holographic display technology for smartphones and other consumer electronics.
- In December 2022, Microsoft unveiled its new holographic display technology gaming and entertainment products.
- In November 2022, Apple announced the launch of its new holographic display technology for use in impending products.
Report Scope
Report Features Description Market Value (2022) USD 7.9 Bn Forecast Revenue (2032) USD 81.2 Bn CAGR (2023-2032) 27% Base Year for Estimation 2022 Historic Period 2016-2022 Forecast Period 2023-2032 Report Coverage Revenue Forecast, Market Dynamics, COVID-19 Impact, Competitive Landscape, Recent Developments Segments Covered By Technology Analysis (Semi-Transparent/Electro Holographic, Pistons, Touchable, Laser/Plasma), By Product Type Analysis (Smart Television, Digital Signage, Medical scanner, Camera, Kiosks), By Application Analysis (Automotive, Consumer, Commercial, Defence, Industrial) Regional Analysis North America – The US, Canada, & Mexico; Western Europe – Germany, France, The UK, Spain, Italy, Portugal, Ireland, Austria, Switzerland, Benelux, Nordic, & Rest of Western Europe; Eastern Europe – Russia, Poland, The Czech Republic, Greece, & Rest of Eastern Europe; APAC – China, Japan, South Korea, India, Australia & New Zealand, Indonesia, Malaysia, Philippines, Singapore, Thailand, Vietnam, & Rest of APAC; Latin America – Brazil, Colombia, Chile, Argentina, Costa Rica, & Rest of Latin America; Middle East & Africa – Algeria, Egypt, Israel, Kuwait, Nigeria, Saudi Arabia, South Africa, Turkey, United Arab Emirates, & Rest of MEA Competitive Landscape AV Concepts, Inc., EON Reality, Inc., Konica Minolta, Inc., QUALCOMM Incorporated, Zebra Imaging, Inc., Holoxica Limited, Musion Das Hologram Ltd., Provision Holding, Inc., Realview Imaging Ltd., ViewSonic Corporation, Light Logics, EvoVRL, Apple, Microsoft Customization Scope Customization for segments, region/country-level will be provided. Moreover, additional customization can be done based on the requirements. Purchase Options We have three licenses to opt for: Single User License, Multi-User License (Up to 5 Users), Corporate Use License (Unlimited User and Printable PDF) -
- 1. Executive Summary
- 1.1. Definition
- 1.2. Taxonomy
- 1.3. Research Scope
- 1.4. Key Analysis
- 1.5. Key Findings by Major Segments
- 1.6. Top strategies by Major Players
- 2. Global Holographic Display Market Overview
- 2.1. Holographic Display Market Dynamics
- 2.1.1. Drivers
- 2.1.2. Opportunities
- 2.1.3. Restraints
- 2.1.4. Challenges
- 2.2. Macro-economic Factors
- 2.3. Regulatory Framework
- 2.4. Market Investment Feasibility Index
- 2.5. PEST Analysis
- 2.6. PORTER’S Five Force Analysis
- 2.7. Drivers & Restraints Impact Analysis
- 2.8. Industry Chain Analysis
- 2.9. Cost Structure Analysis
- 2.10. Marketing Strategy
- 2.11. Russia-Ukraine War Impact Analysis
- 2.12. Opportunity Map Analysis
- 2.13. Market Competition Scenario Analysis
- 2.14. Product Life Cycle Analysis
- 2.15. Opportunity Orbits
- 2.16. Manufacturer Intensity Map
- 2.17. Major Companies sales by Value & Volume
- 2.1. Holographic Display Market Dynamics
- 3. Global Holographic Display Market Analysis, Opportunity and Forecast, 2016-2032
- 3.1. Global Holographic Display Market Analysis, 2016-2021
- 3.2. Global Holographic Display Market Opportunity and Forecast, 2023-2032
- 3.3. Global Holographic Display Market Analysis, Opportunity and Forecast, By By Technology Analysis, 2016-2032
- 3.3.1. Global Holographic Display Market Analysis by By Technology Analysis: Introduction
- 3.3.2. Market Size Absolute $ Opportunity Analysis and Forecast, By By Technology Analysis, 2016-2032
- 3.3.3. Semi-Transparent/Electro Holographic
- 3.3.4. Pistons
- 3.3.5. Touchable
- 3.3.6. Laser/Plasma
- 3.4. Global Holographic Display Market Analysis, Opportunity and Forecast, By By Product Type Analysis, 2016-2032
- 3.4.1. Global Holographic Display Market Analysis by By Product Type Analysis: Introduction
- 3.4.2. Market Size Absolute $ Opportunity Analysis and Forecast, By By Product Type Analysis, 2016-2032
- 3.4.3. Smart Television
- 3.4.4. Digital Signage
- 3.4.5. Medical scanner
- 3.4.6. Camera
- 3.4.7. Kiosks
- 3.5. Global Holographic Display Market Analysis, Opportunity and Forecast, By By Application Analysis, 2016-2032
- 3.5.1. Global Holographic Display Market Analysis by By Application Analysis: Introduction
- 3.5.2. Market Size Absolute $ Opportunity Analysis and Forecast, By By Application Analysis, 2016-2032
- 3.5.3. Automotive
- 3.5.4. Consumer
- 3.5.5. Commercial
- 3.5.6. Medical
- 3.5.7. Defense
- 3.5.8. Industrial
- 4. North America Holographic Display Market Analysis, Opportunity and Forecast, 2016-2032
- 4.1. North America Holographic Display Market Analysis, 2016-2021
- 4.2. North America Holographic Display Market Opportunity and Forecast, 2023-2032
- 4.3. North America Holographic Display Market Analysis, Opportunity and Forecast, By By Technology Analysis, 2016-2032
- 4.3.1. North America Holographic Display Market Analysis by By Technology Analysis: Introduction
- 4.3.2. Market Size Absolute $ Opportunity Analysis and Forecast, By By Technology Analysis, 2016-2032
- 4.3.3. Semi-Transparent/Electro Holographic
- 4.3.4. Pistons
- 4.3.5. Touchable
- 4.3.6. Laser/Plasma
- 4.4. North America Holographic Display Market Analysis, Opportunity and Forecast, By By Product Type Analysis, 2016-2032
- 4.4.1. North America Holographic Display Market Analysis by By Product Type Analysis: Introduction
- 4.4.2. Market Size Absolute $ Opportunity Analysis and Forecast, By By Product Type Analysis, 2016-2032
- 4.4.3. Smart Television
- 4.4.4. Digital Signage
- 4.4.5. Medical scanner
- 4.4.6. Camera
- 4.4.7. Kiosks
- 4.5. North America Holographic Display Market Analysis, Opportunity and Forecast, By By Application Analysis, 2016-2032
- 4.5.1. North America Holographic Display Market Analysis by By Application Analysis: Introduction
- 4.5.2. Market Size Absolute $ Opportunity Analysis and Forecast, By By Application Analysis, 2016-2032
- 4.5.3. Automotive
- 4.5.4. Consumer
- 4.5.5. Commercial
- 4.5.6. Medical
- 4.5.7. Defense
- 4.5.8. Industrial
- 4.6. North America Holographic Display Market Analysis, Opportunity and Forecast, By Country , 2016-2032
- 4.6.1. North America Holographic Display Market Analysis by Country : Introduction
- 4.6.2. Market Size Absolute $ Opportunity Analysis and Forecast, Country , 2016-2032
- 4.6.2.1. The US
- 4.6.2.2. Canada
- 4.6.2.3. Mexico
- 5. Western Europe Holographic Display Market Analysis, Opportunity and Forecast, 2016-2032
- 5.1. Western Europe Holographic Display Market Analysis, 2016-2021
- 5.2. Western Europe Holographic Display Market Opportunity and Forecast, 2023-2032
- 5.3. Western Europe Holographic Display Market Analysis, Opportunity and Forecast, By By Technology Analysis, 2016-2032
- 5.3.1. Western Europe Holographic Display Market Analysis by By Technology Analysis: Introduction
- 5.3.2. Market Size Absolute $ Opportunity Analysis and Forecast, By By Technology Analysis, 2016-2032
- 5.3.3. Semi-Transparent/Electro Holographic
- 5.3.4. Pistons
- 5.3.5. Touchable
- 5.3.6. Laser/Plasma
- 5.4. Western Europe Holographic Display Market Analysis, Opportunity and Forecast, By By Product Type Analysis, 2016-2032
- 5.4.1. Western Europe Holographic Display Market Analysis by By Product Type Analysis: Introduction
- 5.4.2. Market Size Absolute $ Opportunity Analysis and Forecast, By By Product Type Analysis, 2016-2032
- 5.4.3. Smart Television
- 5.4.4. Digital Signage
- 5.4.5. Medical scanner
- 5.4.6. Camera
- 5.4.7. Kiosks
- 5.5. Western Europe Holographic Display Market Analysis, Opportunity and Forecast, By By Application Analysis, 2016-2032
- 5.5.1. Western Europe Holographic Display Market Analysis by By Application Analysis: Introduction
- 5.5.2. Market Size Absolute $ Opportunity Analysis and Forecast, By By Application Analysis, 2016-2032
- 5.5.3. Automotive
- 5.5.4. Consumer
- 5.5.5. Commercial
- 5.5.6. Medical
- 5.5.7. Defense
- 5.5.8. Industrial
- 5.6. Western Europe Holographic Display Market Analysis, Opportunity and Forecast, By Country , 2016-2032
- 5.6.1. Western Europe Holographic Display Market Analysis by Country : Introduction
- 5.6.2. Market Size Absolute $ Opportunity Analysis and Forecast, Country , 2016-2032
- 5.6.2.1. Germany
- 5.6.2.2. France
- 5.6.2.3. The UK
- 5.6.2.4. Spain
- 5.6.2.5. Italy
- 5.6.2.6. Portugal
- 5.6.2.7. Ireland
- 5.6.2.8. Austria
- 5.6.2.9. Switzerland
- 5.6.2.10. Benelux
- 5.6.2.11. Nordic
- 5.6.2.12. Rest of Western Europe
- 6. Eastern Europe Holographic Display Market Analysis, Opportunity and Forecast, 2016-2032
- 6.1. Eastern Europe Holographic Display Market Analysis, 2016-2021
- 6.2. Eastern Europe Holographic Display Market Opportunity and Forecast, 2023-2032
- 6.3. Eastern Europe Holographic Display Market Analysis, Opportunity and Forecast, By By Technology Analysis, 2016-2032
- 6.3.1. Eastern Europe Holographic Display Market Analysis by By Technology Analysis: Introduction
- 6.3.2. Market Size Absolute $ Opportunity Analysis and Forecast, By By Technology Analysis, 2016-2032
- 6.3.3. Semi-Transparent/Electro Holographic
- 6.3.4. Pistons
- 6.3.5. Touchable
- 6.3.6. Laser/Plasma
- 6.4. Eastern Europe Holographic Display Market Analysis, Opportunity and Forecast, By By Product Type Analysis, 2016-2032
- 6.4.1. Eastern Europe Holographic Display Market Analysis by By Product Type Analysis: Introduction
- 6.4.2. Market Size Absolute $ Opportunity Analysis and Forecast, By By Product Type Analysis, 2016-2032
- 6.4.3. Smart Television
- 6.4.4. Digital Signage
- 6.4.5. Medical scanner
- 6.4.6. Camera
- 6.4.7. Kiosks
- 6.5. Eastern Europe Holographic Display Market Analysis, Opportunity and Forecast, By By Application Analysis, 2016-2032
- 6.5.1. Eastern Europe Holographic Display Market Analysis by By Application Analysis: Introduction
- 6.5.2. Market Size Absolute $ Opportunity Analysis and Forecast, By By Application Analysis, 2016-2032
- 6.5.3. Automotive
- 6.5.4. Consumer
- 6.5.5. Commercial
- 6.5.6. Medical
- 6.5.7. Defense
- 6.5.8. Industrial
- 6.6. Eastern Europe Holographic Display Market Analysis, Opportunity and Forecast, By Country , 2016-2032
- 6.6.1. Eastern Europe Holographic Display Market Analysis by Country : Introduction
- 6.6.2. Market Size Absolute $ Opportunity Analysis and Forecast, Country , 2016-2032
- 6.6.2.1. Russia
- 6.6.2.2. Poland
- 6.6.2.3. The Czech Republic
- 6.6.2.4. Greece
- 6.6.2.5. Rest of Eastern Europe
- 7. APAC Holographic Display Market Analysis, Opportunity and Forecast, 2016-2032
- 7.1. APAC Holographic Display Market Analysis, 2016-2021
- 7.2. APAC Holographic Display Market Opportunity and Forecast, 2023-2032
- 7.3. APAC Holographic Display Market Analysis, Opportunity and Forecast, By By Technology Analysis, 2016-2032
- 7.3.1. APAC Holographic Display Market Analysis by By Technology Analysis: Introduction
- 7.3.2. Market Size Absolute $ Opportunity Analysis and Forecast, By By Technology Analysis, 2016-2032
- 7.3.3. Semi-Transparent/Electro Holographic
- 7.3.4. Pistons
- 7.3.5. Touchable
- 7.3.6. Laser/Plasma
- 7.4. APAC Holographic Display Market Analysis, Opportunity and Forecast, By By Product Type Analysis, 2016-2032
- 7.4.1. APAC Holographic Display Market Analysis by By Product Type Analysis: Introduction
- 7.4.2. Market Size Absolute $ Opportunity Analysis and Forecast, By By Product Type Analysis, 2016-2032
- 7.4.3. Smart Television
- 7.4.4. Digital Signage
- 7.4.5. Medical scanner
- 7.4.6. Camera
- 7.4.7. Kiosks
- 7.5. APAC Holographic Display Market Analysis, Opportunity and Forecast, By By Application Analysis, 2016-2032
- 7.5.1. APAC Holographic Display Market Analysis by By Application Analysis: Introduction
- 7.5.2. Market Size Absolute $ Opportunity Analysis and Forecast, By By Application Analysis, 2016-2032
- 7.5.3. Automotive
- 7.5.4. Consumer
- 7.5.5. Commercial
- 7.5.6. Medical
- 7.5.7. Defense
- 7.5.8. Industrial
- 7.6. APAC Holographic Display Market Analysis, Opportunity and Forecast, By Country , 2016-2032
- 7.6.1. APAC Holographic Display Market Analysis by Country : Introduction
- 7.6.2. Market Size Absolute $ Opportunity Analysis and Forecast, Country , 2016-2032
- 7.6.2.1. China
- 7.6.2.2. Japan
- 7.6.2.3. South Korea
- 7.6.2.4. India
- 7.6.2.5. Australia & New Zeland
- 7.6.2.6. Indonesia
- 7.6.2.7. Malaysia
- 7.6.2.8. Philippines
- 7.6.2.9. Singapore
- 7.6.2.10. Thailand
- 7.6.2.11. Vietnam
- 7.6.2.12. Rest of APAC
- 8. Latin America Holographic Display Market Analysis, Opportunity and Forecast, 2016-2032
- 8.1. Latin America Holographic Display Market Analysis, 2016-2021
- 8.2. Latin America Holographic Display Market Opportunity and Forecast, 2023-2032
- 8.3. Latin America Holographic Display Market Analysis, Opportunity and Forecast, By By Technology Analysis, 2016-2032
- 8.3.1. Latin America Holographic Display Market Analysis by By Technology Analysis: Introduction
- 8.3.2. Market Size Absolute $ Opportunity Analysis and Forecast, By By Technology Analysis, 2016-2032
- 8.3.3. Semi-Transparent/Electro Holographic
- 8.3.4. Pistons
- 8.3.5. Touchable
- 8.3.6. Laser/Plasma
- 8.4. Latin America Holographic Display Market Analysis, Opportunity and Forecast, By By Product Type Analysis, 2016-2032
- 8.4.1. Latin America Holographic Display Market Analysis by By Product Type Analysis: Introduction
- 8.4.2. Market Size Absolute $ Opportunity Analysis and Forecast, By By Product Type Analysis, 2016-2032
- 8.4.3. Smart Television
- 8.4.4. Digital Signage
- 8.4.5. Medical scanner
- 8.4.6. Camera
- 8.4.7. Kiosks
- 8.5. Latin America Holographic Display Market Analysis, Opportunity and Forecast, By By Application Analysis, 2016-2032
- 8.5.1. Latin America Holographic Display Market Analysis by By Application Analysis: Introduction
- 8.5.2. Market Size Absolute $ Opportunity Analysis and Forecast, By By Application Analysis, 2016-2032
- 8.5.3. Automotive
- 8.5.4. Consumer
- 8.5.5. Commercial
- 8.5.6. Medical
- 8.5.7. Defense
- 8.5.8. Industrial
- 8.6. Latin America Holographic Display Market Analysis, Opportunity and Forecast, By Country , 2016-2032
- 8.6.1. Latin America Holographic Display Market Analysis by Country : Introduction
- 8.6.2. Market Size Absolute $ Opportunity Analysis and Forecast, Country , 2016-2032
- 8.6.2.1. Brazil
- 8.6.2.2. Colombia
- 8.6.2.3. Chile
- 8.6.2.4. Argentina
- 8.6.2.5. Costa Rica
- 8.6.2.6. Rest of Latin America
- 9. Middle East & Africa Holographic Display Market Analysis, Opportunity and Forecast, 2016-2032
- 9.1. Middle East & Africa Holographic Display Market Analysis, 2016-2021
- 9.2. Middle East & Africa Holographic Display Market Opportunity and Forecast, 2023-2032
- 9.3. Middle East & Africa Holographic Display Market Analysis, Opportunity and Forecast, By By Technology Analysis, 2016-2032
- 9.3.1. Middle East & Africa Holographic Display Market Analysis by By Technology Analysis: Introduction
- 9.3.2. Market Size Absolute $ Opportunity Analysis and Forecast, By By Technology Analysis, 2016-2032
- 9.3.3. Semi-Transparent/Electro Holographic
- 9.3.4. Pistons
- 9.3.5. Touchable
- 9.3.6. Laser/Plasma
- 9.4. Middle East & Africa Holographic Display Market Analysis, Opportunity and Forecast, By By Product Type Analysis, 2016-2032
- 9.4.1. Middle East & Africa Holographic Display Market Analysis by By Product Type Analysis: Introduction
- 9.4.2. Market Size Absolute $ Opportunity Analysis and Forecast, By By Product Type Analysis, 2016-2032
- 9.4.3. Smart Television
- 9.4.4. Digital Signage
- 9.4.5. Medical scanner
- 9.4.6. Camera
- 9.4.7. Kiosks
- 9.5. Middle East & Africa Holographic Display Market Analysis, Opportunity and Forecast, By By Application Analysis, 2016-2032
- 9.5.1. Middle East & Africa Holographic Display Market Analysis by By Application Analysis: Introduction
- 9.5.2. Market Size Absolute $ Opportunity Analysis and Forecast, By By Application Analysis, 2016-2032
- 9.5.3. Automotive
- 9.5.4. Consumer
- 9.5.5. Commercial
- 9.5.6. Medical
- 9.5.7. Defense
- 9.5.8. Industrial
- 9.6. Middle East & Africa Holographic Display Market Analysis, Opportunity and Forecast, By Country , 2016-2032
- 9.6.1. Middle East & Africa Holographic Display Market Analysis by Country : Introduction
- 9.6.2. Market Size Absolute $ Opportunity Analysis and Forecast, Country , 2016-2032
- 9.6.2.1. Algeria
- 9.6.2.2. Egypt
- 9.6.2.3. Israel
- 9.6.2.4. Kuwait
- 9.6.2.5. Nigeria
- 9.6.2.6. Saudi Arabia
- 9.6.2.7. South Africa
- 9.6.2.8. Turkey
- 9.6.2.9. The UAE
- 9.6.2.10. Rest of MEA
- 10. Global Holographic Display Market Analysis, Opportunity and Forecast, By Region , 2016-2032
- 10.1. Global Holographic Display Market Analysis by Region : Introduction
- 10.2. Market Size Absolute $ Opportunity Analysis and Forecast, By Region , 2016-2032
- 10.2.1. North America
- 10.2.2. Western Europe
- 10.2.3. Eastern Europe
- 10.2.4. APAC
- 10.2.5. Latin America
- 10.2.6. Middle East & Africa
- 11. Global Holographic Display Market Competitive Landscape, Market Share Analysis, and Company Profiles
- 11.1. Market Share Analysis
- 11.2. Company Profiles
- 11.3. AV Concepts, Inc.
- 11.3.1. Company Overview
- 11.3.2. Financial Highlights
- 11.3.3. Product Portfolio
- 11.3.4. SWOT Analysis
- 11.3.5. Key Strategies and Developments
- 11.4. EON Reality, Inc.
- 11.4.1. Company Overview
- 11.4.2. Financial Highlights
- 11.4.3. Product Portfolio
- 11.4.4. SWOT Analysis
- 11.4.5. Key Strategies and Developments
- 11.5. Konica Minolta, Inc.
- 11.5.1. Company Overview
- 11.5.2. Financial Highlights
- 11.5.3. Product Portfolio
- 11.5.4. SWOT Analysis
- 11.5.5. Key Strategies and Developments
- 11.6. QUALCOMM Incorporated
- 11.6.1. Company Overview
- 11.6.2. Financial Highlights
- 11.6.3. Product Portfolio
- 11.6.4. SWOT Analysis
- 11.6.5. Key Strategies and Developments
- 11.7. Zebra Imaging, Inc.
- 11.7.1. Company Overview
- 11.7.2. Financial Highlights
- 11.7.3. Product Portfolio
- 11.7.4. SWOT Analysis
- 11.7.5. Key Strategies and Developments
- 11.8. Holoxica Limited
- 11.8.1. Company Overview
- 11.8.2. Financial Highlights
- 11.8.3. Product Portfolio
- 11.8.4. SWOT Analysis
- 11.8.5. Key Strategies and Developments
- 11.9. Musion Das Hologram Ltd.
- 11.9.1. Company Overview
- 11.9.2. Financial Highlights
- 11.9.3. Product Portfolio
- 11.9.4. SWOT Analysis
- 11.9.5. Key Strategies and Developments
- 11.10. Provision Holding, Inc.
- 11.10.1. Company Overview
- 11.10.2. Financial Highlights
- 11.10.3. Product Portfolio
- 11.10.4. SWOT Analysis
- 11.10.5. Key Strategies and Developments
- 11.11. Realview Imaging Ltd.
- 11.11.1. Company Overview
- 11.11.2. Financial Highlights
- 11.11.3. Product Portfolio
- 11.11.4. SWOT Analysis
- 11.11.5. Key Strategies and Developments
- 11.12. ViewSonic Corporation
- 11.12.1. Company Overview
- 11.12.2. Financial Highlights
- 11.12.3. Product Portfolio
- 11.12.4. SWOT Analysis
- 11.12.5. Key Strategies and Developments
- 11.13. Light Logics
- 11.13.1. Company Overview
- 11.13.2. Financial Highlights
- 11.13.3. Product Portfolio
- 11.13.4. SWOT Analysis
- 11.13.5. Key Strategies and Developments
- 11.14. EvoVRL
- 11.14.1. Company Overview
- 11.14.2. Financial Highlights
- 11.14.3. Product Portfolio
- 11.14.4. SWOT Analysis
- 11.14.5. Key Strategies and Developments
- 11.15. Apple
- 11.15.1. Company Overview
- 11.15.2. Financial Highlights
- 11.15.3. Product Portfolio
- 11.15.4. SWOT Analysis
- 11.15.5. Key Strategies and Developments
- 11.16. Microsoft
- 11.16.1. Company Overview
- 11.16.2. Financial Highlights
- 11.16.3. Product Portfolio
- 11.16.4. SWOT Analysis
- 11.16.5. Key Strategies and Developments
- 12. Assumptions and Acronyms
- 13. Research Methodology
- 14. Contact
- List of Figures
- Figure 1: Global Holographic Display Market Revenue (US$ Mn) Market Share by Technology Analysis in 2022
- Figure 2: Global Holographic Display Market Attractiveness Analysis by Technology Analysis, 2016-2032
- Figure 3: Global Holographic Display Market Revenue (US$ Mn) Market Share by Product Type Analysisin 2022
- Figure 4: Global Holographic Display Market Attractiveness Analysis by Product Type Analysis, 2016-2032
- Figure 5: Global Holographic Display Market Revenue (US$ Mn) Market Share by Application Analysisin 2022
- Figure 6: Global Holographic Display Market Attractiveness Analysis by Application Analysis, 2016-2032
- Figure 7: Global Holographic Display Market Revenue (US$ Mn) Market Share by Region in 2022
- Figure 8: Global Holographic Display Market Attractiveness Analysis by Region, 2016-2032
- Figure 9: Global Holographic Display Market Revenue (US$ Mn) (2016-2032)
- Figure 10: Global Holographic Display Market Revenue (US$ Mn) Comparison by Region (2016-2032)
- Figure 11: Global Holographic Display Market Revenue (US$ Mn) Comparison by Technology Analysis (2016-2032)
- Figure 12: Global Holographic Display Market Revenue (US$ Mn) Comparison by Product Type Analysis (2016-2032)
- Figure 13: Global Holographic Display Market Revenue (US$ Mn) Comparison by Application Analysis (2016-2032)
- Figure 14: Global Holographic Display Market Y-o-Y Growth Rate Comparison by Region (2016-2032)
- Figure 15: Global Holographic Display Market Y-o-Y Growth Rate Comparison by Technology Analysis (2016-2032)
- Figure 16: Global Holographic Display Market Y-o-Y Growth Rate Comparison by Product Type Analysis (2016-2032)
- Figure 17: Global Holographic Display Market Y-o-Y Growth Rate Comparison by Application Analysis (2016-2032)
- Figure 18: Global Holographic Display Market Share Comparison by Region (2016-2032)
- Figure 19: Global Holographic Display Market Share Comparison by Technology Analysis (2016-2032)
- Figure 20: Global Holographic Display Market Share Comparison by Product Type Analysis (2016-2032)
- Figure 21: Global Holographic Display Market Share Comparison by Application Analysis (2016-2032)
- Figure 22: North America Holographic Display Market Revenue (US$ Mn) Market Share by Technology Analysisin 2022
- Figure 23: North America Holographic Display Market Attractiveness Analysis by Technology Analysis, 2016-2032
- Figure 24: North America Holographic Display Market Revenue (US$ Mn) Market Share by Product Type Analysisin 2022
- Figure 25: North America Holographic Display Market Attractiveness Analysis by Product Type Analysis, 2016-2032
- Figure 26: North America Holographic Display Market Revenue (US$ Mn) Market Share by Application Analysisin 2022
- Figure 27: North America Holographic Display Market Attractiveness Analysis by Application Analysis, 2016-2032
- Figure 28: North America Holographic Display Market Revenue (US$ Mn) Market Share by Country in 2022
- Figure 29: North America Holographic Display Market Attractiveness Analysis by Country, 2016-2032
- Figure 30: North America Holographic Display Market Revenue (US$ Mn) (2016-2032)
- Figure 31: North America Holographic Display Market Revenue (US$ Mn) Comparison by Country (2016-2032)
- Figure 32: North America Holographic Display Market Revenue (US$ Mn) Comparison by Technology Analysis (2016-2032)
- Figure 33: North America Holographic Display Market Revenue (US$ Mn) Comparison by Product Type Analysis (2016-2032)
- Figure 34: North America Holographic Display Market Revenue (US$ Mn) Comparison by Application Analysis (2016-2032)
- Figure 35: North America Holographic Display Market Y-o-Y Growth Rate Comparison by Country (2016-2032)
- Figure 36: North America Holographic Display Market Y-o-Y Growth Rate Comparison by Technology Analysis (2016-2032)
- Figure 37: North America Holographic Display Market Y-o-Y Growth Rate Comparison by Product Type Analysis (2016-2032)
- Figure 38: North America Holographic Display Market Y-o-Y Growth Rate Comparison by Application Analysis (2016-2032)
- Figure 39: North America Holographic Display Market Share Comparison by Country (2016-2032)
- Figure 40: North America Holographic Display Market Share Comparison by Technology Analysis (2016-2032)
- Figure 41: North America Holographic Display Market Share Comparison by Product Type Analysis (2016-2032)
- Figure 42: North America Holographic Display Market Share Comparison by Application Analysis (2016-2032)
- Figure 43: Western Europe Holographic Display Market Revenue (US$ Mn) Market Share by Technology Analysisin 2022
- Figure 44: Western Europe Holographic Display Market Attractiveness Analysis by Technology Analysis, 2016-2032
- Figure 45: Western Europe Holographic Display Market Revenue (US$ Mn) Market Share by Product Type Analysisin 2022
- Figure 46: Western Europe Holographic Display Market Attractiveness Analysis by Product Type Analysis, 2016-2032
- Figure 47: Western Europe Holographic Display Market Revenue (US$ Mn) Market Share by Application Analysisin 2022
- Figure 48: Western Europe Holographic Display Market Attractiveness Analysis by Application Analysis, 2016-2032
- Figure 49: Western Europe Holographic Display Market Revenue (US$ Mn) Market Share by Country in 2022
- Figure 50: Western Europe Holographic Display Market Attractiveness Analysis by Country, 2016-2032
- Figure 51: Western Europe Holographic Display Market Revenue (US$ Mn) (2016-2032)
- Figure 52: Western Europe Holographic Display Market Revenue (US$ Mn) Comparison by Country (2016-2032)
- Figure 53: Western Europe Holographic Display Market Revenue (US$ Mn) Comparison by Technology Analysis (2016-2032)
- Figure 54: Western Europe Holographic Display Market Revenue (US$ Mn) Comparison by Product Type Analysis (2016-2032)
- Figure 55: Western Europe Holographic Display Market Revenue (US$ Mn) Comparison by Application Analysis (2016-2032)
- Figure 56: Western Europe Holographic Display Market Y-o-Y Growth Rate Comparison by Country (2016-2032)
- Figure 57: Western Europe Holographic Display Market Y-o-Y Growth Rate Comparison by Technology Analysis (2016-2032)
- Figure 58: Western Europe Holographic Display Market Y-o-Y Growth Rate Comparison by Product Type Analysis (2016-2032)
- Figure 59: Western Europe Holographic Display Market Y-o-Y Growth Rate Comparison by Application Analysis (2016-2032)
- Figure 60: Western Europe Holographic Display Market Share Comparison by Country (2016-2032)
- Figure 61: Western Europe Holographic Display Market Share Comparison by Technology Analysis (2016-2032)
- Figure 62: Western Europe Holographic Display Market Share Comparison by Product Type Analysis (2016-2032)
- Figure 63: Western Europe Holographic Display Market Share Comparison by Application Analysis (2016-2032)
- Figure 64: Eastern Europe Holographic Display Market Revenue (US$ Mn) Market Share by Technology Analysisin 2022
- Figure 65: Eastern Europe Holographic Display Market Attractiveness Analysis by Technology Analysis, 2016-2032
- Figure 66: Eastern Europe Holographic Display Market Revenue (US$ Mn) Market Share by Product Type Analysisin 2022
- Figure 67: Eastern Europe Holographic Display Market Attractiveness Analysis by Product Type Analysis, 2016-2032
- Figure 68: Eastern Europe Holographic Display Market Revenue (US$ Mn) Market Share by Application Analysisin 2022
- Figure 69: Eastern Europe Holographic Display Market Attractiveness Analysis by Application Analysis, 2016-2032
- Figure 70: Eastern Europe Holographic Display Market Revenue (US$ Mn) Market Share by Country in 2022
- Figure 71: Eastern Europe Holographic Display Market Attractiveness Analysis by Country, 2016-2032
- Figure 72: Eastern Europe Holographic Display Market Revenue (US$ Mn) (2016-2032)
- Figure 73: Eastern Europe Holographic Display Market Revenue (US$ Mn) Comparison by Country (2016-2032)
- Figure 74: Eastern Europe Holographic Display Market Revenue (US$ Mn) Comparison by Technology Analysis (2016-2032)
- Figure 75: Eastern Europe Holographic Display Market Revenue (US$ Mn) Comparison by Product Type Analysis (2016-2032)
- Figure 76: Eastern Europe Holographic Display Market Revenue (US$ Mn) Comparison by Application Analysis (2016-2032)
- Figure 77: Eastern Europe Holographic Display Market Y-o-Y Growth Rate Comparison by Country (2016-2032)
- Figure 78: Eastern Europe Holographic Display Market Y-o-Y Growth Rate Comparison by Technology Analysis (2016-2032)
- Figure 79: Eastern Europe Holographic Display Market Y-o-Y Growth Rate Comparison by Product Type Analysis (2016-2032)
- Figure 80: Eastern Europe Holographic Display Market Y-o-Y Growth Rate Comparison by Application Analysis (2016-2032)
- Figure 81: Eastern Europe Holographic Display Market Share Comparison by Country (2016-2032)
- Figure 82: Eastern Europe Holographic Display Market Share Comparison by Technology Analysis (2016-2032)
- Figure 83: Eastern Europe Holographic Display Market Share Comparison by Product Type Analysis (2016-2032)
- Figure 84: Eastern Europe Holographic Display Market Share Comparison by Application Analysis (2016-2032)
- Figure 85: APAC Holographic Display Market Revenue (US$ Mn) Market Share by Technology Analysisin 2022
- Figure 86: APAC Holographic Display Market Attractiveness Analysis by Technology Analysis, 2016-2032
- Figure 87: APAC Holographic Display Market Revenue (US$ Mn) Market Share by Product Type Analysisin 2022
- Figure 88: APAC Holographic Display Market Attractiveness Analysis by Product Type Analysis, 2016-2032
- Figure 89: APAC Holographic Display Market Revenue (US$ Mn) Market Share by Application Analysisin 2022
- Figure 90: APAC Holographic Display Market Attractiveness Analysis by Application Analysis, 2016-2032
- Figure 91: APAC Holographic Display Market Revenue (US$ Mn) Market Share by Country in 2022
- Figure 92: APAC Holographic Display Market Attractiveness Analysis by Country, 2016-2032
- Figure 93: APAC Holographic Display Market Revenue (US$ Mn) (2016-2032)
- Figure 94: APAC Holographic Display Market Revenue (US$ Mn) Comparison by Country (2016-2032)
- Figure 95: APAC Holographic Display Market Revenue (US$ Mn) Comparison by Technology Analysis (2016-2032)
- Figure 96: APAC Holographic Display Market Revenue (US$ Mn) Comparison by Product Type Analysis (2016-2032)
- Figure 97: APAC Holographic Display Market Revenue (US$ Mn) Comparison by Application Analysis (2016-2032)
- Figure 98: APAC Holographic Display Market Y-o-Y Growth Rate Comparison by Country (2016-2032)
- Figure 99: APAC Holographic Display Market Y-o-Y Growth Rate Comparison by Technology Analysis (2016-2032)
- Figure 100: APAC Holographic Display Market Y-o-Y Growth Rate Comparison by Product Type Analysis (2016-2032)
- Figure 101: APAC Holographic Display Market Y-o-Y Growth Rate Comparison by Application Analysis (2016-2032)
- Figure 102: APAC Holographic Display Market Share Comparison by Country (2016-2032)
- Figure 103: APAC Holographic Display Market Share Comparison by Technology Analysis (2016-2032)
- Figure 104: APAC Holographic Display Market Share Comparison by Product Type Analysis (2016-2032)
- Figure 105: APAC Holographic Display Market Share Comparison by Application Analysis (2016-2032)
- Figure 106: Latin America Holographic Display Market Revenue (US$ Mn) Market Share by Technology Analysisin 2022
- Figure 107: Latin America Holographic Display Market Attractiveness Analysis by Technology Analysis, 2016-2032
- Figure 108: Latin America Holographic Display Market Revenue (US$ Mn) Market Share by Product Type Analysisin 2022
- Figure 109: Latin America Holographic Display Market Attractiveness Analysis by Product Type Analysis, 2016-2032
- Figure 110: Latin America Holographic Display Market Revenue (US$ Mn) Market Share by Application Analysisin 2022
- Figure 111: Latin America Holographic Display Market Attractiveness Analysis by Application Analysis, 2016-2032
- Figure 112: Latin America Holographic Display Market Revenue (US$ Mn) Market Share by Country in 2022
- Figure 113: Latin America Holographic Display Market Attractiveness Analysis by Country, 2016-2032
- Figure 114: Latin America Holographic Display Market Revenue (US$ Mn) (2016-2032)
- Figure 115: Latin America Holographic Display Market Revenue (US$ Mn) Comparison by Country (2016-2032)
- Figure 116: Latin America Holographic Display Market Revenue (US$ Mn) Comparison by Technology Analysis (2016-2032)
- Figure 117: Latin America Holographic Display Market Revenue (US$ Mn) Comparison by Product Type Analysis (2016-2032)
- Figure 118: Latin America Holographic Display Market Revenue (US$ Mn) Comparison by Application Analysis (2016-2032)
- Figure 119: Latin America Holographic Display Market Y-o-Y Growth Rate Comparison by Country (2016-2032)
- Figure 120: Latin America Holographic Display Market Y-o-Y Growth Rate Comparison by Technology Analysis (2016-2032)
- Figure 121: Latin America Holographic Display Market Y-o-Y Growth Rate Comparison by Product Type Analysis (2016-2032)
- Figure 122: Latin America Holographic Display Market Y-o-Y Growth Rate Comparison by Application Analysis (2016-2032)
- Figure 123: Latin America Holographic Display Market Share Comparison by Country (2016-2032)
- Figure 124: Latin America Holographic Display Market Share Comparison by Technology Analysis (2016-2032)
- Figure 125: Latin America Holographic Display Market Share Comparison by Product Type Analysis (2016-2032)
- Figure 126: Latin America Holographic Display Market Share Comparison by Application Analysis (2016-2032)
- Figure 127: Middle East & Africa Holographic Display Market Revenue (US$ Mn) Market Share by Technology Analysisin 2022
- Figure 128: Middle East & Africa Holographic Display Market Attractiveness Analysis by Technology Analysis, 2016-2032
- Figure 129: Middle East & Africa Holographic Display Market Revenue (US$ Mn) Market Share by Product Type Analysisin 2022
- Figure 130: Middle East & Africa Holographic Display Market Attractiveness Analysis by Product Type Analysis, 2016-2032
- Figure 131: Middle East & Africa Holographic Display Market Revenue (US$ Mn) Market Share by Application Analysisin 2022
- Figure 132: Middle East & Africa Holographic Display Market Attractiveness Analysis by Application Analysis, 2016-2032
- Figure 133: Middle East & Africa Holographic Display Market Revenue (US$ Mn) Market Share by Country in 2022
- Figure 134: Middle East & Africa Holographic Display Market Attractiveness Analysis by Country, 2016-2032
- Figure 135: Middle East & Africa Holographic Display Market Revenue (US$ Mn) (2016-2032)
- Figure 136: Middle East & Africa Holographic Display Market Revenue (US$ Mn) Comparison by Country (2016-2032)
- Figure 137: Middle East & Africa Holographic Display Market Revenue (US$ Mn) Comparison by Technology Analysis (2016-2032)
- Figure 138: Middle East & Africa Holographic Display Market Revenue (US$ Mn) Comparison by Product Type Analysis (2016-2032)
- Figure 139: Middle East & Africa Holographic Display Market Revenue (US$ Mn) Comparison by Application Analysis (2016-2032)
- Figure 140: Middle East & Africa Holographic Display Market Y-o-Y Growth Rate Comparison by Country (2016-2032)
- Figure 141: Middle East & Africa Holographic Display Market Y-o-Y Growth Rate Comparison by Technology Analysis (2016-2032)
- Figure 142: Middle East & Africa Holographic Display Market Y-o-Y Growth Rate Comparison by Product Type Analysis (2016-2032)
- Figure 143: Middle East & Africa Holographic Display Market Y-o-Y Growth Rate Comparison by Application Analysis (2016-2032)
- Figure 144: Middle East & Africa Holographic Display Market Share Comparison by Country (2016-2032)
- Figure 145: Middle East & Africa Holographic Display Market Share Comparison by Technology Analysis (2016-2032)
- Figure 146: Middle East & Africa Holographic Display Market Share Comparison by Product Type Analysis (2016-2032)
- Figure 147: Middle East & Africa Holographic Display Market Share Comparison by Application Analysis (2016-2032)
List of Tables
- Table 1: Global Holographic Display Market Comparison by Technology Analysis (2016-2032)
- Table 2: Global Holographic Display Market Comparison by Product Type Analysis (2016-2032)
- Table 3: Global Holographic Display Market Comparison by Application Analysis (2016-2032)
- Table 4: Global Holographic Display Market Revenue (US$ Mn) Comparison by Region (2016-2032)
- Table 5: Global Holographic Display Market Revenue (US$ Mn) (2016-2032)
- Table 6: Global Holographic Display Market Revenue (US$ Mn) Comparison by Region (2016-2032)
- Table 7: Global Holographic Display Market Revenue (US$ Mn) Comparison by Technology Analysis (2016-2032)
- Table 8: Global Holographic Display Market Revenue (US$ Mn) Comparison by Product Type Analysis (2016-2032)
- Table 9: Global Holographic Display Market Revenue (US$ Mn) Comparison by Application Analysis (2016-2032)
- Table 10: Global Holographic Display Market Y-o-Y Growth Rate Comparison by Region (2016-2032)
- Table 11: Global Holographic Display Market Y-o-Y Growth Rate Comparison by Technology Analysis (2016-2032)
- Table 12: Global Holographic Display Market Y-o-Y Growth Rate Comparison by Product Type Analysis (2016-2032)
- Table 13: Global Holographic Display Market Y-o-Y Growth Rate Comparison by Application Analysis (2016-2032)
- Table 14: Global Holographic Display Market Share Comparison by Region (2016-2032)
- Table 15: Global Holographic Display Market Share Comparison by Technology Analysis (2016-2032)
- Table 16: Global Holographic Display Market Share Comparison by Product Type Analysis (2016-2032)
- Table 17: Global Holographic Display Market Share Comparison by Application Analysis (2016-2032)
- Table 18: North America Holographic Display Market Comparison by Product Type Analysis (2016-2032)
- Table 19: North America Holographic Display Market Comparison by Application Analysis (2016-2032)
- Table 20: North America Holographic Display Market Revenue (US$ Mn) Comparison by Country (2016-2032)
- Table 21: North America Holographic Display Market Revenue (US$ Mn) (2016-2032)
- Table 22: North America Holographic Display Market Revenue (US$ Mn) Comparison by Country (2016-2032)
- Table 23: North America Holographic Display Market Revenue (US$ Mn) Comparison by Technology Analysis (2016-2032)
- Table 24: North America Holographic Display Market Revenue (US$ Mn) Comparison by Product Type Analysis (2016-2032)
- Table 25: North America Holographic Display Market Revenue (US$ Mn) Comparison by Application Analysis (2016-2032)
- Table 26: North America Holographic Display Market Y-o-Y Growth Rate Comparison by Country (2016-2032)
- Table 27: North America Holographic Display Market Y-o-Y Growth Rate Comparison by Technology Analysis (2016-2032)
- Table 28: North America Holographic Display Market Y-o-Y Growth Rate Comparison by Product Type Analysis (2016-2032)
- Table 29: North America Holographic Display Market Y-o-Y Growth Rate Comparison by Application Analysis (2016-2032)
- Table 30: North America Holographic Display Market Share Comparison by Country (2016-2032)
- Table 31: North America Holographic Display Market Share Comparison by Technology Analysis (2016-2032)
- Table 32: North America Holographic Display Market Share Comparison by Product Type Analysis (2016-2032)
- Table 33: North America Holographic Display Market Share Comparison by Application Analysis (2016-2032)
- Table 34: Western Europe Holographic Display Market Comparison by Technology Analysis (2016-2032)
- Table 35: Western Europe Holographic Display Market Comparison by Product Type Analysis (2016-2032)
- Table 36: Western Europe Holographic Display Market Comparison by Application Analysis (2016-2032)
- Table 37: Western Europe Holographic Display Market Revenue (US$ Mn) Comparison by Country (2016-2032)
- Table 38: Western Europe Holographic Display Market Revenue (US$ Mn) (2016-2032)
- Table 39: Western Europe Holographic Display Market Revenue (US$ Mn) Comparison by Country (2016-2032)
- Table 40: Western Europe Holographic Display Market Revenue (US$ Mn) Comparison by Technology Analysis (2016-2032)
- Table 41: Western Europe Holographic Display Market Revenue (US$ Mn) Comparison by Product Type Analysis (2016-2032)
- Table 42: Western Europe Holographic Display Market Revenue (US$ Mn) Comparison by Application Analysis (2016-2032)
- Table 43: Western Europe Holographic Display Market Y-o-Y Growth Rate Comparison by Country (2016-2032)
- Table 44: Western Europe Holographic Display Market Y-o-Y Growth Rate Comparison by Technology Analysis (2016-2032)
- Table 45: Western Europe Holographic Display Market Y-o-Y Growth Rate Comparison by Product Type Analysis (2016-2032)
- Table 46: Western Europe Holographic Display Market Y-o-Y Growth Rate Comparison by Application Analysis (2016-2032)
- Table 47: Western Europe Holographic Display Market Share Comparison by Country (2016-2032)
- Table 48: Western Europe Holographic Display Market Share Comparison by Technology Analysis (2016-2032)
- Table 49: Western Europe Holographic Display Market Share Comparison by Product Type Analysis (2016-2032)
- Table 50: Western Europe Holographic Display Market Share Comparison by Application Analysis (2016-2032)
- Table 51: Eastern Europe Holographic Display Market Comparison by Technology Analysis (2016-2032)
- Table 52: Eastern Europe Holographic Display Market Comparison by Product Type Analysis (2016-2032)
- Table 53: Eastern Europe Holographic Display Market Comparison by Application Analysis (2016-2032)
- Table 54: Eastern Europe Holographic Display Market Revenue (US$ Mn) Comparison by Country (2016-2032)
- Table 55: Eastern Europe Holographic Display Market Revenue (US$ Mn) (2016-2032)
- Table 56: Eastern Europe Holographic Display Market Revenue (US$ Mn) Comparison by Country (2016-2032)
- Table 57: Eastern Europe Holographic Display Market Revenue (US$ Mn) Comparison by Technology Analysis (2016-2032)
- Table 58: Eastern Europe Holographic Display Market Revenue (US$ Mn) Comparison by Product Type Analysis (2016-2032)
- Table 59: Eastern Europe Holographic Display Market Revenue (US$ Mn) Comparison by Application Analysis (2016-2032)
- Table 60: Eastern Europe Holographic Display Market Y-o-Y Growth Rate Comparison by Country (2016-2032)
- Table 61: Eastern Europe Holographic Display Market Y-o-Y Growth Rate Comparison by Technology Analysis (2016-2032)
- Table 62: Eastern Europe Holographic Display Market Y-o-Y Growth Rate Comparison by Product Type Analysis (2016-2032)
- Table 63: Eastern Europe Holographic Display Market Y-o-Y Growth Rate Comparison by Application Analysis (2016-2032)
- Table 64: Eastern Europe Holographic Display Market Share Comparison by Country (2016-2032)
- Table 65: Eastern Europe Holographic Display Market Share Comparison by Technology Analysis (2016-2032)
- Table 66: Eastern Europe Holographic Display Market Share Comparison by Product Type Analysis (2016-2032)
- Table 67: Eastern Europe Holographic Display Market Share Comparison by Application Analysis (2016-2032)
- Table 68: APAC Holographic Display Market Comparison by Technology Analysis (2016-2032)
- Table 69: APAC Holographic Display Market Comparison by Product Type Analysis (2016-2032)
- Table 70: APAC Holographic Display Market Comparison by Application Analysis (2016-2032)
- Table 71: APAC Holographic Display Market Revenue (US$ Mn) Comparison by Country (2016-2032)
- Table 72: APAC Holographic Display Market Revenue (US$ Mn) (2016-2032)
- Table 73: APAC Holographic Display Market Revenue (US$ Mn) Comparison by Country (2016-2032)
- Table 74: APAC Holographic Display Market Revenue (US$ Mn) Comparison by Technology Analysis (2016-2032)
- Table 75: APAC Holographic Display Market Revenue (US$ Mn) Comparison by Product Type Analysis (2016-2032)
- Table 76: APAC Holographic Display Market Revenue (US$ Mn) Comparison by Application Analysis (2016-2032)
- Table 77: APAC Holographic Display Market Y-o-Y Growth Rate Comparison by Country (2016-2032)
- Table 78: APAC Holographic Display Market Y-o-Y Growth Rate Comparison by Technology Analysis (2016-2032)
- Table 79: APAC Holographic Display Market Y-o-Y Growth Rate Comparison by Product Type Analysis (2016-2032)
- Table 80: APAC Holographic Display Market Y-o-Y Growth Rate Comparison by Application Analysis (2016-2032)
- Table 81: APAC Holographic Display Market Share Comparison by Country (2016-2032)
- Table 82: APAC Holographic Display Market Share Comparison by Technology Analysis (2016-2032)
- Table 83: APAC Holographic Display Market Share Comparison by Product Type Analysis (2016-2032)
- Table 84: APAC Holographic Display Market Share Comparison by Application Analysis (2016-2032)
- Table 85: Latin America Holographic Display Market Comparison by Technology Analysis (2016-2032)
- Table 86: Latin America Holographic Display Market Comparison by Product Type Analysis (2016-2032)
- Table 87: Latin America Holographic Display Market Comparison by Application Analysis (2016-2032)
- Table 88: Latin America Holographic Display Market Revenue (US$ Mn) Comparison by Country (2016-2032)
- Table 89: Latin America Holographic Display Market Revenue (US$ Mn) (2016-2032)
- Table 90: Latin America Holographic Display Market Revenue (US$ Mn) Comparison by Country (2016-2032)
- Table 91: Latin America Holographic Display Market Revenue (US$ Mn) Comparison by Technology Analysis (2016-2032)
- Table 92: Latin America Holographic Display Market Revenue (US$ Mn) Comparison by Product Type Analysis (2016-2032)
- Table 93: Latin America Holographic Display Market Revenue (US$ Mn) Comparison by Application Analysis (2016-2032)
- Table 94: Latin America Holographic Display Market Y-o-Y Growth Rate Comparison by Country (2016-2032)
- Table 95: Latin America Holographic Display Market Y-o-Y Growth Rate Comparison by Technology Analysis (2016-2032)
- Table 96: Latin America Holographic Display Market Y-o-Y Growth Rate Comparison by Product Type Analysis (2016-2032)
- Table 97: Latin America Holographic Display Market Y-o-Y Growth Rate Comparison by Application Analysis (2016-2032)
- Table 98: Latin America Holographic Display Market Share Comparison by Country (2016-2032)
- Table 99: Latin America Holographic Display Market Share Comparison by Technology Analysis (2016-2032)
- Table 100: Latin America Holographic Display Market Share Comparison by Product Type Analysis (2016-2032)
- Table 101: Latin America Holographic Display Market Share Comparison by Application Analysis (2016-2032)
- Table 102: Middle East & Africa Holographic Display Market Comparison by Technology Analysis (2016-2032)
- Table 103: Middle East & Africa Holographic Display Market Comparison by Product Type Analysis (2016-2032)
- Table 104: Middle East & Africa Holographic Display Market Comparison by Application Analysis (2016-2032)
- Table 105: Middle East & Africa Holographic Display Market Revenue (US$ Mn) Comparison by Country (2016-2032)
- Table 106: Middle East & Africa Holographic Display Market Revenue (US$ Mn) (2016-2032)
- Table 107: Middle East & Africa Holographic Display Market Revenue (US$ Mn) Comparison by Country (2016-2032)
- Table 108: Middle East & Africa Holographic Display Market Revenue (US$ Mn) Comparison by Technology Analysis (2016-2032)
- Table 109: Middle East & Africa Holographic Display Market Revenue (US$ Mn) Comparison by Product Type Analysis (2016-2032)
- Table 110: Middle East & Africa Holographic Display Market Revenue (US$ Mn) Comparison by Application Analysis (2016-2032)
- Table 111: Middle East & Africa Holographic Display Market Y-o-Y Growth Rate Comparison by Country (2016-2032)
- Table 112: Middle East & Africa Holographic Display Market Y-o-Y Growth Rate Comparison by Technology Analysis (2016-2032)
- Table 113: Middle East & Africa Holographic Display Market Y-o-Y Growth Rate Comparison by Product Type Analysis (2016-2032)
- Table 114: Middle East & Africa Holographic Display Market Y-o-Y Growth Rate Comparison by Application Analysis (2016-2032)
- Table 115: Middle East & Africa Holographic Display Market Share Comparison by Country (2016-2032)
- Table 116: Middle East & Africa Holographic Display Market Share Comparison by Technology Analysis (2016-2032)
- Table 117: Middle East & Africa Holographic Display Market Share Comparison by Product Type Analysis (2016-2032)
- Table 118: Middle East & Africa Holographic Display Market Share Comparison by Application Analysis (2016-2032)
- 1. Executive Summary
-
- AV Concepts, Inc.
- EON Reality, Inc.
- Konica Minolta, Inc.
- QUALCOMM Incorporated
- Zebra Imaging, Inc.
- Holoxica Limited
- Musion Das Hologram Ltd.
- Provision Holding, Inc.
- Realview Imaging Ltd.
- ViewSonic Corporation
- Light Logics
- EvoVRL
- Apple
- Microsoft
Our Clients


View Our Licence Options
