
Green Technology and Sustainability Market By Component (Solutions, Services), By Industry (Air and water pollution monitoring, Carbon footprint management, Crop monitoring, Fire detection, Forest monitoring, Green building, Others), By Technology (Internet of Things (IoT), Cloud Computing, Artificial Intelligence & Analytics, Digital Twin, Others), By Region And Companies - Industry Segment Outlook, Market Assessment, Competition Scenario, Trends, And Forecast 2024-2033
-
50980
-
September 2024
-
300
-


-
This report was compiled by Vishwa Gaul Vishwa is an experienced market research and consulting professional with over 8 years of expertise in the ICT industry, contributing to over 700 reports across telecommunications, software, hardware, and digital solutions. Correspondence Team Lead- ICT Linkedin | Detailed Market research Methodology Our methodology involves a mix of primary research, including interviews with leading mental health experts, and secondary research from reputable medical journals and databases. View Detailed Methodology Page
-
Quick Navigation
Report Overview
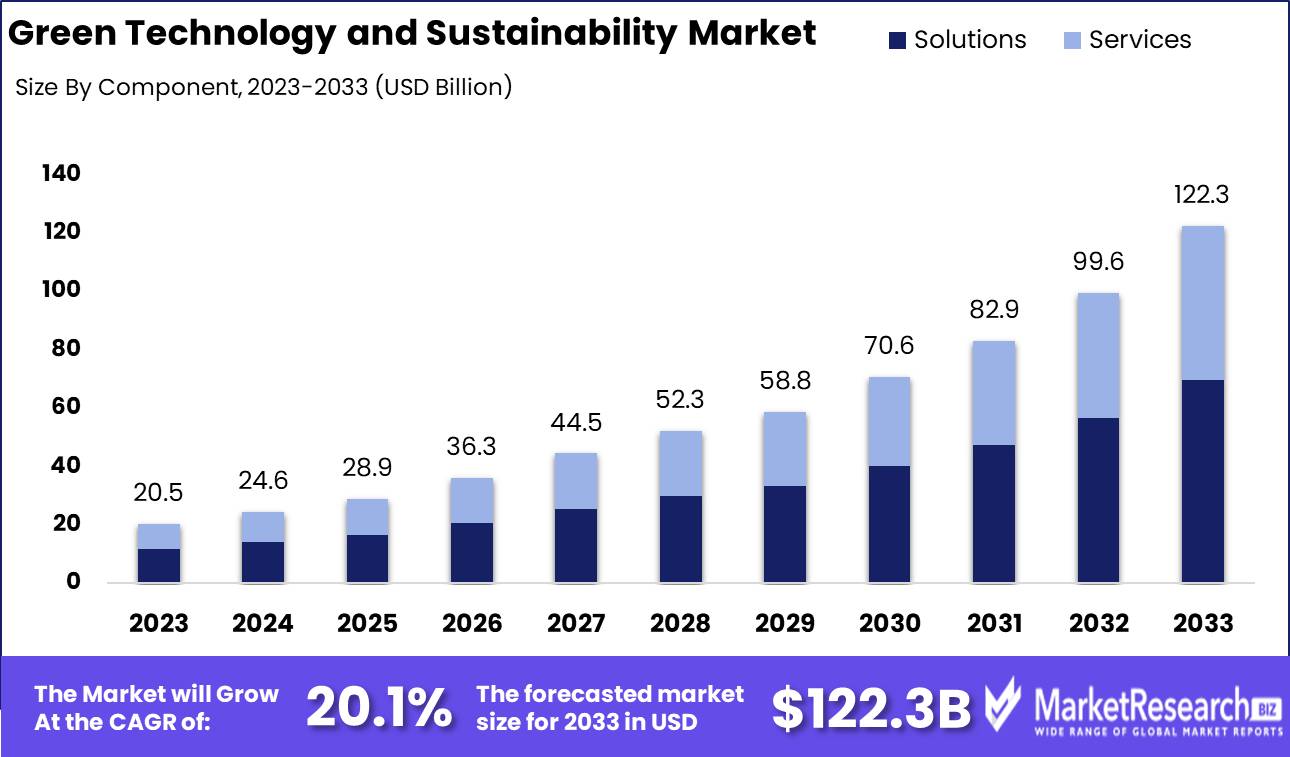
The Green Technology and Sustainability Market was valued at USD 20.5 billion in 2023. It is expected to reach USD 122.3 billion by 2033, with a CAGR of 20.1% during the forecast period from 2024 to 2033.
The Green Technology and Sustainability Market refers to the sector focused on the development and deployment of technologies that promote environmental sustainability by reducing carbon footprints, enhancing energy efficiency, and minimizing waste. This market encompasses renewable energy sources, electric vehicles, sustainable agriculture, water purification systems, and circular economy practices.
 The Green Technology and Sustainability Market is poised for substantial growth, driven by a confluence of factors that underscore its strategic importance across industries. Corporate sustainability initiatives are playing a pivotal role in advancing this market, as businesses increasingly prioritize environmental responsibility in response to stakeholder demand and regulatory pressures. Leading companies are incorporating sustainable practices, such as carbon neutrality and circular economy models, to enhance operational efficiency and brand reputation. This shift is creating significant opportunities for green technology solutions, which are becoming integral to achieving corporate sustainability goals.
Furthermore, advancements in renewable energy technologies, particularly in solar, wind, and energy storage systems, are transforming the energy landscape. These innovations are not only enhancing the efficiency and affordability of clean energy but also supporting the broader transition toward decarbonization across sectors.
However, despite these positive trends, the market faces challenges, particularly the high initial costs associated with green technology adoption. This barrier is especially pronounced in industries where cost sensitivity is critical, although long-term operational savings and regulatory incentives are expected to mitigate these concerns over time. Additionally, the rapid adoption of electric vehicles (EVs) is driving demand for sustainable infrastructure, such as charging stations and grid modernization, further fueling the market's growth. In summary, while high upfront investments remain a constraint, the Green Technology and Sustainability Market is positioned for robust expansion, supported by corporate sustainability efforts, technological advancements, and growing EV adoption. The market is expected to see increased investment as stakeholders recognize the long-term economic and environmental benefits of sustainable technologies.
Key Takeaways
- Market Growth: The Green Technology and Sustainability Market was valued at USD 20.5 billion in 2023. It is expected to reach USD 122.3 billion by 2033, with a CAGR of 20.1% during the forecast period from 2024 to 2033.
- By Component: Solutions dominated the Green Technology and Sustainability Market.
- By Industry: Air and water pollution monitoring dominated the green technology sector.
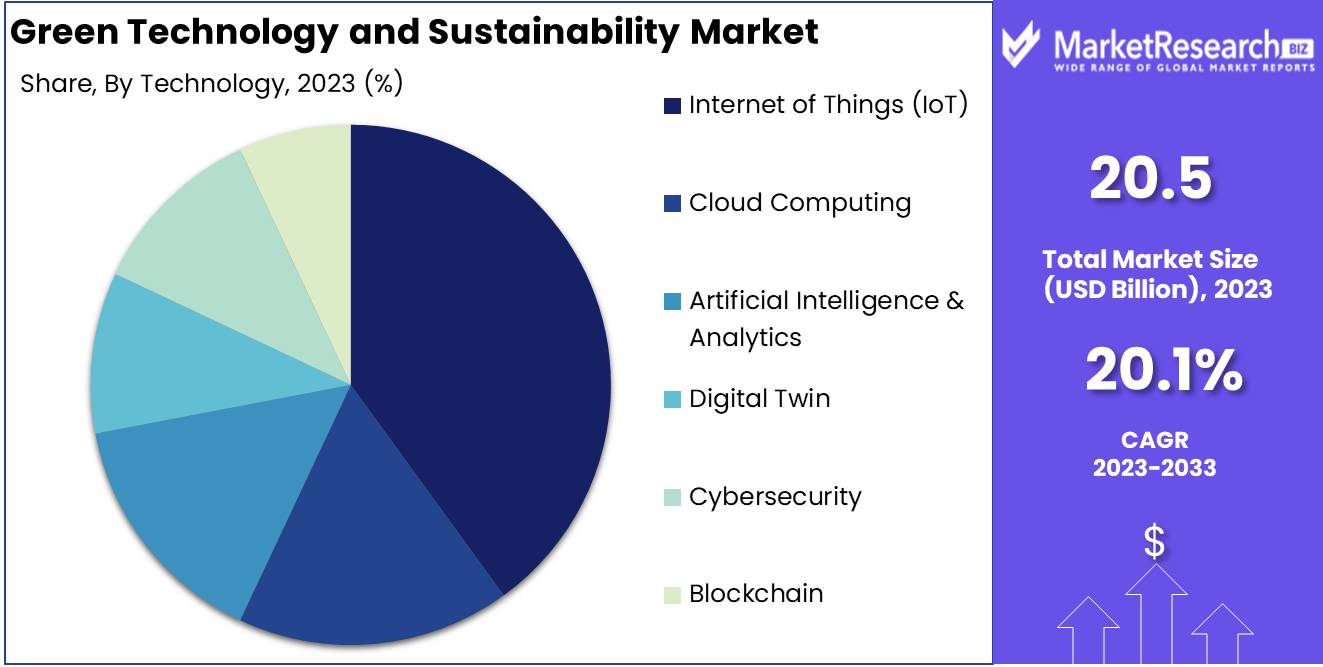
- By Technology: IoT dominated Green Technology, enhancing efficiency and sustainability.
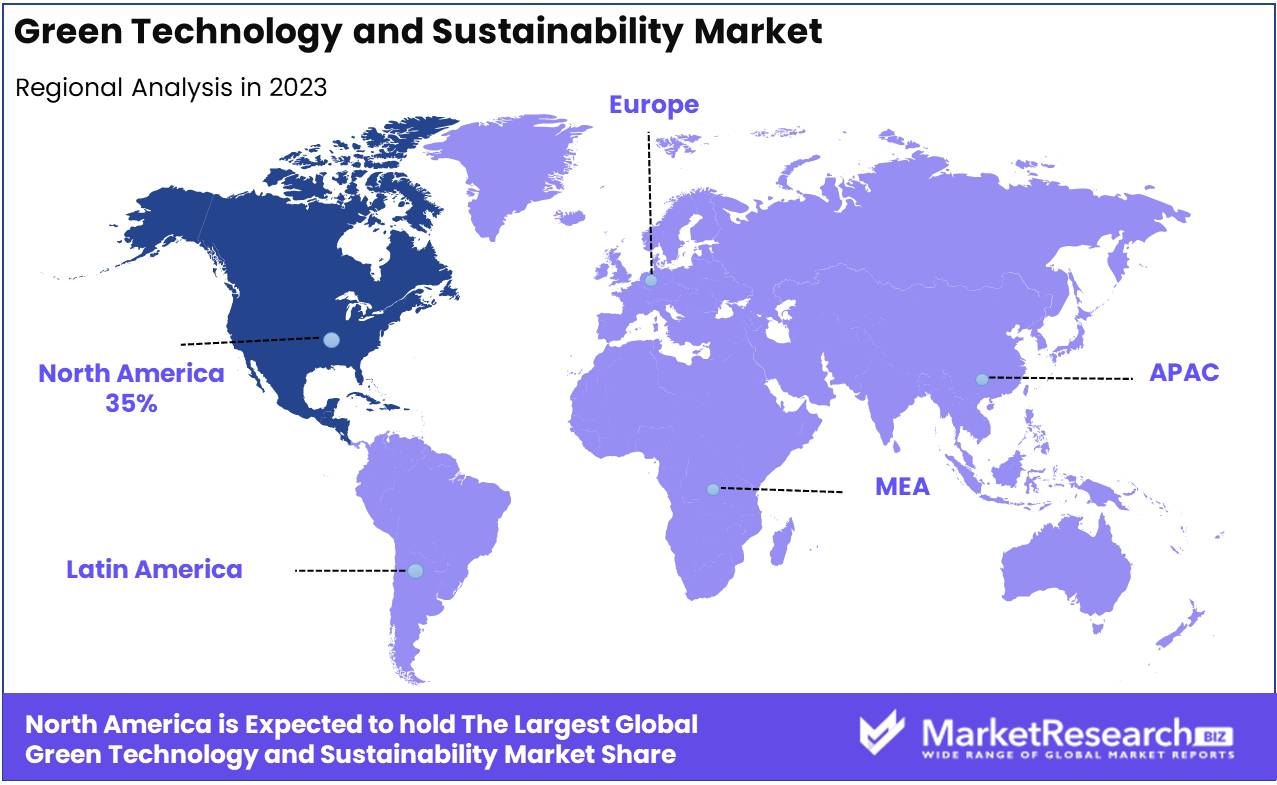
- Regional Dominance: North America dominates the Green Technology market with a 35% largest share.
- Growth Opportunity: The global green technology and sustainability market presents significant growth potential, driven by renewable energy integration and advanced waste management solutions, offering promising opportunities for investment and innovation.
Driving factors
Rising Environmental Concerns: A Core Driver of Market Growth
The Green Technology and Sustainability Market is significantly propelled by rising environmental concerns, as global awareness of the detrimental impacts of climate change, pollution, and resource depletion intensifies. Governments, businesses, and consumers are increasingly prioritizing environmental preservation, leading to a heightened demand for sustainable solutions. International agreements such as the Paris Climate Accord have reinforced this commitment by setting carbon emission reduction targets, and driving the adoption of green technologies like renewable energy, waste management, and water purification.
Furthermore, regulatory frameworks such as carbon pricing and the introduction of stricter environmental standards across industries have incentivized companies to adopt sustainable practices. The pressure to reduce carbon footprints, enhance energy efficiency, and comply with environmental regulations has further bolstered the demand for technologies that promote sustainability. In 2023, the global renewable energy market alone was valued at over $1 trillion, reflecting the heightened investment in green solutions driven by environmental concerns. This trend is expected to continue as climate action remains at the forefront of global policy agendas.
Economic Opportunities and Job Creation: A Catalyst for Sustained Growth
The Green Technology and Sustainability Market is increasingly seen as a key driver of economic opportunities and job creation, contributing to its rapid growth. The transition to a greener economy has opened new avenues for employment, particularly in sectors like renewable energy, sustainable agriculture, green building, and electric vehicle (EV) manufacturing. According to the International Renewable Energy Agency (IRENA), over 12 million jobs will be created globally in the renewable energy sector by 2022, and this number is expected to rise as governments and private sectors invest more heavily in clean energy infrastructure.
In addition to direct employment, the economic opportunities extend to innovation and entrepreneurship. Startups focusing on sustainable products, services, and technologies are attracting substantial investment, particularly in areas like solar energy, wind power, and energy storage. The shift toward a circular economy where resources are reused, recycled, and repurposed also contributes to job growth, fostering a new market for waste management technologies and green manufacturing processes. The economic potential of this market is immense, with the global green technology sector projected to reach a value of $74.6 billion by 2030, expanding at a compound annual growth rate (CAGR) of 20.6%.
Integration of Emerging Technologies: The Key to Innovation and Market Expansion
Emerging technologies such as artificial intelligence (AI), blockchain, the Internet of Things (IoT), and advanced energy storage systems are revolutionizing the Green Technology and Sustainability Market, contributing to its robust growth. These technologies enhance the efficiency, scalability, and reliability of sustainable solutions, thereby increasing their adoption across various industries. For instance, AI and IoT are being employed in smart grids to optimize energy consumption and in agriculture to monitor and improve water and fertilizer usage, significantly reducing environmental impacts.
Blockchain technology is gaining traction for its ability to improve transparency and traceability in supply chains, particularly in industries like food production, where sustainability is a growing concern. Moreover, innovations in energy storage, such as lithium-ion batteries and emerging solid-state battery technologies, are addressing one of the major challenges in renewable energy intermittency by ensuring reliable energy supply even when renewable sources are unavailable.
The convergence of these technologies not only enhances the efficiency of green solutions but also drives investment in research and development (R&D), further accelerating market growth. As these innovations continue to evolve, the market is poised to expand, with new applications being developed across sectors, ranging from transportation to industrial manufacturing.
Restraining Factors
Technological Complexity: A Barrier to Broad Adoption
Technological complexity represents a significant restraining factor for the Green Technology and Sustainability Market, as it impedes widespread adoption and scalability. Many green technologies, such as renewable energy systems (solar, wind, and bioenergy) and energy-efficient solutions, require highly specialized knowledge and infrastructure. This increases the cost and limits the accessibility of these technologies, particularly for smaller companies or emerging markets.
In addition, the integration of these complex technologies into existing systems can be challenging. For example, transitioning from traditional energy sources to renewable ones often demands significant modifications to current energy grids, which can be expensive and time-consuming. For companies that are unfamiliar with such technology, these obstacles can be daunting, leading to slower adoption rates. The complexity associated with research and development also delays the market's ability to bring innovations to commercialization, further hindering growth.
Regulatory Uncertainty: Limiting Long-Term Investment
Regulatory uncertainty is another major restraining factor that hinders the growth of the Green Technology and Sustainability Market. Inconsistencies in policies and regulations both domestically and internationally create hesitation among companies and investors, limiting long-term investment in sustainable technologies.
The green technology sector is heavily dependent on government incentives, subsidies, and supportive policies to drive development. However, unpredictable shifts in environmental policies, such as changes in carbon pricing, renewable energy incentives, or environmental standards, can destabilize the market. Companies are less likely to make substantial investments in research, development, and production when future regulations are unclear or subject to rapid change. For instance, a sudden change in tax credits or subsidies for renewable energy projects can lead to postponed or canceled investments, stalling market growth.
In the U.S. market, the transition from one administration to another has sometimes led to shifts in climate policies. For example, the U.S. government’s withdrawal from the Paris Agreement in 2017 created uncertainty for businesses relying on supportive international climate policies. Conversely, the re-entry into the Paris Agreement in 2021 provided a renewed sense of direction but highlighted how regulatory shifts can impede the sector's long-term planning.
By Component Analysis
In 2023, Solutions dominated the Green Technology and Sustainability Market.
In 2023, Solutions held a dominant market position in the By Component segment of the Green Technology and Sustainability Market. The growth of this segment can be attributed to the increasing demand for advanced technologies that facilitate energy efficiency, carbon reduction, and sustainable resource management. Solutions such as renewable energy systems, smart grids, carbon footprint management tools, and climate risk analytics have gained widespread adoption across industries. The rising regulatory pressures from governments to adopt greener technologies, coupled with significant R&D investments, have further bolstered the prominence of this segment.
Similarly, the Services segment played a crucial role in the Green Technology and Sustainability Market. Services such as consulting, system integration, and maintenance have become essential for organizations to implement and manage sustainability initiatives. Service providers offer expertise in regulatory compliance, strategy development, and technology implementation, which has driven market expansion.
By Industry Analysis
In 2023, Air and water pollution monitoring dominated the green technology sector.
In 2023, Air and water pollution monitoring held a dominant market position in the Green Technology and Sustainability Market, particularly within the by-industry segment. The increasing emphasis on environmental conservation, coupled with stricter government regulations on pollution control, has driven the demand for advanced pollution monitoring solutions. These systems provide real-time data on pollutants in air and water, aiding industries in compliance with environmental standards and reducing their ecological footprint. The integration of IoT and AI in pollution monitoring technologies has further enhanced accuracy and efficiency, contributing to the market's growth.
Other key segments include carbon footprint management, which has witnessed rising adoption due to corporate sustainability goals and global efforts to mitigate climate change. Crop monitoring has seen increased use of precision agriculture techniques, enabling farmers to optimize resource use while enhancing productivity. Fire detection technologies have gained traction in response to the growing threat of wildfires, particularly in regions vulnerable to climate change.
Forest monitoring systems are crucial for tracking deforestation and biodiversity, while green building initiatives continue to expand as sustainable construction practices become the norm. Soil condition/moisture monitoring aids in sustainable agriculture, while sustainable mining and exploration address the ecological impacts of resource extraction. Water management and weather monitoring and forecasting are pivotal in addressing water scarcity and climate resilience, respectively, marking critical areas of growth within the green technology sector.
By Technology Analysis
In 2023, IoT dominated Green Technology, enhancing efficiency and sustainability.
In 2023, The Internet of Things (IoT) held a dominant market position in the Technology segment of the Green Technology and Sustainability Market. The extensive adoption of IoT is attributed to its ability to enhance resource efficiency and optimize energy consumption across various sectors. IoT technologies facilitate real-time monitoring and control of energy systems, contributing to significant improvements in sustainability practices.
Cloud Computing is a crucial technology, providing scalable and flexible infrastructure that supports the deployment of green technologies. Its role in data storage and processing is essential for managing large volumes of environmental data and facilitating efficient operations.
Artificial Intelligence (AI) & Analytics emerged as pivotal in analyzing complex data sets and deriving actionable insights for sustainable practices. AI-driven models help predict environmental impacts and optimize resource utilization.
Digital Twin technology also gained traction, enabling virtual simulations of physical systems to optimize performance and predict maintenance needs, thereby reducing waste.
Cybersecurity remains critical, ensuring the protection of sensitive data and infrastructure from cyber threats, which is vital as reliance on digital systems increases.
Blockchain technology, though still evolving, offers potential benefits in enhancing transparency and traceability in supply chains, which is beneficial for verifying sustainable practices.
Key Market Segments
By Component
- Solutions
- Services
By Industry
- Air and water pollution monitoring
- Carbon footprint management
- Crop monitoring
- Fire detection
- Forest monitoring
- Green building
- Soil condition/moisture monitoring
- Sustainable mining and exploration
- Water management
- Weather monitoring and forecasting
By Technology
- Internet of Things (IoT)
- Cloud Computing
- Artificial Intelligence & Analytics
- Digital Twin
- Cybersecurity
- Blockchain
Growth Opportunity
Renewable Energy Integration
The global green technology and sustainability market is poised for substantial growth, driven significantly by advancements in renewable energy integration. The transition from fossil fuels to renewable sources such as solar, wind, and hydroelectric power is gaining momentum. According to recent data, renewable energy sources are expected to account for approximately 70% of the global energy mix by the end of the decade. This shift is fueled by government incentives, technological advancements, and increasing corporate commitments to sustainability. The deployment of smart grids and energy storage solutions is enhancing the efficiency and reliability of renewable energy systems, thereby opening new avenues for market expansion.
Waste Management and Recycling
Another critical area of opportunity lies in waste management and recycling. As global urbanization accelerates, the volume of waste generated is rising, necessitating more effective waste management solutions. Innovative technologies in waste-to-energy conversion, recycling processes, and circular economy models are being rapidly adopted.
The global market for waste management technologies is projected to grow at a CAGR of 6.5% through 2027. This growth is driven by increasing regulatory pressures and the rising demand for sustainable waste solutions. Advanced recycling technologies, such as those enabling the recovery of rare earth metals and plastics, are poised to offer significant business opportunities.
Latest Trends
Investment in Research and Development
The green technology and sustainability market is expected to witness substantial growth driven by increased investments in research and development (R&D). Governments, corporations, and private investors are allocating significant resources to advancing renewable energy technologies, energy-efficient solutions, and carbon capture innovations. This investment surge is poised to accelerate the commercialization of new technologies, enhancing market competitiveness and driving down costs.
Furthermore, emerging innovations in areas such as energy storage, smart grids, and sustainable materials are likely to attract continued funding. These advancements are anticipated to play a crucial role in meeting global sustainability targets and mitigating climate change.
Corporate Sustainability Commitments
Corporate sustainability commitments are becoming a central theme, as companies across various sectors pledge to reduce their carbon footprints, adopt cleaner energy, and embrace circular economy principles. Major corporations are setting ambitious net-zero targets and integrating sustainability into their core business strategies, prompting a shift toward greener supply chains and products. This trend is further supported by increasing pressure from investors, regulators, and consumers demanding transparency in environmental, social, and governance (ESG) performance. As companies invest in green technologies to meet their sustainability goals, the market is expected to benefit from heightened demand for energy-efficient products, renewable energy solutions, and waste reduction technologies.
Regional Analysis
North America dominates the Green Technology market with a 35% largest share.
The Green Technology and Sustainability market is witnessing robust growth across key regions, driven by increasing environmental concerns and the adoption of eco-friendly technologies. North America dominates the market, accounting for approximately 35% of the global share. The region's leadership can be attributed to its stringent regulatory frameworks, government initiatives, and significant investments in clean energy. The U.S. and Canada are key contributors, with a growing focus on carbon reduction and renewable energy adoption. In 2023, North America’s green technology market is projected to grow at a CAGR of 22%, further solidifying its dominance in the sector.
Europe follows closely, driven by the European Union’s ambitious climate goals, such as achieving carbon neutrality by 2050. Germany, the UK, and France are leading players, supported by initiatives like the European Green Deal. The region holds around 30% of the market, with increasing demand for sustainable products and renewable energy solutions.
The Asia Pacific region is experiencing rapid growth, with countries like China, Japan, and India investing heavily in green technologies. Asia Pacific accounts for 25% of the market, driven by urbanization and industrial expansion, leading to increased demand for clean energy and sustainable infrastructure.
In Latin America, and the Middle East & Africa, the market is in its nascent stages but growing, accounting for a smaller market share of 10% combined. These regions are focusing on renewable energy projects, particularly solar and wind energy, and are expected to grow significantly in the coming years with supportive government policies.
Key Regions and Countries
North America
- The US
- Canada
- Rest of North America
Europe
- Germany
- France
- The UK
- Spain
- Netherlands
- Russia
- Italy
- Rest of Europe
Asia-Pacific
- China
- Japan
- Singapore
- Thailand
- South Korea
- Vietnam
- India
- New Zealand
- Rest of Asia Pacific
Latin America
- Mexico
- Brazil
- Rest of Latin America
Middle East & Africa
- Saudi Arabia
- South Africa
- UAE
- Rest of the Middle East & Africa
Key Players Analysis
The global Green Technology and Sustainability Market is projected to experience robust growth in 2024, driven by increasing global awareness and regulatory pressures around environmental sustainability. Key players such as General Electric and Schneider Electric are positioned to leverage their extensive portfolios in energy management, renewable energy solutions, and grid optimization to meet the growing demand for sustainable infrastructure. Their innovations in smart grids and renewable energy technology are expected to play a pivotal role in reducing carbon emissions.
Salesforce, Inc. and Microsoft continue to advance cloud-based sustainability solutions, emphasizing digital tools for tracking environmental impact and optimizing resource efficiency. These companies, along with IBM, have integrated artificial intelligence and machine learning to improve data analytics capabilities, helping businesses achieve sustainability goals more efficiently.
Focusing on water conservation and management, companies like Sensus, a Xylem brand, and Hortau lead the charge with IoT-based solutions for water usage optimization, addressing critical challenges in agricultural sustainability. CropX, Inc. and Trace Genomics contribute with precision agriculture technologies that promote soil health and resource efficiency.
Emerging players such as LO3 Energy and Consensys are at the forefront of blockchain technology, facilitating decentralized energy trading platforms that support renewable energy adoption. Meanwhile, Engie Impact and Cority (Enviance) continue to offer comprehensive environmental management services to large enterprises, focusing on compliance and sustainability performance.
Market Key Players
- General Electric
- Wolters Kluwer N.V.
- Salesforce, Inc.
- Microsoft
- Schneider Electric
- Engie Impact
- Cority (Enviance)
- Sensus, a Xylem brand
- LO3 Energy
- CropX, Inc.
- Trace Genomics
- IBM
- Enablon
- Enviance
- Consensys
- Hortau
- SMAP Energy
- Treevia
- Pycno
Recent Development
- In September 2024, Large-scale floating wind farms will become operational, particularly in Europe and Asia, providing a solution to the limitations of traditional land-based wind farms. These floating platforms, which operate in deep waters with higher wind speeds, are expected to significantly increase global wind energy capacity and improve the reliability of renewable energy.
- In April 2024, Fujitsu and Microsoft entered a five-year strategic collaboration aimed at advancing sustainability transformation. Their focus is on developing technologies and solutions that promote environmental and social sustainability, helping companies reduce their carbon footprints and enhance operational efficiency.
- In March 2024, Salesforce expanded its partnership with Accenture to help businesses embed sustainability into their operations. Salesforce also issued its inaugural USD 1 billion Sustainability Bond, aimed at advancing its environmental goals and aligning with the United Nations Sustainable Development Goals.
Report Scope
Report Features Description Market Value (2023) USD 20.5 Billion Forecast Revenue (2033) USD 122.3 Billion CAGR (2024-2032) 20.1% Base Year for Estimation 2023 Historic Period 2016-2023 Forecast Period 2024-2033 Report Coverage Revenue Forecast, Market Dynamics, COVID-19 Impact, Competitive Landscape, Recent Developments Segments Covered By Component (Solutions, Services), By Industry (Air and water pollution monitoring, Carbon footprint management, Crop monitoring, Fire detection, Forest monitoring, Green building, Soil condition/moisture monitoring, Sustainable mining and exploration, Water management, Weather monitoring and forecasting), By Technology (Internet of Things (IoT), Cloud Computing, Artificial Intelligence & Analytics, Digital Twin, Cybersecurity, Blockchain) Regional Analysis North America - The US, Canada, Rest of North America, Europe - Germany, France, The UK, Spain, Italy, Russia, Netherlands, Rest of Europe, Asia-Pacific - China, Japan, South Korea, India, New Zealand, Singapore, Thailand, Vietnam, Rest of Asia Pacific, Latin America - Brazil, Mexico, Rest of Latin America, Middle East & Africa - South Africa, Saudi Arabia, UAE, Rest of Middle East & Africa Competitive Landscape General Electric, Wolters Kluwer N.V., Salesforce, Inc., Microsoft, Schneider Electric, Engie Impact, Cority (Enviance), Sensus, a Xylem brand, LO3 Energy, CropX, Inc., Trace Genomics, IBM, Enablon, Enviance, Consensys, Hortau, SMAP Energy, Treevia, Pycno Customization Scope Customization for segments, region/country-level will be provided. Moreover, additional customization can be done based on the requirements. Purchase Options We have three licenses to opt for Single User License, Multi-User License (Up to 5 Users), Corporate Use License (Unlimited User and Printable PDF) -
- 1. Executive Summary
- 1.1. Definition
- 1.2. Taxonomy
- 1.3. Research Scope
- 1.4. Key Analysis
- 1.5. Key Findings by Major Segments
- 1.6. Top strategies by Major Players
- 2. Global Green Technology & Sustainability Market Overview
- 2.1. Green Technology & Sustainability Market Dynamics
- 2.1.1. Drivers
- 2.1.2. Opportunities
- 2.1.3. Restraints
- 2.1.4. Challenges
- 2.2. Macro-economic Factors
- 2.3. Regulatory Framework
- 2.4. Market Investment Feasibility Index
- 2.5. PEST Analysis
- 2.6. PORTER’S Five Force Analysis
- 2.7. Drivers & Restraints Impact Analysis
- 2.8. Industry Chain Analysis
- 2.9. Cost Structure Analysis
- 2.10. Marketing Strategy
- 2.11. Russia-Ukraine War Impact Analysis
- 2.12. Opportunity Map Analysis
- 2.13. Market Competition Scenario Analysis
- 2.14. Product Life Cycle Analysis
- 2.15. Opportunity Orbits
- 2.16. Manufacturer Intensity Map
- 2.17. Major Companies sales by Value & Volume
- 2.1. Green Technology & Sustainability Market Dynamics
- 3. Global Green Technology & Sustainability Market Analysis, Opportunity and Forecast, 2016-2032
- 3.1. Global Green Technology & Sustainability Market Analysis, 2016-2021
- 3.2. Global Green Technology & Sustainability Market Opportunity and Forecast, 2023-2032
- 3.3. Global Green Technology & Sustainability Market Analysis, Opportunity and Forecast, By Component, 2016-2032
- 3.3.1. Global Green Technology & Sustainability Market Analysis by Component: Introduction
- 3.3.2. Market Size Absolute $ Opportunity Analysis and Forecast, By Component, 2016-2032
- 3.3.3. Solutions
- 3.3.4. Services
- 3.4. Global Green Technology & Sustainability Market Analysis, Opportunity and Forecast, By Industry, 2016-2032
- 3.4.1. Global Green Technology & Sustainability Market Analysis by Industry: Introduction
- 3.4.2. Market Size Absolute $ Opportunity Analysis and Forecast, By Industry, 2016-2032
- 3.4.3. Air and water pollution monitoring
- 3.4.4. Carbon footprint management
- 3.4.5. Crop monitoring
- 3.4.6. Fire detection
- 3.4.7. Forest monitoring
- 3.4.8. Green building
- 3.4.9. Soil condition/moisture monitoring
- 3.4.10. Sustainable mining and exploration
- 3.4.11. Water management
- 3.4.12. Weather monitoring and forecasting
- 3.5. Global Green Technology & Sustainability Market Analysis, Opportunity and Forecast, By Technology, 2016-2032
- 3.5.1. Global Green Technology & Sustainability Market Analysis by Technology: Introduction
- 3.5.2. Market Size Absolute $ Opportunity Analysis and Forecast, By Technology, 2016-2032
- 3.5.3. Internet of Things (IoT)
- 3.5.4. Cloud Computing
- 3.5.5. Artificial Intelligence & Analytics
- 3.5.6. Digital Twin
- 3.5.7. Cybersecurity
- 3.5.8. Blockchain
- 4. North America Green Technology & Sustainability Market Analysis, Opportunity and Forecast, 2016-2032
- 4.1. North America Green Technology & Sustainability Market Analysis, 2016-2021
- 4.2. North America Green Technology & Sustainability Market Opportunity and Forecast, 2023-2032
- 4.3. North America Green Technology & Sustainability Market Analysis, Opportunity and Forecast, By Component, 2016-2032
- 4.3.1. North America Green Technology & Sustainability Market Analysis by Component: Introduction
- 4.3.2. Market Size Absolute $ Opportunity Analysis and Forecast, By Component, 2016-2032
- 4.3.3. Solutions
- 4.3.4. Services
- 4.4. North America Green Technology & Sustainability Market Analysis, Opportunity and Forecast, By Industry, 2016-2032
- 4.4.1. North America Green Technology & Sustainability Market Analysis by Industry: Introduction
- 4.4.2. Market Size Absolute $ Opportunity Analysis and Forecast, By Industry, 2016-2032
- 4.4.3. Air and water pollution monitoring
- 4.4.4. Carbon footprint management
- 4.4.5. Crop monitoring
- 4.4.6. Fire detection
- 4.4.7. Forest monitoring
- 4.4.8. Green building
- 4.4.9. Soil condition/moisture monitoring
- 4.4.10. Sustainable mining and exploration
- 4.4.11. Water management
- 4.4.12. Weather monitoring and forecasting
- 4.5. North America Green Technology & Sustainability Market Analysis, Opportunity and Forecast, By Technology, 2016-2032
- 4.5.1. North America Green Technology & Sustainability Market Analysis by Technology: Introduction
- 4.5.2. Market Size Absolute $ Opportunity Analysis and Forecast, By Technology, 2016-2032
- 4.5.3. Internet of Things (IoT)
- 4.5.4. Cloud Computing
- 4.5.5. Artificial Intelligence & Analytics
- 4.5.6. Digital Twin
- 4.5.7. Cybersecurity
- 4.5.8. Blockchain
- 4.6. North America Green Technology & Sustainability Market Analysis, Opportunity and Forecast, By Country , 2016-2032
- 4.6.1. North America Green Technology & Sustainability Market Analysis by Country : Introduction
- 4.6.2. Market Size Absolute $ Opportunity Analysis and Forecast, Country , 2016-2032
- 4.6.2.1. The US
- 4.6.2.2. Canada
- 4.6.2.3. Mexico
- 5. Western Europe Green Technology & Sustainability Market Analysis, Opportunity and Forecast, 2016-2032
- 5.1. Western Europe Green Technology & Sustainability Market Analysis, 2016-2021
- 5.2. Western Europe Green Technology & Sustainability Market Opportunity and Forecast, 2023-2032
- 5.3. Western Europe Green Technology & Sustainability Market Analysis, Opportunity and Forecast, By Component, 2016-2032
- 5.3.1. Western Europe Green Technology & Sustainability Market Analysis by Component: Introduction
- 5.3.2. Market Size Absolute $ Opportunity Analysis and Forecast, By Component, 2016-2032
- 5.3.3. Solutions
- 5.3.4. Services
- 5.4. Western Europe Green Technology & Sustainability Market Analysis, Opportunity and Forecast, By Industry, 2016-2032
- 5.4.1. Western Europe Green Technology & Sustainability Market Analysis by Industry: Introduction
- 5.4.2. Market Size Absolute $ Opportunity Analysis and Forecast, By Industry, 2016-2032
- 5.4.3. Air and water pollution monitoring
- 5.4.4. Carbon footprint management
- 5.4.5. Crop monitoring
- 5.4.6. Fire detection
- 5.4.7. Forest monitoring
- 5.4.8. Green building
- 5.4.9. Soil condition/moisture monitoring
- 5.4.10. Sustainable mining and exploration
- 5.4.11. Water management
- 5.4.12. Weather monitoring and forecasting
- 5.5. Western Europe Green Technology & Sustainability Market Analysis, Opportunity and Forecast, By Technology, 2016-2032
- 5.5.1. Western Europe Green Technology & Sustainability Market Analysis by Technology: Introduction
- 5.5.2. Market Size Absolute $ Opportunity Analysis and Forecast, By Technology, 2016-2032
- 5.5.3. Internet of Things (IoT)
- 5.5.4. Cloud Computing
- 5.5.5. Artificial Intelligence & Analytics
- 5.5.6. Digital Twin
- 5.5.7. Cybersecurity
- 5.5.8. Blockchain
- 5.6. Western Europe Green Technology & Sustainability Market Analysis, Opportunity and Forecast, By Country , 2016-2032
- 5.6.1. Western Europe Green Technology & Sustainability Market Analysis by Country : Introduction
- 5.6.2. Market Size Absolute $ Opportunity Analysis and Forecast, Country , 2016-2032
- 5.6.2.1. Germany
- 5.6.2.2. France
- 5.6.2.3. The UK
- 5.6.2.4. Spain
- 5.6.2.5. Italy
- 5.6.2.6. Portugal
- 5.6.2.7. Ireland
- 5.6.2.8. Austria
- 5.6.2.9. Switzerland
- 5.6.2.10. Benelux
- 5.6.2.11. Nordic
- 5.6.2.12. Rest of Western Europe
- 6. Eastern Europe Green Technology & Sustainability Market Analysis, Opportunity and Forecast, 2016-2032
- 6.1. Eastern Europe Green Technology & Sustainability Market Analysis, 2016-2021
- 6.2. Eastern Europe Green Technology & Sustainability Market Opportunity and Forecast, 2023-2032
- 6.3. Eastern Europe Green Technology & Sustainability Market Analysis, Opportunity and Forecast, By Component, 2016-2032
- 6.3.1. Eastern Europe Green Technology & Sustainability Market Analysis by Component: Introduction
- 6.3.2. Market Size Absolute $ Opportunity Analysis and Forecast, By Component, 2016-2032
- 6.3.3. Solutions
- 6.3.4. Services
- 6.4. Eastern Europe Green Technology & Sustainability Market Analysis, Opportunity and Forecast, By Industry, 2016-2032
- 6.4.1. Eastern Europe Green Technology & Sustainability Market Analysis by Industry: Introduction
- 6.4.2. Market Size Absolute $ Opportunity Analysis and Forecast, By Industry, 2016-2032
- 6.4.3. Air and water pollution monitoring
- 6.4.4. Carbon footprint management
- 6.4.5. Crop monitoring
- 6.4.6. Fire detection
- 6.4.7. Forest monitoring
- 6.4.8. Green building
- 6.4.9. Soil condition/moisture monitoring
- 6.4.10. Sustainable mining and exploration
- 6.4.11. Water management
- 6.4.12. Weather monitoring and forecasting
- 6.5. Eastern Europe Green Technology & Sustainability Market Analysis, Opportunity and Forecast, By Technology, 2016-2032
- 6.5.1. Eastern Europe Green Technology & Sustainability Market Analysis by Technology: Introduction
- 6.5.2. Market Size Absolute $ Opportunity Analysis and Forecast, By Technology, 2016-2032
- 6.5.3. Internet of Things (IoT)
- 6.5.4. Cloud Computing
- 6.5.5. Artificial Intelligence & Analytics
- 6.5.6. Digital Twin
- 6.5.7. Cybersecurity
- 6.5.8. Blockchain
- 6.6. Eastern Europe Green Technology & Sustainability Market Analysis, Opportunity and Forecast, By Country , 2016-2032
- 6.6.1. Eastern Europe Green Technology & Sustainability Market Analysis by Country : Introduction
- 6.6.2. Market Size Absolute $ Opportunity Analysis and Forecast, Country , 2016-2032
- 6.6.2.1. Russia
- 6.6.2.2. Poland
- 6.6.2.3. The Czech Republic
- 6.6.2.4. Greece
- 6.6.2.5. Rest of Eastern Europe
- 7. APAC Green Technology & Sustainability Market Analysis, Opportunity and Forecast, 2016-2032
- 7.1. APAC Green Technology & Sustainability Market Analysis, 2016-2021
- 7.2. APAC Green Technology & Sustainability Market Opportunity and Forecast, 2023-2032
- 7.3. APAC Green Technology & Sustainability Market Analysis, Opportunity and Forecast, By Component, 2016-2032
- 7.3.1. APAC Green Technology & Sustainability Market Analysis by Component: Introduction
- 7.3.2. Market Size Absolute $ Opportunity Analysis and Forecast, By Component, 2016-2032
- 7.3.3. Solutions
- 7.3.4. Services
- 7.4. APAC Green Technology & Sustainability Market Analysis, Opportunity and Forecast, By Industry, 2016-2032
- 7.4.1. APAC Green Technology & Sustainability Market Analysis by Industry: Introduction
- 7.4.2. Market Size Absolute $ Opportunity Analysis and Forecast, By Industry, 2016-2032
- 7.4.3. Air and water pollution monitoring
- 7.4.4. Carbon footprint management
- 7.4.5. Crop monitoring
- 7.4.6. Fire detection
- 7.4.7. Forest monitoring
- 7.4.8. Green building
- 7.4.9. Soil condition/moisture monitoring
- 7.4.10. Sustainable mining and exploration
- 7.4.11. Water management
- 7.4.12. Weather monitoring and forecasting
- 7.5. APAC Green Technology & Sustainability Market Analysis, Opportunity and Forecast, By Technology, 2016-2032
- 7.5.1. APAC Green Technology & Sustainability Market Analysis by Technology: Introduction
- 7.5.2. Market Size Absolute $ Opportunity Analysis and Forecast, By Technology, 2016-2032
- 7.5.3. Internet of Things (IoT)
- 7.5.4. Cloud Computing
- 7.5.5. Artificial Intelligence & Analytics
- 7.5.6. Digital Twin
- 7.5.7. Cybersecurity
- 7.5.8. Blockchain
- 7.6. APAC Green Technology & Sustainability Market Analysis, Opportunity and Forecast, By Country , 2016-2032
- 7.6.1. APAC Green Technology & Sustainability Market Analysis by Country : Introduction
- 7.6.2. Market Size Absolute $ Opportunity Analysis and Forecast, Country , 2016-2032
- 7.6.2.1. China
- 7.6.2.2. Japan
- 7.6.2.3. South Korea
- 7.6.2.4. India
- 7.6.2.5. Australia & New Zeland
- 7.6.2.6. Indonesia
- 7.6.2.7. Malaysia
- 7.6.2.8. Philippines
- 7.6.2.9. Singapore
- 7.6.2.10. Thailand
- 7.6.2.11. Vietnam
- 7.6.2.12. Rest of APAC
- 8. Latin America Green Technology & Sustainability Market Analysis, Opportunity and Forecast, 2016-2032
- 8.1. Latin America Green Technology & Sustainability Market Analysis, 2016-2021
- 8.2. Latin America Green Technology & Sustainability Market Opportunity and Forecast, 2023-2032
- 8.3. Latin America Green Technology & Sustainability Market Analysis, Opportunity and Forecast, By Component, 2016-2032
- 8.3.1. Latin America Green Technology & Sustainability Market Analysis by Component: Introduction
- 8.3.2. Market Size Absolute $ Opportunity Analysis and Forecast, By Component, 2016-2032
- 8.3.3. Solutions
- 8.3.4. Services
- 8.4. Latin America Green Technology & Sustainability Market Analysis, Opportunity and Forecast, By Industry, 2016-2032
- 8.4.1. Latin America Green Technology & Sustainability Market Analysis by Industry: Introduction
- 8.4.2. Market Size Absolute $ Opportunity Analysis and Forecast, By Industry, 2016-2032
- 8.4.3. Air and water pollution monitoring
- 8.4.4. Carbon footprint management
- 8.4.5. Crop monitoring
- 8.4.6. Fire detection
- 8.4.7. Forest monitoring
- 8.4.8. Green building
- 8.4.9. Soil condition/moisture monitoring
- 8.4.10. Sustainable mining and exploration
- 8.4.11. Water management
- 8.4.12. Weather monitoring and forecasting
- 8.5. Latin America Green Technology & Sustainability Market Analysis, Opportunity and Forecast, By Technology, 2016-2032
- 8.5.1. Latin America Green Technology & Sustainability Market Analysis by Technology: Introduction
- 8.5.2. Market Size Absolute $ Opportunity Analysis and Forecast, By Technology, 2016-2032
- 8.5.3. Internet of Things (IoT)
- 8.5.4. Cloud Computing
- 8.5.5. Artificial Intelligence & Analytics
- 8.5.6. Digital Twin
- 8.5.7. Cybersecurity
- 8.5.8. Blockchain
- 8.6. Latin America Green Technology & Sustainability Market Analysis, Opportunity and Forecast, By Country , 2016-2032
- 8.6.1. Latin America Green Technology & Sustainability Market Analysis by Country : Introduction
- 8.6.2. Market Size Absolute $ Opportunity Analysis and Forecast, Country , 2016-2032
- 8.6.2.1. Brazil
- 8.6.2.2. Colombia
- 8.6.2.3. Chile
- 8.6.2.4. Argentina
- 8.6.2.5. Costa Rica
- 8.6.2.6. Rest of Latin America
- 9. Middle East & Africa Green Technology & Sustainability Market Analysis, Opportunity and Forecast, 2016-2032
- 9.1. Middle East & Africa Green Technology & Sustainability Market Analysis, 2016-2021
- 9.2. Middle East & Africa Green Technology & Sustainability Market Opportunity and Forecast, 2023-2032
- 9.3. Middle East & Africa Green Technology & Sustainability Market Analysis, Opportunity and Forecast, By Component, 2016-2032
- 9.3.1. Middle East & Africa Green Technology & Sustainability Market Analysis by Component: Introduction
- 9.3.2. Market Size Absolute $ Opportunity Analysis and Forecast, By Component, 2016-2032
- 9.3.3. Solutions
- 9.3.4. Services
- 9.4. Middle East & Africa Green Technology & Sustainability Market Analysis, Opportunity and Forecast, By Industry, 2016-2032
- 9.4.1. Middle East & Africa Green Technology & Sustainability Market Analysis by Industry: Introduction
- 9.4.2. Market Size Absolute $ Opportunity Analysis and Forecast, By Industry, 2016-2032
- 9.4.3. Air and water pollution monitoring
- 9.4.4. Carbon footprint management
- 9.4.5. Crop monitoring
- 9.4.6. Fire detection
- 9.4.7. Forest monitoring
- 9.4.8. Green building
- 9.4.9. Soil condition/moisture monitoring
- 9.4.10. Sustainable mining and exploration
- 9.4.11. Water management
- 9.4.12. Weather monitoring and forecasting
- 9.5. Middle East & Africa Green Technology & Sustainability Market Analysis, Opportunity and Forecast, By Technology, 2016-2032
- 9.5.1. Middle East & Africa Green Technology & Sustainability Market Analysis by Technology: Introduction
- 9.5.2. Market Size Absolute $ Opportunity Analysis and Forecast, By Technology, 2016-2032
- 9.5.3. Internet of Things (IoT)
- 9.5.4. Cloud Computing
- 9.5.5. Artificial Intelligence & Analytics
- 9.5.6. Digital Twin
- 9.5.7. Cybersecurity
- 9.5.8. Blockchain
- 9.6. Middle East & Africa Green Technology & Sustainability Market Analysis, Opportunity and Forecast, By Country , 2016-2032
- 9.6.1. Middle East & Africa Green Technology & Sustainability Market Analysis by Country : Introduction
- 9.6.2. Market Size Absolute $ Opportunity Analysis and Forecast, Country , 2016-2032
- 9.6.2.1. Algeria
- 9.6.2.2. Egypt
- 9.6.2.3. Israel
- 9.6.2.4. Kuwait
- 9.6.2.5. Nigeria
- 9.6.2.6. Saudi Arabia
- 9.6.2.7. South Africa
- 9.6.2.8. Turkey
- 9.6.2.9. The UAE
- 9.6.2.10. Rest of MEA
- 10. Global Green Technology & Sustainability Market Analysis, Opportunity and Forecast, By Region , 2016-2032
- 10.1. Global Green Technology & Sustainability Market Analysis by Region : Introduction
- 10.2. Market Size Absolute $ Opportunity Analysis and Forecast, By Region , 2016-2032
- 10.2.1. North America
- 10.2.2. Western Europe
- 10.2.3. Eastern Europe
- 10.2.4. APAC
- 10.2.5. Latin America
- 10.2.6. Middle East & Africa
- 11. Global Green Technology & Sustainability Market Competitive Landscape, Market Share Analysis, and Company Profiles
- 11.1. Market Share Analysis
- 11.2. Company Profiles
- 11.3. General Electric
- 11.3.1. Company Overview
- 11.3.2. Financial Highlights
- 11.3.3. Product Portfolio
- 11.3.4. SWOT Analysis
- 11.3.5. Key Strategies and Developments
- 11.4. Wolters Kluwer N.V.
- 11.4.1. Company Overview
- 11.4.2. Financial Highlights
- 11.4.3. Product Portfolio
- 11.4.4. SWOT Analysis
- 11.4.5. Key Strategies and Developments
- 11.5. Salesforce, Inc.
- 11.5.1. Company Overview
- 11.5.2. Financial Highlights
- 11.5.3. Product Portfolio
- 11.5.4. SWOT Analysis
- 11.5.5. Key Strategies and Developments
- 11.6. Microsoft
- 11.6.1. Company Overview
- 11.6.2. Financial Highlights
- 11.6.3. Product Portfolio
- 11.6.4. SWOT Analysis
- 11.6.5. Key Strategies and Developments
- 11.7. Schneider Electric
- 11.7.1. Company Overview
- 11.7.2. Financial Highlights
- 11.7.3. Product Portfolio
- 11.7.4. SWOT Analysis
- 11.7.5. Key Strategies and Developments
- 11.8. Engie Impact
- 11.8.1. Company Overview
- 11.8.2. Financial Highlights
- 11.8.3. Product Portfolio
- 11.8.4. SWOT Analysis
- 11.8.5. Key Strategies and Developments
- 11.9. Cority (Enviance)
- 11.9.1. Company Overview
- 11.9.2. Financial Highlights
- 11.9.3. Product Portfolio
- 11.9.4. SWOT Analysis
- 11.9.5. Key Strategies and Developments
- 11.10. Sensus, a Xylem brand
- 11.10.1. Company Overview
- 11.10.2. Financial Highlights
- 11.10.3. Product Portfolio
- 11.10.4. SWOT Analysis
- 11.10.5. Key Strategies and Developments
- 11.11. LO3 Energy
- 11.11.1. Company Overview
- 11.11.2. Financial Highlights
- 11.11.3. Product Portfolio
- 11.11.4. SWOT Analysis
- 11.11.5. Key Strategies and Developments
- 11.12. CropX, Inc.
- 11.12.1. Company Overview
- 11.12.2. Financial Highlights
- 11.12.3. Product Portfolio
- 11.12.4. SWOT Analysis
- 11.12.5. Key Strategies and Developments
- 11.13.1. Company Overview
- 11.13.2. Financial Highlights
- 11.13.3. Product Portfolio
- 11.13.4. SWOT Analysis
- 11.13.5. Key Strategies and Developments
- 11.14. Trace Genomics
- 11.14.1. Company Overview
- 11.14.2. Financial Highlights
- 11.14.3. Product Portfolio
- 11.14.4. SWOT Analysis
- 11.14.5. Key Strategies and Developments
- 11.15. Enablon
- 11.15.1. Company Overview
- 11.15.2. Financial Highlights
- 11.15.3. Product Portfolio
- 11.15.4. SWOT Analysis
- 11.15.5. Key Strategies and Developments
- 11.16. Enviance
- 11.16.1. Company Overview
- 11.16.2. Financial Highlights
- 11.16.3. Product Portfolio
- 11.16.4. SWOT Analysis
- 11.16.5. Key Strategies and Developments
- 11.17. Consensys
- 11.17.1. Company Overview
- 11.17.2. Financial Highlights
- 11.17.3. Product Portfolio
- 11.17.4. SWOT Analysis
- 11.17.5. Key Strategies and Developments
- 11.18. Hortau
- 11.18.1. Company Overview
- 11.18.2. Financial Highlights
- 11.18.3. Product Portfolio
- 11.18.4. SWOT Analysis
- 11.18.5. Key Strategies and Developments
- 11.19. SMAP Energy
- 11.19.1. Company Overview
- 11.19.2. Financial Highlights
- 11.19.3. Product Portfolio
- 11.19.4. SWOT Analysis
- 11.19.5. Key Strategies and Developments
- 11.20. Treevia
- 11.20.1. Company Overview
- 11.20.2. Financial Highlights
- 11.20.3. Product Portfolio
- 11.20.4. SWOT Analysis
- 11.20.5. Key Strategies and Developments
- 11.21. Pycno
- 11.21.1. Company Overview
- 11.21.2. Financial Highlights
- 11.21.3. Product Portfolio
- 11.21.4. SWOT Analysis
- 11.21.5. Key Strategies and Developments
- 12. Assumptions and Acronyms
- 13. Research Methodology
- 14. Contact
"
- List of Figures
- "
- Figure 1: Global Green Technology & Sustainability Market Revenue (US$ Mn) Market Share by Component in 2022
- Figure 2: Global Green Technology & Sustainability Market Market Attractiveness Analysis by Component, 2016-2032
- Figure 3: Global Green Technology & Sustainability Market Revenue (US$ Mn) Market Share by Industryin 2022
- Figure 4: Global Green Technology & Sustainability Market Market Attractiveness Analysis by Industry, 2016-2032
- Figure 5: Global Green Technology & Sustainability Market Revenue (US$ Mn) Market Share by Technologyin 2022
- Figure 6: Global Green Technology & Sustainability Market Market Attractiveness Analysis by Technology, 2016-2032
- Figure 7: Global Green Technology & Sustainability Market Revenue (US$ Mn) Market Share by Region in 2022
- Figure 8: Global Green Technology & Sustainability Market Market Attractiveness Analysis by Region, 2016-2032
- Figure 9: Global Green Technology & Sustainability Market Market Revenue (US$ Mn) (2016-2032)
- Figure 10: Global Green Technology & Sustainability Market Market Revenue (US$ Mn) Comparison by Region (2016-2032)
- Figure 11: Global Green Technology & Sustainability Market Market Revenue (US$ Mn) Comparison by Component (2016-2032)
- Figure 12: Global Green Technology & Sustainability Market Market Revenue (US$ Mn) Comparison by Industry (2016-2032)
- Figure 13: Global Green Technology & Sustainability Market Market Revenue (US$ Mn) Comparison by Technology (2016-2032)
- Figure 14: Global Green Technology & Sustainability Market Market Y-o-Y Growth Rate Comparison by Region (2016-2032)
- Figure 15: Global Green Technology & Sustainability Market Market Y-o-Y Growth Rate Comparison by Component (2016-2032)
- Figure 16: Global Green Technology & Sustainability Market Market Y-o-Y Growth Rate Comparison by Industry (2016-2032)
- Figure 17: Global Green Technology & Sustainability Market Market Y-o-Y Growth Rate Comparison by Technology (2016-2032)
- Figure 18: Global Green Technology & Sustainability Market Market Share Comparison by Region (2016-2032)
- Figure 19: Global Green Technology & Sustainability Market Market Share Comparison by Component (2016-2032)
- Figure 20: Global Green Technology & Sustainability Market Market Share Comparison by Industry (2016-2032)
- Figure 21: Global Green Technology & Sustainability Market Market Share Comparison by Technology (2016-2032)
- Figure 22: North America Green Technology & Sustainability Market Revenue (US$ Mn) Market Share by Componentin 2022
- Figure 23: North America Green Technology & Sustainability Market Market Attractiveness Analysis by Component, 2016-2032
- Figure 24: North America Green Technology & Sustainability Market Revenue (US$ Mn) Market Share by Industryin 2022
- Figure 25: North America Green Technology & Sustainability Market Market Attractiveness Analysis by Industry, 2016-2032
- Figure 26: North America Green Technology & Sustainability Market Revenue (US$ Mn) Market Share by Technologyin 2022
- Figure 27: North America Green Technology & Sustainability Market Market Attractiveness Analysis by Technology, 2016-2032
- Figure 28: North America Green Technology & Sustainability Market Revenue (US$ Mn) Market Share by Country in 2022
- Figure 29: North America Green Technology & Sustainability Market Market Attractiveness Analysis by Country, 2016-2032
- Figure 30: North America Green Technology & Sustainability Market Market Revenue (US$ Mn) (2016-2032)
- Figure 31: North America Green Technology & Sustainability Market Market Revenue (US$ Mn) Comparison by Country (2016-2032)
- Figure 32: North America Green Technology & Sustainability Market Market Revenue (US$ Mn) Comparison by Component (2016-2032)
- Figure 33: North America Green Technology & Sustainability Market Market Revenue (US$ Mn) Comparison by Industry (2016-2032)
- Figure 34: North America Green Technology & Sustainability Market Market Revenue (US$ Mn) Comparison by Technology (2016-2032)
- Figure 35: North America Green Technology & Sustainability Market Market Y-o-Y Growth Rate Comparison by Country (2016-2032)
- Figure 36: North America Green Technology & Sustainability Market Market Y-o-Y Growth Rate Comparison by Component (2016-2032)
- Figure 37: North America Green Technology & Sustainability Market Market Y-o-Y Growth Rate Comparison by Industry (2016-2032)
- Figure 38: North America Green Technology & Sustainability Market Market Y-o-Y Growth Rate Comparison by Technology (2016-2032)
- Figure 39: North America Green Technology & Sustainability Market Market Share Comparison by Country (2016-2032)
- Figure 40: North America Green Technology & Sustainability Market Market Share Comparison by Component (2016-2032)
- Figure 41: North America Green Technology & Sustainability Market Market Share Comparison by Industry (2016-2032)
- Figure 42: North America Green Technology & Sustainability Market Market Share Comparison by Technology (2016-2032)
- Figure 43: Western Europe Green Technology & Sustainability Market Revenue (US$ Mn) Market Share by Componentin 2022
- Figure 44: Western Europe Green Technology & Sustainability Market Market Attractiveness Analysis by Component, 2016-2032
- Figure 45: Western Europe Green Technology & Sustainability Market Revenue (US$ Mn) Market Share by Industryin 2022
- Figure 46: Western Europe Green Technology & Sustainability Market Market Attractiveness Analysis by Industry, 2016-2032
- Figure 47: Western Europe Green Technology & Sustainability Market Revenue (US$ Mn) Market Share by Technologyin 2022
- Figure 48: Western Europe Green Technology & Sustainability Market Market Attractiveness Analysis by Technology, 2016-2032
- Figure 49: Western Europe Green Technology & Sustainability Market Revenue (US$ Mn) Market Share by Country in 2022
- Figure 50: Western Europe Green Technology & Sustainability Market Market Attractiveness Analysis by Country, 2016-2032
- Figure 51: Western Europe Green Technology & Sustainability Market Market Revenue (US$ Mn) (2016-2032)
- Figure 52: Western Europe Green Technology & Sustainability Market Market Revenue (US$ Mn) Comparison by Country (2016-2032)
- Figure 53: Western Europe Green Technology & Sustainability Market Market Revenue (US$ Mn) Comparison by Component (2016-2032)
- Figure 54: Western Europe Green Technology & Sustainability Market Market Revenue (US$ Mn) Comparison by Industry (2016-2032)
- Figure 55: Western Europe Green Technology & Sustainability Market Market Revenue (US$ Mn) Comparison by Technology (2016-2032)
- Figure 56: Western Europe Green Technology & Sustainability Market Market Y-o-Y Growth Rate Comparison by Country (2016-2032)
- Figure 57: Western Europe Green Technology & Sustainability Market Market Y-o-Y Growth Rate Comparison by Component (2016-2032)
- Figure 58: Western Europe Green Technology & Sustainability Market Market Y-o-Y Growth Rate Comparison by Industry (2016-2032)
- Figure 59: Western Europe Green Technology & Sustainability Market Market Y-o-Y Growth Rate Comparison by Technology (2016-2032)
- Figure 60: Western Europe Green Technology & Sustainability Market Market Share Comparison by Country (2016-2032)
- Figure 61: Western Europe Green Technology & Sustainability Market Market Share Comparison by Component (2016-2032)
- Figure 62: Western Europe Green Technology & Sustainability Market Market Share Comparison by Industry (2016-2032)
- Figure 63: Western Europe Green Technology & Sustainability Market Market Share Comparison by Technology (2016-2032)
- Figure 64: Eastern Europe Green Technology & Sustainability Market Revenue (US$ Mn) Market Share by Componentin 2022
- Figure 65: Eastern Europe Green Technology & Sustainability Market Market Attractiveness Analysis by Component, 2016-2032
- Figure 66: Eastern Europe Green Technology & Sustainability Market Revenue (US$ Mn) Market Share by Industryin 2022
- Figure 67: Eastern Europe Green Technology & Sustainability Market Market Attractiveness Analysis by Industry, 2016-2032
- Figure 68: Eastern Europe Green Technology & Sustainability Market Revenue (US$ Mn) Market Share by Technologyin 2022
- Figure 69: Eastern Europe Green Technology & Sustainability Market Market Attractiveness Analysis by Technology, 2016-2032
- Figure 70: Eastern Europe Green Technology & Sustainability Market Revenue (US$ Mn) Market Share by Country in 2022
- Figure 71: Eastern Europe Green Technology & Sustainability Market Market Attractiveness Analysis by Country, 2016-2032
- Figure 72: Eastern Europe Green Technology & Sustainability Market Market Revenue (US$ Mn) (2016-2032)
- Figure 73: Eastern Europe Green Technology & Sustainability Market Market Revenue (US$ Mn) Comparison by Country (2016-2032)
- Figure 74: Eastern Europe Green Technology & Sustainability Market Market Revenue (US$ Mn) Comparison by Component (2016-2032)
- Figure 75: Eastern Europe Green Technology & Sustainability Market Market Revenue (US$ Mn) Comparison by Industry (2016-2032)
- Figure 76: Eastern Europe Green Technology & Sustainability Market Market Revenue (US$ Mn) Comparison by Technology (2016-2032)
- Figure 77: Eastern Europe Green Technology & Sustainability Market Market Y-o-Y Growth Rate Comparison by Country (2016-2032)
- Figure 78: Eastern Europe Green Technology & Sustainability Market Market Y-o-Y Growth Rate Comparison by Component (2016-2032)
- Figure 79: Eastern Europe Green Technology & Sustainability Market Market Y-o-Y Growth Rate Comparison by Industry (2016-2032)
- Figure 80: Eastern Europe Green Technology & Sustainability Market Market Y-o-Y Growth Rate Comparison by Technology (2016-2032)
- Figure 81: Eastern Europe Green Technology & Sustainability Market Market Share Comparison by Country (2016-2032)
- Figure 82: Eastern Europe Green Technology & Sustainability Market Market Share Comparison by Component (2016-2032)
- Figure 83: Eastern Europe Green Technology & Sustainability Market Market Share Comparison by Industry (2016-2032)
- Figure 84: Eastern Europe Green Technology & Sustainability Market Market Share Comparison by Technology (2016-2032)
- Figure 85: APAC Green Technology & Sustainability Market Revenue (US$ Mn) Market Share by Componentin 2022
- Figure 86: APAC Green Technology & Sustainability Market Market Attractiveness Analysis by Component, 2016-2032
- Figure 87: APAC Green Technology & Sustainability Market Revenue (US$ Mn) Market Share by Industryin 2022
- Figure 88: APAC Green Technology & Sustainability Market Market Attractiveness Analysis by Industry, 2016-2032
- Figure 89: APAC Green Technology & Sustainability Market Revenue (US$ Mn) Market Share by Technologyin 2022
- Figure 90: APAC Green Technology & Sustainability Market Market Attractiveness Analysis by Technology, 2016-2032
- Figure 91: APAC Green Technology & Sustainability Market Revenue (US$ Mn) Market Share by Country in 2022
- Figure 92: APAC Green Technology & Sustainability Market Market Attractiveness Analysis by Country, 2016-2032
- Figure 93: APAC Green Technology & Sustainability Market Market Revenue (US$ Mn) (2016-2032)
- Figure 94: APAC Green Technology & Sustainability Market Market Revenue (US$ Mn) Comparison by Country (2016-2032)
- Figure 95: APAC Green Technology & Sustainability Market Market Revenue (US$ Mn) Comparison by Component (2016-2032)
- Figure 96: APAC Green Technology & Sustainability Market Market Revenue (US$ Mn) Comparison by Industry (2016-2032)
- Figure 97: APAC Green Technology & Sustainability Market Market Revenue (US$ Mn) Comparison by Technology (2016-2032)
- Figure 98: APAC Green Technology & Sustainability Market Market Y-o-Y Growth Rate Comparison by Country (2016-2032)
- Figure 99: APAC Green Technology & Sustainability Market Market Y-o-Y Growth Rate Comparison by Component (2016-2032)
- Figure 100: APAC Green Technology & Sustainability Market Market Y-o-Y Growth Rate Comparison by Industry (2016-2032)
- Figure 101: APAC Green Technology & Sustainability Market Market Y-o-Y Growth Rate Comparison by Technology (2016-2032)
- Figure 102: APAC Green Technology & Sustainability Market Market Share Comparison by Country (2016-2032)
- Figure 103: APAC Green Technology & Sustainability Market Market Share Comparison by Component (2016-2032)
- Figure 104: APAC Green Technology & Sustainability Market Market Share Comparison by Industry (2016-2032)
- Figure 105: APAC Green Technology & Sustainability Market Market Share Comparison by Technology (2016-2032)
- Figure 106: Latin America Green Technology & Sustainability Market Revenue (US$ Mn) Market Share by Componentin 2022
- Figure 107: Latin America Green Technology & Sustainability Market Market Attractiveness Analysis by Component, 2016-2032
- Figure 108: Latin America Green Technology & Sustainability Market Revenue (US$ Mn) Market Share by Industryin 2022
- Figure 109: Latin America Green Technology & Sustainability Market Market Attractiveness Analysis by Industry, 2016-2032
- Figure 110: Latin America Green Technology & Sustainability Market Revenue (US$ Mn) Market Share by Technologyin 2022
- Figure 111: Latin America Green Technology & Sustainability Market Market Attractiveness Analysis by Technology, 2016-2032
- Figure 112: Latin America Green Technology & Sustainability Market Revenue (US$ Mn) Market Share by Country in 2022
- Figure 113: Latin America Green Technology & Sustainability Market Market Attractiveness Analysis by Country, 2016-2032
- Figure 114: Latin America Green Technology & Sustainability Market Market Revenue (US$ Mn) (2016-2032)
- Figure 115: Latin America Green Technology & Sustainability Market Market Revenue (US$ Mn) Comparison by Country (2016-2032)
- Figure 116: Latin America Green Technology & Sustainability Market Market Revenue (US$ Mn) Comparison by Component (2016-2032)
- Figure 117: Latin America Green Technology & Sustainability Market Market Revenue (US$ Mn) Comparison by Industry (2016-2032)
- Figure 118: Latin America Green Technology & Sustainability Market Market Revenue (US$ Mn) Comparison by Technology (2016-2032)
- Figure 119: Latin America Green Technology & Sustainability Market Market Y-o-Y Growth Rate Comparison by Country (2016-2032)
- Figure 120: Latin America Green Technology & Sustainability Market Market Y-o-Y Growth Rate Comparison by Component (2016-2032)
- Figure 121: Latin America Green Technology & Sustainability Market Market Y-o-Y Growth Rate Comparison by Industry (2016-2032)
- Figure 122: Latin America Green Technology & Sustainability Market Market Y-o-Y Growth Rate Comparison by Technology (2016-2032)
- Figure 123: Latin America Green Technology & Sustainability Market Market Share Comparison by Country (2016-2032)
- Figure 124: Latin America Green Technology & Sustainability Market Market Share Comparison by Component (2016-2032)
- Figure 125: Latin America Green Technology & Sustainability Market Market Share Comparison by Industry (2016-2032)
- Figure 126: Latin America Green Technology & Sustainability Market Market Share Comparison by Technology (2016-2032)
- Figure 127: Middle East & Africa Green Technology & Sustainability Market Revenue (US$ Mn) Market Share by Componentin 2022
- Figure 128: Middle East & Africa Green Technology & Sustainability Market Market Attractiveness Analysis by Component, 2016-2032
- Figure 129: Middle East & Africa Green Technology & Sustainability Market Revenue (US$ Mn) Market Share by Industryin 2022
- Figure 130: Middle East & Africa Green Technology & Sustainability Market Market Attractiveness Analysis by Industry, 2016-2032
- Figure 131: Middle East & Africa Green Technology & Sustainability Market Revenue (US$ Mn) Market Share by Technologyin 2022
- Figure 132: Middle East & Africa Green Technology & Sustainability Market Market Attractiveness Analysis by Technology, 2016-2032
- Figure 133: Middle East & Africa Green Technology & Sustainability Market Revenue (US$ Mn) Market Share by Country in 2022
- Figure 134: Middle East & Africa Green Technology & Sustainability Market Market Attractiveness Analysis by Country, 2016-2032
- Figure 135: Middle East & Africa Green Technology & Sustainability Market Market Revenue (US$ Mn) (2016-2032)
- Figure 136: Middle East & Africa Green Technology & Sustainability Market Market Revenue (US$ Mn) Comparison by Country (2016-2032)
- Figure 137: Middle East & Africa Green Technology & Sustainability Market Market Revenue (US$ Mn) Comparison by Component (2016-2032)
- Figure 138: Middle East & Africa Green Technology & Sustainability Market Market Revenue (US$ Mn) Comparison by Industry (2016-2032)
- Figure 139: Middle East & Africa Green Technology & Sustainability Market Market Revenue (US$ Mn) Comparison by Technology (2016-2032)
- Figure 140: Middle East & Africa Green Technology & Sustainability Market Market Y-o-Y Growth Rate Comparison by Country (2016-2032)
- Figure 141: Middle East & Africa Green Technology & Sustainability Market Market Y-o-Y Growth Rate Comparison by Component (2016-2032)
- Figure 142: Middle East & Africa Green Technology & Sustainability Market Market Y-o-Y Growth Rate Comparison by Industry (2016-2032)
- Figure 143: Middle East & Africa Green Technology & Sustainability Market Market Y-o-Y Growth Rate Comparison by Technology (2016-2032)
- Figure 144: Middle East & Africa Green Technology & Sustainability Market Market Share Comparison by Country (2016-2032)
- Figure 145: Middle East & Africa Green Technology & Sustainability Market Market Share Comparison by Component (2016-2032)
- Figure 146: Middle East & Africa Green Technology & Sustainability Market Market Share Comparison by Industry (2016-2032)
- Figure 147: Middle East & Africa Green Technology & Sustainability Market Market Share Comparison by Technology (2016-2032)
"
- List of Tables
- "
- Table 1: Global Green Technology & Sustainability Market Market Comparison by Component (2016-2032)
- Table 2: Global Green Technology & Sustainability Market Market Comparison by Industry (2016-2032)
- Table 3: Global Green Technology & Sustainability Market Market Comparison by Technology (2016-2032)
- Table 4: Global Green Technology & Sustainability Market Revenue (US$ Mn) Comparison by Region (2016-2032)
- Table 5: Global Green Technology & Sustainability Market Market Revenue (US$ Mn) (2016-2032)
- Table 6: Global Green Technology & Sustainability Market Market Revenue (US$ Mn) Comparison by Region (2016-2032)
- Table 7: Global Green Technology & Sustainability Market Market Revenue (US$ Mn) Comparison by Component (2016-2032)
- Table 8: Global Green Technology & Sustainability Market Market Revenue (US$ Mn) Comparison by Industry (2016-2032)
- Table 9: Global Green Technology & Sustainability Market Market Revenue (US$ Mn) Comparison by Technology (2016-2032)
- Table 10: Global Green Technology & Sustainability Market Market Y-o-Y Growth Rate Comparison by Region (2016-2032)
- Table 11: Global Green Technology & Sustainability Market Market Y-o-Y Growth Rate Comparison by Component (2016-2032)
- Table 12: Global Green Technology & Sustainability Market Market Y-o-Y Growth Rate Comparison by Industry (2016-2032)
- Table 13: Global Green Technology & Sustainability Market Market Y-o-Y Growth Rate Comparison by Technology (2016-2032)
- Table 14: Global Green Technology & Sustainability Market Market Share Comparison by Region (2016-2032)
- Table 15: Global Green Technology & Sustainability Market Market Share Comparison by Component (2016-2032)
- Table 16: Global Green Technology & Sustainability Market Market Share Comparison by Industry (2016-2032)
- Table 17: Global Green Technology & Sustainability Market Market Share Comparison by Technology (2016-2032)
- Table 18: North America Green Technology & Sustainability Market Market Comparison by Industry (2016-2032)
- Table 19: North America Green Technology & Sustainability Market Market Comparison by Technology (2016-2032)
- Table 20: North America Green Technology & Sustainability Market Revenue (US$ Mn) Comparison by Country (2016-2032)
- Table 21: North America Green Technology & Sustainability Market Market Revenue (US$ Mn) (2016-2032)
- Table 22: North America Green Technology & Sustainability Market Market Revenue (US$ Mn) Comparison by Country (2016-2032)
- Table 23: North America Green Technology & Sustainability Market Market Revenue (US$ Mn) Comparison by Component (2016-2032)
- Table 24: North America Green Technology & Sustainability Market Market Revenue (US$ Mn) Comparison by Industry (2016-2032)
- Table 25: North America Green Technology & Sustainability Market Market Revenue (US$ Mn) Comparison by Technology (2016-2032)
- Table 26: North America Green Technology & Sustainability Market Market Y-o-Y Growth Rate Comparison by Country (2016-2032)
- Table 27: North America Green Technology & Sustainability Market Market Y-o-Y Growth Rate Comparison by Component (2016-2032)
- Table 28: North America Green Technology & Sustainability Market Market Y-o-Y Growth Rate Comparison by Industry (2016-2032)
- Table 29: North America Green Technology & Sustainability Market Market Y-o-Y Growth Rate Comparison by Technology (2016-2032)
- Table 30: North America Green Technology & Sustainability Market Market Share Comparison by Country (2016-2032)
- Table 31: North America Green Technology & Sustainability Market Market Share Comparison by Component (2016-2032)
- Table 32: North America Green Technology & Sustainability Market Market Share Comparison by Industry (2016-2032)
- Table 33: North America Green Technology & Sustainability Market Market Share Comparison by Technology (2016-2032)
- Table 34: Western Europe Green Technology & Sustainability Market Market Comparison by Component (2016-2032)
- Table 35: Western Europe Green Technology & Sustainability Market Market Comparison by Industry (2016-2032)
- Table 36: Western Europe Green Technology & Sustainability Market Market Comparison by Technology (2016-2032)
- Table 37: Western Europe Green Technology & Sustainability Market Revenue (US$ Mn) Comparison by Country (2016-2032)
- Table 38: Western Europe Green Technology & Sustainability Market Market Revenue (US$ Mn) (2016-2032)
- Table 39: Western Europe Green Technology & Sustainability Market Market Revenue (US$ Mn) Comparison by Country (2016-2032)
- Table 40: Western Europe Green Technology & Sustainability Market Market Revenue (US$ Mn) Comparison by Component (2016-2032)
- Table 41: Western Europe Green Technology & Sustainability Market Market Revenue (US$ Mn) Comparison by Industry (2016-2032)
- Table 42: Western Europe Green Technology & Sustainability Market Market Revenue (US$ Mn) Comparison by Technology (2016-2032)
- Table 43: Western Europe Green Technology & Sustainability Market Market Y-o-Y Growth Rate Comparison by Country (2016-2032)
- Table 44: Western Europe Green Technology & Sustainability Market Market Y-o-Y Growth Rate Comparison by Component (2016-2032)
- Table 45: Western Europe Green Technology & Sustainability Market Market Y-o-Y Growth Rate Comparison by Industry (2016-2032)
- Table 46: Western Europe Green Technology & Sustainability Market Market Y-o-Y Growth Rate Comparison by Technology (2016-2032)
- Table 47: Western Europe Green Technology & Sustainability Market Market Share Comparison by Country (2016-2032)
- Table 48: Western Europe Green Technology & Sustainability Market Market Share Comparison by Component (2016-2032)
- Table 49: Western Europe Green Technology & Sustainability Market Market Share Comparison by Industry (2016-2032)
- Table 50: Western Europe Green Technology & Sustainability Market Market Share Comparison by Technology (2016-2032)
- Table 51: Eastern Europe Green Technology & Sustainability Market Market Comparison by Component (2016-2032)
- Table 52: Eastern Europe Green Technology & Sustainability Market Market Comparison by Industry (2016-2032)
- Table 53: Eastern Europe Green Technology & Sustainability Market Market Comparison by Technology (2016-2032)
- Table 54: Eastern Europe Green Technology & Sustainability Market Revenue (US$ Mn) Comparison by Country (2016-2032)
- Table 55: Eastern Europe Green Technology & Sustainability Market Market Revenue (US$ Mn) (2016-2032)
- Table 56: Eastern Europe Green Technology & Sustainability Market Market Revenue (US$ Mn) Comparison by Country (2016-2032)
- Table 57: Eastern Europe Green Technology & Sustainability Market Market Revenue (US$ Mn) Comparison by Component (2016-2032)
- Table 58: Eastern Europe Green Technology & Sustainability Market Market Revenue (US$ Mn) Comparison by Industry (2016-2032)
- Table 59: Eastern Europe Green Technology & Sustainability Market Market Revenue (US$ Mn) Comparison by Technology (2016-2032)
- Table 60: Eastern Europe Green Technology & Sustainability Market Market Y-o-Y Growth Rate Comparison by Country (2016-2032)
- Table 61: Eastern Europe Green Technology & Sustainability Market Market Y-o-Y Growth Rate Comparison by Component (2016-2032)
- Table 62: Eastern Europe Green Technology & Sustainability Market Market Y-o-Y Growth Rate Comparison by Industry (2016-2032)
- Table 63: Eastern Europe Green Technology & Sustainability Market Market Y-o-Y Growth Rate Comparison by Technology (2016-2032)
- Table 64: Eastern Europe Green Technology & Sustainability Market Market Share Comparison by Country (2016-2032)
- Table 65: Eastern Europe Green Technology & Sustainability Market Market Share Comparison by Component (2016-2032)
- Table 66: Eastern Europe Green Technology & Sustainability Market Market Share Comparison by Industry (2016-2032)
- Table 67: Eastern Europe Green Technology & Sustainability Market Market Share Comparison by Technology (2016-2032)
- Table 68: APAC Green Technology & Sustainability Market Market Comparison by Component (2016-2032)
- Table 69: APAC Green Technology & Sustainability Market Market Comparison by Industry (2016-2032)
- Table 70: APAC Green Technology & Sustainability Market Market Comparison by Technology (2016-2032)
- Table 71: APAC Green Technology & Sustainability Market Revenue (US$ Mn) Comparison by Country (2016-2032)
- Table 72: APAC Green Technology & Sustainability Market Market Revenue (US$ Mn) (2016-2032)
- Table 73: APAC Green Technology & Sustainability Market Market Revenue (US$ Mn) Comparison by Country (2016-2032)
- Table 74: APAC Green Technology & Sustainability Market Market Revenue (US$ Mn) Comparison by Component (2016-2032)
- Table 75: APAC Green Technology & Sustainability Market Market Revenue (US$ Mn) Comparison by Industry (2016-2032)
- Table 76: APAC Green Technology & Sustainability Market Market Revenue (US$ Mn) Comparison by Technology (2016-2032)
- Table 77: APAC Green Technology & Sustainability Market Market Y-o-Y Growth Rate Comparison by Country (2016-2032)
- Table 78: APAC Green Technology & Sustainability Market Market Y-o-Y Growth Rate Comparison by Component (2016-2032)
- Table 79: APAC Green Technology & Sustainability Market Market Y-o-Y Growth Rate Comparison by Industry (2016-2032)
- Table 80: APAC Green Technology & Sustainability Market Market Y-o-Y Growth Rate Comparison by Technology (2016-2032)
- Table 81: APAC Green Technology & Sustainability Market Market Share Comparison by Country (2016-2032)
- Table 82: APAC Green Technology & Sustainability Market Market Share Comparison by Component (2016-2032)
- Table 83: APAC Green Technology & Sustainability Market Market Share Comparison by Industry (2016-2032)
- Table 84: APAC Green Technology & Sustainability Market Market Share Comparison by Technology (2016-2032)
- Table 85: Latin America Green Technology & Sustainability Market Market Comparison by Component (2016-2032)
- Table 86: Latin America Green Technology & Sustainability Market Market Comparison by Industry (2016-2032)
- Table 87: Latin America Green Technology & Sustainability Market Market Comparison by Technology (2016-2032)
- Table 88: Latin America Green Technology & Sustainability Market Revenue (US$ Mn) Comparison by Country (2016-2032)
- Table 89: Latin America Green Technology & Sustainability Market Market Revenue (US$ Mn) (2016-2032)
- Table 90: Latin America Green Technology & Sustainability Market Market Revenue (US$ Mn) Comparison by Country (2016-2032)
- Table 91: Latin America Green Technology & Sustainability Market Market Revenue (US$ Mn) Comparison by Component (2016-2032)
- Table 92: Latin America Green Technology & Sustainability Market Market Revenue (US$ Mn) Comparison by Industry (2016-2032)
- Table 93: Latin America Green Technology & Sustainability Market Market Revenue (US$ Mn) Comparison by Technology (2016-2032)
- Table 94: Latin America Green Technology & Sustainability Market Market Y-o-Y Growth Rate Comparison by Country (2016-2032)
- Table 95: Latin America Green Technology & Sustainability Market Market Y-o-Y Growth Rate Comparison by Component (2016-2032)
- Table 96: Latin America Green Technology & Sustainability Market Market Y-o-Y Growth Rate Comparison by Industry (2016-2032)
- Table 97: Latin America Green Technology & Sustainability Market Market Y-o-Y Growth Rate Comparison by Technology (2016-2032)
- Table 98: Latin America Green Technology & Sustainability Market Market Share Comparison by Country (2016-2032)
- Table 99: Latin America Green Technology & Sustainability Market Market Share Comparison by Component (2016-2032)
- Table 100: Latin America Green Technology & Sustainability Market Market Share Comparison by Industry (2016-2032)
- Table 101: Latin America Green Technology & Sustainability Market Market Share Comparison by Technology (2016-2032)
- Table 102: Middle East & Africa Green Technology & Sustainability Market Market Comparison by Component (2016-2032)
- Table 103: Middle East & Africa Green Technology & Sustainability Market Market Comparison by Industry (2016-2032)
- Table 104: Middle East & Africa Green Technology & Sustainability Market Market Comparison by Technology (2016-2032)
- Table 105: Middle East & Africa Green Technology & Sustainability Market Revenue (US$ Mn) Comparison by Country (2016-2032)
- Table 106: Middle East & Africa Green Technology & Sustainability Market Market Revenue (US$ Mn) (2016-2032)
- Table 107: Middle East & Africa Green Technology & Sustainability Market Market Revenue (US$ Mn) Comparison by Country (2016-2032)
- Table 108: Middle East & Africa Green Technology & Sustainability Market Market Revenue (US$ Mn) Comparison by Component (2016-2032)
- Table 109: Middle East & Africa Green Technology & Sustainability Market Market Revenue (US$ Mn) Comparison by Industry (2016-2032)
- Table 110: Middle East & Africa Green Technology & Sustainability Market Market Revenue (US$ Mn) Comparison by Technology (2016-2032)
- Table 111: Middle East & Africa Green Technology & Sustainability Market Market Y-o-Y Growth Rate Comparison by Country (2016-2032)
- Table 112: Middle East & Africa Green Technology & Sustainability Market Market Y-o-Y Growth Rate Comparison by Component (2016-2032)
- Table 113: Middle East & Africa Green Technology & Sustainability Market Market Y-o-Y Growth Rate Comparison by Industry (2016-2032)
- Table 114: Middle East & Africa Green Technology & Sustainability Market Market Y-o-Y Growth Rate Comparison by Technology (2016-2032)
- Table 115: Middle East & Africa Green Technology & Sustainability Market Market Share Comparison by Country (2016-2032)
- Table 116: Middle East & Africa Green Technology & Sustainability Market Market Share Comparison by Component (2016-2032)
- Table 117: Middle East & Africa Green Technology & Sustainability Market Market Share Comparison by Industry (2016-2032)
- Table 118: Middle East & Africa Green Technology & Sustainability Market Market Share Comparison by Technology (2016-2032)
- 1. Executive Summary
-
- General Electric
- Wolters Kluwer N.V.
- Salesforce, Inc.
- Microsoft
- Schneider Electric
- Engie Impact
- Cority (Enviance)
- Sensus, a Xylem brand
- LO3 Energy
- CropX, Inc.
- Trace Genomics
- IBM
- Enablon
- Enviance
- Consensys
- Hortau
- SMAP Energy
- Treevia
- Pycno
Our Clients


View Our Licence Options
