
Green Building Material Market By Type(Structural, Exterior, Interior, Others), By Application (Roofing, Framing, Insulation, Interior Finishing, Exterior siding), By Region And Companies - Industry Segment Outlook, Market Assessment, Competition Scenario, Trends, And Forecast 2023-2032
-
3468
-
May 2023
-
188
-


-
This report was compiled by Kalyani Khudsange Kalyani Khudsange is a Research Analyst at Prudour Pvt. Ltd. with 2.5 years of experience in market research and a strong technical background in Chemical Engineering and manufacturing. Correspondence Sr. Research Analyst Linkedin | Detailed Market research Methodology Our methodology involves a mix of primary research, including interviews with leading mental health experts, and secondary research from reputable medical journals and databases. View Detailed Methodology Page
-
Quick Navigation
Report Overview
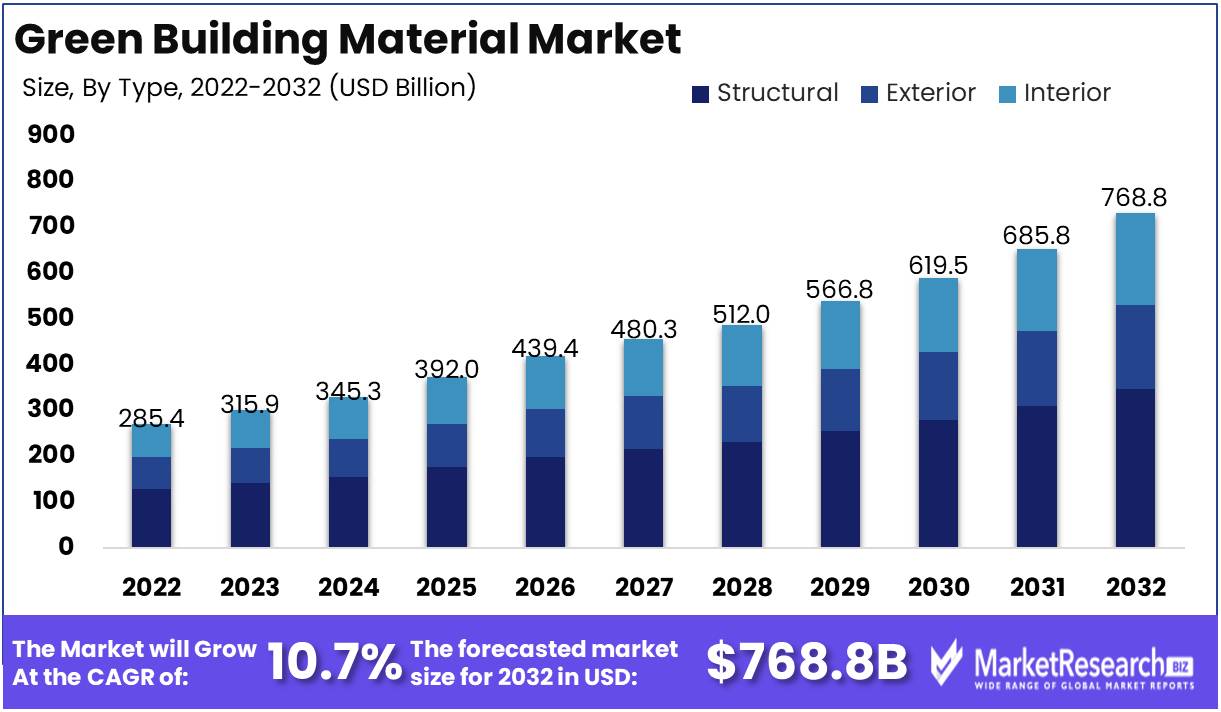
Green Building Material Market size is expected to be worth around USD 768.8 Bn by 2032 from USD 285.4 Bn in 2022, growing at a CAGR of 10.7% during the forecast period from 2023 to 2032.
The Green Building Material Market is a rapidly expanding and dynamic market that is acquiring significant traction in response to the worldwide emphasis on environmental sustainability. As the demand for energy-efficient and environmentally favorable building materials continues to rise, this market is projected to experience substantial growth in the near future. Its definition, objectives, significance, and benefits, as well as notable innovations in the field, substantial investments and incorporation into diverse products and services, expansive growth and diverse applications, the industries actively investing in the market, and the key market drivers will be investigated in greater detail.
Utilizing green building materials is not only beneficial for environmental preservation but also for the health of the building's occupants. Green building materials reduce the carbon footprint of construction activities, promoting sustainability on multiple levels. In addition to reducing waste, these materials actively promote recycling and the use of reclaimed materials. Green buildings successfully reduce energy consumption and the need for artificial heating and cooling systems by maximizing natural illumination and ventilation. This results in decreased energy costs, decreased carbon emissions, and improved environmental sustainability. In addition, the use of green building materials significantly contributes to enhanced indoor air quality, thereby creating healthier living and working environments and mitigating the risks of respiratory ailments commonly associated with conventional building materials.
The Green Building Material Market thrives on constant innovation and the introduction of revolutionary products that test the limits of sustainability. In this field, innovations include the creation of novel renewable materials, such as bamboo and cork, that are more resource-efficient and sustainable than their conventional counterparts. In addition, the growing popularity of recycled materials, such as plastic and glass, is integrated extensively into the domain of green building materials. Moreover, innovations in energy-efficient materials, as exemplified by the proliferation of solar panels, have revolutionized the capacity of green building materials to contribute to a structure's power requirements, thereby further reducing energy consumption and carbon footprints.
Driving Factors
Environmental Sustainability
Climate change and environmental sustainability concerns are fueling the demand for green building materials. Green building materials are intended to have a minimal environmental impact throughout their entire lifecycle, from extraction and production to installation, use, and disposal. The adoption of green building materials has resulted from the emphasis on lowering carbon emissions, conserving resources, and promoting sustainable practices.
Energy Efficiency and Cost Savings
Green construction materials are renowned for their energy efficiency. They contribute to the enhancement of a building's energy performance by reducing energy consumption for heating, cooling, and illumination. This, in turn, results in significant energy bill cost savings over the lifetime of a building. The potential for long-term financial benefits is a significant motivator for the use of green building materials.
Government Regulations and Incentives
Globally, governments are instituting regulations and providing incentives to encourage sustainable building practices. Numerous nations have established energy efficiency standards and green building certification programs that encourage or mandate the utilization of green building materials. In addition, financial incentives, tax credits, and grants are frequently offered to developers and homeowners whose projects incorporate green building materials. The market demand for green building materials is driven by these policies.
The Relationship Between Health and Indoor Environmental Quality
Green building materials prioritize occupants' health and well-being. They are intended to reduce the presence of hazardous substances, volatile organic compounds (VOCs), and other indoor pollutants. By increasing indoor air quality and decreasing contaminant exposure, green building materials contribute to healthier and more comfortable living and working environments. Growing awareness of the adverse health effects of domestic environments is a major factor in the adoption of green building materials.
Market Demand and Consumer Preference
There is a growing demand across industries for environmentally favorable and sustainable products, and the construction industry is no exception. Consumers, including homeowners, tenants, and businesses, are becoming more environmentally conscious and actively seeking green buildings. Green building materials offer developers, builders, and manufacturers a distinct selling factor and market advantage. Meeting consumer demand and remaining ahead of market trends are significant growth drivers for the market for green building materials.
Restraining Factors
Compared to conventional building materials, green building materials have a high initial cost
The high price of green building materials is one of the most significant factors preventing their widespread adoption. Green building materials typically necessitate more sophisticated manufacturing processes and higher-quality materials, which can result in a higher initial cost than conventional building materials. This high cost can be challenging for builders and consumers to justify in the short term, as they may not see an immediate return on their investment. It is essential to note, however, that green building materials typically have a longer lifespan than conventional building materials and have been demonstrated to save money over time due to their energy efficiency and durability.
Limited Availability and Access to Green Building Materials in Certain Regions
The limited availability and accessibility of green building materials in certain regions is another factor that inhibits their widespread use. This limited availability is frequently the result of insufficient demand or the absence of the necessary infrastructure to produce and distribute these materials on a larger scale. This can result in increased transportation costs, making the materials more costly when they reach their final destination. In addition, some regions may lack the training and education required to effectively implement green building practices or lack access to the necessary materials.
Limited Design Options and Aesthetic Appeal of Some Green Building Materials
Although the benefits of green building materials are widely recognized, some of these materials may not offer the same design flexibility and aesthetic allure as conventional building materials. This can make it difficult for builders and consumers to justify the use of green building materials if they prefer the appearance of conventional materials. Recycled wood, bamboo, and eco-friendly coatings are examples of currently available green building materials that offer both sustainable benefits and aesthetic appeal.
Limited Availability of Skilled Labor for Green Building Practices
The limited availability of skilled labor for green building practices is a significant factor restraining the Green Building Material Market. While there is a growing demand for these skills, many employees may lack the training and experience necessary to effectively implement green building practices. This can lead to higher labor costs and make it challenging for builders and homeowners to justify the use of green building materials.
Type Analysis
Due to their environmental benefits, sustainable materials such as bamboo, straw bales, and adobe bricks are acquiring popularity in the structural segment of the green building materials market. FSC-certified wood, which is derived from sustainably managed forests, is another popular choice for structural applications in green building projects.
The increasing environmental consciousness of consumers is reflected in their purchase of green building materials. The structural segment is acquiring popularity among consumers due to its environmental benefits, such as a smaller carbon footprint, increased energy efficiency, and the ability to be recycled. In addition, these materials provide superior performance and durability and are cost-effective over time.
Due to a number of factors, the structural segment is anticipated to experience the highest development rate in the coming years. The rising demand for eco-friendly housing and government initiatives promoting the use of green building materials are anticipated to increase the demand for structural materials. In addition, technological advances are resulting in the creation of innovative construction materials, which encourage the use of sustainable materials in green building projects.
Application Analysis
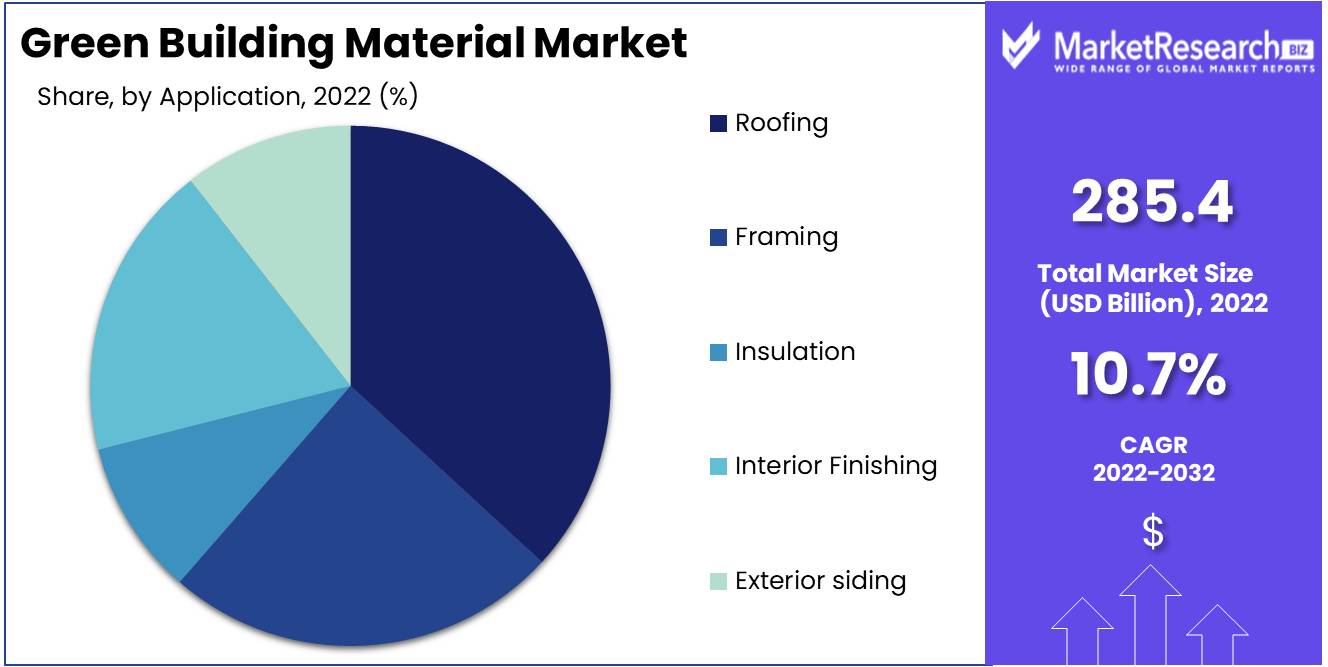
The roofing segment dominated the green building materials market. This segment includes roofing materials such as photovoltaic tiles, green roofs, and cool roofs, which offer environmental benefits such as increased energy efficiency and a reduced urban heat island effect.
Consumers are seeking roofing materials that offer environmental benefits, such as increased energy efficiency and a smaller carbon footprint, as they become more environmentally conscious. Due to their environmental benefits, there is a growing demand for solar tiles and green roofs in the roofing industry.
Increasing demand for energy-efficient and environmentally-friendly roofing materials is anticipated to propel the roofing segment to the highest growth rate over the next few years. Global efforts to reduce carbon footprint and mitigate the effects of urbanization are anticipated to increase demand for environmentally friendly roofing materials. Innovative roofing materials are being developed as a result of technological advancements, promoting their use in green building projects.
Key Market Segments
By Type
- Structural
- Exterior
- Interior
- Others (Solar and Roofing)
By Application
- Roofing
- Framing
- Insulation
- Interior Finishing
- Exterior siding
Growth Opportunity
Development of innovative green building materials and technologies
Innovative green building materials and technologies have created new sustainable construction opportunities. Using green concrete, which is created by substituting conventional concrete with industrial byproducts such as fly ash, can reduce CO2 emissions by up to 80%. In addition, green roofs and walls can absorb carbon dioxide, reduce the effects of heat islands, and provide habitat for birds and invertebrates.
In addition, novel insulation materials made of natural fibers such as wool, cotton, and hemp can reduce energy consumption and increase energy efficiency. In addition, advancements in renewable energy technologies, such as solar power, wind turbines, and geothermal heating and cooling systems, have created new opportunities for sustainable building practices.
Growing demand for green roofs and walls in urban areas
Green roofs and walls have gained popularity in urban areas as a result of their many advantages. These structures absorb precipitation, mitigate the effects of heat islands, and provide insulation, thereby reducing energy consumption. Additionally, green roofs and walls contribute to the aesthetic appeal of the adjacent buildings and can serve as a habitat for insects and birds.
Increase in consumer awareness and demand
Increased consumer awareness and demand for eco-friendly and sustainable building materials also contribute to the growth of the green building market. Consumers are now more aware of the environmental impact of conventional building materials and are willing to pay a premium for eco-friendly and sustainable products.
Latest Trends
The growing popularity of green roofs and walls for energy efficiency and aesthetic appeal
In the construction industry, green roofs and walls are gaining popularity due to their energy efficiency and aesthetic appeal. A green roof is a roof that is covered with vegetation, whereas a green wall is a wall that is covered with plants. These structures provide numerous advantages, such as natural insulation, air purification, and enhanced aesthetic appeal. They also contribute to energy conservation by reducing the amount of heat absorbed by buildings, resulting in reduced ventilation expenses. Increasing demand for green roofs and walls has led to a rise in the use of green building materials, such as insulation materials, waterproofing membranes, and living roof systems.
Increasing use of recycled building materials like reclaimed wood and recycled steel
The demand for recycled construction materials, such as reclaimed wood and recycled steel, is growing. As a means of lowering their carbon footprint and fostering sustainability, more construction companies are adopting these materials. Recycled building materials offer a number of benefits, including less waste, lower costs, and a reduced environmental impact. For instance, reclaimed wood is readily available, inexpensive, and adds a distinctive aesthetic value to a structure. Recycled steel is gaining popularity among construction companies due to its durability, adaptability, and accessibility.
Growing Adoption of Green Certification Programs
Green certification programs, such as LEED, BREEAM, and WELL, are rapidly becoming standard construction requirements. To demonstrate their commitment to sustainability and environmental stewardship, an increasing number of businesses are adopting these programs. These programs certify buildings that satisfy specific sustainability criteria, establishing a standard for sustainable structures. Green-certified buildings typically have higher property values, reduced operating costs, and a smaller carbon footprint, which makes them appealing to developers and investors.
Regional Analysis
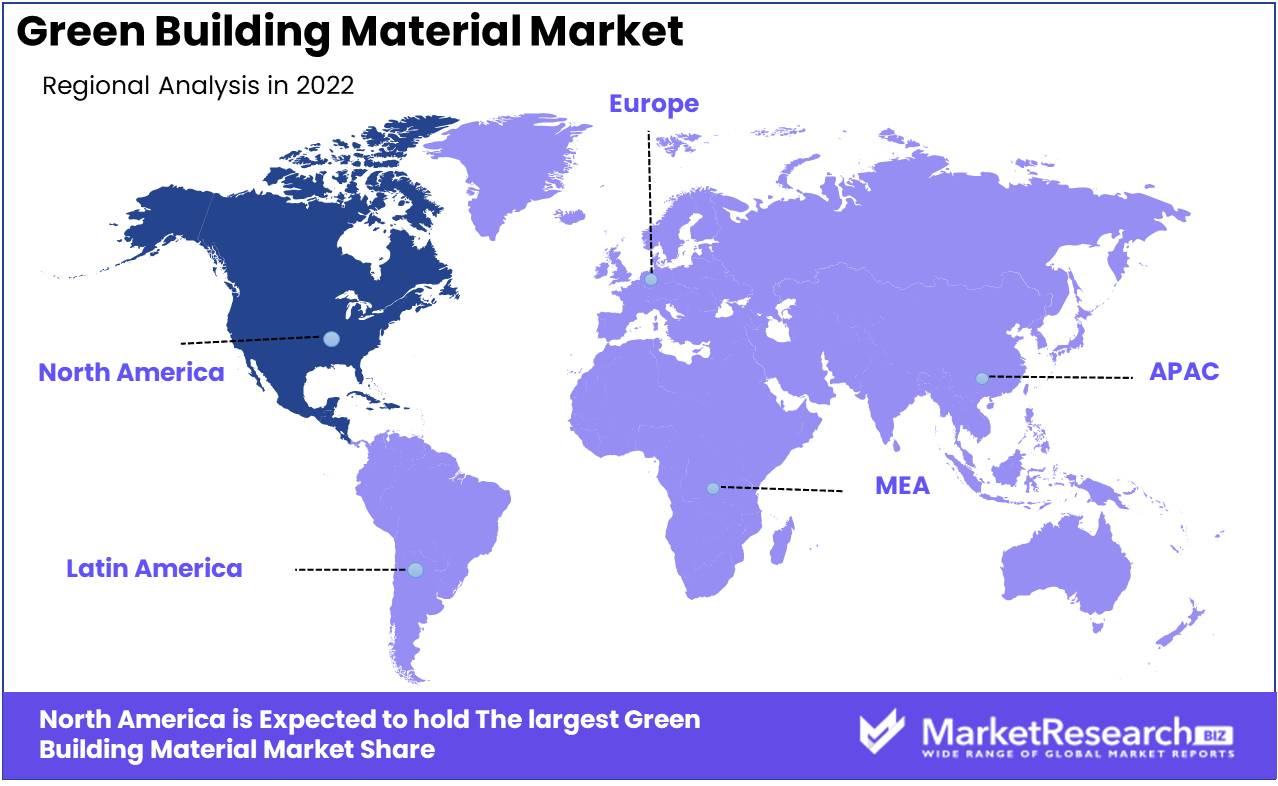
In the global green building materials market, North America has been identified as one of the dominating regions. This remarkable accomplishment is a result of the increasing adoption of green building codes and standards, which were developed to aid the construction industry in reducing their carbon footprint and promoting sustainable practices.
These green building codes and standards have been implemented to help meet the growing demand for eco-friendly structures by reducing the environmental impact of buildings. This indicates that eco-friendly building materials, such as bamboo, recycled steel, lime, hemp, and straw bale, are now being utilized by the construction industry.
The fact that green building materials pose no threat to the environment is one of their many advantages. They are non-hazardous and non-toxic, minimizing the need for disposal after use. In addition, these materials substantially reduce energy consumption, allowing buildings to operate more efficiently while simultaneously reducing carbon emissions.
This growing trend of ecological building in North America is a welcome development. It indicates that the emphasis has shifted from producing only aesthetically appealing structures to functional, sustainable, and cost-effective structures. By incorporating new technology, such as LED lighting and renewable energy, green building materials make it possible to reduce energy consumption and preserve precious natural resources.
Key Regions and Countries
North America
- US
- Canada
- Mexico
Western Europe
- Germany
- France
- The UK
- Spain
- Italy
- Portugal
- Ireland
- Austria
- Switzerland
- Benelux
- Nordic
- Rest of Western Europe
Eastern Europe
- Russia
- Poland
- The Czech Republic
- Greece
- Rest of Eastern Europe
APAC
- China
- Japan
- South Korea
- India
- Australia & New Zealand
- Indonesia
- Malaysia
- Philippines
- Singapore
- Thailand
- Vietnam
- Rest of APAC
Latin America
- Brazil
- Colombia
- Chile
- Argentina
- Costa Rica
- Rest of Latin America
Middle East & Africa
- Algeria
- Egypt
- Israel
- Kuwait
- Nigeria
- Saudi Arabia
- South Africa
- Turkey
- United Arab Emirates
- Rest of MEA
Key Players Analysis
In the coming years, the Green Building Materials market is anticipated to expand significantly, with key players competing for a larger market share. BASF SE is a global champion in the production of innovative and environmentally friendly construction materials. The company offers, among other things, insulation systems, concrete admixtures, and waterproofing products.
Owens Corning is a leading manufacturer of fiberglass composites, roofing materials, and insulation. Their products and systems are designed to satisfy a variety of green building standards.
The Kingspan Group is a building materials company that focuses on eco-friendly solutions, especially in the areas of insulation and solar energy systems.
Kolon Industries is a South Korean company that provides a variety of construction materials, including eco-friendly insulation, roofing, and cladding, among others.
Forbo Flooring Systems is a company that specializes in eco-friendly and sustainable flooring options.
Top Key Players in Green Building Material Market
- BASF SE
- Owens Corning
- Forbo International SA
- Alumasc Group Plc
- Bauder Limited
- Binderholz GmbH
- CertainTeed Corporation
- RedBuilt LLC
- PPG Industries
- DuPont
Recent Development
- In 2021, Owens Corning entered the green building materials market with the introduction of a new line of insulation products made from recycled and renewable materials. This innovation is essential for reducing environmental impact and fostering sustainable building practices.
- In 2020, The German chemical conglomerate BASF also contributed to the trend by introducing a variety of green concrete additives. The new products are intended to reduce the carbon footprint of concrete, which is an indispensable building material.
- In 2019, DowDuPont, another global chemical corporation, joined the green building movement by introducing a new line of bio-based insulation products under the brand name BioBased Insulation. These products are made from renewable resources, making them more environmentally favorable than conventional insulation materials.
- In 2018, Kingspan Group acquired one of Europe's foremost manufacturers of green building materials, Joris Ide. This acquisition strengthens Kingspan's market position and enables the company to offer a broader selection of eco-friendly products.
Report Scope
Report Features Description Market Value (2022) USD 285.4 Bn Forecast Revenue (2032) USD 768.8 Bn CAGR (2023-2032) 10.7% Base Year for Estimation 2022 Historic Period 2016-2022 Forecast Period 2023-2032 Report Coverage Revenue Forecast, Market Dynamics, COVID-19 Impact, Competitive Landscape, Recent Developments Segments Covered By Type(Structural, Exterior, Interior, Others)
By Application (Roofing, Framing, Insulation, Interior Finishing, Exterior siding)Regional Analysis North America – The US, Canada, & Mexico; Western Europe – Germany, France, The UK, Spain, Italy, Portugal, Ireland, Austria, Switzerland, Benelux, Nordic, & Rest of Western Europe; Eastern Europe – Russia, Poland, The Czech Republic, Greece, & Rest of Eastern Europe; APAC – China, Japan, South Korea, India, Australia & New Zealand, Indonesia, Malaysia, Philippines, Singapore, Thailand, Vietnam, & Rest of APAC; Latin America – Brazil, Colombia, Chile, Argentina, Costa Rica, & Rest of Latin America; Middle East & Africa – Algeria, Egypt, Israel, Kuwait, Nigeria, Saudi Arabia, South Africa, Turkey, United Arab Emirates, & Rest of MEA Competitive Landscape BASF SE, Owens Corning, Forbo International SA, Alumasc Group Plc, Bauder Limited, Binderholz GmbH, CertainTeed Corporation, RedBuilt LLC, PPG Industries, DuPont Customization Scope Customization for segments, region/country-level will be provided. Moreover, additional customization can be done based on the requirements. Purchase Options We have three licenses to opt for: Single User License, Multi-User License (Up to 5 Users), Corporate Use License (Unlimited User and Printable PDF) -
- 1. Executive Summary
- 1.1. Definition
- 1.2. Taxonomy
- 1.3. Research Scope
- 1.4. Key Analysis
- 1.5. Key Findings by Major Segments
- 1.6. Top strategies by Major Players
- 2. Global Green Building Material Market Overview
- 2.1. Green Building Material Market Dynamics
- 2.1.1. Drivers
- 2.1.2. Opportunities
- 2.1.3. Restraints
- 2.1.4. Challenges
- 2.2. Macro-economic Factors
- 2.3. Regulatory Framework
- 2.4. Market Investment Feasibility Index
- 2.5. PEST Analysis
- 2.6. PORTER’S Five Force Analysis
- 2.7. Drivers & Restraints Impact Analysis
- 2.8. Industry Chain Analysis
- 2.9. Cost Structure Analysis
- 2.10. Marketing Strategy
- 2.11. Russia-Ukraine War Impact Analysis
- 2.12. Opportunity Map Analysis
- 2.13. Market Competition Scenario Analysis
- 2.14. Product Life Cycle Analysis
- 2.15. Opportunity Orbits
- 2.16. Manufacturer Intensity Map
- 2.17. Major Companies sales by Value & Volume
- 2.1. Green Building Material Market Dynamics
- 3. Global Green Building Material Market Analysis, Opportunity and Forecast, 2016-2032
- 3.1. Global Green Building Material Market Analysis, 2016-2021
- 3.2. Global Green Building Material Market Opportunity and Forecast, 2023-2032
- 3.3. Global Green Building Material Market Analysis, Opportunity and Forecast, By By Type, 2016-2032
- 3.3.1. Global Green Building Material Market Analysis by By Type: Introduction
- 3.3.2. Market Size Absolute $ Opportunity Analysis and Forecast, By By Type, 2016-2032
- 3.3.3. Structural
- 3.3.4. Exterior
- 3.3.5. Interior
- 3.3.6. Others (Solar and Roofing)
- 3.4. Global Green Building Material Market Analysis, Opportunity and Forecast, By By Application, 2016-2032
- 3.4.1. Global Green Building Material Market Analysis by By Application: Introduction
- 3.4.2. Market Size Absolute $ Opportunity Analysis and Forecast, By By Application, 2016-2032
- 3.4.3. Roofing
- 3.4.4. Framing
- 3.4.5. Insulation
- 3.4.6. Interior Finishing
- 3.4.7. Exterior siding
- 4. North America Green Building Material Market Analysis, Opportunity and Forecast, 2016-2032
- 4.1. North America Green Building Material Market Analysis, 2016-2021
- 4.2. North America Green Building Material Market Opportunity and Forecast, 2023-2032
- 4.3. North America Green Building Material Market Analysis, Opportunity and Forecast, By By Type, 2016-2032
- 4.3.1. North America Green Building Material Market Analysis by By Type: Introduction
- 4.3.2. Market Size Absolute $ Opportunity Analysis and Forecast, By By Type, 2016-2032
- 4.3.3. Structural
- 4.3.4. Exterior
- 4.3.5. Interior
- 4.3.6. Others (Solar and Roofing)
- 4.4. North America Green Building Material Market Analysis, Opportunity and Forecast, By By Application, 2016-2032
- 4.4.1. North America Green Building Material Market Analysis by By Application: Introduction
- 4.4.2. Market Size Absolute $ Opportunity Analysis and Forecast, By By Application, 2016-2032
- 4.4.3. Roofing
- 4.4.4. Framing
- 4.4.5. Insulation
- 4.4.6. Interior Finishing
- 4.4.7. Exterior siding
- 4.5. North America Green Building Material Market Analysis, Opportunity and Forecast, By Country , 2016-2032
- 4.5.1. North America Green Building Material Market Analysis by Country : Introduction
- 4.5.2. Market Size Absolute $ Opportunity Analysis and Forecast, Country , 2016-2032
- 4.5.2.1. The US
- 4.5.2.2. Canada
- 4.5.2.3. Mexico
- 5. Western Europe Green Building Material Market Analysis, Opportunity and Forecast, 2016-2032
- 5.1. Western Europe Green Building Material Market Analysis, 2016-2021
- 5.2. Western Europe Green Building Material Market Opportunity and Forecast, 2023-2032
- 5.3. Western Europe Green Building Material Market Analysis, Opportunity and Forecast, By By Type, 2016-2032
- 5.3.1. Western Europe Green Building Material Market Analysis by By Type: Introduction
- 5.3.2. Market Size Absolute $ Opportunity Analysis and Forecast, By By Type, 2016-2032
- 5.3.3. Structural
- 5.3.4. Exterior
- 5.3.5. Interior
- 5.3.6. Others (Solar and Roofing)
- 5.4. Western Europe Green Building Material Market Analysis, Opportunity and Forecast, By By Application, 2016-2032
- 5.4.1. Western Europe Green Building Material Market Analysis by By Application: Introduction
- 5.4.2. Market Size Absolute $ Opportunity Analysis and Forecast, By By Application, 2016-2032
- 5.4.3. Roofing
- 5.4.4. Framing
- 5.4.5. Insulation
- 5.4.6. Interior Finishing
- 5.4.7. Exterior siding
- 5.5. Western Europe Green Building Material Market Analysis, Opportunity and Forecast, By Country , 2016-2032
- 5.5.1. Western Europe Green Building Material Market Analysis by Country : Introduction
- 5.5.2. Market Size Absolute $ Opportunity Analysis and Forecast, Country , 2016-2032
- 5.5.2.1. Germany
- 5.5.2.2. France
- 5.5.2.3. The UK
- 5.5.2.4. Spain
- 5.5.2.5. Italy
- 5.5.2.6. Portugal
- 5.5.2.7. Ireland
- 5.5.2.8. Austria
- 5.5.2.9. Switzerland
- 5.5.2.10. Benelux
- 5.5.2.11. Nordic
- 5.5.2.12. Rest of Western Europe
- 6. Eastern Europe Green Building Material Market Analysis, Opportunity and Forecast, 2016-2032
- 6.1. Eastern Europe Green Building Material Market Analysis, 2016-2021
- 6.2. Eastern Europe Green Building Material Market Opportunity and Forecast, 2023-2032
- 6.3. Eastern Europe Green Building Material Market Analysis, Opportunity and Forecast, By By Type, 2016-2032
- 6.3.1. Eastern Europe Green Building Material Market Analysis by By Type: Introduction
- 6.3.2. Market Size Absolute $ Opportunity Analysis and Forecast, By By Type, 2016-2032
- 6.3.3. Structural
- 6.3.4. Exterior
- 6.3.5. Interior
- 6.3.6. Others (Solar and Roofing)
- 6.4. Eastern Europe Green Building Material Market Analysis, Opportunity and Forecast, By By Application, 2016-2032
- 6.4.1. Eastern Europe Green Building Material Market Analysis by By Application: Introduction
- 6.4.2. Market Size Absolute $ Opportunity Analysis and Forecast, By By Application, 2016-2032
- 6.4.3. Roofing
- 6.4.4. Framing
- 6.4.5. Insulation
- 6.4.6. Interior Finishing
- 6.4.7. Exterior siding
- 6.5. Eastern Europe Green Building Material Market Analysis, Opportunity and Forecast, By Country , 2016-2032
- 6.5.1. Eastern Europe Green Building Material Market Analysis by Country : Introduction
- 6.5.2. Market Size Absolute $ Opportunity Analysis and Forecast, Country , 2016-2032
- 6.5.2.1. Russia
- 6.5.2.2. Poland
- 6.5.2.3. The Czech Republic
- 6.5.2.4. Greece
- 6.5.2.5. Rest of Eastern Europe
- 7. APAC Green Building Material Market Analysis, Opportunity and Forecast, 2016-2032
- 7.1. APAC Green Building Material Market Analysis, 2016-2021
- 7.2. APAC Green Building Material Market Opportunity and Forecast, 2023-2032
- 7.3. APAC Green Building Material Market Analysis, Opportunity and Forecast, By By Type, 2016-2032
- 7.3.1. APAC Green Building Material Market Analysis by By Type: Introduction
- 7.3.2. Market Size Absolute $ Opportunity Analysis and Forecast, By By Type, 2016-2032
- 7.3.3. Structural
- 7.3.4. Exterior
- 7.3.5. Interior
- 7.3.6. Others (Solar and Roofing)
- 7.4. APAC Green Building Material Market Analysis, Opportunity and Forecast, By By Application, 2016-2032
- 7.4.1. APAC Green Building Material Market Analysis by By Application: Introduction
- 7.4.2. Market Size Absolute $ Opportunity Analysis and Forecast, By By Application, 2016-2032
- 7.4.3. Roofing
- 7.4.4. Framing
- 7.4.5. Insulation
- 7.4.6. Interior Finishing
- 7.4.7. Exterior siding
- 7.5. APAC Green Building Material Market Analysis, Opportunity and Forecast, By Country , 2016-2032
- 7.5.1. APAC Green Building Material Market Analysis by Country : Introduction
- 7.5.2. Market Size Absolute $ Opportunity Analysis and Forecast, Country , 2016-2032
- 7.5.2.1. China
- 7.5.2.2. Japan
- 7.5.2.3. South Korea
- 7.5.2.4. India
- 7.5.2.5. Australia & New Zeland
- 7.5.2.6. Indonesia
- 7.5.2.7. Malaysia
- 7.5.2.8. Philippines
- 7.5.2.9. Singapore
- 7.5.2.10. Thailand
- 7.5.2.11. Vietnam
- 7.5.2.12. Rest of APAC
- 8. Latin America Green Building Material Market Analysis, Opportunity and Forecast, 2016-2032
- 8.1. Latin America Green Building Material Market Analysis, 2016-2021
- 8.2. Latin America Green Building Material Market Opportunity and Forecast, 2023-2032
- 8.3. Latin America Green Building Material Market Analysis, Opportunity and Forecast, By By Type, 2016-2032
- 8.3.1. Latin America Green Building Material Market Analysis by By Type: Introduction
- 8.3.2. Market Size Absolute $ Opportunity Analysis and Forecast, By By Type, 2016-2032
- 8.3.3. Structural
- 8.3.4. Exterior
- 8.3.5. Interior
- 8.3.6. Others (Solar and Roofing)
- 8.4. Latin America Green Building Material Market Analysis, Opportunity and Forecast, By By Application, 2016-2032
- 8.4.1. Latin America Green Building Material Market Analysis by By Application: Introduction
- 8.4.2. Market Size Absolute $ Opportunity Analysis and Forecast, By By Application, 2016-2032
- 8.4.3. Roofing
- 8.4.4. Framing
- 8.4.5. Insulation
- 8.4.6. Interior Finishing
- 8.4.7. Exterior siding
- 8.5. Latin America Green Building Material Market Analysis, Opportunity and Forecast, By Country , 2016-2032
- 8.5.1. Latin America Green Building Material Market Analysis by Country : Introduction
- 8.5.2. Market Size Absolute $ Opportunity Analysis and Forecast, Country , 2016-2032
- 8.5.2.1. Brazil
- 8.5.2.2. Colombia
- 8.5.2.3. Chile
- 8.5.2.4. Argentina
- 8.5.2.5. Costa Rica
- 8.5.2.6. Rest of Latin America
- 9. Middle East & Africa Green Building Material Market Analysis, Opportunity and Forecast, 2016-2032
- 9.1. Middle East & Africa Green Building Material Market Analysis, 2016-2021
- 9.2. Middle East & Africa Green Building Material Market Opportunity and Forecast, 2023-2032
- 9.3. Middle East & Africa Green Building Material Market Analysis, Opportunity and Forecast, By By Type, 2016-2032
- 9.3.1. Middle East & Africa Green Building Material Market Analysis by By Type: Introduction
- 9.3.2. Market Size Absolute $ Opportunity Analysis and Forecast, By By Type, 2016-2032
- 9.3.3. Structural
- 9.3.4. Exterior
- 9.3.5. Interior
- 9.3.6. Others (Solar and Roofing)
- 9.4. Middle East & Africa Green Building Material Market Analysis, Opportunity and Forecast, By By Application, 2016-2032
- 9.4.1. Middle East & Africa Green Building Material Market Analysis by By Application: Introduction
- 9.4.2. Market Size Absolute $ Opportunity Analysis and Forecast, By By Application, 2016-2032
- 9.4.3. Roofing
- 9.4.4. Framing
- 9.4.5. Insulation
- 9.4.6. Interior Finishing
- 9.4.7. Exterior siding
- 9.5. Middle East & Africa Green Building Material Market Analysis, Opportunity and Forecast, By Country , 2016-2032
- 9.5.1. Middle East & Africa Green Building Material Market Analysis by Country : Introduction
- 9.5.2. Market Size Absolute $ Opportunity Analysis and Forecast, Country , 2016-2032
- 9.5.2.1. Algeria
- 9.5.2.2. Egypt
- 9.5.2.3. Israel
- 9.5.2.4. Kuwait
- 9.5.2.5. Nigeria
- 9.5.2.6. Saudi Arabia
- 9.5.2.7. South Africa
- 9.5.2.8. Turkey
- 9.5.2.9. The UAE
- 9.5.2.10. Rest of MEA
- 10. Global Green Building Material Market Analysis, Opportunity and Forecast, By Region , 2016-2032
- 10.1. Global Green Building Material Market Analysis by Region : Introduction
- 10.2. Market Size Absolute $ Opportunity Analysis and Forecast, By Region , 2016-2032
- 10.2.1. North America
- 10.2.2. Western Europe
- 10.2.3. Eastern Europe
- 10.2.4. APAC
- 10.2.5. Latin America
- 10.2.6. Middle East & Africa
- 11. Global Green Building Material Market Competitive Landscape, Market Share Analysis, and Company Profiles
- 11.1. Market Share Analysis
- 11.2. Company Profiles
- 11.3. BASF SE
- 11.3.1. Company Overview
- 11.3.2. Financial Highlights
- 11.3.3. Product Portfolio
- 11.3.4. SWOT Analysis
- 11.3.5. Key Strategies and Developments
- 11.4. Owens Corning
- 11.4.1. Company Overview
- 11.4.2. Financial Highlights
- 11.4.3. Product Portfolio
- 11.4.4. SWOT Analysis
- 11.4.5. Key Strategies and Developments
- 11.5. Forbo International SA
- 11.5.1. Company Overview
- 11.5.2. Financial Highlights
- 11.5.3. Product Portfolio
- 11.5.4. SWOT Analysis
- 11.5.5. Key Strategies and Developments
- 11.6. Alumasc Group Plc
- 11.6.1. Company Overview
- 11.6.2. Financial Highlights
- 11.6.3. Product Portfolio
- 11.6.4. SWOT Analysis
- 11.6.5. Key Strategies and Developments
- 11.7. Bauder Limited
- 11.7.1. Company Overview
- 11.7.2. Financial Highlights
- 11.7.3. Product Portfolio
- 11.7.4. SWOT Analysis
- 11.7.5. Key Strategies and Developments
- 11.8. Binderholz GmbH
- 11.8.1. Company Overview
- 11.8.2. Financial Highlights
- 11.8.3. Product Portfolio
- 11.8.4. SWOT Analysis
- 11.8.5. Key Strategies and Developments
- 11.9. CertainTeed Corporation
- 11.9.1. Company Overview
- 11.9.2. Financial Highlights
- 11.9.3. Product Portfolio
- 11.9.4. SWOT Analysis
- 11.9.5. Key Strategies and Developments
- 11.10. RedBuilt LLC
- 11.10.1. Company Overview
- 11.10.2. Financial Highlights
- 11.10.3. Product Portfolio
- 11.10.4. SWOT Analysis
- 11.10.5. Key Strategies and Developments
- 11.11. PPG Industries
- 11.11.1. Company Overview
- 11.11.2. Financial Highlights
- 11.11.3. Product Portfolio
- 11.11.4. SWOT Analysis
- 11.11.5. Key Strategies and Developments
- 11.12. DuPont
- 11.12.1. Company Overview
- 11.12.2. Financial Highlights
- 11.12.3. Product Portfolio
- 11.12.4. SWOT Analysis
- 11.12.5. Key Strategies and Developments
- 12. Assumptions and Acronyms
- 13. Research Methodology
- 14. Contact
List of Figures
- Figure 1: Global Green Building Material Market Revenue (US$ Mn) Market Share by By Type in 2022
- Figure 2: Global Green Building Material Market Attractiveness Analysis by By Type, 2016-2032
- Figure 3: Global Green Building Material Market Revenue (US$ Mn) Market Share by By Applicationin 2022
- Figure 4: Global Green Building Material Market Attractiveness Analysis by By Application, 2016-2032
- Figure 5: Global Green Building Material Market Revenue (US$ Mn) Market Share by Region in 2022
- Figure 6: Global Green Building Material Market Attractiveness Analysis by Region, 2016-2032
- Figure 7: Global Green Building Material Market Revenue (US$ Mn) (2016-2032)
- Figure 8: Global Green Building Material Market Revenue (US$ Mn) Comparison by Region (2016-2032)
- Figure 9: Global Green Building Material Market Revenue (US$ Mn) Comparison by By Type (2016-2032)
- Figure 10: Global Green Building Material Market Revenue (US$ Mn) Comparison by By Application (2016-2032)
- Figure 11: Global Green Building Material Market Y-o-Y Growth Rate Comparison by Region (2016-2032)
- Figure 12: Global Green Building Material Market Y-o-Y Growth Rate Comparison by By Type (2016-2032)
- Figure 13: Global Green Building Material Market Y-o-Y Growth Rate Comparison by By Application (2016-2032)
- Figure 14: Global Green Building Material Market Share Comparison by Region (2016-2032)
- Figure 15: Global Green Building Material Market Share Comparison by By Type (2016-2032)
- Figure 16: Global Green Building Material Market Share Comparison by By Application (2016-2032)
- Figure 17: North America Green Building Material Market Revenue (US$ Mn) Market Share by By Typein 2022
- Figure 18: North America Green Building Material Market Attractiveness Analysis by By Type, 2016-2032
- Figure 19: North America Green Building Material Market Revenue (US$ Mn) Market Share by By Applicationin 2022
- Figure 20: North America Green Building Material Market Attractiveness Analysis by By Application, 2016-2032
- Figure 21: North America Green Building Material Market Revenue (US$ Mn) Market Share by Country in 2022
- Figure 22: North America Green Building Material Market Attractiveness Analysis by Country, 2016-2032
- Figure 23: North America Green Building Material Market Revenue (US$ Mn) (2016-2032)
- Figure 24: North America Green Building Material Market Revenue (US$ Mn) Comparison by Country (2016-2032)
- Figure 25: North America Green Building Material Market Revenue (US$ Mn) Comparison by By Type (2016-2032)
- Figure 26: North America Green Building Material Market Revenue (US$ Mn) Comparison by By Application (2016-2032)
- Figure 27: North America Green Building Material Market Y-o-Y Growth Rate Comparison by Country (2016-2032)
- Figure 28: North America Green Building Material Market Y-o-Y Growth Rate Comparison by By Type (2016-2032)
- Figure 29: North America Green Building Material Market Y-o-Y Growth Rate Comparison by By Application (2016-2032)
- Figure 30: North America Green Building Material Market Share Comparison by Country (2016-2032)
- Figure 31: North America Green Building Material Market Share Comparison by By Type (2016-2032)
- Figure 32: North America Green Building Material Market Share Comparison by By Application (2016-2032)
- Figure 33: Western Europe Green Building Material Market Revenue (US$ Mn) Market Share by By Typein 2022
- Figure 34: Western Europe Green Building Material Market Attractiveness Analysis by By Type, 2016-2032
- Figure 35: Western Europe Green Building Material Market Revenue (US$ Mn) Market Share by By Applicationin 2022
- Figure 36: Western Europe Green Building Material Market Attractiveness Analysis by By Application, 2016-2032
- Figure 37: Western Europe Green Building Material Market Revenue (US$ Mn) Market Share by Country in 2022
- Figure 38: Western Europe Green Building Material Market Attractiveness Analysis by Country, 2016-2032
- Figure 39: Western Europe Green Building Material Market Revenue (US$ Mn) (2016-2032)
- Figure 40: Western Europe Green Building Material Market Revenue (US$ Mn) Comparison by Country (2016-2032)
- Figure 41: Western Europe Green Building Material Market Revenue (US$ Mn) Comparison by By Type (2016-2032)
- Figure 42: Western Europe Green Building Material Market Revenue (US$ Mn) Comparison by By Application (2016-2032)
- Figure 43: Western Europe Green Building Material Market Y-o-Y Growth Rate Comparison by Country (2016-2032)
- Figure 44: Western Europe Green Building Material Market Y-o-Y Growth Rate Comparison by By Type (2016-2032)
- Figure 45: Western Europe Green Building Material Market Y-o-Y Growth Rate Comparison by By Application (2016-2032)
- Figure 46: Western Europe Green Building Material Market Share Comparison by Country (2016-2032)
- Figure 47: Western Europe Green Building Material Market Share Comparison by By Type (2016-2032)
- Figure 48: Western Europe Green Building Material Market Share Comparison by By Application (2016-2032)
- Figure 49: Eastern Europe Green Building Material Market Revenue (US$ Mn) Market Share by By Typein 2022
- Figure 50: Eastern Europe Green Building Material Market Attractiveness Analysis by By Type, 2016-2032
- Figure 51: Eastern Europe Green Building Material Market Revenue (US$ Mn) Market Share by By Applicationin 2022
- Figure 52: Eastern Europe Green Building Material Market Attractiveness Analysis by By Application, 2016-2032
- Figure 53: Eastern Europe Green Building Material Market Revenue (US$ Mn) Market Share by Country in 2022
- Figure 54: Eastern Europe Green Building Material Market Attractiveness Analysis by Country, 2016-2032
- Figure 55: Eastern Europe Green Building Material Market Revenue (US$ Mn) (2016-2032)
- Figure 56: Eastern Europe Green Building Material Market Revenue (US$ Mn) Comparison by Country (2016-2032)
- Figure 57: Eastern Europe Green Building Material Market Revenue (US$ Mn) Comparison by By Type (2016-2032)
- Figure 58: Eastern Europe Green Building Material Market Revenue (US$ Mn) Comparison by By Application (2016-2032)
- Figure 59: Eastern Europe Green Building Material Market Y-o-Y Growth Rate Comparison by Country (2016-2032)
- Figure 60: Eastern Europe Green Building Material Market Y-o-Y Growth Rate Comparison by By Type (2016-2032)
- Figure 61: Eastern Europe Green Building Material Market Y-o-Y Growth Rate Comparison by By Application (2016-2032)
- Figure 62: Eastern Europe Green Building Material Market Share Comparison by Country (2016-2032)
- Figure 63: Eastern Europe Green Building Material Market Share Comparison by By Type (2016-2032)
- Figure 64: Eastern Europe Green Building Material Market Share Comparison by By Application (2016-2032)
- Figure 65: APAC Green Building Material Market Revenue (US$ Mn) Market Share by By Typein 2022
- Figure 66: APAC Green Building Material Market Attractiveness Analysis by By Type, 2016-2032
- Figure 67: APAC Green Building Material Market Revenue (US$ Mn) Market Share by By Applicationin 2022
- Figure 68: APAC Green Building Material Market Attractiveness Analysis by By Application, 2016-2032
- Figure 69: APAC Green Building Material Market Revenue (US$ Mn) Market Share by Country in 2022
- Figure 70: APAC Green Building Material Market Attractiveness Analysis by Country, 2016-2032
- Figure 71: APAC Green Building Material Market Revenue (US$ Mn) (2016-2032)
- Figure 72: APAC Green Building Material Market Revenue (US$ Mn) Comparison by Country (2016-2032)
- Figure 73: APAC Green Building Material Market Revenue (US$ Mn) Comparison by By Type (2016-2032)
- Figure 74: APAC Green Building Material Market Revenue (US$ Mn) Comparison by By Application (2016-2032)
- Figure 75: APAC Green Building Material Market Y-o-Y Growth Rate Comparison by Country (2016-2032)
- Figure 76: APAC Green Building Material Market Y-o-Y Growth Rate Comparison by By Type (2016-2032)
- Figure 77: APAC Green Building Material Market Y-o-Y Growth Rate Comparison by By Application (2016-2032)
- Figure 78: APAC Green Building Material Market Share Comparison by Country (2016-2032)
- Figure 79: APAC Green Building Material Market Share Comparison by By Type (2016-2032)
- Figure 80: APAC Green Building Material Market Share Comparison by By Application (2016-2032)
- Figure 81: Latin America Green Building Material Market Revenue (US$ Mn) Market Share by By Typein 2022
- Figure 82: Latin America Green Building Material Market Attractiveness Analysis by By Type, 2016-2032
- Figure 83: Latin America Green Building Material Market Revenue (US$ Mn) Market Share by By Applicationin 2022
- Figure 84: Latin America Green Building Material Market Attractiveness Analysis by By Application, 2016-2032
- Figure 85: Latin America Green Building Material Market Revenue (US$ Mn) Market Share by Country in 2022
- Figure 86: Latin America Green Building Material Market Attractiveness Analysis by Country, 2016-2032
- Figure 87: Latin America Green Building Material Market Revenue (US$ Mn) (2016-2032)
- Figure 88: Latin America Green Building Material Market Revenue (US$ Mn) Comparison by Country (2016-2032)
- Figure 89: Latin America Green Building Material Market Revenue (US$ Mn) Comparison by By Type (2016-2032)
- Figure 90: Latin America Green Building Material Market Revenue (US$ Mn) Comparison by By Application (2016-2032)
- Figure 91: Latin America Green Building Material Market Y-o-Y Growth Rate Comparison by Country (2016-2032)
- Figure 92: Latin America Green Building Material Market Y-o-Y Growth Rate Comparison by By Type (2016-2032)
- Figure 93: Latin America Green Building Material Market Y-o-Y Growth Rate Comparison by By Application (2016-2032)
- Figure 94: Latin America Green Building Material Market Share Comparison by Country (2016-2032)
- Figure 95: Latin America Green Building Material Market Share Comparison by By Type (2016-2032)
- Figure 96: Latin America Green Building Material Market Share Comparison by By Application (2016-2032)
- Figure 97: Middle East & Africa Green Building Material Market Revenue (US$ Mn) Market Share by By Typein 2022
- Figure 98: Middle East & Africa Green Building Material Market Attractiveness Analysis by By Type, 2016-2032
- Figure 99: Middle East & Africa Green Building Material Market Revenue (US$ Mn) Market Share by By Applicationin 2022
- Figure 100: Middle East & Africa Green Building Material Market Attractiveness Analysis by By Application, 2016-2032
- Figure 101: Middle East & Africa Green Building Material Market Revenue (US$ Mn) Market Share by Country in 2022
- Figure 102: Middle East & Africa Green Building Material Market Attractiveness Analysis by Country, 2016-2032
- Figure 103: Middle East & Africa Green Building Material Market Revenue (US$ Mn) (2016-2032)
- Figure 104: Middle East & Africa Green Building Material Market Revenue (US$ Mn) Comparison by Country (2016-2032)
- Figure 105: Middle East & Africa Green Building Material Market Revenue (US$ Mn) Comparison by By Type (2016-2032)
- Figure 106: Middle East & Africa Green Building Material Market Revenue (US$ Mn) Comparison by By Application (2016-2032)
- Figure 107: Middle East & Africa Green Building Material Market Y-o-Y Growth Rate Comparison by Country (2016-2032)
- Figure 108: Middle East & Africa Green Building Material Market Y-o-Y Growth Rate Comparison by By Type (2016-2032)
- Figure 109: Middle East & Africa Green Building Material Market Y-o-Y Growth Rate Comparison by By Application (2016-2032)
- Figure 110: Middle East & Africa Green Building Material Market Share Comparison by Country (2016-2032)
- Figure 111: Middle East & Africa Green Building Material Market Share Comparison by By Type (2016-2032)
- Figure 112: Middle East & Africa Green Building Material Market Share Comparison by By Application (2016-2032)
List of Tables
- Table 1: Global Green Building Material Market Comparison by By Type (2016-2032)
- Table 2: Global Green Building Material Market Comparison by By Application (2016-2032)
- Table 3: Global Green Building Material Market Revenue (US$ Mn) Comparison by Region (2016-2032)
- Table 4: Global Green Building Material Market Revenue (US$ Mn) (2016-2032)
- Table 5: Global Green Building Material Market Revenue (US$ Mn) Comparison by Region (2016-2032)
- Table 6: Global Green Building Material Market Revenue (US$ Mn) Comparison by By Type (2016-2032)
- Table 7: Global Green Building Material Market Revenue (US$ Mn) Comparison by By Application (2016-2032)
- Table 8: Global Green Building Material Market Y-o-Y Growth Rate Comparison by Region (2016-2032)
- Table 9: Global Green Building Material Market Y-o-Y Growth Rate Comparison by By Type (2016-2032)
- Table 10: Global Green Building Material Market Y-o-Y Growth Rate Comparison by By Application (2016-2032)
- Table 11: Global Green Building Material Market Share Comparison by Region (2016-2032)
- Table 12: Global Green Building Material Market Share Comparison by By Type (2016-2032)
- Table 13: Global Green Building Material Market Share Comparison by By Application (2016-2032)
- Table 14: North America Green Building Material Market Comparison by By Application (2016-2032)
- Table 15: North America Green Building Material Market Revenue (US$ Mn) Comparison by Country (2016-2032)
- Table 16: North America Green Building Material Market Revenue (US$ Mn) (2016-2032)
- Table 17: North America Green Building Material Market Revenue (US$ Mn) Comparison by Country (2016-2032)
- Table 18: North America Green Building Material Market Revenue (US$ Mn) Comparison by By Type (2016-2032)
- Table 19: North America Green Building Material Market Revenue (US$ Mn) Comparison by By Application (2016-2032)
- Table 20: North America Green Building Material Market Y-o-Y Growth Rate Comparison by Country (2016-2032)
- Table 21: North America Green Building Material Market Y-o-Y Growth Rate Comparison by By Type (2016-2032)
- Table 22: North America Green Building Material Market Y-o-Y Growth Rate Comparison by By Application (2016-2032)
- Table 23: North America Green Building Material Market Share Comparison by Country (2016-2032)
- Table 24: North America Green Building Material Market Share Comparison by By Type (2016-2032)
- Table 25: North America Green Building Material Market Share Comparison by By Application (2016-2032)
- Table 26: Western Europe Green Building Material Market Comparison by By Type (2016-2032)
- Table 27: Western Europe Green Building Material Market Comparison by By Application (2016-2032)
- Table 28: Western Europe Green Building Material Market Revenue (US$ Mn) Comparison by Country (2016-2032)
- Table 29: Western Europe Green Building Material Market Revenue (US$ Mn) (2016-2032)
- Table 30: Western Europe Green Building Material Market Revenue (US$ Mn) Comparison by Country (2016-2032)
- Table 31: Western Europe Green Building Material Market Revenue (US$ Mn) Comparison by By Type (2016-2032)
- Table 32: Western Europe Green Building Material Market Revenue (US$ Mn) Comparison by By Application (2016-2032)
- Table 33: Western Europe Green Building Material Market Y-o-Y Growth Rate Comparison by Country (2016-2032)
- Table 34: Western Europe Green Building Material Market Y-o-Y Growth Rate Comparison by By Type (2016-2032)
- Table 35: Western Europe Green Building Material Market Y-o-Y Growth Rate Comparison by By Application (2016-2032)
- Table 36: Western Europe Green Building Material Market Share Comparison by Country (2016-2032)
- Table 37: Western Europe Green Building Material Market Share Comparison by By Type (2016-2032)
- Table 38: Western Europe Green Building Material Market Share Comparison by By Application (2016-2032)
- Table 39: Eastern Europe Green Building Material Market Comparison by By Type (2016-2032)
- Table 40: Eastern Europe Green Building Material Market Comparison by By Application (2016-2032)
- Table 41: Eastern Europe Green Building Material Market Revenue (US$ Mn) Comparison by Country (2016-2032)
- Table 42: Eastern Europe Green Building Material Market Revenue (US$ Mn) (2016-2032)
- Table 43: Eastern Europe Green Building Material Market Revenue (US$ Mn) Comparison by Country (2016-2032)
- Table 44: Eastern Europe Green Building Material Market Revenue (US$ Mn) Comparison by By Type (2016-2032)
- Table 45: Eastern Europe Green Building Material Market Revenue (US$ Mn) Comparison by By Application (2016-2032)
- Table 46: Eastern Europe Green Building Material Market Y-o-Y Growth Rate Comparison by Country (2016-2032)
- Table 47: Eastern Europe Green Building Material Market Y-o-Y Growth Rate Comparison by By Type (2016-2032)
- Table 48: Eastern Europe Green Building Material Market Y-o-Y Growth Rate Comparison by By Application (2016-2032)
- Table 49: Eastern Europe Green Building Material Market Share Comparison by Country (2016-2032)
- Table 50: Eastern Europe Green Building Material Market Share Comparison by By Type (2016-2032)
- Table 51: Eastern Europe Green Building Material Market Share Comparison by By Application (2016-2032)
- Table 52: APAC Green Building Material Market Comparison by By Type (2016-2032)
- Table 53: APAC Green Building Material Market Comparison by By Application (2016-2032)
- Table 54: APAC Green Building Material Market Revenue (US$ Mn) Comparison by Country (2016-2032)
- Table 55: APAC Green Building Material Market Revenue (US$ Mn) (2016-2032)
- Table 56: APAC Green Building Material Market Revenue (US$ Mn) Comparison by Country (2016-2032)
- Table 57: APAC Green Building Material Market Revenue (US$ Mn) Comparison by By Type (2016-2032)
- Table 58: APAC Green Building Material Market Revenue (US$ Mn) Comparison by By Application (2016-2032)
- Table 59: APAC Green Building Material Market Y-o-Y Growth Rate Comparison by Country (2016-2032)
- Table 60: APAC Green Building Material Market Y-o-Y Growth Rate Comparison by By Type (2016-2032)
- Table 61: APAC Green Building Material Market Y-o-Y Growth Rate Comparison by By Application (2016-2032)
- Table 62: APAC Green Building Material Market Share Comparison by Country (2016-2032)
- Table 63: APAC Green Building Material Market Share Comparison by By Type (2016-2032)
- Table 64: APAC Green Building Material Market Share Comparison by By Application (2016-2032)
- Table 65: Latin America Green Building Material Market Comparison by By Type (2016-2032)
- Table 66: Latin America Green Building Material Market Comparison by By Application (2016-2032)
- Table 67: Latin America Green Building Material Market Revenue (US$ Mn) Comparison by Country (2016-2032)
- Table 68: Latin America Green Building Material Market Revenue (US$ Mn) (2016-2032)
- Table 69: Latin America Green Building Material Market Revenue (US$ Mn) Comparison by Country (2016-2032)
- Table 70: Latin America Green Building Material Market Revenue (US$ Mn) Comparison by By Type (2016-2032)
- Table 71: Latin America Green Building Material Market Revenue (US$ Mn) Comparison by By Application (2016-2032)
- Table 72: Latin America Green Building Material Market Y-o-Y Growth Rate Comparison by Country (2016-2032)
- Table 73: Latin America Green Building Material Market Y-o-Y Growth Rate Comparison by By Type (2016-2032)
- Table 74: Latin America Green Building Material Market Y-o-Y Growth Rate Comparison by By Application (2016-2032)
- Table 75: Latin America Green Building Material Market Share Comparison by Country (2016-2032)
- Table 76: Latin America Green Building Material Market Share Comparison by By Type (2016-2032)
- Table 77: Latin America Green Building Material Market Share Comparison by By Application (2016-2032)
- Table 78: Middle East & Africa Green Building Material Market Comparison by By Type (2016-2032)
- Table 79: Middle East & Africa Green Building Material Market Comparison by By Application (2016-2032)
- Table 80: Middle East & Africa Green Building Material Market Revenue (US$ Mn) Comparison by Country (2016-2032)
- Table 81: Middle East & Africa Green Building Material Market Revenue (US$ Mn) (2016-2032)
- Table 82: Middle East & Africa Green Building Material Market Revenue (US$ Mn) Comparison by Country (2016-2032)
- Table 83: Middle East & Africa Green Building Material Market Revenue (US$ Mn) Comparison by By Type (2016-2032)
- Table 84: Middle East & Africa Green Building Material Market Revenue (US$ Mn) Comparison by By Application (2016-2032)
- Table 85: Middle East & Africa Green Building Material Market Y-o-Y Growth Rate Comparison by Country (2016-2032)
- Table 86: Middle East & Africa Green Building Material Market Y-o-Y Growth Rate Comparison by By Type (2016-2032)
- Table 87: Middle East & Africa Green Building Material Market Y-o-Y Growth Rate Comparison by By Application (2016-2032)
- Table 88: Middle East & Africa Green Building Material Market Share Comparison by Country (2016-2032)
- Table 89: Middle East & Africa Green Building Material Market Share Comparison by By Type (2016-2032)
- Table 90: Middle East & Africa Green Building Material Market Share Comparison by By Application (2016-2032)
- 1. Executive Summary
-
- BASF SE
- Owens Corning
- Forbo International SA
- Alumasc Group Plc
- Bauder Limited
- Binderholz GmbH
- CertainTeed Corporation
- RedBuilt LLC
- PPG Industries
- DuPont
Our Clients


View Our Licence Options
