Greenhouse Market By Type(Glass Greenhouse, Plastic Greenhouse), By Offering(Hardware, Software, Services), By Crop Type(Fruits, Vegetables & Herbs, By Flowers & Ornamentals, Others), By End-user(Commercial Growers, Research and Educational Institutes, Others), By Region And Companies - Industry Segment Outlook, Market Assessment, Competition Scenario, Trends, And Forecast 2024-2033
-
43361
-
Feb 2024
-
179
-


-
This report was compiled by Shreyas Rokade Shreyas Rokade is a seasoned Research Analyst with CMFE, bringing extensive expertise in market research and consulting, with a strong background in Chemical Engineering. Correspondence Team Lead-CMFE Linkedin | Detailed Market research Methodology Our methodology involves a mix of primary research, including interviews with leading mental health experts, and secondary research from reputable medical journals and databases. View Detailed Methodology Page
-
Quick Navigation
Report Overview
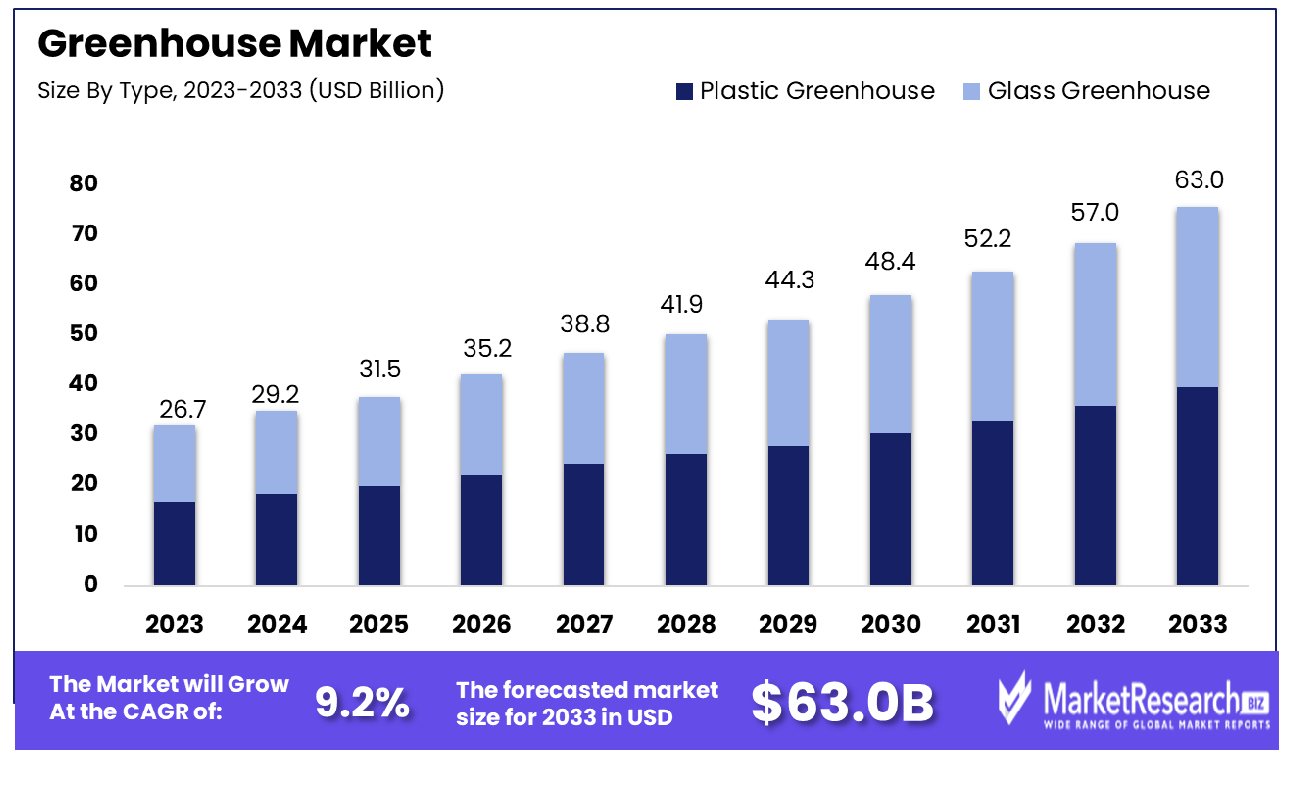
The Greenhouse Market was valued at USD 26.7 billion in 2023. It is expected to reach USD 63.0 billion by 2033, with a CAGR of 9.2% during the forecast period from 2024 to 2033.
The surge in demand for food requirements, urbanization, and the sudden rise in global population are some of the main key driving factors for the greenhouse market. The greenhouse market in the industrial sector defines the rising industry of controlled environment agriculture practices where the plants are yielded in an enclosed pattern to enhance the climatic conditions like temperature, light, and humidity.
These patterns are called greenhouses, which permit year-round yielding by augmenting crop cultivation and enhancing resource efficacy. In the industrial sector, greenhouses are employed for huge large-scale manufacturing of different types of crops including vegetables, ornamental plants, and fruits.
An article published by HouseGrail in January 2024, highlights that 54% of all the greenhouse plants cultivated in the US are yearly bedding plants. There are 9% of women who are greenhouse workers. As per the survey in 2021, 45% of the commercial greenhouse mentioned that they directly sell their items to customers. Moreover, China has the most greenhouses by square area in the world, with almost about 2.7 million hectares. Over half of the European greenhouses are glass while the rest just 20% in North America and 2% in Asia use glass. Additionally, Pennsylvania has about more than 593 greenhouse vegetable manufacturers, which are more than the rest of the other US states. 90% of the total greenhouse in the world are in China.
Advanced technologies play an important role in the functionality of greenhouse systems like automated climate regulation, accurate irrigation, and artificial lighting. This also ensures the accurate control of environmental condition variables by promoting enhanced plant crop growth. Industrial greenhouse farming encourages sustainable and highly effective agriculture by decreasing the reliance on old-style open-field techniques.
It also highlights the risks associated with it by ensuring food security and meeting the high demands of the increasing global population. There are several benefits of using a greenhouse such as it augments the production rate, regulates temperature and humidity, design personalization, automation capabilities, and short as well as long-term cost savings. The demand for the greenhouse market will increase due to its requirement in the industrial sector especially in the agricultural fields, which will help in market expansion during the forecast period.
Key Takeaways
- Market Growth: Greenhouse market was valued at USD 26.7 billion in 2023. It is expected to reach USD 63.0 billion by 2033, with a CAGR of 9.2% during the forecast period from 2024 to 2033.
- By Type: Plastic greenhouses dominate the market in terms of types.
- By Offering: Hardware offerings are dominant within the greenhouse industry.
- By Crop Type: Fruits, vegetables, & herbs lead in crop type dominance.
- By End-user: Commercial growers stand out as the dominant end-users.
- Regional Dominance: Europe dominates the greenhouse market, commanding a significant 31.5% share of the industry.
- Growth Opportunity: Emerging markets in Asia and Africa offer significant growth potential for the greenhouse market, addressing food security and sustainability concerns. Urban greenhouses revolutionize urban agriculture, enhancing access to fresh produce sustainably.
Driving factors
Local Food Production Fuels Greenhouse Growth
The burgeoning demand for locally produced food is a primary catalyst driving the greenhouse market. In an era increasingly focused on sustainability, consumers are opting for fresh produce with reduced food miles. Greenhouses offer the unique advantage of enabling year-round cultivation of fruits and vegetables, even in regions with harsh climates. This trend is exemplified in Canada, where the number of greenhouses has seen a significant uptick over the past decade, aligning with the growing consumer preference for local produce. This movement towards local sourcing not only fosters food security but also bolsters the greenhouse industry trends.
Technological Innovations Elevate Greenhouse Efficacy
Technological advancements are pivotal in the evolution of the greenhouse industry analysis. Innovations such as hydroponics, sophisticated automated control systems, and energy-efficient LED lighting have revolutionized greenhouse farming. These technologies enhance yields, improve crop quality, and boost operational efficiency. The Netherlands, a global leader in greenhouse farming, exemplifies the successful adoption of such advanced technologies, propelling the country to the forefront of greenhouse produce exports. This technological progression is a cornerstone of the market's expansion.
Government Support and Incentives Spur Greenhouse Adoption
Government initiatives play a significant role in advancing greenhouse farming. Supportive measures including subsidies, tax incentives, and dedicated programs are instrumental in encouraging the adoption of greenhouse agriculture. Notable examples include the USDA's investment of up to $2.8 billion in climate-smart agriculture projects and the World Bank's initiative to aid 30,000 farming households in adopting climate-resilient practices. Such governmental backing not only fosters the optimal growth of greenhouses but also aids in sustainable agricultural development.
Climate Change Adaptation Drives Greenhouse Utilization
The increasing unpredictability of weather patterns due to climate change has made greenhouses an essential tool for crop protection. By providing a controlled suitable environment, greenhouses mitigate the impacts of droughts, floods, and other climate-induced challenges. This has led to the EU and other regions advocating for greenhouse farming as a means to ensure food security in the face of climate change. This adaptation strategy underscores the greenhouse market's growth, reflecting its critical role in global food production stability.
Restraining Factors
High Upfront Costs Restrict Greenhouse Market Entry
Greenhouse cultivation, while efficient, is often constrained by its high initial investment requirements. The costs associated with constructing the greenhouse structure itself, along with the necessary technologies and equipment such as climate control systems and hydroponic setups, can be substantial. This financial barrier is particularly impactful for small-scale farmers' markets or new entrants in the agricultural sector who may not have access to the required capital. Consequently, the greenhouse market's growth is limited, as the high upfront costs restrict accessibility and dissuade potential new participants from embracing this form of agriculture.
Lack of Technical Expertise Hinders Greenhouse Adoption
In regions where greenhouse farming could potentially flourish, especially in developing countries, there is often a significant gap in the necessary technical knowledge and expertise. Greenhouse agriculture relies on a comprehensive understanding of various advanced techniques, including hydroponics and sophisticated climate control systems. In areas like parts of Africa, where such technical know-how is scarce or absent, the adoption rate of greenhouse farming remains low. Farmers' reluctance or inability to engage with these technologies due to a lack of training and resources effectively limits the expansion of the greenhouse market in these regions.
By Type Analysis
Plastic greenhouses dominate the market in terms of greenhouse type.
In the greenhouse market, the basis of type Plastic Greenhouses dominates. This segment's popularity is due to the cost-effectiveness, flexibility, and versatility of plastic materials like Polyethylene, Polycarbonate, and Polymethyl-methacrylate. Plastic greenhouses offer superior durability and resistance to varying climatic conditions, making them suitable for a wide range of geographical locations. They provide excellent light diffusion, and heat insulation, and are easier to install and maintain compared to glass greenhouses.
Glass Greenhouses, including Horticulture Glass and others, are also significant but are generally more expensive and require more careful handling. They are often preferred for their aesthetic appeal and long-term durability. Despite these benefits, the practical advantages of plastic greenhouses, especially for commercial growers, affirm their dominant position in the market.
By Offering Analysis
Hardware offerings hold dominance within the greenhouse market.
In offerings, Hardware is the dominant segment. This encompasses climate control systems, lighting systems, irrigation systems, sensors, and other essential equipment. The hardware's role is crucial in maintaining optimal growing conditions within greenhouses, enabling higher yields, and efficient resource use. Advanced climate control systems regulate temperature and humidity, lighting systems provide supplemental light, and irrigation systems ensure precise water delivery.
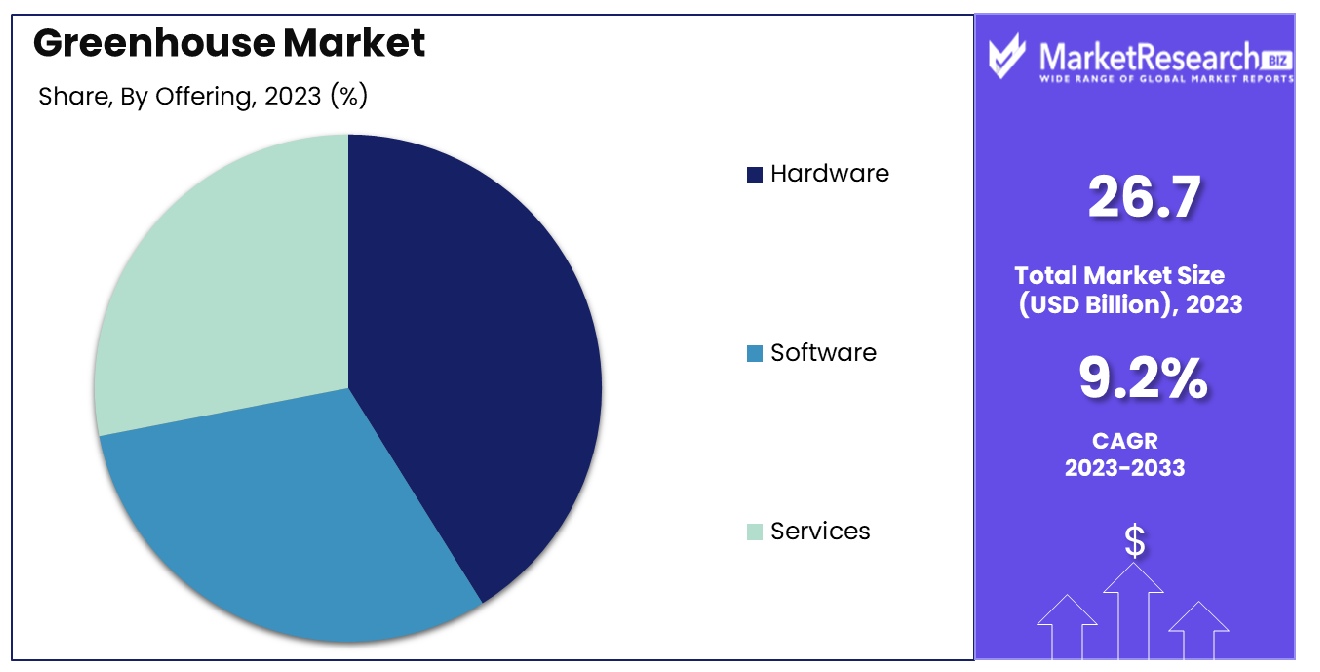
Software and Services, including cloud-based and web-based solutions, system integration & consulting, managed services, and assisted professional services, play supporting roles. While software offers advanced data analytics and remote monitoring capabilities, the dominance of hardware stems from its fundamental role in the operational efficiency of greenhouses.
By Crop Type Analysis
Fruits, vegetables, and herbs are the dominant crop types.
Fruits, Vegetables & Herbs represent the dominant crop type in greenhouses. This segment includes a wide variety of crops such as tomatoes, lettuce, bell and chili peppers, strawberries, cucumbers, leafy greens, and herbs. The controlled environment of greenhouses allows for year-round production of these crops, irrespective of external climatic conditions. The demand for fresh produce has propelled this segment, driven by the growing consumer preference for locally grown, pesticide-free fruits and vegetables.
Flowers & Ornamentals, including perennials, annuals, and ornamentals, also form a significant part of the greenhouse market but are eclipsed by the high demand and economic viability of fruits, vegetables, and herbs.
By End-user Analysis
Commercial growers emerge as the dominant end-users in the greenhouse industry.
Commercial Growers are the primary end-users in the greenhouse market. This dominance is attributed to the increasing adoption of greenhouses for large-scale production of high-value crops. Commercial greenhouse sector growers utilize advanced greenhouse technologies to optimize yield, quality, and efficiency. The ability to control growing conditions and extend the growing season makes greenhouses particularly appealing for commercial operations.
Research and Educational Institutes, Retail Gardens, and Others also contribute to market demand. Research institutions use greenhouses for experimental and educational purposes, while retail gardens cater to the consumer market. However, the scale and economic impact of commercial growers solidify their status as the dominant end-user segment in the greenhouse market.
Key Market Segments
- By Type
- Glass Greenhouse
- Horticulture Glass
- Others
- Plastic Greenhouse
- Polyethylene
- Polycarbonate
- Polymethyl-methacrylate
- Glass Greenhouse
- By Offering
- Hardware
- Climate control systems
- Lighting Systems
- Irrigation Systems
- Sensors
- Others
- Software
- Cloud-based
- Web-based
- Services
- System Integration & Consulting
- Managed Services
- Assisted Professional Services
- Hardware
- By Crop Type
- Fruits, Vegetables & Herbs
- Tomato
- Lettuce
- Bell and Chili Pepper
- Strawberry
- Cucumber
- Leafy Greens (excluding lettuce)
- Herbs
- Others
- By Flowers & Ornamentals
- Perennials
- Annuals
- Ornamentals
- Others
- Fruits, Vegetables & Herbs
- By End-user
- Commercial Growers
- Research and Educational Institutes
- Retail Gardens
- Others
Growth Opportunity
Emerging Markets in Asia and Africa: Greenhouses as a Catalyst for Food Security
The potential for greenhouse expansion in Asia and Africa presents a significant opportunity for the global greenhouse market. Regions like India, China, and Africa, where greenhouse coverage is currently less than 1% of the global total, are ripe for development. This expansion addresses crucial food security concerns in these rapidly growing and developing areas. Investments in greenhouse technology can lead to increased crop yields, enhanced food quality, and year-round production, which are essential in meeting the growing food demands of these populous regions. The adoption of greenhouses in these markets is not only a business opportunity but also a step towards sustainable agriculture practices.
Vertical Farming and Urban Greenhouses: Revolutionizing Urban Agriculture
Vertical farming and urban greenhouses represent a burgeoning sector within the greenhouse market, especially in densely populated urban areas. Facilities like True Garden's 5,000-square-foot vertical farm in Key Largo, Florida, demonstrate the feasibility and efficiency of producing fresh produce in urban settings. These innovative farming methods are crucial for bringing fresh produce closer to urban consumers and reducing transportation costs and carbon footprints. The adoption of vertical farming and rooftop greenhouses in cities is a forward-thinking approach to addressing the challenges of urban food production, offering fresh, locally-grown produce while utilizing minimal land and water resources.
Latest Trends
Sustainable Practices
The greenhouse market is witnessing a surge in sustainable practices, with a focus on reducing carbon footprint and embracing eco-friendly technologies. Innovations such as solar-powered heating and cooling systems, rainwater harvesting, and organic pest control methods are gaining traction. Consumers are increasingly demanding ethically sourced produce, driving growers to adopt environmentally responsible practices.
Automation Integration
Automation is revolutionizing greenhouse operations, enhancing efficiency and productivity. From automated climate control systems to robotic harvesting and packaging, technology is streamlining processes and reducing labor costs. Integration of AI and IoT devices allows for real-time monitoring and data-driven decision-making, optimizing crop yields and resource utilization. As competition intensifies, automation becomes a key differentiator for greenhouse businesses.
Regional Analysis
Europe Dominates with 31.5% Market Share in the Greenhouse Industry
Europe's stronghold on 31.5% of the global greenhouse market is underpinned by its longstanding tradition in greenhouse agriculture, advanced technological integration, and strong policy support for sustainable farming practices. Countries like the Netherlands, Spain, and Italy are at the forefront, with extensive use of greenhouses for year-round crop production. The region's focus on reducing carbon footprints and enhancing yield per hectare through innovative technologies like hydroponics and aeroponics also significantly contributes to its market dominance.
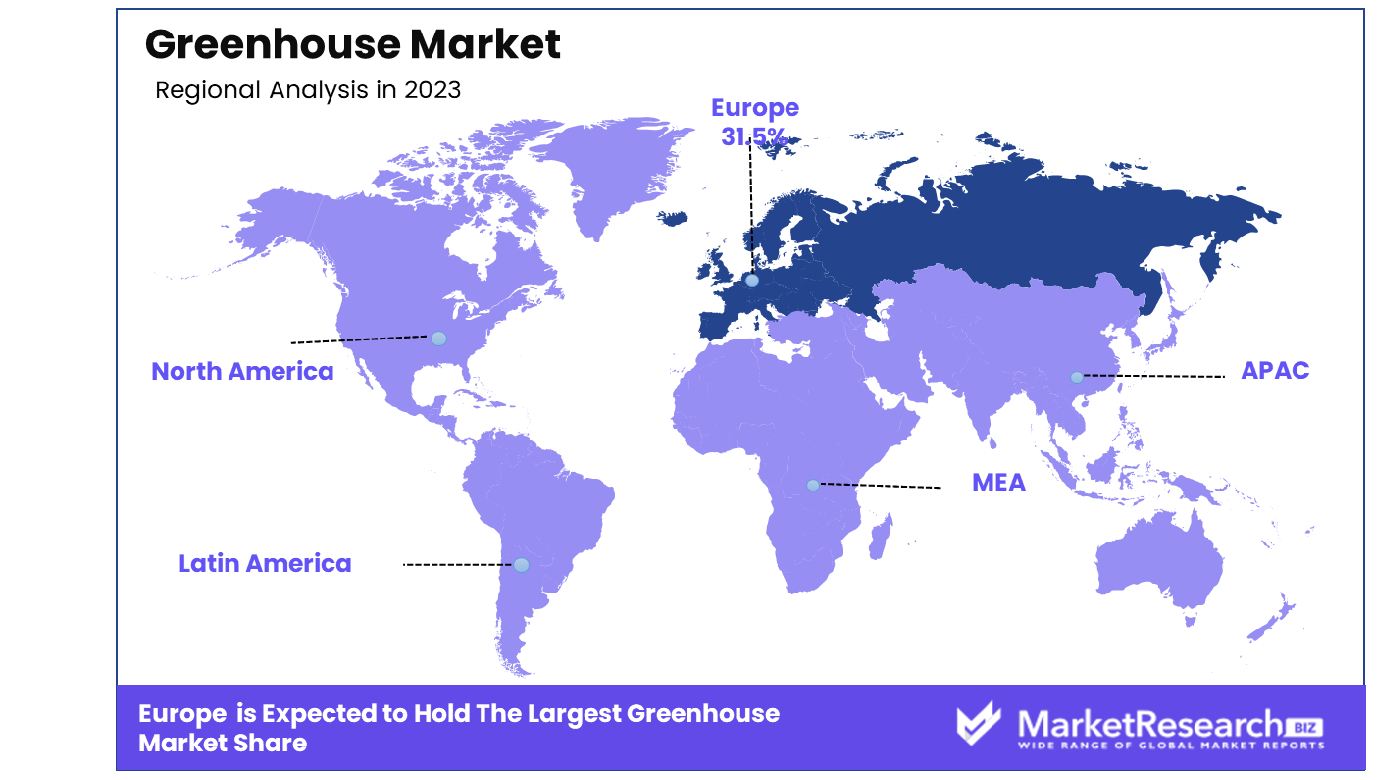
The European greenhouse market is characterized by its high-tech nature, with significant investments in automation, climate control systems, and energy-efficient solutions. This is driven by the region's stringent environmental regulations and the need for sustainable agriculture practices. The adoption of smart greenhouse technologies, incorporating IoT and AI for precision farming, is rapidly growing. Additionally, the consumer demand for locally grown, pesticide-free produce throughout the year supports the expansion of greenhouse farming in Europe.
North America's Role in the Greenhouse Market
North America, particularly the US and Canada, has a significant share of the greenhouse market, driven by rising demand for organic produce, technological advancements, and supportive government initiatives for sustainable agriculture.
Asia-Pacific’s Influence on the Greenhouse Market
Asia-Pacific's greenhouse market is growing rapidly, thanks to increasing food demand from its large population, adoption of modern farming practices, and governmental support in countries like China and India to boost agricultural productivity.
Key Regions and Countries
North America
- The US
- Canada
- Rest of North America
Europe
- Germany
- France
- The UK
- Spain
- Netherlands
- Russia
- Italy
- Rest of Europe
Asia-Pacific
- China
- Japan
- Singapore
- Thailand
- South Korea
- Vietnam
- India
- New Zealand
- Rest of Asia Pacific
Latin America
- Mexico
- Brazil
- Rest of Latin America
Middle East & Africa
- Saudi Arabia
- South Africa
- UAE
- Rest of Middle East & Africa
Key Players Analysis
The greenhouse market, a dynamic and evolving sector, is characterized by the pioneering efforts of several key players, each contributing distinctively to the industry's growth and innovation.
BrightFarms and AeroFarms lead the charge in sustainable and technology-driven agriculture, focusing on hydroponic systems that reduce water usage and increase yield. Their strategic positioning emphasizes eco-friendliness and technological integration, catering to environmentally conscious consumers and markets.
Backyard Farms and Bowery Farming emphasize localized, community-centric approaches, resonating with consumers seeking freshness and local produce. Gotham Greens' urban agricultural techniques model bridges the gap between rural farming efficiency and urban demand, while Jacobs Farm Del Cabo is recognized for organic farming practices, appealing to health-conscious consumers.
The greenhouse market, a dynamic and evolving sector, is characterized by the pioneering efforts of several major players, each contributing distinctively to the industry's growth and innovation.BrightFarms and AeroFarms lead the charge in the sustainable and technology-driven agriculture sector, focusing on hydroponic systems that reduce water usage and increase yield. Their strategic positioning emphasizes eco-friendliness and technological integration, catering to environmentally conscious consumers and markets.
Backyard Farms and Bowery Farming emphasize localized, community-centric approaches, resonating with consumers seeking freshness and local produce. Gotham Greens' urban agriculture model bridges the gap between rural farming efficiency and urban demand, while Jacobs Farm Del Cabo is recognized for organic farming practices, appealing to health-conscious consumers.
Market Key Players
- BrightFarms
- AeroFarms
- Backyard Farms
- Bowery Farming
- Gotham Greens
- Jacobs Farm Del Cabo
- Little Leaf Farms
- Oasis Biotech
- Luiten Greenhouses BV
- Prospiant Inc
- Richel Group SAS
- Saveer Biotech Ltd.
- Stuppy Greenhouse
- Signify NV
- PLASTIKA KRITIS SA
Recent Development
- In January 2024, Centuria Capital Group acquires an A$21.5 million greenhouse and glasshouse facility in South Australia for its unlisted agriculture fund, focusing on high-quality agricultural assets and protected cropping.
- In January 2024, Zordi, an ag-tech startup with $20M in funding, focuses on AI-powered robotic greenhouses to produce premium fresh produce efficiently and sustainably, addressing labor-intensive challenges in greenhouse farming.
- In November 2023, RED Horticulture secured €17 million in Series A funding to advance its dynamic lighting solutions for high-tech greenhouse operations, contributing to sustainable agriculture by optimizing light for increased yields and energy savings.
Report Scope
Report Features Description Market Value (2023) USD 26.7 Billion Forecast Revenue (2033) USD 63.0 Billion CAGR (2024-2032) 9.2% Base Year for Estimation 2023 Historic Period 2016-2023 Forecast Period 2024-2033 Report Coverage Revenue Forecast, Market Dynamics, COVID-19 Impact, Competitive Landscape, Recent Developments Segments Covered By Type(Glass Greenhouse(Horticulture Glass, Others), Plastic Greenhouse(Polyethylene, Polycarbonate, Polymethyl-methacrylate)), By Offering(Hardware(Climate control systems, Lighting Systems, Irrigation Systems, Sensors, Others), Software(Cloud-based, Web-based), Services(System Integration & Consulting, Managed Services, Assisted Professional Services), By Crop(Type Fruits, Vegetables & Herbs(Tomato, Lettuce, Bell and Chili Pepper, Strawberry, Cucumber, Leafy Greens (excluding lettuce), Herbs, Others), By Flowers & Ornamentals(Perennials, Annuals, Ornamentals), Others), By End-user(Commercial Growers, Research and Educational Institutes, Retail Gardens, Others) Regional Analysis North America - The US, Canada, Rest of North America, Europe - Germany, France, The UK, Spain, Italy, Russia, Netherlands, Rest of Europe, Asia-Pacific - China, Japan, South Korea, India, New Zealand, Singapore, Thailand, Vietnam, Rest of Asia Pacific, Latin America - Brazil, Mexico, Rest of Latin America, Middle East & Africa - South Africa, Saudi Arabia, UAE, Rest of Middle East & Africa Competitive Landscape BrightFarms, AeroFarms, Backyard Farms, Bowery Farming, Gotham Greens, Jacobs Farm Del Cabo, Little Leaf Farms, Oasis Biotech, Luiten Greenhouses BV, Prospiant Inc, Richel Group SAS, Saveer Biotech Ltd., Stuppy Greenhouse, Signify NV, PLASTIKA KRITIS SA Customization Scope Customization for segments, region/country-level will be provided. Moreover, additional customization can be done based on the requirements. Purchase Options We have three licenses to opt for Single User License, Multi-User License (Up to 5 Users), Corporate Use License (Unlimited User and Printable PDF) -
- 1. Executive Summary
- 1.1. Definition
- 1.2. Taxonomy
- 1.3. Research Scope
- 1.4. Key Analysis
- 1.5. Key Findings by Major Segments
- 1.6. Top strategies by Major Players
- 2. Global Greenhouse Market Overview
- 2.1. Greenhouse Market Dynamics
- 2.1.1. Drivers
- 2.1.2. Opportunities
- 2.1.3. Restraints
- 2.1.4. Challenges
- 2.2. Macro-economic Factors
- 2.3. Regulatory Framework
- 2.4. Market Investment Feasibility Index
- 2.5. PEST Analysis
- 2.6. PORTER’S Five Force Analysis
- 2.7. Drivers & Restraints Impact Analysis
- 2.8. Industry Chain Analysis
- 2.9. Cost Structure Analysis
- 2.10. Marketing Strategy
- 2.11. Russia-Ukraine War Impact Analysis
- 2.12. Opportunity Map Analysis
- 2.13. Market Competition Scenario Analysis
- 2.14. Product Life Cycle Analysis
- 2.15. Opportunity Orbits
- 2.16. Manufacturer Intensity Map
- 2.17. Major Companies sales by Value & Volume
- 2.1. Greenhouse Market Dynamics
- 3. Global Greenhouse Market Analysis, Opportunity and Forecast, 2016-2032
- 3.1. Global Greenhouse Market Analysis, 2016-2021
- 3.2. Global Greenhouse Market Opportunity and Forecast, 2023-2032
- 3.3. Global Greenhouse Market Analysis, Opportunity and Forecast, By By Type, 2016-2032
- 3.3.1. Global Greenhouse Market Analysis by By Type: Introduction
- 3.3.2. Market Size Absolute $ Opportunity Analysis and Forecast, By By Type, 2016-2032
- 3.3.3. Glass Greenhouse
- 3.3.3.1. Horticulture Glass
- 3.3.3.2. Others
- 3.3.4. Plastic Greenhouse
- 3.3.4.1. Polyethylene
- 3.3.4.2. Polycarbonate
- 3.3.4.3. Polymethyl-methacrylate
- 3.4. Global Greenhouse Market Analysis, Opportunity and Forecast, By By Offering, 2016-2032
- 3.4.1. Global Greenhouse Market Analysis by By Offering: Introduction
- 3.4.2. Market Size Absolute $ Opportunity Analysis and Forecast, By By Offering, 2016-2032
- 3.4.3. Hardware
- 3.4.3.1. Climate control systems
- 3.4.3.2. Lighting Systems
- 3.4.3.3. Irrigation Systems
- 3.4.3.4. Sensors
- 3.4.3.5. Others
- 3.4.4. Software
- 3.4.4.1. Cloud-based
- 3.4.4.2. Web-based
- 3.4.5. Services
- 3.4.5.1. System Integration & Consulting
- 3.4.5.2. Managed Services
- 3.4.5.3. Assisted Professional Services
- 3.5. Global Greenhouse Market Analysis, Opportunity and Forecast, By By Crop Type, 2016-2032
- 3.5.1. Global Greenhouse Market Analysis by By Crop Type: Introduction
- 3.5.2. Market Size Absolute $ Opportunity Analysis and Forecast, By By Crop Type, 2016-2032
- 3.5.3. Fruits, Vegetables & Herbs
- 3.5.3.1. Tomato
- 3.5.3.2. Lettuce
- 3.5.3.3. Bell and Chili Pepper
- 3.5.3.4. Strawberry
- 3.5.3.5. Cucumber
- 3.5.4. By Flowers & Ornamentals
- 3.5.4.1. Perennials
- 3.5.4.2. Annuals
- 3.5.4.3. Ornamentals
- 3.5.5. Others
- 3.6. Global Greenhouse Market Analysis, Opportunity and Forecast, By By End-user, 2016-2032
- 3.6.1. Global Greenhouse Market Analysis by By End-user: Introduction
- 3.6.2. Market Size Absolute $ Opportunity Analysis and Forecast, By By End-user, 2016-2032
- 3.6.3. Commercial Growers
- 3.6.4. Research and Educational Institutes
- 3.6.5. Retail Gardens
- 3.6.6. Others
- 4. North America Greenhouse Market Analysis, Opportunity and Forecast, 2016-2032
- 4.1. North America Greenhouse Market Analysis, 2016-2021
- 4.2. North America Greenhouse Market Opportunity and Forecast, 2023-2032
- 4.3. North America Greenhouse Market Analysis, Opportunity and Forecast, By By Type, 2016-2032
- 4.3.1. North America Greenhouse Market Analysis by By Type: Introduction
- 4.3.2. Market Size Absolute $ Opportunity Analysis and Forecast, By By Type, 2016-2032
- 4.3.3. Glass Greenhouse
- 4.3.3.1. Horticulture Glass
- 4.3.3.2. Others
- 4.3.4. Plastic Greenhouse
- 4.3.4.1. Polyethylene
- 4.3.4.2. Polycarbonate
- 4.3.4.3. Polymethyl-methacrylate
- 4.4. North America Greenhouse Market Analysis, Opportunity and Forecast, By By Offering, 2016-2032
- 4.4.1. North America Greenhouse Market Analysis by By Offering: Introduction
- 4.4.2. Market Size Absolute $ Opportunity Analysis and Forecast, By By Offering, 2016-2032
- 4.4.3. Hardware
- 4.4.3.1. Climate control systems
- 4.4.3.2. Lighting Systems
- 4.4.3.3. Irrigation Systems
- 4.4.3.4. Sensors
- 4.4.3.5. Others
- 4.4.4. Software
- 4.4.4.1. Cloud-based
- 4.4.4.2. Web-based
- 4.4.5. Services
- 4.4.5.1. System Integration & Consulting
- 4.4.5.2. Managed Services
- 4.4.5.3. Assisted Professional Services
- 4.5. North America Greenhouse Market Analysis, Opportunity and Forecast, By By Crop Type, 2016-2032
- 4.5.1. North America Greenhouse Market Analysis by By Crop Type: Introduction
- 4.5.2. Market Size Absolute $ Opportunity Analysis and Forecast, By By Crop Type, 2016-2032
- 4.5.3. Fruits, Vegetables & Herbs
- 4.5.3.1. Tomato
- 4.5.3.2. Lettuce
- 4.5.3.3. Bell and Chili Pepper
- 4.5.3.4. Strawberry
- 4.5.3.5. Cucumber
- 4.5.4. By Flowers & Ornamentals
- 4.5.4.1. Perennials
- 4.5.4.2. Annuals
- 4.5.4.3. Ornamentals
- 4.5.5. Others
- 4.6. North America Greenhouse Market Analysis, Opportunity and Forecast, By By End-user, 2016-2032
- 4.6.1. North America Greenhouse Market Analysis by By End-user: Introduction
- 4.6.2. Market Size Absolute $ Opportunity Analysis and Forecast, By By End-user, 2016-2032
- 4.6.3. Commercial Growers
- 4.6.4. Research and Educational Institutes
- 4.6.5. Retail Gardens
- 4.6.6. Others
- 4.7. North America Greenhouse Market Analysis, Opportunity and Forecast, By Country , 2016-2032
- 4.7.1. North America Greenhouse Market Analysis by Country : Introduction
- 4.7.2. Market Size Absolute $ Opportunity Analysis and Forecast, Country , 2016-2032
- 4.7.2.1. The US
- 4.7.2.2. Canada
- 4.7.2.3. Mexico
- 5. Western Europe Greenhouse Market Analysis, Opportunity and Forecast, 2016-2032
- 5.1. Western Europe Greenhouse Market Analysis, 2016-2021
- 5.2. Western Europe Greenhouse Market Opportunity and Forecast, 2023-2032
- 5.3. Western Europe Greenhouse Market Analysis, Opportunity and Forecast, By By Type, 2016-2032
- 5.3.1. Western Europe Greenhouse Market Analysis by By Type: Introduction
- 5.3.2. Market Size Absolute $ Opportunity Analysis and Forecast, By By Type, 2016-2032
- 5.3.3. Glass Greenhouse
- 5.3.3.1. Horticulture Glass
- 5.3.3.2. Others
- 5.3.4. Plastic Greenhouse
- 5.3.4.1. Polyethylene
- 5.3.4.2. Polycarbonate
- 5.3.4.3. Polymethyl-methacrylate
- 5.4. Western Europe Greenhouse Market Analysis, Opportunity and Forecast, By By Offering, 2016-2032
- 5.4.1. Western Europe Greenhouse Market Analysis by By Offering: Introduction
- 5.4.2. Market Size Absolute $ Opportunity Analysis and Forecast, By By Offering, 2016-2032
- 5.4.3. Hardware
- 5.4.3.1. Climate control systems
- 5.4.3.2. Lighting Systems
- 5.4.3.3. Irrigation Systems
- 5.4.3.4. Sensors
- 5.4.3.5. Others
- 5.4.4. Software
- 5.4.4.1. Cloud-based
- 5.4.4.2. Web-based
- 5.4.5. Services
- 5.4.5.1. System Integration & Consulting
- 5.4.5.2. Managed Services
- 5.4.5.3. Assisted Professional Services
- 5.5. Western Europe Greenhouse Market Analysis, Opportunity and Forecast, By By Crop Type, 2016-2032
- 5.5.1. Western Europe Greenhouse Market Analysis by By Crop Type: Introduction
- 5.5.2. Market Size Absolute $ Opportunity Analysis and Forecast, By By Crop Type, 2016-2032
- 5.5.3. Fruits, Vegetables & Herbs
- 5.5.3.1. Tomato
- 5.5.3.2. Lettuce
- 5.5.3.3. Bell and Chili Pepper
- 5.5.3.4. Strawberry
- 5.5.3.5. Cucumber
- 5.5.4. By Flowers & Ornamentals
- 5.5.4.1. Perennials
- 5.5.4.2. Annuals
- 5.5.4.3. Ornamentals
- 5.5.5. Others
- 5.6. Western Europe Greenhouse Market Analysis, Opportunity and Forecast, By By End-user, 2016-2032
- 5.6.1. Western Europe Greenhouse Market Analysis by By End-user: Introduction
- 5.6.2. Market Size Absolute $ Opportunity Analysis and Forecast, By By End-user, 2016-2032
- 5.6.3. Commercial Growers
- 5.6.4. Research and Educational Institutes
- 5.6.5. Retail Gardens
- 5.6.6. Others
- 5.7. Western Europe Greenhouse Market Analysis, Opportunity and Forecast, By Country , 2016-2032
- 5.7.1. Western Europe Greenhouse Market Analysis by Country : Introduction
- 5.7.2. Market Size Absolute $ Opportunity Analysis and Forecast, Country , 2016-2032
- 5.7.2.1. Germany
- 5.7.2.2. France
- 5.7.2.3. The UK
- 5.7.2.4. Spain
- 5.7.2.5. Italy
- 5.7.2.6. Portugal
- 5.7.2.7. Ireland
- 5.7.2.8. Austria
- 5.7.2.9. Switzerland
- 5.7.2.10. Benelux
- 5.7.2.11. Nordic
- 5.7.2.12. Rest of Western Europe
- 6. Eastern Europe Greenhouse Market Analysis, Opportunity and Forecast, 2016-2032
- 6.1. Eastern Europe Greenhouse Market Analysis, 2016-2021
- 6.2. Eastern Europe Greenhouse Market Opportunity and Forecast, 2023-2032
- 6.3. Eastern Europe Greenhouse Market Analysis, Opportunity and Forecast, By By Type, 2016-2032
- 6.3.1. Eastern Europe Greenhouse Market Analysis by By Type: Introduction
- 6.3.2. Market Size Absolute $ Opportunity Analysis and Forecast, By By Type, 2016-2032
- 6.3.3. Glass Greenhouse
- 6.3.3.1. Horticulture Glass
- 6.3.3.2. Others
- 6.3.4. Plastic Greenhouse
- 6.3.4.1. Polyethylene
- 6.3.4.2. Polycarbonate
- 6.3.4.3. Polymethyl-methacrylate
- 6.4. Eastern Europe Greenhouse Market Analysis, Opportunity and Forecast, By By Offering, 2016-2032
- 6.4.1. Eastern Europe Greenhouse Market Analysis by By Offering: Introduction
- 6.4.2. Market Size Absolute $ Opportunity Analysis and Forecast, By By Offering, 2016-2032
- 6.4.3. Hardware
- 6.4.3.1. Climate control systems
- 6.4.3.2. Lighting Systems
- 6.4.3.3. Irrigation Systems
- 6.4.3.4. Sensors
- 6.4.3.5. Others
- 6.4.4. Software
- 6.4.4.1. Cloud-based
- 6.4.4.2. Web-based
- 6.4.5. Services
- 6.4.5.1. System Integration & Consulting
- 6.4.5.2. Managed Services
- 6.4.5.3. Assisted Professional Services
- 6.5. Eastern Europe Greenhouse Market Analysis, Opportunity and Forecast, By By Crop Type, 2016-2032
- 6.5.1. Eastern Europe Greenhouse Market Analysis by By Crop Type: Introduction
- 6.5.2. Market Size Absolute $ Opportunity Analysis and Forecast, By By Crop Type, 2016-2032
- 6.5.3. Fruits, Vegetables & Herbs
- 6.5.3.1. Tomato
- 6.5.3.2. Lettuce
- 6.5.3.3. Bell and Chili Pepper
- 6.5.3.4. Strawberry
- 6.5.3.5. Cucumber
- 6.5.4. By Flowers & Ornamentals
- 6.5.4.1. Perennials
- 6.5.4.2. Annuals
- 6.5.4.3. Ornamentals
- 6.5.5. Others
- 6.6. Eastern Europe Greenhouse Market Analysis, Opportunity and Forecast, By By End-user, 2016-2032
- 6.6.1. Eastern Europe Greenhouse Market Analysis by By End-user: Introduction
- 6.6.2. Market Size Absolute $ Opportunity Analysis and Forecast, By By End-user, 2016-2032
- 6.6.3. Commercial Growers
- 6.6.4. Research and Educational Institutes
- 6.6.5. Retail Gardens
- 6.6.6. Others
- 6.7. Eastern Europe Greenhouse Market Analysis, Opportunity and Forecast, By Country , 2016-2032
- 6.7.1. Eastern Europe Greenhouse Market Analysis by Country : Introduction
- 6.7.2. Market Size Absolute $ Opportunity Analysis and Forecast, Country , 2016-2032
- 6.7.2.1. Russia
- 6.7.2.2. Poland
- 6.7.2.3. The Czech Republic
- 6.7.2.4. Greece
- 6.7.2.5. Rest of Eastern Europe
- 7. APAC Greenhouse Market Analysis, Opportunity and Forecast, 2016-2032
- 7.1. APAC Greenhouse Market Analysis, 2016-2021
- 7.2. APAC Greenhouse Market Opportunity and Forecast, 2023-2032
- 7.3. APAC Greenhouse Market Analysis, Opportunity and Forecast, By By Type, 2016-2032
- 7.3.1. APAC Greenhouse Market Analysis by By Type: Introduction
- 7.3.2. Market Size Absolute $ Opportunity Analysis and Forecast, By By Type, 2016-2032
- 7.3.3. Glass Greenhouse
- 7.3.3.1. Horticulture Glass
- 7.3.3.2. Others
- 7.3.4. Plastic Greenhouse
- 7.3.4.1. Polyethylene
- 7.3.4.2. Polycarbonate
- 7.3.4.3. Polymethyl-methacrylate
- 7.4. APAC Greenhouse Market Analysis, Opportunity and Forecast, By By Offering, 2016-2032
- 7.4.1. APAC Greenhouse Market Analysis by By Offering: Introduction
- 7.4.2. Market Size Absolute $ Opportunity Analysis and Forecast, By By Offering, 2016-2032
- 7.4.3. Hardware
- 7.4.3.1. Climate control systems
- 7.4.3.2. Lighting Systems
- 7.4.3.3. Irrigation Systems
- 7.4.3.4. Sensors
- 7.4.3.5. Others
- 7.4.4. Software
- 7.4.4.1. Cloud-based
- 7.4.4.2. Web-based
- 7.4.5. Services
- 7.4.5.1. System Integration & Consulting
- 7.4.5.2. Managed Services
- 7.4.5.3. Assisted Professional Services
- 7.5. APAC Greenhouse Market Analysis, Opportunity and Forecast, By By Crop Type, 2016-2032
- 7.5.1. APAC Greenhouse Market Analysis by By Crop Type: Introduction
- 7.5.2. Market Size Absolute $ Opportunity Analysis and Forecast, By By Crop Type, 2016-2032
- 7.5.3. Fruits, Vegetables & Herbs
- 7.5.3.1. Tomato
- 7.5.3.2. Lettuce
- 7.5.3.3. Bell and Chili Pepper
- 7.5.3.4. Strawberry
- 7.5.3.5. Cucumber
- 7.5.4. By Flowers & Ornamentals
- 7.5.4.1. Perennials
- 7.5.4.2. Annuals
- 7.5.4.3. Ornamentals
- 7.5.5. Others
- 7.6. APAC Greenhouse Market Analysis, Opportunity and Forecast, By By End-user, 2016-2032
- 7.6.1. APAC Greenhouse Market Analysis by By End-user: Introduction
- 7.6.2. Market Size Absolute $ Opportunity Analysis and Forecast, By By End-user, 2016-2032
- 7.6.3. Commercial Growers
- 7.6.4. Research and Educational Institutes
- 7.6.5. Retail Gardens
- 7.6.6. Others
- 7.7. APAC Greenhouse Market Analysis, Opportunity and Forecast, By Country , 2016-2032
- 7.7.1. APAC Greenhouse Market Analysis by Country : Introduction
- 7.7.2. Market Size Absolute $ Opportunity Analysis and Forecast, Country , 2016-2032
- 7.7.2.1. China
- 7.7.2.2. Japan
- 7.7.2.3. South Korea
- 7.7.2.4. India
- 7.7.2.5. Australia & New Zeland
- 7.7.2.6. Indonesia
- 7.7.2.7. Malaysia
- 7.7.2.8. Philippines
- 7.7.2.9. Singapore
- 7.7.2.10. Thailand
- 7.7.2.11. Vietnam
- 7.7.2.12. Rest of APAC
- 8. Latin America Greenhouse Market Analysis, Opportunity and Forecast, 2016-2032
- 8.1. Latin America Greenhouse Market Analysis, 2016-2021
- 8.2. Latin America Greenhouse Market Opportunity and Forecast, 2023-2032
- 8.3. Latin America Greenhouse Market Analysis, Opportunity and Forecast, By By Type, 2016-2032
- 8.3.1. Latin America Greenhouse Market Analysis by By Type: Introduction
- 8.3.2. Market Size Absolute $ Opportunity Analysis and Forecast, By By Type, 2016-2032
- 8.3.3. Glass Greenhouse
- 8.3.3.1. Horticulture Glass
- 8.3.3.2. Others
- 8.3.4. Plastic Greenhouse
- 8.3.4.1. Polyethylene
- 8.3.4.2. Polycarbonate
- 8.3.4.3. Polymethyl-methacrylate
- 8.4. Latin America Greenhouse Market Analysis, Opportunity and Forecast, By By Offering, 2016-2032
- 8.4.1. Latin America Greenhouse Market Analysis by By Offering: Introduction
- 8.4.2. Market Size Absolute $ Opportunity Analysis and Forecast, By By Offering, 2016-2032
- 8.4.3. Hardware
- 8.4.3.1. Climate control systems
- 8.4.3.2. Lighting Systems
- 8.4.3.3. Irrigation Systems
- 8.4.3.4. Sensors
- 8.4.3.5. Others
- 8.4.4. Software
- 8.4.4.1. Cloud-based
- 8.4.4.2. Web-based
- 8.4.5. Services
- 8.4.5.1. System Integration & Consulting
- 8.4.5.2. Managed Services
- 8.4.5.3. Assisted Professional Services
- 8.5. Latin America Greenhouse Market Analysis, Opportunity and Forecast, By By Crop Type, 2016-2032
- 8.5.1. Latin America Greenhouse Market Analysis by By Crop Type: Introduction
- 8.5.2. Market Size Absolute $ Opportunity Analysis and Forecast, By By Crop Type, 2016-2032
- 8.5.3. Fruits, Vegetables & Herbs
- 8.5.3.1. Tomato
- 8.5.3.2. Lettuce
- 8.5.3.3. Bell and Chili Pepper
- 8.5.3.4. Strawberry
- 8.5.3.5. Cucumber
- 8.5.4. By Flowers & Ornamentals
- 8.5.4.1. Perennials
- 8.5.4.2. Annuals
- 8.5.4.3. Ornamentals
- 8.5.5. Others
- 8.6. Latin America Greenhouse Market Analysis, Opportunity and Forecast, By By End-user, 2016-2032
- 8.6.1. Latin America Greenhouse Market Analysis by By End-user: Introduction
- 8.6.2. Market Size Absolute $ Opportunity Analysis and Forecast, By By End-user, 2016-2032
- 8.6.3. Commercial Growers
- 8.6.4. Research and Educational Institutes
- 8.6.5. Retail Gardens
- 8.6.6. Others
- 8.7. Latin America Greenhouse Market Analysis, Opportunity and Forecast, By Country , 2016-2032
- 8.7.1. Latin America Greenhouse Market Analysis by Country : Introduction
- 8.7.2. Market Size Absolute $ Opportunity Analysis and Forecast, Country , 2016-2032
- 8.7.2.1. Brazil
- 8.7.2.2. Colombia
- 8.7.2.3. Chile
- 8.7.2.4. Argentina
- 8.7.2.5. Costa Rica
- 8.7.2.6. Rest of Latin America
- 9. Middle East & Africa Greenhouse Market Analysis, Opportunity and Forecast, 2016-2032
- 9.1. Middle East & Africa Greenhouse Market Analysis, 2016-2021
- 9.2. Middle East & Africa Greenhouse Market Opportunity and Forecast, 2023-2032
- 9.3. Middle East & Africa Greenhouse Market Analysis, Opportunity and Forecast, By By Type, 2016-2032
- 9.3.1. Middle East & Africa Greenhouse Market Analysis by By Type: Introduction
- 9.3.2. Market Size Absolute $ Opportunity Analysis and Forecast, By By Type, 2016-2032
- 9.3.3. Glass Greenhouse
- 9.3.3.1. Horticulture Glass
- 9.3.3.2. Others
- 9.3.4. Plastic Greenhouse
- 9.3.4.1. Polyethylene
- 9.3.4.2. Polycarbonate
- 9.3.4.3. Polymethyl-methacrylate
- 9.4. Middle East & Africa Greenhouse Market Analysis, Opportunity and Forecast, By By Offering, 2016-2032
- 9.4.1. Middle East & Africa Greenhouse Market Analysis by By Offering: Introduction
- 9.4.2. Market Size Absolute $ Opportunity Analysis and Forecast, By By Offering, 2016-2032
- 9.4.3. Hardware
- 9.4.3.1. Climate control systems
- 9.4.3.2. Lighting Systems
- 9.4.3.3. Irrigation Systems
- 9.4.3.4. Sensors
- 9.4.3.5. Others
- 9.4.4. Software
- 9.4.4.1. Cloud-based
- 9.4.4.2. Web-based
- 9.4.5. Services
- 9.4.5.1. System Integration & Consulting
- 9.4.5.2. Managed Services
- 9.4.5.3. Assisted Professional Services
- 9.5. Middle East & Africa Greenhouse Market Analysis, Opportunity and Forecast, By By Crop Type, 2016-2032
- 9.5.1. Middle East & Africa Greenhouse Market Analysis by By Crop Type: Introduction
- 9.5.2. Market Size Absolute $ Opportunity Analysis and Forecast, By By Crop Type, 2016-2032
- 9.5.3. Fruits, Vegetables & Herbs
- 9.5.3.1. Tomato
- 9.5.3.2. Lettuce
- 9.5.3.3. Bell and Chili Pepper
- 9.5.3.4. Strawberry
- 9.5.3.5. Cucumber
- 9.5.4. By Flowers & Ornamentals
- 9.5.4.1. Perennials
- 9.5.4.2. Annuals
- 9.5.4.3. Ornamentals
- 9.5.5. Others
- 9.6. Middle East & Africa Greenhouse Market Analysis, Opportunity and Forecast, By By End-user, 2016-2032
- 9.6.1. Middle East & Africa Greenhouse Market Analysis by By End-user: Introduction
- 9.6.2. Market Size Absolute $ Opportunity Analysis and Forecast, By By End-user, 2016-2032
- 9.6.3. Commercial Growers
- 9.6.4. Research and Educational Institutes
- 9.6.5. Retail Gardens
- 9.6.6. Others
- 9.7. Middle East & Africa Greenhouse Market Analysis, Opportunity and Forecast, By Country , 2016-2032
- 9.7.1. Middle East & Africa Greenhouse Market Analysis by Country : Introduction
- 9.7.2. Market Size Absolute $ Opportunity Analysis and Forecast, Country , 2016-2032
- 9.7.2.1. Algeria
- 9.7.2.2. Egypt
- 9.7.2.3. Israel
- 9.7.2.4. Kuwait
- 9.7.2.5. Nigeria
- 9.7.2.6. Saudi Arabia
- 9.7.2.7. South Africa
- 9.7.2.8. Turkey
- 9.7.2.9. The UAE
- 9.7.2.10. Rest of MEA
- 10. Global Greenhouse Market Analysis, Opportunity and Forecast, By Region , 2016-2032
- 10.1. Global Greenhouse Market Analysis by Region : Introduction
- 10.2. Market Size Absolute $ Opportunity Analysis and Forecast, By Region , 2016-2032
- 10.2.1. North America
- 10.2.2. Western Europe
- 10.2.3. Eastern Europe
- 10.2.4. APAC
- 10.2.5. Latin America
- 10.2.6. Middle East & Africa
- 11. Global Greenhouse Market Competitive Landscape, Market Share Analysis, and Company Profiles
- 11.1. Market Share Analysis
- 11.2. Company Profiles
- 11.3. BrightFarms
- 11.3.1. Company Overview
- 11.3.2. Financial Highlights
- 11.3.3. Product Portfolio
- 11.3.4. SWOT Analysis
- 11.3.5. Key Strategies and Developments
- 11.4. AeroFarms
- 11.4.1. Company Overview
- 11.4.2. Financial Highlights
- 11.4.3. Product Portfolio
- 11.4.4. SWOT Analysis
- 11.4.5. Key Strategies and Developments
- 11.5. Backyard Farms
- 11.5.1. Company Overview
- 11.5.2. Financial Highlights
- 11.5.3. Product Portfolio
- 11.5.4. SWOT Analysis
- 11.5.5. Key Strategies and Developments
- 11.6. Bowery Farming
- 11.6.1. Company Overview
- 11.6.2. Financial Highlights
- 11.6.3. Product Portfolio
- 11.6.4. SWOT Analysis
- 11.6.5. Key Strategies and Developments
- 11.7. Gotham Greens
- 11.7.1. Company Overview
- 11.7.2. Financial Highlights
- 11.7.3. Product Portfolio
- 11.7.4. SWOT Analysis
- 11.7.5. Key Strategies and Developments
- 11.8. Jacobs Farm Del Cabo
- 11.8.1. Company Overview
- 11.8.2. Financial Highlights
- 11.8.3. Product Portfolio
- 11.8.4. SWOT Analysis
- 11.8.5. Key Strategies and Developments
- 11.9. Little Leaf Farms
- 11.9.1. Company Overview
- 11.9.2. Financial Highlights
- 11.9.3. Product Portfolio
- 11.9.4. SWOT Analysis
- 11.9.5. Key Strategies and Developments
- 11.10. Oasis Biotech
- 11.10.1. Company Overview
- 11.10.2. Financial Highlights
- 11.10.3. Product Portfolio
- 11.10.4. SWOT Analysis
- 11.10.5. Key Strategies and Developments
- 11.11. Luiten Greenhouses BV
- 11.11.1. Company Overview
- 11.11.2. Financial Highlights
- 11.11.3. Product Portfolio
- 11.11.4. SWOT Analysis
- 11.11.5. Key Strategies and Developments
- 11.12. Prospiant Inc
- 11.12.1. Company Overview
- 11.12.2. Financial Highlights
- 11.12.3. Product Portfolio
- 11.12.4. SWOT Analysis
- 11.12.5. Key Strategies and Developments
- 11.13.1. Company Overview
- 11.13.2. Financial Highlights
- 11.13.3. Product Portfolio
- 11.13.4. SWOT Analysis
- 11.13.5. Key Strategies and Developments
- 11.14. Richel Group SAS
- 11.14.1. Company Overview
- 11.14.2. Financial Highlights
- 11.14.3. Product Portfolio
- 11.14.4. SWOT Analysis
- 11.14.5. Key Strategies and Developments
- 11.15. Stuppy Greenhouse
- 11.15.1. Company Overview
- 11.15.2. Financial Highlights
- 11.15.3. Product Portfolio
- 11.15.4. SWOT Analysis
- 11.15.5. Key Strategies and Developments
- 11.16. Signify NV
- 11.16.1. Company Overview
- 11.16.2. Financial Highlights
- 11.16.3. Product Portfolio
- 11.16.4. SWOT Analysis
- 11.16.5. Key Strategies and Developments
- 11.17. PLASTIKA KRITIS SA
- 11.17.1. Company Overview
- 11.17.2. Financial Highlights
- 11.17.3. Product Portfolio
- 11.17.4. SWOT Analysis
- 11.17.5. Key Strategies and Developments
- 12. Assumptions and Acronyms
- 13. Research Methodology
- 14. Contact
"
- List of Figures
- "
- Figure 1: Global Greenhouse Market Revenue (US$ Mn) Market Share by By Type in 2022
- Figure 2: Global Greenhouse Market Market Attractiveness Analysis by By Type, 2016-2032
- Figure 3: Global Greenhouse Market Revenue (US$ Mn) Market Share by By Offeringin 2022
- Figure 4: Global Greenhouse Market Market Attractiveness Analysis by By Offering, 2016-2032
- Figure 5: Global Greenhouse Market Revenue (US$ Mn) Market Share by By Crop Typein 2022
- Figure 6: Global Greenhouse Market Market Attractiveness Analysis by By Crop Type, 2016-2032
- Figure 7: Global Greenhouse Market Revenue (US$ Mn) Market Share by By End-userin 2022
- Figure 8: Global Greenhouse Market Market Attractiveness Analysis by By End-user, 2016-2032
- Figure 9: Global Greenhouse Market Revenue (US$ Mn) Market Share by Region in 2022
- Figure 10: Global Greenhouse Market Market Attractiveness Analysis by Region, 2016-2032
- Figure 11: Global Greenhouse Market Market Revenue (US$ Mn) (2016-2032)
- Figure 12: Global Greenhouse Market Market Revenue (US$ Mn) Comparison by Region (2016-2032)
- Figure 13: Global Greenhouse Market Market Revenue (US$ Mn) Comparison by By Type (2016-2032)
- Figure 14: Global Greenhouse Market Market Revenue (US$ Mn) Comparison by By Offering (2016-2032)
- Figure 15: Global Greenhouse Market Market Revenue (US$ Mn) Comparison by By Crop Type (2016-2032)
- Figure 16: Global Greenhouse Market Market Revenue (US$ Mn) Comparison by By End-user (2016-2032)
- Figure 17: Global Greenhouse Market Market Y-o-Y Growth Rate Comparison by Region (2016-2032)
- Figure 18: Global Greenhouse Market Market Y-o-Y Growth Rate Comparison by By Type (2016-2032)
- Figure 19: Global Greenhouse Market Market Y-o-Y Growth Rate Comparison by By Offering (2016-2032)
- Figure 20: Global Greenhouse Market Market Y-o-Y Growth Rate Comparison by By Crop Type (2016-2032)
- Figure 21: Global Greenhouse Market Market Y-o-Y Growth Rate Comparison by By End-user (2016-2032)
- Figure 22: Global Greenhouse Market Market Share Comparison by Region (2016-2032)
- Figure 23: Global Greenhouse Market Market Share Comparison by By Type (2016-2032)
- Figure 24: Global Greenhouse Market Market Share Comparison by By Offering (2016-2032)
- Figure 25: Global Greenhouse Market Market Share Comparison by By Crop Type (2016-2032)
- Figure 26: Global Greenhouse Market Market Share Comparison by By End-user (2016-2032)
- Figure 27: North America Greenhouse Market Revenue (US$ Mn) Market Share by By Typein 2022
- Figure 28: North America Greenhouse Market Market Attractiveness Analysis by By Type, 2016-2032
- Figure 29: North America Greenhouse Market Revenue (US$ Mn) Market Share by By Offeringin 2022
- Figure 30: North America Greenhouse Market Market Attractiveness Analysis by By Offering, 2016-2032
- Figure 31: North America Greenhouse Market Revenue (US$ Mn) Market Share by By Crop Typein 2022
- Figure 32: North America Greenhouse Market Market Attractiveness Analysis by By Crop Type, 2016-2032
- Figure 33: North America Greenhouse Market Revenue (US$ Mn) Market Share by By End-userin 2022
- Figure 34: North America Greenhouse Market Market Attractiveness Analysis by By End-user, 2016-2032
- Figure 35: North America Greenhouse Market Revenue (US$ Mn) Market Share by Country in 2022
- Figure 36: North America Greenhouse Market Market Attractiveness Analysis by Country, 2016-2032
- Figure 37: North America Greenhouse Market Market Revenue (US$ Mn) (2016-2032)
- Figure 38: North America Greenhouse Market Market Revenue (US$ Mn) Comparison by Country (2016-2032)
- Figure 39: North America Greenhouse Market Market Revenue (US$ Mn) Comparison by By Type (2016-2032)
- Figure 40: North America Greenhouse Market Market Revenue (US$ Mn) Comparison by By Offering (2016-2032)
- Figure 41: North America Greenhouse Market Market Revenue (US$ Mn) Comparison by By Crop Type (2016-2032)
- Figure 42: North America Greenhouse Market Market Revenue (US$ Mn) Comparison by By End-user (2016-2032)
- Figure 43: North America Greenhouse Market Market Y-o-Y Growth Rate Comparison by Country (2016-2032)
- Figure 44: North America Greenhouse Market Market Y-o-Y Growth Rate Comparison by By Type (2016-2032)
- Figure 45: North America Greenhouse Market Market Y-o-Y Growth Rate Comparison by By Offering (2016-2032)
- Figure 46: North America Greenhouse Market Market Y-o-Y Growth Rate Comparison by By Crop Type (2016-2032)
- Figure 47: North America Greenhouse Market Market Y-o-Y Growth Rate Comparison by By End-user (2016-2032)
- Figure 48: North America Greenhouse Market Market Share Comparison by Country (2016-2032)
- Figure 49: North America Greenhouse Market Market Share Comparison by By Type (2016-2032)
- Figure 50: North America Greenhouse Market Market Share Comparison by By Offering (2016-2032)
- Figure 51: North America Greenhouse Market Market Share Comparison by By Crop Type (2016-2032)
- Figure 52: North America Greenhouse Market Market Share Comparison by By End-user (2016-2032)
- Figure 53: Western Europe Greenhouse Market Revenue (US$ Mn) Market Share by By Typein 2022
- Figure 54: Western Europe Greenhouse Market Market Attractiveness Analysis by By Type, 2016-2032
- Figure 55: Western Europe Greenhouse Market Revenue (US$ Mn) Market Share by By Offeringin 2022
- Figure 56: Western Europe Greenhouse Market Market Attractiveness Analysis by By Offering, 2016-2032
- Figure 57: Western Europe Greenhouse Market Revenue (US$ Mn) Market Share by By Crop Typein 2022
- Figure 58: Western Europe Greenhouse Market Market Attractiveness Analysis by By Crop Type, 2016-2032
- Figure 59: Western Europe Greenhouse Market Revenue (US$ Mn) Market Share by By End-userin 2022
- Figure 60: Western Europe Greenhouse Market Market Attractiveness Analysis by By End-user, 2016-2032
- Figure 61: Western Europe Greenhouse Market Revenue (US$ Mn) Market Share by Country in 2022
- Figure 62: Western Europe Greenhouse Market Market Attractiveness Analysis by Country, 2016-2032
- Figure 63: Western Europe Greenhouse Market Market Revenue (US$ Mn) (2016-2032)
- Figure 64: Western Europe Greenhouse Market Market Revenue (US$ Mn) Comparison by Country (2016-2032)
- Figure 65: Western Europe Greenhouse Market Market Revenue (US$ Mn) Comparison by By Type (2016-2032)
- Figure 66: Western Europe Greenhouse Market Market Revenue (US$ Mn) Comparison by By Offering (2016-2032)
- Figure 67: Western Europe Greenhouse Market Market Revenue (US$ Mn) Comparison by By Crop Type (2016-2032)
- Figure 68: Western Europe Greenhouse Market Market Revenue (US$ Mn) Comparison by By End-user (2016-2032)
- Figure 69: Western Europe Greenhouse Market Market Y-o-Y Growth Rate Comparison by Country (2016-2032)
- Figure 70: Western Europe Greenhouse Market Market Y-o-Y Growth Rate Comparison by By Type (2016-2032)
- Figure 71: Western Europe Greenhouse Market Market Y-o-Y Growth Rate Comparison by By Offering (2016-2032)
- Figure 72: Western Europe Greenhouse Market Market Y-o-Y Growth Rate Comparison by By Crop Type (2016-2032)
- Figure 73: Western Europe Greenhouse Market Market Y-o-Y Growth Rate Comparison by By End-user (2016-2032)
- Figure 74: Western Europe Greenhouse Market Market Share Comparison by Country (2016-2032)
- Figure 75: Western Europe Greenhouse Market Market Share Comparison by By Type (2016-2032)
- Figure 76: Western Europe Greenhouse Market Market Share Comparison by By Offering (2016-2032)
- Figure 77: Western Europe Greenhouse Market Market Share Comparison by By Crop Type (2016-2032)
- Figure 78: Western Europe Greenhouse Market Market Share Comparison by By End-user (2016-2032)
- Figure 79: Eastern Europe Greenhouse Market Revenue (US$ Mn) Market Share by By Typein 2022
- Figure 80: Eastern Europe Greenhouse Market Market Attractiveness Analysis by By Type, 2016-2032
- Figure 81: Eastern Europe Greenhouse Market Revenue (US$ Mn) Market Share by By Offeringin 2022
- Figure 82: Eastern Europe Greenhouse Market Market Attractiveness Analysis by By Offering, 2016-2032
- Figure 83: Eastern Europe Greenhouse Market Revenue (US$ Mn) Market Share by By Crop Typein 2022
- Figure 84: Eastern Europe Greenhouse Market Market Attractiveness Analysis by By Crop Type, 2016-2032
- Figure 85: Eastern Europe Greenhouse Market Revenue (US$ Mn) Market Share by By End-userin 2022
- Figure 86: Eastern Europe Greenhouse Market Market Attractiveness Analysis by By End-user, 2016-2032
- Figure 87: Eastern Europe Greenhouse Market Revenue (US$ Mn) Market Share by Country in 2022
- Figure 88: Eastern Europe Greenhouse Market Market Attractiveness Analysis by Country, 2016-2032
- Figure 89: Eastern Europe Greenhouse Market Market Revenue (US$ Mn) (2016-2032)
- Figure 90: Eastern Europe Greenhouse Market Market Revenue (US$ Mn) Comparison by Country (2016-2032)
- Figure 91: Eastern Europe Greenhouse Market Market Revenue (US$ Mn) Comparison by By Type (2016-2032)
- Figure 92: Eastern Europe Greenhouse Market Market Revenue (US$ Mn) Comparison by By Offering (2016-2032)
- Figure 93: Eastern Europe Greenhouse Market Market Revenue (US$ Mn) Comparison by By Crop Type (2016-2032)
- Figure 94: Eastern Europe Greenhouse Market Market Revenue (US$ Mn) Comparison by By End-user (2016-2032)
- Figure 95: Eastern Europe Greenhouse Market Market Y-o-Y Growth Rate Comparison by Country (2016-2032)
- Figure 96: Eastern Europe Greenhouse Market Market Y-o-Y Growth Rate Comparison by By Type (2016-2032)
- Figure 97: Eastern Europe Greenhouse Market Market Y-o-Y Growth Rate Comparison by By Offering (2016-2032)
- Figure 98: Eastern Europe Greenhouse Market Market Y-o-Y Growth Rate Comparison by By Crop Type (2016-2032)
- Figure 99: Eastern Europe Greenhouse Market Market Y-o-Y Growth Rate Comparison by By End-user (2016-2032)
- Figure 100: Eastern Europe Greenhouse Market Market Share Comparison by Country (2016-2032)
- Figure 101: Eastern Europe Greenhouse Market Market Share Comparison by By Type (2016-2032)
- Figure 102: Eastern Europe Greenhouse Market Market Share Comparison by By Offering (2016-2032)
- Figure 103: Eastern Europe Greenhouse Market Market Share Comparison by By Crop Type (2016-2032)
- Figure 104: Eastern Europe Greenhouse Market Market Share Comparison by By End-user (2016-2032)
- Figure 105: APAC Greenhouse Market Revenue (US$ Mn) Market Share by By Typein 2022
- Figure 106: APAC Greenhouse Market Market Attractiveness Analysis by By Type, 2016-2032
- Figure 107: APAC Greenhouse Market Revenue (US$ Mn) Market Share by By Offeringin 2022
- Figure 108: APAC Greenhouse Market Market Attractiveness Analysis by By Offering, 2016-2032
- Figure 109: APAC Greenhouse Market Revenue (US$ Mn) Market Share by By Crop Typein 2022
- Figure 110: APAC Greenhouse Market Market Attractiveness Analysis by By Crop Type, 2016-2032
- Figure 111: APAC Greenhouse Market Revenue (US$ Mn) Market Share by By End-userin 2022
- Figure 112: APAC Greenhouse Market Market Attractiveness Analysis by By End-user, 2016-2032
- Figure 113: APAC Greenhouse Market Revenue (US$ Mn) Market Share by Country in 2022
- Figure 114: APAC Greenhouse Market Market Attractiveness Analysis by Country, 2016-2032
- Figure 115: APAC Greenhouse Market Market Revenue (US$ Mn) (2016-2032)
- Figure 116: APAC Greenhouse Market Market Revenue (US$ Mn) Comparison by Country (2016-2032)
- Figure 117: APAC Greenhouse Market Market Revenue (US$ Mn) Comparison by By Type (2016-2032)
- Figure 118: APAC Greenhouse Market Market Revenue (US$ Mn) Comparison by By Offering (2016-2032)
- Figure 119: APAC Greenhouse Market Market Revenue (US$ Mn) Comparison by By Crop Type (2016-2032)
- Figure 120: APAC Greenhouse Market Market Revenue (US$ Mn) Comparison by By End-user (2016-2032)
- Figure 121: APAC Greenhouse Market Market Y-o-Y Growth Rate Comparison by Country (2016-2032)
- Figure 122: APAC Greenhouse Market Market Y-o-Y Growth Rate Comparison by By Type (2016-2032)
- Figure 123: APAC Greenhouse Market Market Y-o-Y Growth Rate Comparison by By Offering (2016-2032)
- Figure 124: APAC Greenhouse Market Market Y-o-Y Growth Rate Comparison by By Crop Type (2016-2032)
- Figure 125: APAC Greenhouse Market Market Y-o-Y Growth Rate Comparison by By End-user (2016-2032)
- Figure 126: APAC Greenhouse Market Market Share Comparison by Country (2016-2032)
- Figure 127: APAC Greenhouse Market Market Share Comparison by By Type (2016-2032)
- Figure 128: APAC Greenhouse Market Market Share Comparison by By Offering (2016-2032)
- Figure 129: APAC Greenhouse Market Market Share Comparison by By Crop Type (2016-2032)
- Figure 130: APAC Greenhouse Market Market Share Comparison by By End-user (2016-2032)
- Figure 131: Latin America Greenhouse Market Revenue (US$ Mn) Market Share by By Typein 2022
- Figure 132: Latin America Greenhouse Market Market Attractiveness Analysis by By Type, 2016-2032
- Figure 133: Latin America Greenhouse Market Revenue (US$ Mn) Market Share by By Offeringin 2022
- Figure 134: Latin America Greenhouse Market Market Attractiveness Analysis by By Offering, 2016-2032
- Figure 135: Latin America Greenhouse Market Revenue (US$ Mn) Market Share by By Crop Typein 2022
- Figure 136: Latin America Greenhouse Market Market Attractiveness Analysis by By Crop Type, 2016-2032
- Figure 137: Latin America Greenhouse Market Revenue (US$ Mn) Market Share by By End-userin 2022
- Figure 138: Latin America Greenhouse Market Market Attractiveness Analysis by By End-user, 2016-2032
- Figure 139: Latin America Greenhouse Market Revenue (US$ Mn) Market Share by Country in 2022
- Figure 140: Latin America Greenhouse Market Market Attractiveness Analysis by Country, 2016-2032
- Figure 141: Latin America Greenhouse Market Market Revenue (US$ Mn) (2016-2032)
- Figure 142: Latin America Greenhouse Market Market Revenue (US$ Mn) Comparison by Country (2016-2032)
- Figure 143: Latin America Greenhouse Market Market Revenue (US$ Mn) Comparison by By Type (2016-2032)
- Figure 144: Latin America Greenhouse Market Market Revenue (US$ Mn) Comparison by By Offering (2016-2032)
- Figure 145: Latin America Greenhouse Market Market Revenue (US$ Mn) Comparison by By Crop Type (2016-2032)
- Figure 146: Latin America Greenhouse Market Market Revenue (US$ Mn) Comparison by By End-user (2016-2032)
- Figure 147: Latin America Greenhouse Market Market Y-o-Y Growth Rate Comparison by Country (2016-2032)
- Figure 148: Latin America Greenhouse Market Market Y-o-Y Growth Rate Comparison by By Type (2016-2032)
- Figure 149: Latin America Greenhouse Market Market Y-o-Y Growth Rate Comparison by By Offering (2016-2032)
- Figure 150: Latin America Greenhouse Market Market Y-o-Y Growth Rate Comparison by By Crop Type (2016-2032)
- Figure 151: Latin America Greenhouse Market Market Y-o-Y Growth Rate Comparison by By End-user (2016-2032)
- Figure 152: Latin America Greenhouse Market Market Share Comparison by Country (2016-2032)
- Figure 153: Latin America Greenhouse Market Market Share Comparison by By Type (2016-2032)
- Figure 154: Latin America Greenhouse Market Market Share Comparison by By Offering (2016-2032)
- Figure 155: Latin America Greenhouse Market Market Share Comparison by By Crop Type (2016-2032)
- Figure 156: Latin America Greenhouse Market Market Share Comparison by By End-user (2016-2032)
- Figure 157: Middle East & Africa Greenhouse Market Revenue (US$ Mn) Market Share by By Typein 2022
- Figure 158: Middle East & Africa Greenhouse Market Market Attractiveness Analysis by By Type, 2016-2032
- Figure 159: Middle East & Africa Greenhouse Market Revenue (US$ Mn) Market Share by By Offeringin 2022
- Figure 160: Middle East & Africa Greenhouse Market Market Attractiveness Analysis by By Offering, 2016-2032
- Figure 161: Middle East & Africa Greenhouse Market Revenue (US$ Mn) Market Share by By Crop Typein 2022
- Figure 162: Middle East & Africa Greenhouse Market Market Attractiveness Analysis by By Crop Type, 2016-2032
- Figure 163: Middle East & Africa Greenhouse Market Revenue (US$ Mn) Market Share by By End-userin 2022
- Figure 164: Middle East & Africa Greenhouse Market Market Attractiveness Analysis by By End-user, 2016-2032
- Figure 165: Middle East & Africa Greenhouse Market Revenue (US$ Mn) Market Share by Country in 2022
- Figure 166: Middle East & Africa Greenhouse Market Market Attractiveness Analysis by Country, 2016-2032
- Figure 167: Middle East & Africa Greenhouse Market Market Revenue (US$ Mn) (2016-2032)
- Figure 168: Middle East & Africa Greenhouse Market Market Revenue (US$ Mn) Comparison by Country (2016-2032)
- Figure 169: Middle East & Africa Greenhouse Market Market Revenue (US$ Mn) Comparison by By Type (2016-2032)
- Figure 170: Middle East & Africa Greenhouse Market Market Revenue (US$ Mn) Comparison by By Offering (2016-2032)
- Figure 171: Middle East & Africa Greenhouse Market Market Revenue (US$ Mn) Comparison by By Crop Type (2016-2032)
- Figure 172: Middle East & Africa Greenhouse Market Market Revenue (US$ Mn) Comparison by By End-user (2016-2032)
- Figure 173: Middle East & Africa Greenhouse Market Market Y-o-Y Growth Rate Comparison by Country (2016-2032)
- Figure 174: Middle East & Africa Greenhouse Market Market Y-o-Y Growth Rate Comparison by By Type (2016-2032)
- Figure 175: Middle East & Africa Greenhouse Market Market Y-o-Y Growth Rate Comparison by By Offering (2016-2032)
- Figure 176: Middle East & Africa Greenhouse Market Market Y-o-Y Growth Rate Comparison by By Crop Type (2016-2032)
- Figure 177: Middle East & Africa Greenhouse Market Market Y-o-Y Growth Rate Comparison by By End-user (2016-2032)
- Figure 178: Middle East & Africa Greenhouse Market Market Share Comparison by Country (2016-2032)
- Figure 179: Middle East & Africa Greenhouse Market Market Share Comparison by By Type (2016-2032)
- Figure 180: Middle East & Africa Greenhouse Market Market Share Comparison by By Offering (2016-2032)
- Figure 181: Middle East & Africa Greenhouse Market Market Share Comparison by By Crop Type (2016-2032)
- Figure 182: Middle East & Africa Greenhouse Market Market Share Comparison by By End-user (2016-2032)
"
- List of Tables
- "
- Table 1: Global Greenhouse Market Market Comparison by By Type (2016-2032)
- Table 2: Global Greenhouse Market Market Comparison by By Offering (2016-2032)
- Table 3: Global Greenhouse Market Market Comparison by By Crop Type (2016-2032)
- Table 4: Global Greenhouse Market Market Comparison by By End-user (2016-2032)
- Table 5: Global Greenhouse Market Revenue (US$ Mn) Comparison by Region (2016-2032)
- Table 6: Global Greenhouse Market Market Revenue (US$ Mn) (2016-2032)
- Table 7: Global Greenhouse Market Market Revenue (US$ Mn) Comparison by Region (2016-2032)
- Table 8: Global Greenhouse Market Market Revenue (US$ Mn) Comparison by By Type (2016-2032)
- Table 9: Global Greenhouse Market Market Revenue (US$ Mn) Comparison by By Offering (2016-2032)
- Table 10: Global Greenhouse Market Market Revenue (US$ Mn) Comparison by By Crop Type (2016-2032)
- Table 11: Global Greenhouse Market Market Revenue (US$ Mn) Comparison by By End-user (2016-2032)
- Table 12: Global Greenhouse Market Market Y-o-Y Growth Rate Comparison by Region (2016-2032)
- Table 13: Global Greenhouse Market Market Y-o-Y Growth Rate Comparison by By Type (2016-2032)
- Table 14: Global Greenhouse Market Market Y-o-Y Growth Rate Comparison by By Offering (2016-2032)
- Table 15: Global Greenhouse Market Market Y-o-Y Growth Rate Comparison by By Crop Type (2016-2032)
- Table 16: Global Greenhouse Market Market Y-o-Y Growth Rate Comparison by By End-user (2016-2032)
- Table 17: Global Greenhouse Market Market Share Comparison by Region (2016-2032)
- Table 18: Global Greenhouse Market Market Share Comparison by By Type (2016-2032)
- Table 19: Global Greenhouse Market Market Share Comparison by By Offering (2016-2032)
- Table 20: Global Greenhouse Market Market Share Comparison by By Crop Type (2016-2032)
- Table 21: Global Greenhouse Market Market Share Comparison by By End-user (2016-2032)
- Table 22: North America Greenhouse Market Market Comparison by By Offering (2016-2032)
- Table 23: North America Greenhouse Market Market Comparison by By Crop Type (2016-2032)
- Table 24: North America Greenhouse Market Market Comparison by By End-user (2016-2032)
- Table 25: North America Greenhouse Market Revenue (US$ Mn) Comparison by Country (2016-2032)
- Table 26: North America Greenhouse Market Market Revenue (US$ Mn) (2016-2032)
- Table 27: North America Greenhouse Market Market Revenue (US$ Mn) Comparison by Country (2016-2032)
- Table 28: North America Greenhouse Market Market Revenue (US$ Mn) Comparison by By Type (2016-2032)
- Table 29: North America Greenhouse Market Market Revenue (US$ Mn) Comparison by By Offering (2016-2032)
- Table 30: North America Greenhouse Market Market Revenue (US$ Mn) Comparison by By Crop Type (2016-2032)
- Table 31: North America Greenhouse Market Market Revenue (US$ Mn) Comparison by By End-user (2016-2032)
- Table 32: North America Greenhouse Market Market Y-o-Y Growth Rate Comparison by Country (2016-2032)
- Table 33: North America Greenhouse Market Market Y-o-Y Growth Rate Comparison by By Type (2016-2032)
- Table 34: North America Greenhouse Market Market Y-o-Y Growth Rate Comparison by By Offering (2016-2032)
- Table 35: North America Greenhouse Market Market Y-o-Y Growth Rate Comparison by By Crop Type (2016-2032)
- Table 36: North America Greenhouse Market Market Y-o-Y Growth Rate Comparison by By End-user (2016-2032)
- Table 37: North America Greenhouse Market Market Share Comparison by Country (2016-2032)
- Table 38: North America Greenhouse Market Market Share Comparison by By Type (2016-2032)
- Table 39: North America Greenhouse Market Market Share Comparison by By Offering (2016-2032)
- Table 40: North America Greenhouse Market Market Share Comparison by By Crop Type (2016-2032)
- Table 41: North America Greenhouse Market Market Share Comparison by By End-user (2016-2032)
- Table 42: Western Europe Greenhouse Market Market Comparison by By Type (2016-2032)
- Table 43: Western Europe Greenhouse Market Market Comparison by By Offering (2016-2032)
- Table 44: Western Europe Greenhouse Market Market Comparison by By Crop Type (2016-2032)
- Table 45: Western Europe Greenhouse Market Market Comparison by By End-user (2016-2032)
- Table 46: Western Europe Greenhouse Market Revenue (US$ Mn) Comparison by Country (2016-2032)
- Table 47: Western Europe Greenhouse Market Market Revenue (US$ Mn) (2016-2032)
- Table 48: Western Europe Greenhouse Market Market Revenue (US$ Mn) Comparison by Country (2016-2032)
- Table 49: Western Europe Greenhouse Market Market Revenue (US$ Mn) Comparison by By Type (2016-2032)
- Table 50: Western Europe Greenhouse Market Market Revenue (US$ Mn) Comparison by By Offering (2016-2032)
- Table 51: Western Europe Greenhouse Market Market Revenue (US$ Mn) Comparison by By Crop Type (2016-2032)
- Table 52: Western Europe Greenhouse Market Market Revenue (US$ Mn) Comparison by By End-user (2016-2032)
- Table 53: Western Europe Greenhouse Market Market Y-o-Y Growth Rate Comparison by Country (2016-2032)
- Table 54: Western Europe Greenhouse Market Market Y-o-Y Growth Rate Comparison by By Type (2016-2032)
- Table 55: Western Europe Greenhouse Market Market Y-o-Y Growth Rate Comparison by By Offering (2016-2032)
- Table 56: Western Europe Greenhouse Market Market Y-o-Y Growth Rate Comparison by By Crop Type (2016-2032)
- Table 57: Western Europe Greenhouse Market Market Y-o-Y Growth Rate Comparison by By End-user (2016-2032)
- Table 58: Western Europe Greenhouse Market Market Share Comparison by Country (2016-2032)
- Table 59: Western Europe Greenhouse Market Market Share Comparison by By Type (2016-2032)
- Table 60: Western Europe Greenhouse Market Market Share Comparison by By Offering (2016-2032)
- Table 61: Western Europe Greenhouse Market Market Share Comparison by By Crop Type (2016-2032)
- Table 62: Western Europe Greenhouse Market Market Share Comparison by By End-user (2016-2032)
- Table 63: Eastern Europe Greenhouse Market Market Comparison by By Type (2016-2032)
- Table 64: Eastern Europe Greenhouse Market Market Comparison by By Offering (2016-2032)
- Table 65: Eastern Europe Greenhouse Market Market Comparison by By Crop Type (2016-2032)
- Table 66: Eastern Europe Greenhouse Market Market Comparison by By End-user (2016-2032)
- Table 67: Eastern Europe Greenhouse Market Revenue (US$ Mn) Comparison by Country (2016-2032)
- Table 68: Eastern Europe Greenhouse Market Market Revenue (US$ Mn) (2016-2032)
- Table 69: Eastern Europe Greenhouse Market Market Revenue (US$ Mn) Comparison by Country (2016-2032)
- Table 70: Eastern Europe Greenhouse Market Market Revenue (US$ Mn) Comparison by By Type (2016-2032)
- Table 71: Eastern Europe Greenhouse Market Market Revenue (US$ Mn) Comparison by By Offering (2016-2032)
- Table 72: Eastern Europe Greenhouse Market Market Revenue (US$ Mn) Comparison by By Crop Type (2016-2032)
- Table 73: Eastern Europe Greenhouse Market Market Revenue (US$ Mn) Comparison by By End-user (2016-2032)
- Table 74: Eastern Europe Greenhouse Market Market Y-o-Y Growth Rate Comparison by Country (2016-2032)
- Table 75: Eastern Europe Greenhouse Market Market Y-o-Y Growth Rate Comparison by By Type (2016-2032)
- Table 76: Eastern Europe Greenhouse Market Market Y-o-Y Growth Rate Comparison by By Offering (2016-2032)
- Table 77: Eastern Europe Greenhouse Market Market Y-o-Y Growth Rate Comparison by By Crop Type (2016-2032)
- Table 78: Eastern Europe Greenhouse Market Market Y-o-Y Growth Rate Comparison by By End-user (2016-2032)
- Table 79: Eastern Europe Greenhouse Market Market Share Comparison by Country (2016-2032)
- Table 80: Eastern Europe Greenhouse Market Market Share Comparison by By Type (2016-2032)
- Table 81: Eastern Europe Greenhouse Market Market Share Comparison by By Offering (2016-2032)
- Table 82: Eastern Europe Greenhouse Market Market Share Comparison by By Crop Type (2016-2032)
- Table 83: Eastern Europe Greenhouse Market Market Share Comparison by By End-user (2016-2032)
- Table 84: APAC Greenhouse Market Market Comparison by By Type (2016-2032)
- Table 85: APAC Greenhouse Market Market Comparison by By Offering (2016-2032)
- Table 86: APAC Greenhouse Market Market Comparison by By Crop Type (2016-2032)
- Table 87: APAC Greenhouse Market Market Comparison by By End-user (2016-2032)
- Table 88: APAC Greenhouse Market Revenue (US$ Mn) Comparison by Country (2016-2032)
- Table 89: APAC Greenhouse Market Market Revenue (US$ Mn) (2016-2032)
- Table 90: APAC Greenhouse Market Market Revenue (US$ Mn) Comparison by Country (2016-2032)
- Table 91: APAC Greenhouse Market Market Revenue (US$ Mn) Comparison by By Type (2016-2032)
- Table 92: APAC Greenhouse Market Market Revenue (US$ Mn) Comparison by By Offering (2016-2032)
- Table 93: APAC Greenhouse Market Market Revenue (US$ Mn) Comparison by By Crop Type (2016-2032)
- Table 94: APAC Greenhouse Market Market Revenue (US$ Mn) Comparison by By End-user (2016-2032)
- Table 95: APAC Greenhouse Market Market Y-o-Y Growth Rate Comparison by Country (2016-2032)
- Table 96: APAC Greenhouse Market Market Y-o-Y Growth Rate Comparison by By Type (2016-2032)
- Table 97: APAC Greenhouse Market Market Y-o-Y Growth Rate Comparison by By Offering (2016-2032)
- Table 98: APAC Greenhouse Market Market Y-o-Y Growth Rate Comparison by By Crop Type (2016-2032)
- Table 99: APAC Greenhouse Market Market Y-o-Y Growth Rate Comparison by By End-user (2016-2032)
- Table 100: APAC Greenhouse Market Market Share Comparison by Country (2016-2032)
- Table 101: APAC Greenhouse Market Market Share Comparison by By Type (2016-2032)
- Table 102: APAC Greenhouse Market Market Share Comparison by By Offering (2016-2032)
- Table 103: APAC Greenhouse Market Market Share Comparison by By Crop Type (2016-2032)
- Table 104: APAC Greenhouse Market Market Share Comparison by By End-user (2016-2032)
- Table 105: Latin America Greenhouse Market Market Comparison by By Type (2016-2032)
- Table 106: Latin America Greenhouse Market Market Comparison by By Offering (2016-2032)
- Table 107: Latin America Greenhouse Market Market Comparison by By Crop Type (2016-2032)
- Table 108: Latin America Greenhouse Market Market Comparison by By End-user (2016-2032)
- Table 109: Latin America Greenhouse Market Revenue (US$ Mn) Comparison by Country (2016-2032)
- Table 110: Latin America Greenhouse Market Market Revenue (US$ Mn) (2016-2032)
- Table 111: Latin America Greenhouse Market Market Revenue (US$ Mn) Comparison by Country (2016-2032)
- Table 112: Latin America Greenhouse Market Market Revenue (US$ Mn) Comparison by By Type (2016-2032)
- Table 113: Latin America Greenhouse Market Market Revenue (US$ Mn) Comparison by By Offering (2016-2032)
- Table 114: Latin America Greenhouse Market Market Revenue (US$ Mn) Comparison by By Crop Type (2016-2032)
- Table 115: Latin America Greenhouse Market Market Revenue (US$ Mn) Comparison by By End-user (2016-2032)
- Table 116: Latin America Greenhouse Market Market Y-o-Y Growth Rate Comparison by Country (2016-2032)
- Table 117: Latin America Greenhouse Market Market Y-o-Y Growth Rate Comparison by By Type (2016-2032)
- Table 118: Latin America Greenhouse Market Market Y-o-Y Growth Rate Comparison by By Offering (2016-2032)
- Table 119: Latin America Greenhouse Market Market Y-o-Y Growth Rate Comparison by By Crop Type (2016-2032)
- Table 120: Latin America Greenhouse Market Market Y-o-Y Growth Rate Comparison by By End-user (2016-2032)
- Table 121: Latin America Greenhouse Market Market Share Comparison by Country (2016-2032)
- Table 122: Latin America Greenhouse Market Market Share Comparison by By Type (2016-2032)
- Table 123: Latin America Greenhouse Market Market Share Comparison by By Offering (2016-2032)
- Table 124: Latin America Greenhouse Market Market Share Comparison by By Crop Type (2016-2032)
- Table 125: Latin America Greenhouse Market Market Share Comparison by By End-user (2016-2032)
- Table 126: Middle East & Africa Greenhouse Market Market Comparison by By Type (2016-2032)
- Table 127: Middle East & Africa Greenhouse Market Market Comparison by By Offering (2016-2032)
- Table 128: Middle East & Africa Greenhouse Market Market Comparison by By Crop Type (2016-2032)
- Table 129: Middle East & Africa Greenhouse Market Market Comparison by By End-user (2016-2032)
- Table 130: Middle East & Africa Greenhouse Market Revenue (US$ Mn) Comparison by Country (2016-2032)
- Table 131: Middle East & Africa Greenhouse Market Market Revenue (US$ Mn) (2016-2032)
- Table 132: Middle East & Africa Greenhouse Market Market Revenue (US$ Mn) Comparison by Country (2016-2032)
- Table 133: Middle East & Africa Greenhouse Market Market Revenue (US$ Mn) Comparison by By Type (2016-2032)
- Table 134: Middle East & Africa Greenhouse Market Market Revenue (US$ Mn) Comparison by By Offering (2016-2032)
- Table 135: Middle East & Africa Greenhouse Market Market Revenue (US$ Mn) Comparison by By Crop Type (2016-2032)
- Table 136: Middle East & Africa Greenhouse Market Market Revenue (US$ Mn) Comparison by By End-user (2016-2032)
- Table 137: Middle East & Africa Greenhouse Market Market Y-o-Y Growth Rate Comparison by Country (2016-2032)
- Table 138: Middle East & Africa Greenhouse Market Market Y-o-Y Growth Rate Comparison by By Type (2016-2032)
- Table 139: Middle East & Africa Greenhouse Market Market Y-o-Y Growth Rate Comparison by By Offering (2016-2032)
- Table 140: Middle East & Africa Greenhouse Market Market Y-o-Y Growth Rate Comparison by By Crop Type (2016-2032)
- Table 141: Middle East & Africa Greenhouse Market Market Y-o-Y Growth Rate Comparison by By End-user (2016-2032)
- Table 142: Middle East & Africa Greenhouse Market Market Share Comparison by Country (2016-2032)
- Table 143: Middle East & Africa Greenhouse Market Market Share Comparison by By Type (2016-2032)
- Table 144: Middle East & Africa Greenhouse Market Market Share Comparison by By Offering (2016-2032)
- Table 145: Middle East & Africa Greenhouse Market Market Share Comparison by By Crop Type (2016-2032)
- Table 146: Middle East & Africa Greenhouse Market Market Share Comparison by By End-user (2016-2032)
- 1. Executive Summary
-
- BrightFarms
- AeroFarms
- Backyard Farms
- Bowery Farming
- Gotham Greens
- Jacobs Farm Del Cabo
- Little Leaf Farms
- Oasis Biotech
- Luiten Greenhouses BV
- Prospiant Inc
- Richel Group SAS
- Saveer Biotech Ltd.
- Stuppy Greenhouse
- Signify NV
- PLASTIKA KRITIS SA
Our Clients


View Our Licence Options
